Evaluating the Michigan Education Trust (MET) - · PDF fileEvaluating the Michigan Education...
9
Evaluating the Michigan Education Trust (MET) By: Rick Aguilar, CFA, MBA, AIF ® Financial Adviser/Wealth Manager, AMDG Financial Executive Summary: ! Parents want to maximize the value of their educational dollars but don’t fully understand how to think about or evaluate the Michigan Education Trust (MET). ! We can compare the MET to alternative strategies by developing a return-on- investment, or “hurdle” rate. We use these hurdle rates to help compare the MET to the Michigan Education Saving Program (MESP), and to maintaining education dollars in a taxable account. ! The MET requires a contract which reduces flexibility, limits potential upside returns, and could lock in a return that is less than historical Consumer Price Index (CPI) inflation (3%). ! The return on investment of even the best-case scenario (attending the University of Michigan) was 5.91%, which was not compelling compared to historical returns of various portfolios. ! We identify the tax impact associated with state tax deductibility to be around .35%. Further, we develop required rates of return to help compare funding a MET against maintaining the flexibility of a taxable account. ! Even after considering tax implications, we find that the MET is not always a compelling investment. From financial wisdom, better stewardship. SM
Transcript of Evaluating the Michigan Education Trust (MET) - · PDF fileEvaluating the Michigan Education...

Evaluating the Michigan Education Trust (MET) By: Rick Aguilar, CFA, MBA, AIF® Financial Adviser/Wealth Manager, AMDG Financial Executive Summary:
! Parents want to maximize the value of their educational dollars but don’t fully understand how to think about or evaluate the Michigan Education Trust (MET).
! We can compare the MET to alternative strategies by developing a return-on-investment, or “hurdle” rate. We use these hurdle rates to help compare the MET to the Michigan Education Saving Program (MESP), and to maintaining education dollars in a taxable account.
! The MET requires a contract which reduces flexibility, limits potential upside returns, and could lock in a return that is less than historical Consumer Price Index (CPI) inflation (3%).
! The return on investment of even the best-case scenario (attending the University of Michigan) was 5.91%, which was not compelling compared to historical returns of various portfolios.
! We identify the tax impact associated with state tax deductibility to be around .35%. Further, we develop required rates of return to help compare funding a MET against maintaining the flexibility of a taxable account.
! Even after considering tax implications, we find that the MET is not always a compelling investment.
From financial wisdom, better stewardship.SM

Copyright © 2015 AMDG Financial. All Rights Reserved. This information is provided for educational purposes only and should not be considered investment advice or a solicitation to buy or sell securities.
2
Doing What’s Best For Our Children For many parents, assessing a child’s college savings options can be both tedious and time consuming, perhaps with little reward in the short-term. However, we know we need to ensure the best for our children. This means maximizing the value of our educational savings dollars. Michigan has two primary savings plans, both qualified under Section 529 by the Internal Revenue Service (IRS). The Michigan Education Savings Program (MESP) tends to be the one that most residents understand. Put simply, the MESP provides an investment account in which one can pick from nine different investment options. The family ultimately bears the risk depending on the market return. The Michigan Education Trust (MET) tends to be the option most people don’t understand. In fact, Michigan residents I talked to compared it to a “black box.” When asked how the MET works, one person put it this way: “Well, you pay today and get all of your college paid for when your kids go to school.” As a father of four children myself, I decided to take on the task of demystifying the MET to determine if it is truly the best option for parents saving for their kids’ college. I have to sign a contract? While it’s easy to sign up for the MET, parents need to be aware that they’re signing a contract. And, given the complexities involved, parents should take steps to protect their interests. At this point, I will assume that you have a basic understanding of the MET options available, including the three different types of contracts (Full Benefits, Limited Benefits, and Community College). For purposes of discussion, this paper focuses on the Full Benefits contract and the Lump Sum payment option. (Financing options also exist for four, seven, 10, and 15 years.) So, let’s say I head to one of the seven MET “Contract Acceptance Locations” with pen and checkbook in hand. I tell them the options I want, a little bit about myself and my child (the beneficiary), and the MET folks show me the pricing chart. (Pricing, and therefore contract signing, is generally available from December through September.) I decide to purchase two semesters (one year) of the Full Benefits contract in a lump sum payment for $17,128. I write the check, sign the contract, and walk out the door feeling good about what I just did for my child. What did I sign, anyway? The first thing to note is that the contract only covers future “tuition and mandatory fees.” This is, of course, important, but don’t underestimate the cost of everything else -- including room and board and other expenses. For example, at the University of Michigan (U of M), room and board amounts to about $9,000 per year on top of the approximately $15,000 in tuition and fees (according the MESP website calculator).
Copyright © 2015 AMDG Financial. All Rights Reserved. This information is provided for educational purposes only and should not be considered investment advice or a solicitation to buy or sell securities.
3
By writing a check, I paid today for a benefit sometime in the future. My child is five years old, so in about 13 years, I should receive my value from my $17,128 investment. My child (like everyone’s else’s!) is, of course, exceedingly bright, so I assume he or she will certainly go to U of M! If U of M’s tuition and mandatory fees shoot up to $80,000 and my child actually ends up going there (we will touch on this later), I made a pretty good investment. If, on the other hand, tuition and fees drop to $10,000 in the future, I just made a very poor purchase. Tuition is like real estate, right? Ask anyone who owned a house in the early 2000s if they thought the value of their house would ever drop. Of course not! How about their stock portfolio in 1999? I’m not necessarily saying that tuition is going to pop like the housing or tech bubbles, but maybe we should put things in perspective. Yes, tuition prices have been increasing at a high rate recently, but this is not necessarily a good predictor of the future. General inflation as measured by the Consumer Price Index (CPI) has averaged about 3% per year since 19261. The MET contract indicates that the 1988-1989 tuition and mandatory fees were about $3,200 compared to the 2014-2015 tuition of about $15,000. Over 27 years this would imply a compound annual growth rate (CAGR) of about 6.1% per year. As it is with the stock market, it is impossible to predict what the growth rate will be, but this is a critical assumption in determining the return on investment. The MET projects annual tuition cost increases of 7.01% according to its charts, so this is what I used in my calculations. What return am I getting on my investment? Let’s take stock of what we know so far. I know the amount of the check I wrote, and I know how much current tuition and fees cost at U of M. I also know the MET is using a 7.01% assumption for education inflation, so I’ll use that to project the future cost, or the value, that I’m getting for my initial cash outlay. Based on the numbers, it should cost about $36,000 for tuition and fees in 13 years. If things go according to plan, I should expect a return on investment of 5.91%. We will refer to this as the “hurdle” rate. If I could invest in something that returned more than 5.91% per year, then I should do that. If no alternative exists that will earn more than 5.91%, then the contract is the right decision. I feel good about the 5.91% and watch as tuition and fees steadily climb as the years go by, to around $36,000. “Dad/Mom, I’m not sure…” Now, let’s fast-forward to the future. It’s about 12 and a half years later, and my child is thinking about alternatives to U of M. I search frantically for the contract that I haven’t looked at in 12 years so I can understand my original commitment and begin to consider the risks. In addition to enabling me to choose an eligible lower-cost school, the contract lists several “Termination Refund Provisions” if my son/daughter decides not to attend a Michigan four-year university, or if some extenuating circumstances occur. Since U of M
1 Data provided by Ibbotson Associates.
Copyright © 2015 AMDG Financial. All Rights Reserved. This information is provided for educational purposes only and should not be considered investment advice or a solicitation to buy or sell securities.
4
is the second-highest tuition cost of available schools based on 2014-2015 tuition, my return on investment will decrease if my child goes to a lower-cost school. That’s because I will be getting less value, or a dollar amount lower than what I had initially planned on if the school my child chooses costs only $28,000 (versus $36,000 at U of M). A “Termination Refund” provides:
• Weighted average tuition of Michigan public four-year schools if a child: o Attends private college or university o Attends an out-of-state institution o Receives a full tuition scholarship
• Lowest tuition of Michigan public four-year schools if: o Beneficiary dies or is learning disabled o Child does not plan to attend college o Child attends a Michigan public community college o “Any other reason”
So, my return on investment has risks and will, in large part, depend on choices and unforeseen events in the future. Making some additional assumptions around the average and lowest tuitions in the future, I calculate returns for the following three scenarios:
• U of M: 5.91% (as we previously calculated) • Average tuition: 4.09% • Lowest tuition: 2.48%
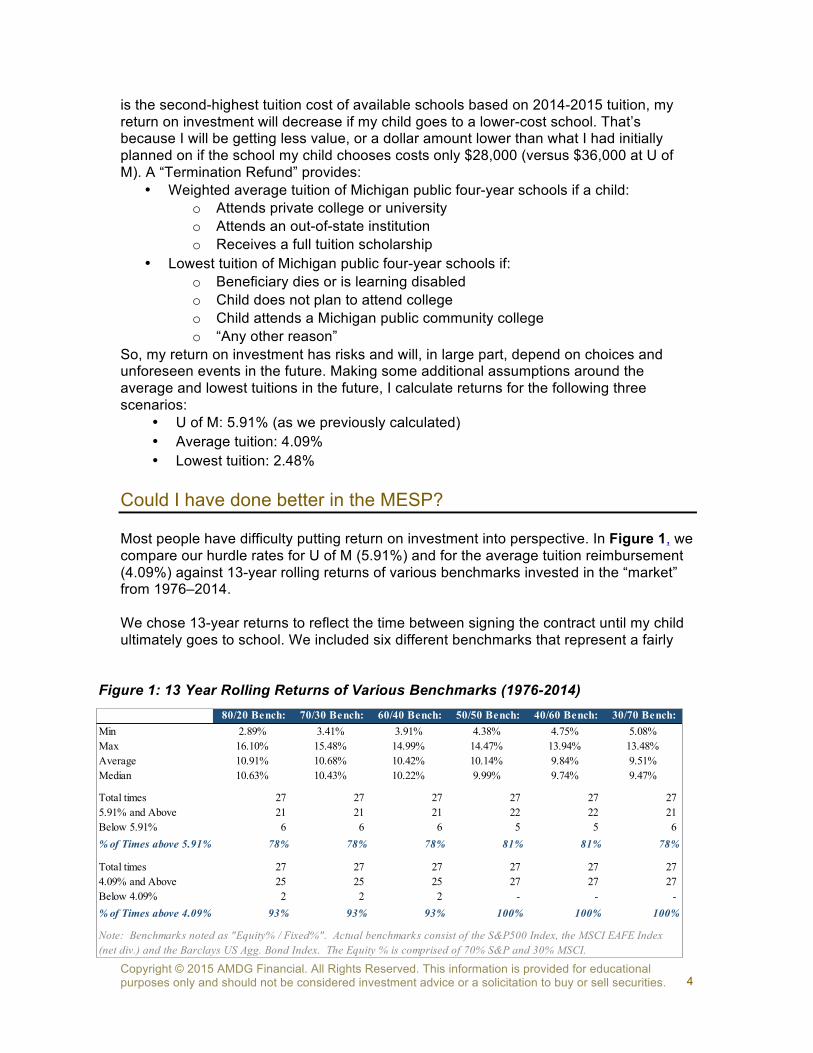
Could I have done better in the MESP? Most people have difficulty putting return on investment into perspective. In Figure 1, we compare our hurdle rates for U of M (5.91%) and for the average tuition reimbursement (4.09%) against 13-year rolling returns of various benchmarks invested in the “market” from 1976–2014. We chose 13-year returns to reflect the time between signing the contract until my child ultimately goes to school. We included six different benchmarks that represent a fairly
80/20 Bench: 70/30 Bench: 60/40 Bench: 50/50 Bench: 40/60 Bench: 30/70 Bench: Min 2.89% 3.41% 3.91% 4.38% 4.75% 5.08%Max 16.10% 15.48% 14.99% 14.47% 13.94% 13.48%Average 10.91% 10.68% 10.42% 10.14% 9.84% 9.51%Median 10.63% 10.43% 10.22% 9.99% 9.74% 9.47%
Total times 27 27 27 27 27 27 5.91% and Above 21 21 21 22 22 21 Below 5.91% 6 6 6 5 5 6 % of Times above 5.91% 78% 78% 78% 81% 81% 78%
Total times 27 27 27 27 27 27 4.09% and Above 25 25 25 27 27 27 Below 4.09% 2 2 2 - - - % of Times above 4.09% 93% 93% 93% 100% 100% 100%
Note: Benchmarks noted as "Equity% / Fixed%". Actual benchmarks consist of the S&P500 Index, the MSCI EAFE Index (net div.) and the Barclays US Agg. Bond Index. The Equity % is comprised of 70% S&P and 30% MSCI.
Figure 1: 13 Year Rolling Returns of Various Benchmarks (1976-2014)
Copyright © 2015 AMDG Financial. All Rights Reserved. This information is provided for educational purposes only and should not be considered investment advice or a solicitation to buy or sell securities.
5
diversified portfolio, ranging from moderately aggressive (80/20) to very conservative (30/70). If we consider a middle-of-the-road benchmark consisting of 50% equity and 50% bonds, we can see that the average return over the 27 different 13-year time periods was 10.14% with a minimum return of 4.38% (year ended December 2012). There were only five times when the benchmark was lower than our 5.91% hurdle rate, which was exceeded 81% of the time. Our most conservative portfolio (30/70) beat the average tuition hurdle rate of 4.09% in every period. Although the market returns illustrated here do not include fees, this broadly diversified portfolio could be implemented inexpensively with only a minor impact on results. How do I think about my options with this information? Without doing a full comparison to the MESP, we can highlight some key points. For the most part, the tax treatment of the MESP and MET is similar. Both offer Michigan State income tax deductions for contributions, and earnings are tax-exempt for qualified withdrawals. The MET does offer an advantage regarding increased annual state income tax deductibility. Up to $10,000 per year is deductible under the MESP, while the full purchased contract amount is deductible for the MET. This could be advantageous in situations when an account owner wishes to purchase more than one semester in lump sum, exceeding $10,000. A significant benefit of the MESP is that it offers a greater variety in paid-for items. A person could save up to $235,000 per child and use the money to pay for room and board, books, and other “qualified higher education expenses.” With the MESP, the account owner maintains control of all withdrawals and makes all investment decisions regardless of the age of the beneficiary. Although both plans provide a level of transferability (typically to siblings), the MET requires the beneficiary’s signature to do this. If a child decides not to sign over transferability when he or she reaches the age of 19, the account owner essentially loses control of the investment. In the context of returns, the historical data suggests it is not too difficult to beat the hurdle rate of our best outcome (U of M at 5.91%). At this point, it becomes a matter of personal risk tolerance. With the MET, we are locking in the future cost of tuition and fees, but we are also locking ourselves into a contract that takes away flexibility and precludes benefit from any upside associated with the market. According to Figure 1, the average return of a 50/50 portfolio was 10.14%. “For it is in giving that we receive.” – St. Francis of Assisi Until now, we have been comparing the MET with its tax twin, the MESP (not identical but certainly fraternal). Both of these require the owner to give up some level of control. What we receive, however, are some nice tax benefits. The ensuing sections attempt to address the choice between maintaining the ultimate flexibility of keeping those education dollars in a taxable account and investing in the MET. Generally we can separate the tax benefits into two buckets. First, there is the tax-deductibility associated with the State of Michigan, which at present, has an income tax rate of 4.25%. Then, there are the state and federal tax on earnings.

Copyright © 2015 AMDG Financial. All Rights Reserved. This information is provided for educational purposes only and should not be considered investment advice or a solicitation to buy or sell securities.
6
The impact of the initial state deductibility is relatively straightforward. In Figure 2, I compare the hurdle rates that we addressed for our three scenarios against putting education funds in a taxable account that does not receive the state tax deduction. One would need to earn a higher rate of return to make up for the taxes paid to the state of Michigan. The impact of this tax cost is about .35% for each of our three scenarios. Figure 2: Impact of State Deductibility
Determining the impact of taxes related to earnings is a much more complex analysis. It depends on several factors including, but not limited to:
• Your tax bracket; • The allocation; • Percentage of return related to capital gains versus ordinary income; • Short term vs. long term capital gains; and • When capital gains are realized.
To provide an understandable analysis, let’s again make some assumptions. Let’s assume, for the following analysis, that I am in the 25% federal tax bracket and that Michigan income taxes added an additional 4.25%. Further, let’s assume that equity returns were all capital gains and that fixed income returns were taxed at my ordinary income rate. Although capital gains do not all occur annually, we’ll assume this to be the case. This assumption increases tax cost compared to situations in which capital gains accumulate, earning interest on interest, before being taxed. Figure 3 illustrates the required rate of return for each of our three potential scenarios, taking into consideration the Michigan deductibility and both the federal and state tax on earnings. We show this hurdle rate for several allocations of equity versus fixed income. Figure 3: Hurdle Rates for Various Investment Allocations
State No StateTuition & Fees Deduction Deduction DifferenceU of M Ann Arbor 5.91% 6.26% 0.35%Average 4.09% 4.43% 0.35%Lowest 2.13% 2.48% 0.34%
UofM Average Low8.85% 6.26% 4.43% 2.48%0% 8.85% 6.27% 3.50%10% 8.73% 6.18% 3.45%20% 8.61% 6.09% 3.40%30% 8.49% 6.01% 3.36%40% 8.38% 5.93% 3.31%50% 8.27% 5.85% 3.27%60% 8.16% 5.78% 3.22%70% 8.05% 5.70% 3.18%80% 7.95% 5.63% 3.14%90% 7.85% 5.56% 3.10%100% 7.76% 5.49% 3.07%
1-Year Tuition Contract
Equ
ity P
erce
ntag
e

Copyright © 2015 AMDG Financial. All Rights Reserved. This information is provided for educational purposes only and should not be considered investment advice or a solicitation to buy or sell securities.
7
As you can see, the more equity in the portfolio relative to the fixed income, the lower the required rate of return. This is because of the impact of the lower tax associated with capital gains. As I decrease the equity percentage, which increases the fixed income percentage, I am paying more ordinary income tax, which increases the required rate of return of the taxable account. As an example, highlighted in Figure 3, if I left my money in a taxable account that invested 60% of its assets in equities and 40% in fixed income, and you received the average tuition, I would have to earn more than 5.78% to be better off than investing in the MET. This hurdle rate rises to 8.16% if my child actually gets into and decides to go to U of M. Figure 4 provides a summary of where we started in our tax-free environment, the impact associated with the tax deductibility in Michigan, and finally, the total return required for a taxable account invested in a 60/40 portfolio. Figure 4: Summary of Hurdle Rates
So how does the taxable option stack up?
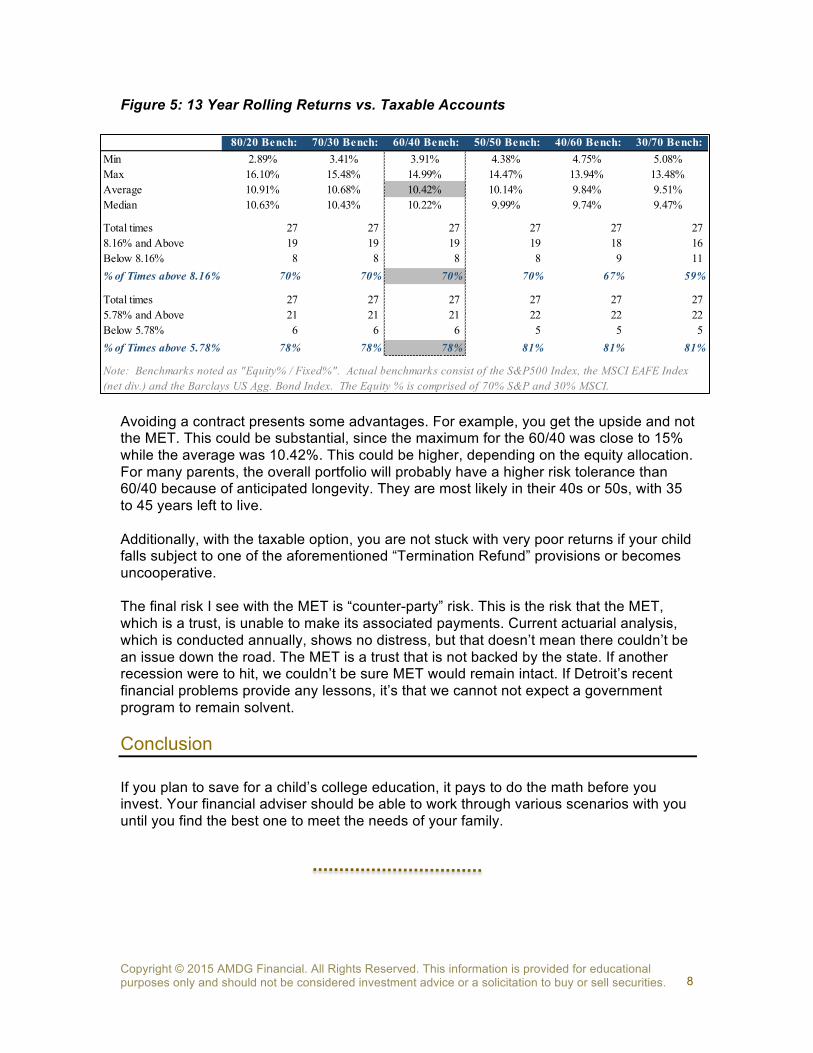
To assess these hurdle rates, we turn to the historical data. Taking the 60/40 portfolio rates from Figure 3 and Figure 4, we again compare multiple 13-year market returns against the hurdle rates associated with the U of M and average outcomes. The hurdle rates according to Figure 4 are 8.16% if a child goes to U of M and 5.78% if we receive the average tuition. Although the hurdle rates increase significantly with the impact of taxes, the 60/40 benchmark data indicates that 70% of the time, the rolling 13-year returns were higher than 8.16%. In almost 80% of the periods, the 60/40 benchmark beat the average outcome hurdle rate of 5.78%. Note also that the average return of the 27 periods for the 60/40 portfolio was 10.42%. The taxable option stacks up pretty well. Should I leave my money in a taxable account, then? It may be frustrating to hear it, but the answer is, it depends. If I were a gambling man and someone told me the odds were 70% in my favor, I would play that game all day. This, game however, is not played multiple times. It is played once, or maybe twice depending on the number of children you plan to send to college. The 70% is also based on historical data, which although it covers almost all of the last four decades, does not necessarily represent what is going to happen in the next 13 years (see Figure 5).
Tuition & FeesState
DeductionNo State
Deduction 60/40 Total Tax Impact
U of M Ann Arbor 5.91% 6.26% 8.16%Average 4.09% 4.43% 5.78%Lowest 2.13% 2.48% 3.22%
Copyright © 2015 AMDG Financial. All Rights Reserved. This information is provided for educational purposes only and should not be considered investment advice or a solicitation to buy or sell securities.
8
Figure 5: 13 Year Rolling Returns vs. Taxable Accounts
Avoiding a contract presents some advantages. For example, you get the upside and not the MET. This could be substantial, since the maximum for the 60/40 was close to 15% while the average was 10.42%. This could be higher, depending on the equity allocation. For many parents, the overall portfolio will probably have a higher risk tolerance than 60/40 because of anticipated longevity. They are most likely in their 40s or 50s, with 35 to 45 years left to live. Additionally, with the taxable option, you are not stuck with very poor returns if your child falls subject to one of the aforementioned “Termination Refund” provisions or becomes uncooperative. The final risk I see with the MET is “counter-party” risk. This is the risk that the MET, which is a trust, is unable to make its associated payments. Current actuarial analysis, which is conducted annually, shows no distress, but that doesn’t mean there couldn’t be an issue down the road. The MET is a trust that is not backed by the state. If another recession were to hit, we couldn’t be sure MET would remain intact. If Detroit’s recent financial problems provide any lessons, it’s that we cannot not expect a government program to remain solvent. Conclusion If you plan to save for a child’s college education, it pays to do the math before you invest. Your financial adviser should be able to work through various scenarios with you until you find the best one to meet the needs of your family.
80/20 Bench: 70/30 Bench: 60/40 Bench: 50/50 Bench: 40/60 Bench: 30/70 Bench: Min 2.89% 3.41% 3.91% 4.38% 4.75% 5.08%Max 16.10% 15.48% 14.99% 14.47% 13.94% 13.48%Average 10.91% 10.68% 10.42% 10.14% 9.84% 9.51%Median 10.63% 10.43% 10.22% 9.99% 9.74% 9.47%
Total times 27 27 27 27 27 27 8.16% and Above 19 19 19 19 18 16 Below 8.16% 8 8 8 8 9 11 % of Times above 8.16% 70% 70% 70% 70% 67% 59%
Total times 27 27 27 27 27 27 5.78% and Above 21 21 21 22 22 22 Below 5.78% 6 6 6 5 5 5 % of Times above 5.78% 78% 78% 78% 81% 81% 81%
Note: Benchmarks noted as "Equity% / Fixed%". Actual benchmarks consist of the S&P500 Index, the MSCI EAFE Index (net div.) and the Barclays US Agg. Bond Index. The Equity % is comprised of 70% S&P and 30% MSCI.
Copyright © 2015 AMDG Financial. All Rights Reserved. This information is provided for educational purposes only and should not be considered investment advice or a solicitation to buy or sell securities.
9
About the Author Enrique “Rick” Aguilar, CFA, MBA, AIF® Financial Adviser/Wealth Manager AMDG Financial When Rick Aguilar decided to leave the corporate world to join AMDG Financial, it was an easy choice. “I have always wanted to work with and help people in meeting their life and financial goals, particularly in retirement,” he said. Aguilar held management positions at Lear Corporation and Ford Motor Company, and served as a health care investment banking associate at Wachovia Securities, before bringing his extensive experience in capital market activities to AMDG Financial. A Chartered Financial Analyst, Aguilar also holds the Accredited Investment Fiduciary®, or AIF® credential, which recognizes an adviser’s thorough knowledge of the fiduciary standard of care. “Because AMDG Financial is a registered fiduciary with the Centre for Fiduciary Excellence, the AIF credential helps me support the high standards necessary to best serve our clients,” said Aguilar. Aguilar holds degrees from the United States Military Academy at West Point, New York, and Duke University in Durham, North Carolina. A former captain in the U.S. Army, he was a decorated officer and graduate from Ranger school, one of the most challenging military leadership programs. Aguilar lives in Canton, Michigan, with his wife and four children, where, in his spare time, he enjoys brewing beer, and playing soccer and lacrosse.