
Evaluating the Effectiveness of TV Advertising in the ... · found that TV advertising and video...
24
Evaluating the Effectiveness of TV Advertising in the Modern Media Landscape www.home.neustar
Transcript of Evaluating the Effectiveness of TV Advertising in the ... · found that TV advertising and video...

Evaluating the Effectiveness of TV Advertising in the Modern Media Landscape
www.home.neustar
Background 03
Executive Summary 04
Key Findings 06 01: TV has the highest relative efficiency in achieving KPIs at similar spending levels 02: High-frequency consumer interactions are important data sources to guide the TV mix 03: Online video ads attached to premium streaming video platforms are more effective 04: TV advertising has a cross-product halo effect
Conclusions 16
Appendix 18
About Neustar 24
Table ofContents
02
Marketing Solutions White Paper
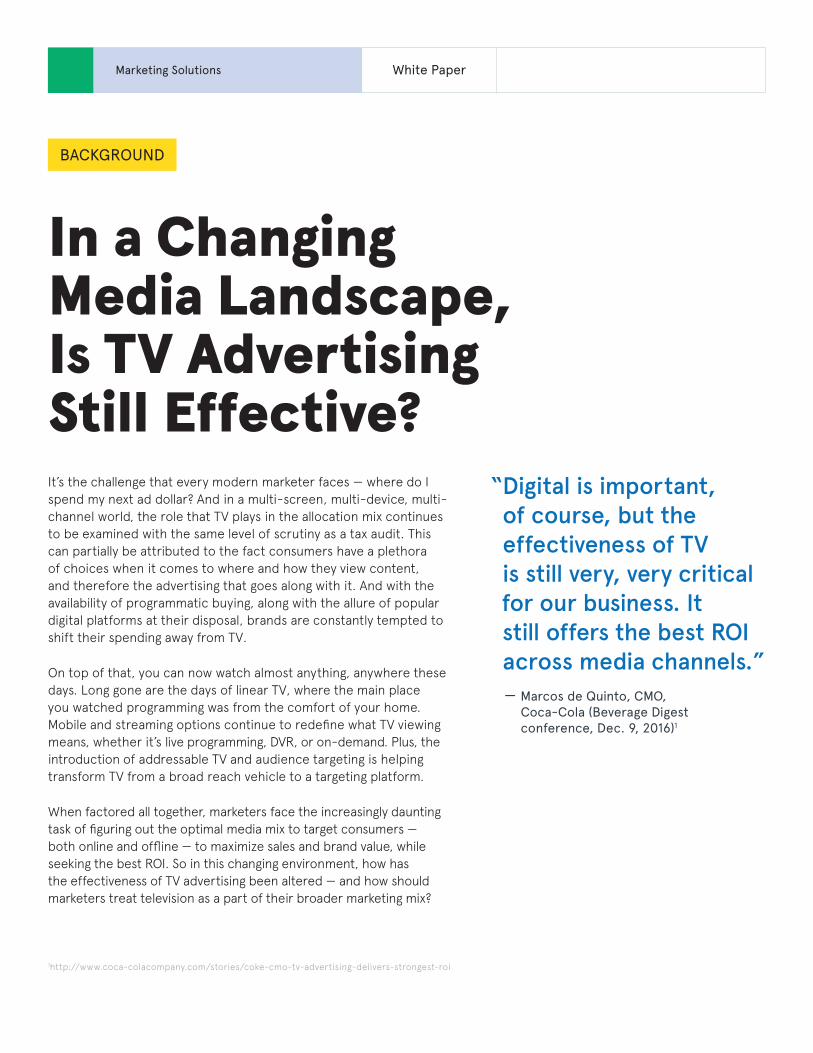
In a Changing Media Landscape, Is TV Advertising Still Effective?It’s the challenge that every modern marketer faces — where do I spend my next ad dollar? And in a multi-screen, multi-device, multi-channel world, the role that TV plays in the allocation mix continues to be examined with the same level of scrutiny as a tax audit. This can partially be attributed to the fact consumers have a plethora of choices when it comes to where and how they view content, and therefore the advertising that goes along with it. And with the availability of programmatic buying, along with the allure of popular digital platforms at their disposal, brands are constantly tempted to shift their spending away from TV.
On top of that, you can now watch almost anything, anywhere these days. Long gone are the days of linear TV, where the main place you watched programming was from the comfort of your home. Mobile and streaming options continue to redefine what TV viewing means, whether it’s live programming, DVR, or on-demand. Plus, the introduction of addressable TV and audience targeting is helping transform TV from a broad reach vehicle to a targeting platform.
When factored all together, marketers face the increasingly daunting task of figuring out the optimal media mix to target consumers — both online and offline — to maximize sales and brand value, while seeking the best ROI. So in this changing environment, how has the effectiveness of TV advertising been altered — and how should marketers treat television as a part of their broader marketing mix?
“ Digital is important, of course, but the effectiveness of TV is still very, very critical for our business. It still offers the best ROI across media channels.” — Marcos de Quinto, CMO,
Coca-Cola (Beverage Digest conference, Dec. 9, 2016)1
BACKGROUND
1http://www.coca-colacompany.com/stories/coke-cmo-tv-advertising-delivers-strongest-roi
Marketing Solutions White Paper
In 2015, Turner and Horizon Media reached out to Neustar MarketShare — the global leader in advanced marketing analytics — to gauge the effectiveness of TV advertising in terms of reach, lift, ROI, and efficiency when compared to a variety of other media channels. We have updated the analysis for 2017 based on more recent findings that examined additional industries.
Neustar MarketShare evaluated data from thousands of marketing mix models across a variety of industries including Financial Services, Movies, Quick Service Restaurants, Consumer Electronics, Automotive, Telecommunications, Hospitality, Consumer Packaged Goods, and Retail. The analysis was derived from proprietary data generated from hundreds of studies that examined actual marketing spend, business outcomes (not panel data), and informed “real-world” experiences from each sector.
From this industry analysis, TV advertising consistently outperformed other options over the seven-year period examined from 2010-2016 with up to 7 times the relative lift over paid search, and 5 times better than display advertising. Dollar for dollar, TV provides the most scale and delivers the highest return on ad spend from both a sales and awareness perspective. It’s important to note that even TV will reach a saturation point, and the next marketing dollar should be spent elsewhere. To ensure an optimized marketing mix, advertisers should adopt a data-driven approach that can inform the ideal media allocation across all channels based on all internal and external market conditions to meet their performance goals.
Overall, our results show that despite dramatic advancements in technology, new digital platforms, and changes in consumer behavior, TV continues to be the best vehicle to deliver a brand’s message seen by a large audience.
EXECUTIVE SUMMARY
04
Marketing Solutions White Paper
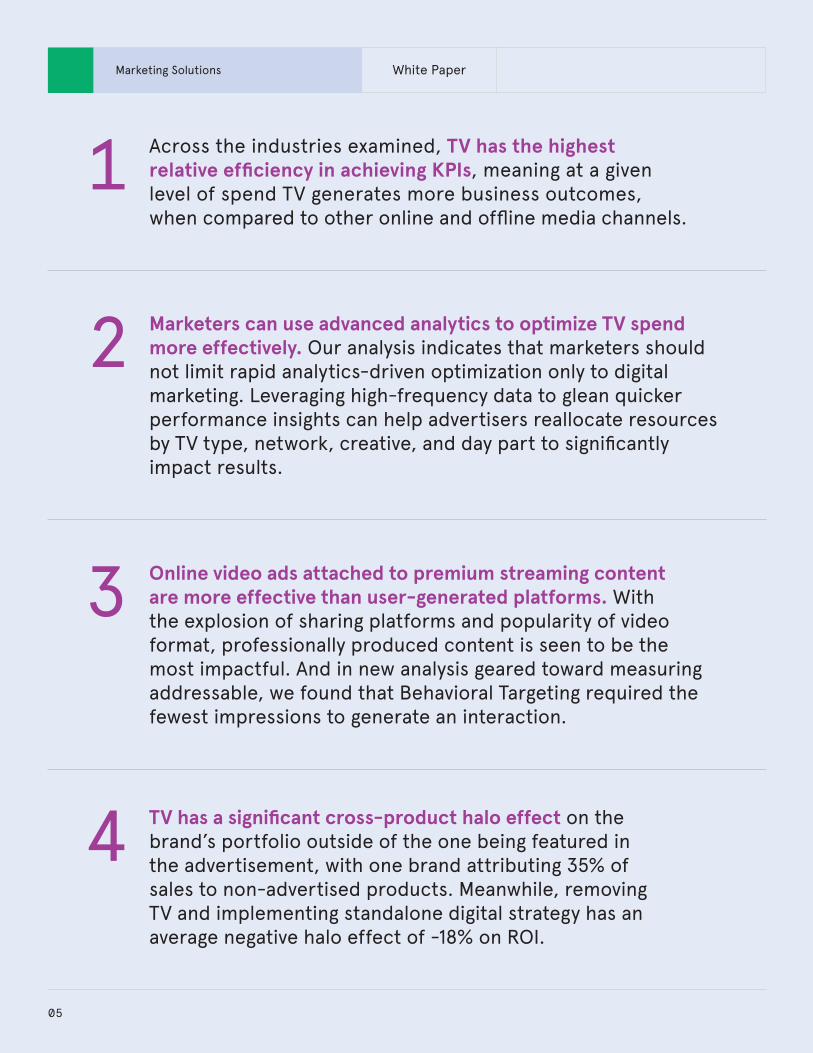
Across the industries examined, TV has the highest relative efficiency in achieving KPIs, meaning at a given level of spend TV generates more business outcomes, when compared to other online and offline media channels.
1
Marketers can use advanced analytics to optimize TV spend more effectively. Our analysis indicates that marketers should not limit rapid analytics-driven optimization only to digital marketing. Leveraging high-frequency data to glean quicker performance insights can help advertisers reallocate resources by TV type, network, creative, and day part to significantly impact results.
2
Online video ads attached to premium streaming content are more effective than user-generated platforms. With the explosion of sharing platforms and popularity of video format, professionally produced content is seen to be the most impactful. And in new analysis geared toward measuring addressable, we found that Behavioral Targeting required the fewest impressions to generate an interaction.
3
TV has a significant cross-product halo effect on the brand’s portfolio outside of the one being featured in the advertisement, with one brand attributing 35% of sales to non-advertised products. Meanwhile, removing TV and implementing standalone digital strategy has an average negative halo effect of -18% on ROI.
4
05
Marketing Solutions White Paper
TV is consistently more efficient at impacting KPIs, such as sales and new accounts, than paid search, print, or display advertising. What follows are detailed explanations addressing all four of the findings from the previous page. For more information on the applied methodology and technology, please see the Appendix.
KEY FINDINGS DETAIL
06
Marketing Solutions White Paper
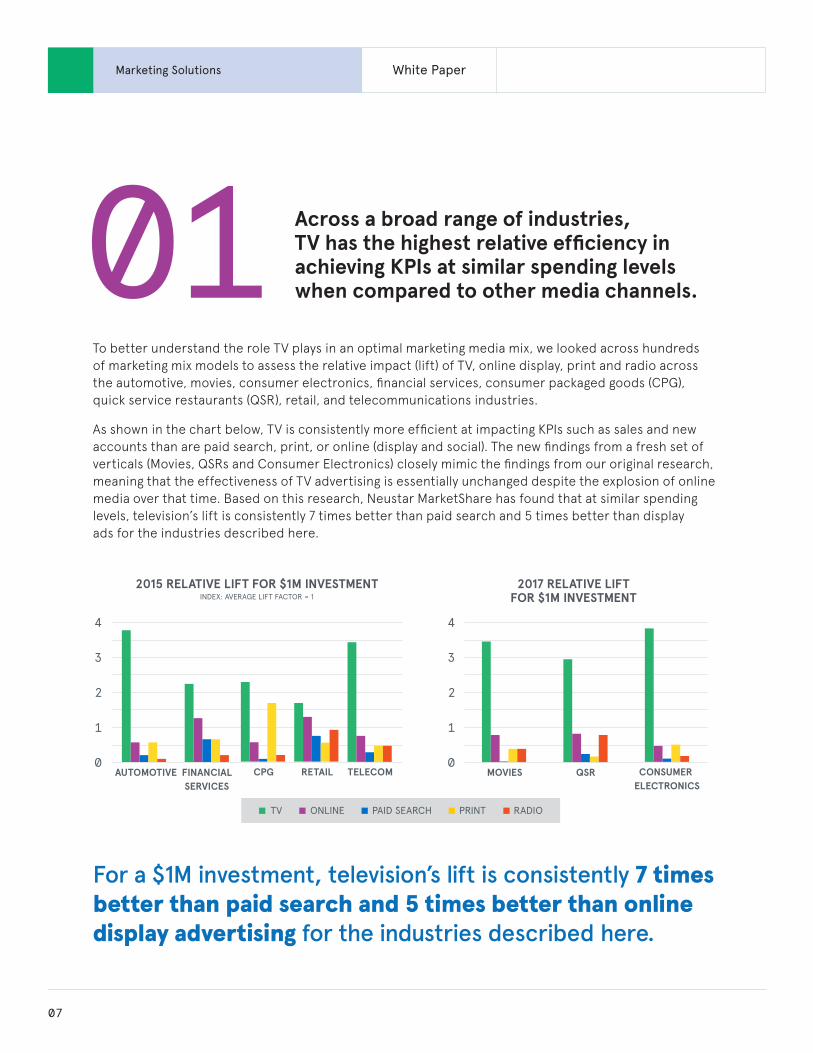
01To better understand the role TV plays in an optimal marketing media mix, we looked across hundreds of marketing mix models to assess the relative impact (lift) of TV, online display, print and radio across the automotive, movies, consumer electronics, financial services, consumer packaged goods (CPG), quick service restaurants (QSR), retail, and telecommunications industries.
As shown in the chart below, TV is consistently more efficient at impacting KPIs such as sales and new accounts than are paid search, print, or online (display and social). The new findings from a fresh set of verticals (Movies, QSRs and Consumer Electronics) closely mimic the findings from our original research, meaning that the effectiveness of TV advertising is essentially unchanged despite the explosion of online media over that time. Based on this research, Neustar MarketShare has found that at similar spending levels, television’s lift is consistently 7 times better than paid search and 5 times better than display ads for the industries described here.
1
2
3
4
AUTOMOTIVE FINANCIALSERVICES
CPG RETAIL TELECOM
2015 RELATIVE LIFT FOR $1M INVESTMENTINDEX: AVERAGE LIFT FACTOR = 1
0
1
2
3
4
MOVIES QSR CONSUMER ELECTRONICS
2017 RELATIVE LIFTFOR $1M INVESTMENT
TV ONLINE PAID SEARCH PRINT RADIO
0
Across a broad range of industries, TV has the highest relative efficiency in achieving KPIs at similar spending levels when compared to other media channels.
For a $1M investment, television’s lift is consistently 7 times better than paid search and 5 times better than online display advertising for the industries described here.
07
Marketing Solutions White Paper
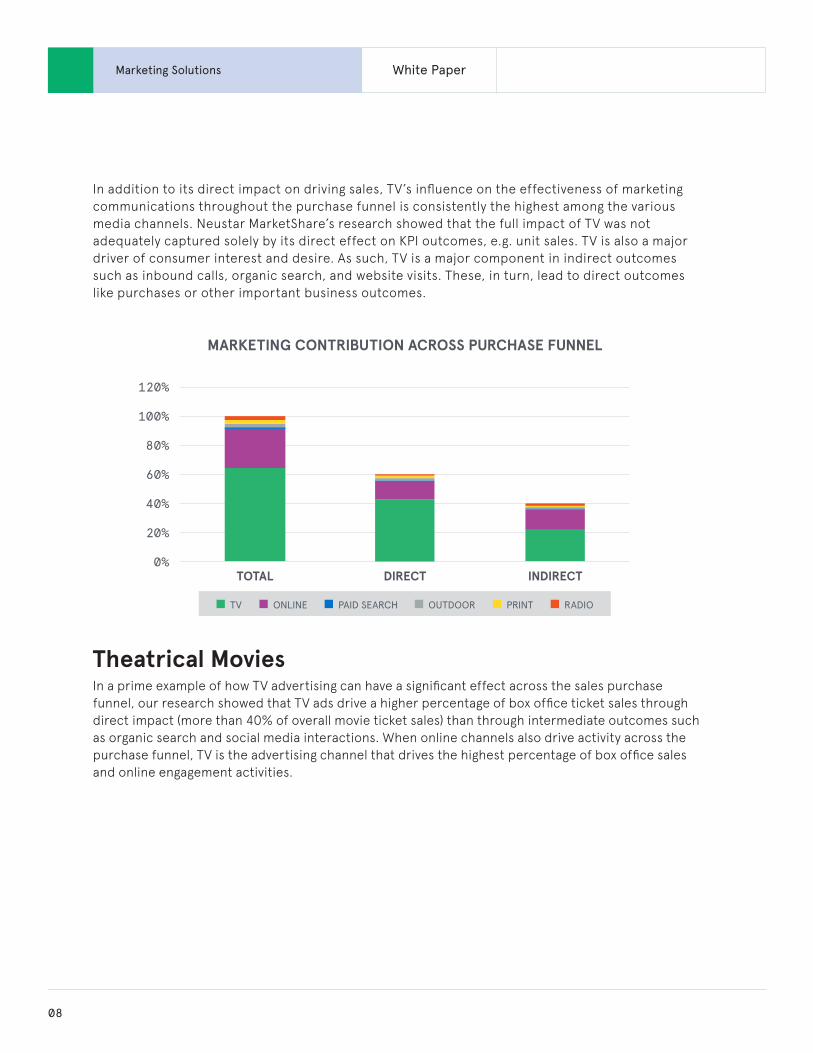
In addition to its direct impact on driving sales, TV’s influence on the effectiveness of marketing communications throughout the purchase funnel is consistently the highest among the various media channels. Neustar MarketShare’s research showed that the full impact of TV was not adequately captured solely by its direct effect on KPI outcomes, e.g. unit sales. TV is also a major driver of consumer interest and desire. As such, TV is a major component in indirect outcomes such as inbound calls, organic search, and website visits. These, in turn, lead to direct outcomes like purchases or other important business outcomes.
Theatrical MoviesIn a prime example of how TV advertising can have a significant effect across the sales purchase funnel, our research showed that TV ads drive a higher percentage of box office ticket sales through direct impact (more than 40% of overall movie ticket sales) than through intermediate outcomes such as organic search and social media interactions. When online channels also drive activity across the purchase funnel, TV is the advertising channel that drives the highest percentage of box office sales and online engagement activities.
0%
20%
40%
60%
80%
100%
120%
TOTAL DIRECT INDIRECT
MARKETING CONTRIBUTION ACROSS PURCHASE FUNNEL
TV ONLINE PAID SEARCH OUTDOOR PRINT RADIO
08
Marketing Solutions White Paper
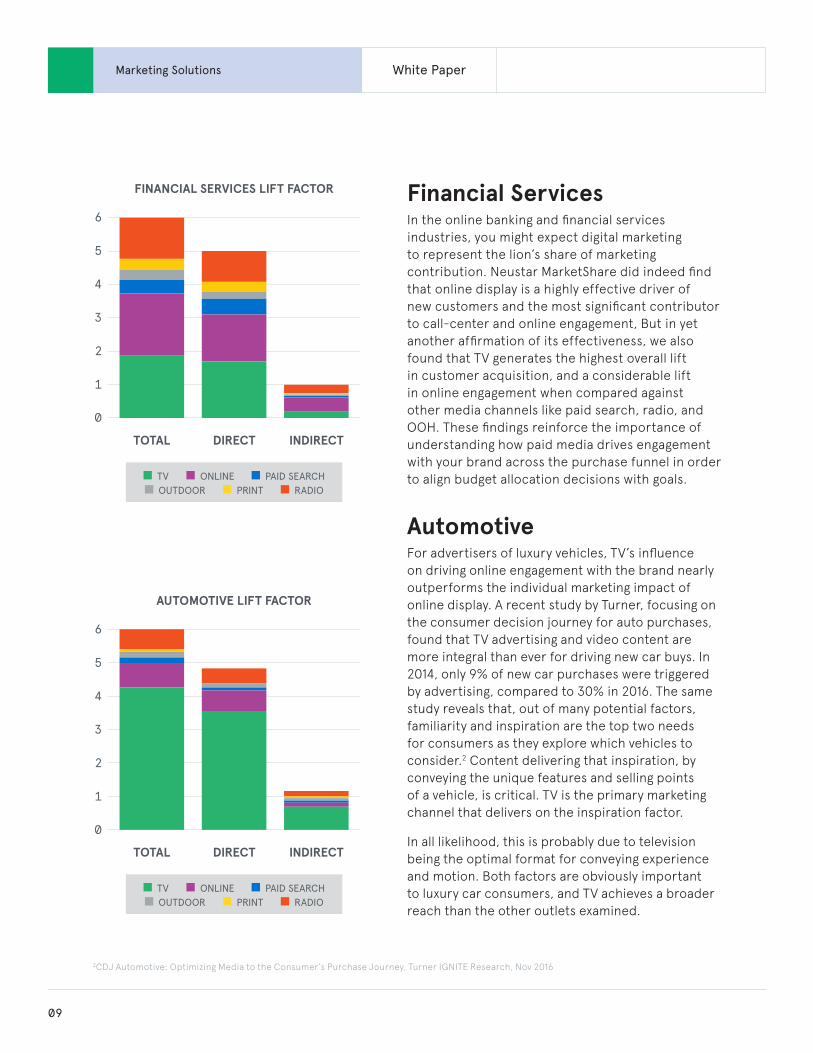
Financial Services In the online banking and financial services industries, you might expect digital marketing to represent the lion’s share of marketing contribution. Neustar MarketShare did indeed find that online display is a highly effective driver of new customers and the most significant contributor to call-center and online engagement, But in yet another affirmation of its effectiveness, we also found that TV generates the highest overall lift in customer acquisition, and a considerable lift in online engagement when compared against other media channels like paid search, radio, and OOH. These findings reinforce the importance of understanding how paid media drives engagement with your brand across the purchase funnel in order to align budget allocation decisions with goals.
Automotive For advertisers of luxury vehicles, TV’s influence on driving online engagement with the brand nearly outperforms the individual marketing impact of online display. A recent study by Turner, focusing on the consumer decision journey for auto purchases, found that TV advertising and video content are more integral than ever for driving new car buys. In 2014, only 9% of new car purchases were triggered by advertising, compared to 30% in 2016. The same study reveals that, out of many potential factors, familiarity and inspiration are the top two needs for consumers as they explore which vehicles to consider.2 Content delivering that inspiration, by conveying the unique features and selling points of a vehicle, is critical. TV is the primary marketing channel that delivers on the inspiration factor.
In all likelihood, this is probably due to television being the optimal format for conveying experience and motion. Both factors are obviously important to luxury car consumers, and TV achieves a broader reach than the other outlets examined.
0
1
2
4
3
5
6
FINANCIAL SERVICES LIFT FACTOR
TOTAL DIRECT INDIRECT
TV ONLINE PAID SEARCHOUTDOOR PRINT RADIO
0
1
2
4
3
5
6
AUTOMOTIVE LIFT FACTOR
TOTAL DIRECT INDIRECT
TV ONLINE PAID SEARCHOUTDOOR PRINT RADIO
2CDJ Automotive: Optimizing Media to the Consumer’s Purchase Journey, Turner IGNITE Research, Nov 2016
09
Marketing Solutions White Paper
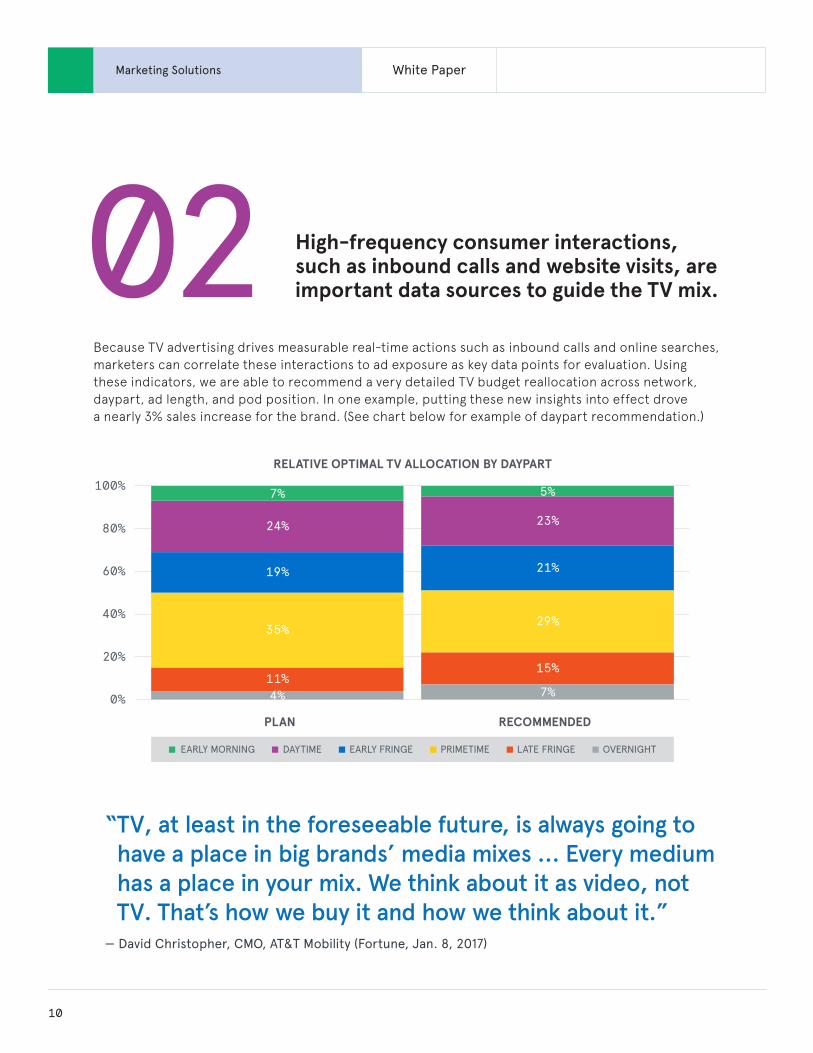
“ TV, at least in the foreseeable future, is always going to have a place in big brands’ media mixes ... Every medium has a place in your mix. We think about it as video, not TV. That’s how we buy it and how we think about it.”
— David Christopher, CMO, AT&T Mobility (Fortune, Jan. 8, 2017)
0%
20%
40%
60%
80%
100%
RELATIVE OPTIMAL TV ALLOCATION BY DAYPART
PLAN RECOMMENDED
24%
7%
19%
35%
11%4%
23%
5%
21%
29%
15%
7%
EARLY MORNING DAYTIME EARLY FRINGE PRIMETIME LATE FRINGE OVERNIGHT
02Because TV advertising drives measurable real-time actions such as inbound calls and online searches, marketers can correlate these interactions to ad exposure as key data points for evaluation. Using these indicators, we are able to recommend a very detailed TV budget reallocation across network, daypart, ad length, and pod position. In one example, putting these new insights into effect drove a nearly 3% sales increase for the brand. (See chart below for example of daypart recommendation.)
High-frequency consumer interactions, such as inbound calls and website visits, are important data sources to guide the TV mix.
10
Marketing Solutions White Paper
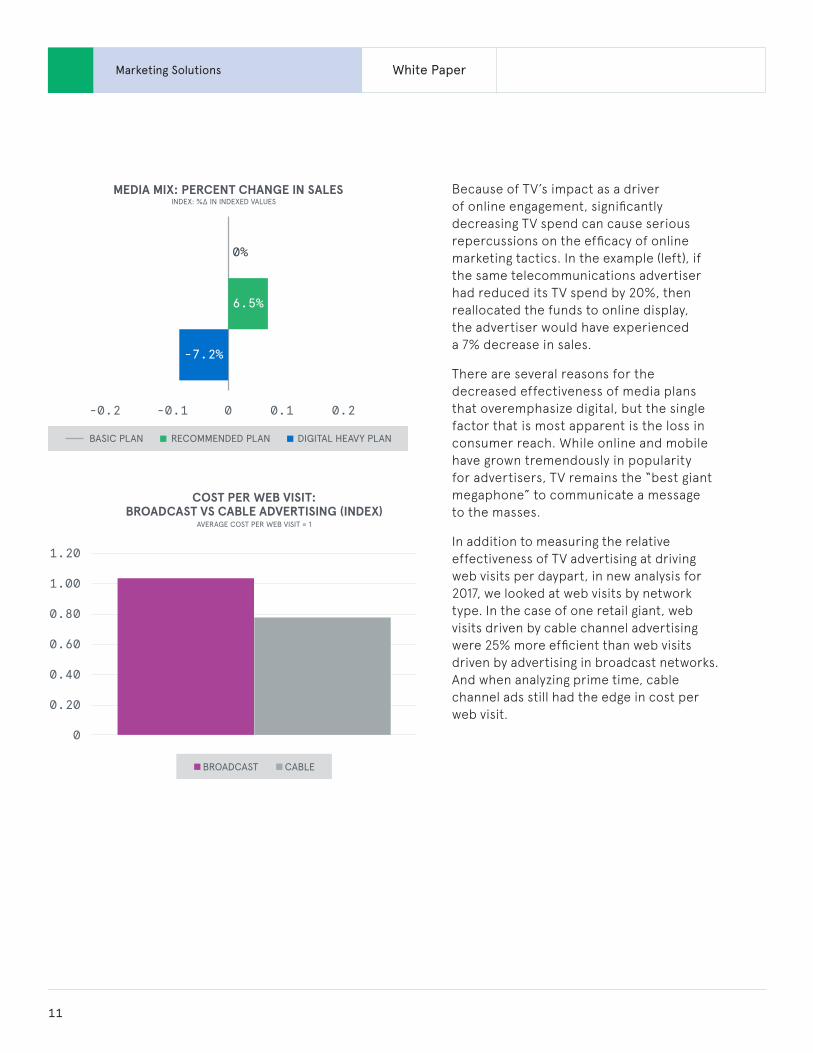
Because of TV’s impact as a driver of online engagement, significantly decreasing TV spend can cause serious repercussions on the efficacy of online marketing tactics. In the example (left), if the same telecommunications advertiser had reduced its TV spend by 20%, then reallocated the funds to online display, the advertiser would have experienced a 7% decrease in sales.
There are several reasons for the decreased effectiveness of media plans that overemphasize digital, but the single factor that is most apparent is the loss in consumer reach. While online and mobile have grown tremendously in popularity for advertisers, TV remains the “best giant megaphone” to communicate a message to the masses.
In addition to measuring the relative effectiveness of TV advertising at driving web visits per daypart, in new analysis for 2017, we looked at web visits by network type. In the case of one retail giant, web visits driven by cable channel advertising were 25% more efficient than web visits driven by advertising in broadcast networks. And when analyzing prime time, cable channel ads still had the edge in cost per web visit.
0 0.1 0.2
MEDIA MIX: PERCENT CHANGE IN SALESINDEX: %∆ IN INDEXED VALUES
BASIC PLAN RECOMMENDED PLAN DIGITAL HEAVY PLAN
-0.2 -0.1
-7.2%
6.5%
0%
COST PER WEB VISIT:BROADCAST VS CABLE ADVERTISING (INDEX)
0
0.20
0.40
0.60
0.80
1.00
1.20
BROADCAST CABLE
AVERAGE COST PER WEB VISIT = 1
11
Marketing Solutions White Paper
03Online video is an exploding segment of the digital marketing media mix, projected to erode ad spending share from traditional online display and search advertising in the coming years.3
To examine the effectiveness of online video, Neustar MarketShare originally examined a year’s worth of data in 2015 from the hospitality, retail, and financial services industries. The study analyzed the ROI across three groups of video publishers:
Group 1: Social/User-Generated — e.g. YouTube, Facebook
Group 2: Premium — e.g. CNN.com, Hulu, ESPN.com
Group 3: Highly Targeted — e.g. MLB, TripAdvisor, Bloomberg
(We defined ROI by determining the attribution of each video group to revenue, dividing spend for each group by the portion of revenue the group was able to drive. See appendix for more background on methodology.)
The results should only be considered directional, but there was a notable ROI gap between premium and targeted outlets when compared to the ROI of Social/User-Generated. Group 1 had a relatively low ROI despite having between 2x-7x the impression volume.There are several possible reasons to explain why, including poor content quality, ad inventory availability, and uneven user experiences across the different publishers. To gain a sense of the content types that create high-quality video inventory, consider Sports.
Within Group 3, Sports content performed very well since live games are long-form, brand friendly, and appeals to two of the most sought-after advertising segments — Men and Millennials. According to Nielsen ratings from 2016, Sports programming “won the night” 125 times overall and 178 times among Adults 18-49 (a 9% increase from 2015), and 216 times among Men 18-49 (a 9% increase from 2015).4
Leading media sellers seem increasingly aware of the value high-quality content can bring. For instance, placing advertising alongside high-quality content all but eliminates the concerns of those ads appearing next to objectionable content that companies don’t want associated with their brand image.
This year, we examined an emerging attribute. As advanced targeting for TV becomes more prevalent, it’s going to be an important tool to measure for marketers. Being able to leverage linear TV by mimicking the same targeting capabilities as online video, it presents marketers with an extraordinary opportunity
Online video ads attached to premium streaming video platforms are more effective.
3http://fortune.com/2017/01/05/tv-advertising-cmo/4http://www.espnfrontrow.com/2017/01/deciphering-tv-ratings-scoreboard/
12
Marketing Solutions White Paper
in terms of reach and impact. Marketers will be able to use greater precision, with tailored products and messaging, to maximize efficiency in their TV advertising. The question that needed to be answered: Which targeting technique proved to be the most effective?
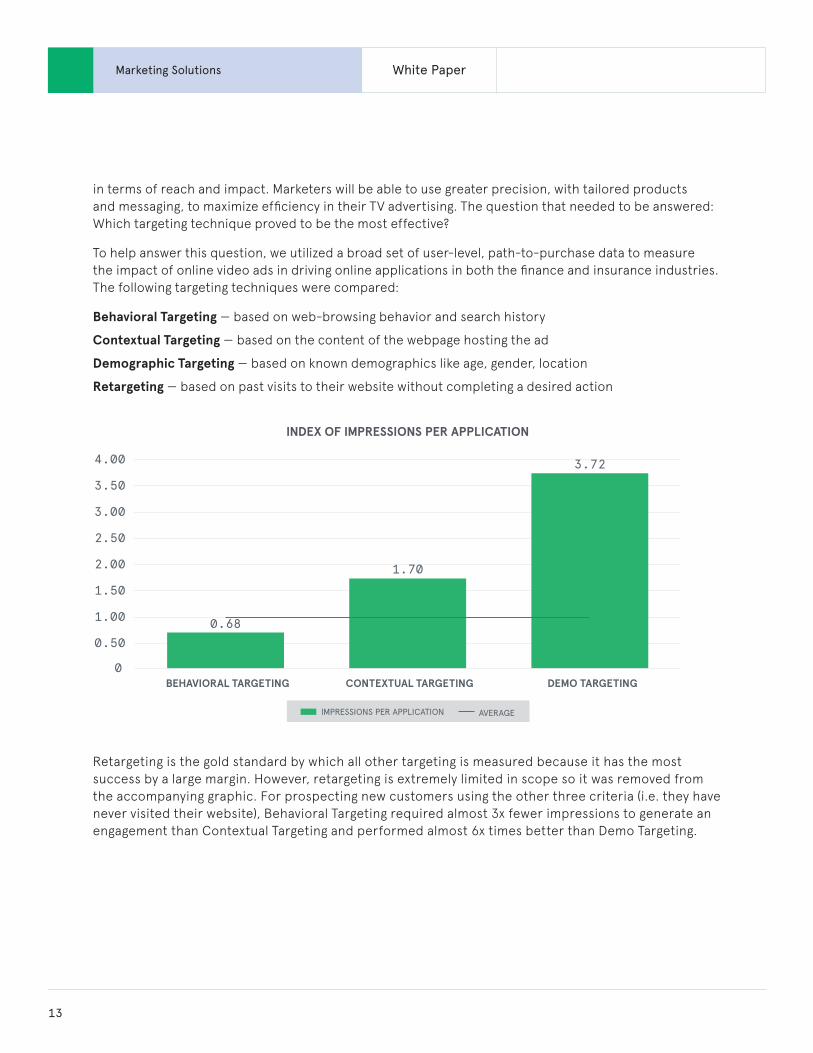
To help answer this question, we utilized a broad set of user-level, path-to-purchase data to measure the impact of online video ads in driving online applications in both the finance and insurance industries. The following targeting techniques were compared:
Behavioral Targeting — based on web-browsing behavior and search history
Contextual Targeting — based on the content of the webpage hosting the ad
Demographic Targeting — based on known demographics like age, gender, location
Retargeting — based on past visits to their website without completing a desired action
Retargeting is the gold standard by which all other targeting is measured because it has the most success by a large margin. However, retargeting is extremely limited in scope so it was removed from the accompanying graphic. For prospecting new customers using the other three criteria (i.e. they have never visited their website), Behavioral Targeting required almost 3x fewer impressions to generate an engagement than Contextual Targeting and performed almost 6x times better than Demo Targeting.
0.68
1.70
3.72
0
0.50
1.00
1.50
2.00
2.50
3.00
3.50
4.00
BEHAVIORAL TARGETING CONTEXTUAL TARGETING DEMO TARGETING
INDEX OF IMPRESSIONS PER APPLICATION
IMPRESSIONS PER APPLICATION AVERAGE
13
Marketing Solutions White Paper
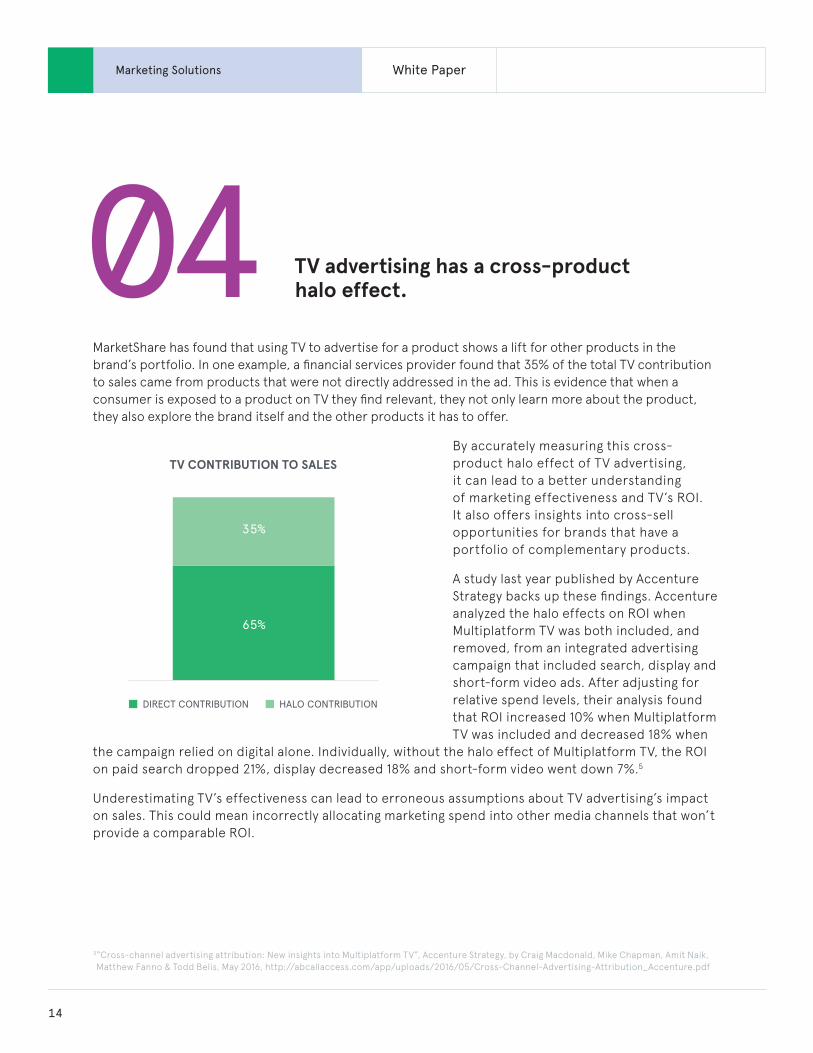
04 TV advertising has a cross-product halo effect.
MarketShare has found that using TV to advertise for a product shows a lift for other products in the brand’s portfolio. In one example, a financial services provider found that 35% of the total TV contribution to sales came from products that were not directly addressed in the ad. This is evidence that when a consumer is exposed to a product on TV they find relevant, they not only learn more about the product, they also explore the brand itself and the other products it has to offer.
By accurately measuring this cross- product halo effect of TV advertising, it can lead to a better understanding of marketing effectiveness and TV’s ROI. It also offers insights into cross-sell opportunities for brands that have a portfolio of complementary products.
A study last year published by Accenture Strategy backs up these findings. Accenture analyzed the halo effects on ROI when Multiplatform TV was both included, and removed, from an integrated advertising campaign that included search, display and short-form video ads. After adjusting for relative spend levels, their analysis found that ROI increased 10% when Multiplatform TV was included and decreased 18% when
the campaign relied on digital alone. Individually, without the halo effect of Multiplatform TV, the ROI on paid search dropped 21%, display decreased 18% and short-form video went down 7%.5
Underestimating TV’s effectiveness can lead to erroneous assumptions about TV advertising’s impact on sales. This could mean incorrectly allocating marketing spend into other media channels that won’t provide a comparable ROI.
65%
35%
TV CONTRIBUTION TO SALES
DIRECT CONTRIBUTION HALO CONTRIBUTION
5 “Cross-channel advertising attribution: New insights into Multiplatform TV”, Accenture Strategy, by Craig Macdonald, Mike Chapman, Amit Naik, Matthew Fanno & Todd Belis, May 2016, http://abcallaccess.com/app/uploads/2016/05/Cross-Channel-Advertising-Attribution_Accenture.pdf
14
Marketing Solutions White Paper

15
Marketing Solutions White Paper
After initially evaluating the data in 2015 from thousands of marketing mix optimization models, taking into consideration decades of research and applied marketing science we re-evaluated updated data in 2017 and reaffirmed that TV is the most powerful business driver for advertisers. It outperforms multiple digital and offline media channels in driving key performance metrics. The analysis also shows a higher ROI for TV networks’ premium online video properties when compared to non-premium publishers.
When deciding how to allocate marketing, and evaluating the use of TV as part of your marketing mix, marketers should consider:
§§ The strength of TV’s effectiveness for their industry
§§ The effectiveness of behavioral ad targeting as TV becomes increasingly addressable
§§ Cross-product halo effect on other marketing channels
§§ The need for consistent, adequate and optimally-timed TV spend
CONCLUSIONS
TV Advertising Remains a Crucial Component in an Optimized Marketing Mix Model
“ TV as a traditional medium is still important. When we run a heavy TV schedule, we see a lift in sales and product awareness. We need to run two weeks of digital to get the reach of one day of broadcast.”
— Rich Lehrfeld, Senior VP of Global Brand Marketing & Communications, American Express (Ad Age, April 2016)6
6http://adage.com/article/media/future-tv-advertising/303565/
16
Marketing Solutions White Paper

17
Marketing Solutions White Paper
MarketShare applies econometric regression techniques to establish the mathematical relationships between marketing investments and sales outcomes by relating the week-to-week shift in sales volume to the presence/absence of multiple marketing tactics while controlling for all other key factors that impact sales volume, such as the economy, price and competitive actions. As a result, we are able to find which tactics/combinations create the most positive/negative sales variance.
Underlying MarketShare’s approach to evaluating marketing effectiveness are three key tenets that help us to determine optimal marketing allocations and accurate attribution:
Diminishing Economic Returns: Multiple studies of the relationship between advertising and sales demonstrate that past a certain point the rate of revenue return realized for each increment of ad spending declines.7
Marketing is Synergistic: Individual marketing resources do not work in isolation, but rather in conjunction with one another. The result of this synergy, where resources work multiplicatively with each other, is that the marketing spend in any given medium increases the impact of spend on all other media.8
Separation of Causality: Sales revenue is comprised of two main components: the Base involves external factors such as the economy, industry and local market trends and internal factors such as brand equity; and Marketing Impact captures the daily effect of all the marketing resources used, e.g., TV, print, paid search, display, radio, sales force and trade promotions.9
Recommending which marketing touch points to use at what spend levels depends on the nature of the purchase decision being made, how close the company is to the point of diminishing returns for any given touch point, and the level of interaction between the touch points.
Typically a marketing allocation model quantifies the impact of media on one brand alone; the models we develop measure an entire industry vertical using observations at the brand level.
In order to accurately measure the impact of media on sales, the models also have to include the entire ecosystem of drivers that can impact sales. That is why we include other factors such as competitive activity, launch dates, seasonality/holidays, and more.
Our approach also uses a log-log multiplicative model structure to capture how media touchpoints work synergistically to drive response (e.g., direct mail is more effective when supported by TV and online display) and the impact of marketing through intermediate pathways, e.g. TV media drives online interest through organic online search and increased awareness of brand-related tweets (e.g., earned conversations). The models are designed to capture all drivers of sales, whether paid or unpaid, direct or intermediate.
APPENDIX
Underlying Methodology
7Vakratsas, Demetrios, and Ambler, Tim (1999) “How Advertising Works, What Do We Really Know,” Journal of Marketing, 63 (1), 26-438 Bucklin, Randolph E., “Marketing Models for Electronic Commerce,” B. Wierenga (ed.), Handbook of Marketing Decision Models, Chapter 10, Springer Science Business Media, LLC 2008
9 Hanssens, Dominique, “Models for the Financial Performance Effects of Marketing,” B. Wierenga (ed.), Handbook of Marketing Decision Models, Chapter 15,Springer Science Business Media, LLC 2008
18
Marketing Solutions White Paper
Weather
Competitor’sSearch
Impression
Competitor’s Offer
(Billboard)
Buysin Store
$$$TV Ad
RetargetingAd
Display Ad
Good PR Display Ad
Social
Paid SearchImpression
Social
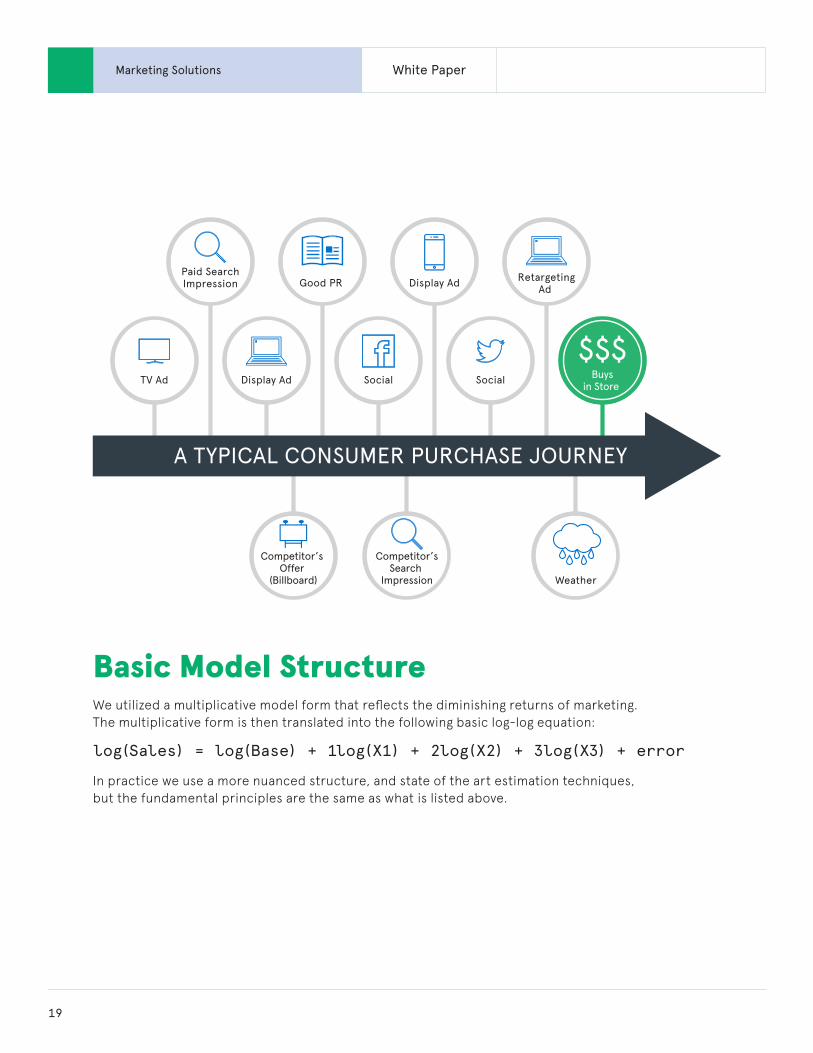
A TYPICAL CONSUMER PURCHASE JOURNEY
We utilized a multiplicative model form that reflects the diminishing returns of marketing. The multiplicative form is then translated into the following basic log-log equation:
log(Sales) = log(Base) + 1log(X1) + 2log(X2) + 3log(X3) + error
In practice we use a more nuanced structure, and state of the art estimation techniques, but the fundamental principles are the same as what is listed above.
Basic Model Structure
19
Marketing Solutions White Paper
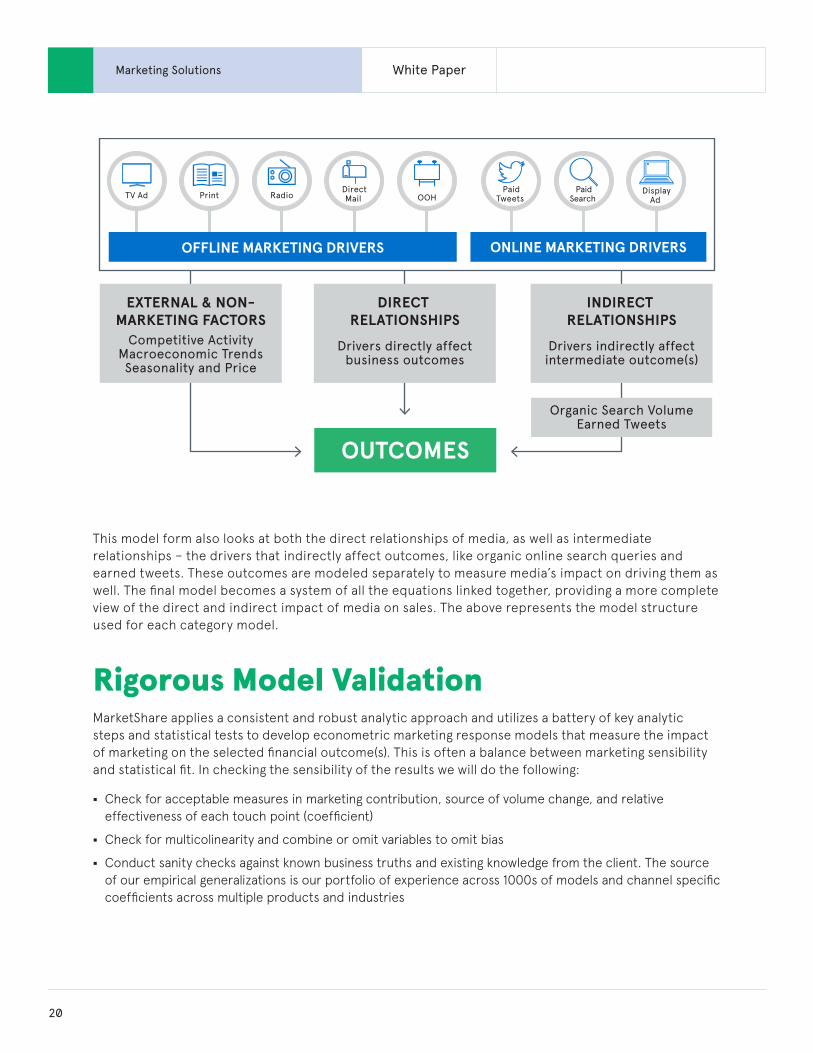
TV Ad DisplayAd
PaidTweets OOHPrint
DirectMail Radio
PaidSearch
OFFLINE MARKETING DRIVERS ONLINE MARKETING DRIVERS
OUTCOMES
EXTERNAL & NON-MARKETING FACTORS
INDIRECT RELATIONSHIPS
DIRECT RELATIONSHIPS
Organic Search VolumeEarned Tweets
Competitive ActivityMacroeconomic TrendsSeasonality and Price
Drivers directly affectbusiness outcomes
Drivers indirectly affectintermediate outcome(s)
This model form also looks at both the direct relationships of media, as well as intermediate relationships – the drivers that indirectly affect outcomes, like organic online search queries and earned tweets. These outcomes are modeled separately to measure media’s impact on driving them as well. The final model becomes a system of all the equations linked together, providing a more complete view of the direct and indirect impact of media on sales. The above represents the model structure used for each category model.
Rigorous Model ValidationMarketShare applies a consistent and robust analytic approach and utilizes a battery of key analytic steps and statistical tests to develop econometric marketing response models that measure the impact of marketing on the selected financial outcome(s). This is often a balance between marketing sensibility and statistical fit. In checking the sensibility of the results we will do the following:
§§ Check for acceptable measures in marketing contribution, source of volume change, and relative effectiveness of each touch point (coefficient)
§§ Check for multicolinearity and combine or omit variables to omit bias
§§ Conduct sanity checks against known business truths and existing knowledge from the client. The source of our empirical generalizations is our portfolio of experience across 1000s of models and channel specific coefficients across multiple products and industries
20
Marketing Solutions White Paper
Our TV Attribution solution leverages big-data, advanced analytics and reporting tools, such as:
§§ DMA-level ratings for each TV airing from Rentrak, which leverages Set-top Box Data (STB) from over 24 million television in the United States
§§ DMA-level response data (site visits) through web analytics or conversion metrics in ad serving logs
§§ Advanced analytics models to estimate the causal impact of each airing
§§ Reporting tools for insights and planning
Why modeling immediate response? Since a significant portion of the United States' population browses the Internet while watching TV, or is in the proximity of their laptops, tablets or smartphones, a TV commercial brings a brand or a product to the attention of consumers, and there is an immediate increase in online activity. The bursty nature of minute-by-minute data makes immediate response modeling extremely powerful, capturing spikes in searches, site visits or inbound calls following TV ads.
MarketShare uses higher-frequency (minute by minute) visit data instead of lower-frequency conversion data, as higher frequency data offers much higher levels of statistical significance.
While purchases due to advertising typically are recorded within days or weeks after ad exposure, site visits can show causal effects within minutes or even seconds of the airing. With the ability to observe consumers on very short timescales, the before-after analysis produces similar results to those generated with randomized experiments.
In addition, narrowing audience segments and measuring outcomes on individuals at each DMA who were likely to see the ads vs. national audiences improves the power of the measurement. With its TV attribution solution, we leverage minute-by-minute data for 210 DMAs in the United States for commercial ratings and for web site visits.
The granular dimensions in the TV commercials to be used in the TV attribution comprises dimensions such as campaign, creative, network, daypart, ad length and pod position, which are less easily analyzed (when at all possible) using traditional modeling techniques, precisely due to time aggregation.
As the models are updated on the weekly basis, the insights can be reviewed using a dashboard that shows the impact of TV campaigns on web visits indexed across time, as well as changes in impact over time due to: different campaigns or creatives, network/daypart/ad-length mix, consumer responsiveness or campaign flighting.
Since a significant portion of the United States population browses the Internet while watching TV, or is in the proximity of their laptops, tablets or smartphones, a TV commercial brings a brand or a product to the attention of consumers, and there is an immediate increase in online activity.
21
Marketing Solutions White Paper
The Unique Measurement Dimensions of TelevisionWhen we consider the use of television in the marketing mix and the lessons used to inform budget allocations, it is important to first acknowledge the attributes of television. TV advertising generates awareness, enhances familiarity, attaches emotion and communicates experience. TV also provides advertisers with the ability to achieve significant reach quickly.
How effective TV advertising is for a particular brand or product and the portion of the marketing budget it should be allocated is determined by a number of factors, including nature of the brand/product being offered, competitor offerings and marketing activities and, ultimately, customer choice. At the brand and product level it is difficult to find, secure and sustain true product and cost differences. On these dimensions, firms compete quickly and head-to-head, rendering the brand personality and “right for me” aspects of consumer perception the arena for winning the customer’s choice. Imparting these more emotional brand qualities continues to be a key role that television plays.
Challenges to Capturing the Effectiveness of TVAmong the many marketing vehicles that brands can deploy in their campaigns, each has a differing capacity to deliver image, emotion, information and experience relating to the product or service. This requires marketers to take into account the ways in which consumers experience, interact with and formulate opinions about their brands.
It is important to understand that not every successful marketing effort leads directly to short-term sales; it can also support the overall marketing strategy by contributing to Brand Equity, which increases base sales and/or supports more tactical conversion efforts by driving a specific behavior.
Understanding and evaluating the impact of offline media (like Television) is complicated by the more direct pathway often observed between media lower on the purchase funnel (like Online Display and Paid Search) and customer purchase actions. We have also seen many cases where clients mistake “cost per x” efficiency for effectiveness, or do not have clear, established and objective metrics for measuring the impact of certain media vehicles, such as social media, on sales.
An important question for marketers becomes: How much of the incremental revenue to the purchased brand should be attributed to the TV commercial versus each of these other marketing drivers?
22
Marketing Solutions White Paper
Capturing the full sales impact of any single media vehicle, when multiple vehicles may influence consumer behavior at key points during the purchase process, is fundamental to assessing the optimal marketing mix. The case in which a single marketing vehicle directly generates a sale is less likely to happen than the scenario in which the consumer is prompted by a TV ad to search for additional information online, then to click on a paid search ad, learn the product is available at a local store within his desired budget and complete the purchase at that store. Attribution becomes cloudier when you consider that the TV ad, the paid search ad, price promotion, in store promotions, shelf space and location all contributed in some way to completing the sale.
Technology AppliedMarketShare DecisionCloud™, the marketing analytics expert system developed by the marketing scientists, practitioners and agency executives of MarketShare, uses advanced econometrics to connect a company’s marketing investments with its revenue and profit. Using historical data relating to sales and advertising expenditures and information about the brand and its consumers, MarketShare DecisionCloud™ applications analyze the optimal marketing budget, mix and spend by media vehicle with a focus on targeting revenue or maximizing profit.
The data library housed in the MarketShare DecisionCloud™ currently addresses over $100 billion in advertising spend and over $800 billion in revenue. The studies in the library cover over 200 US DMAs and 45 countries, and contain existing and new products, and all marketing touch points (both offline and online.)
23
Marketing Solutions White Paper
About Neustar.
Every day, the world generates roughly 2.5 quadrillion bits of data. Neustar (NYSE: NSR) isolates certain elements and analyzes, simplifies and edits them to make precise and valuable decisions that drive results. As one of the few companies capable of knowing with certainty who is on the other end of every interaction, we’re trusted by the world’s great brands to make critical decisions some 20 billion times a day. We help marketers send timely and relevant messages to the right people. Because we can authoritatively tell a client exactly who is calling or connecting with them, we make critical real-time responses possible. And the same comprehensive information that enables our clients to direct and manage orders also stops attackers. We know when someone isn’t who they claim to be, which helps stop fraud and denial of service before they’re a problem. Because we’re also an experienced manager of some of the world’s most complex databases, we help clients control their online identity, registering and protecting their domain name, and routing traffic to the correct network address. By linking the most essential information with the people who depend on it, we provide more than 11,000 clients worldwide with decisions — not just data.
More information is available at
www.home.neustar
©2017 Neustar, Inc. All rights reserved. All logos, trademarks, servicemarks, registered trademarks, and/or registered servicemarks are owned by Neustar, Inc. All other logos, trademarks, servicemarks, registered trademarks, and registered servicemarks are the property of their respective owners.
WP-MS-72457-05.16.2017