
EURO 2015 - Re-evaluating the bullwhip effect measurement ...

Gabriel Pons Rotger and Mette Gørtz
Evaluating the Effect of Soft Business Support to Entrepreneurs in North Jutland

The publication Evaluating the Effect of Soft Business Support to Entrepreneurs in North Jutland is available at www.akf.dk
AKF, Danish Institute of Governmental ResearchNyropsgade 37, DK-1602 Copenhagen VPhone: +45 43 33 34 00 Fax: +45 43 33 34 01E-mail: [email protected] http://www.akf.dk
© 2009 AKF and the authors
Extracts, including figures, tables and quotations, are permitted with clear indication of sources. Publications mentioning reviewing, quoting or referring to this report should be sent to AKF.
© Cover: Phonowerk, Lars Degnbol
Publisher: AKFISBN: 978-87-7509-924-5i:\08 sekretariat\forlaget\gpr\2860\2860_entrepreneurs_north_jutland.docxDecember 2009(18)
AKF, Danish Institute of Governmental ResearchThe purpose of the Institute is to provide new insights into relevant social conditions. AKF concentrates on research into administrative practices and welfare provision at local and regional level. The overall aim is to improve administrative praxis in public bodies and provide them with the best possible decision-making tools.

Gabriel Pons Rotger and Mette Gørtz
Evaluating the Effect of Soft Business Support to Entrepreneurs in North Jutland
AKF, Danish Institute of Governmental Research

2009

Executive SummaryContextNorth Jutland Entrepreneurial Network (NiN), an entity coordinated by ‘Væksthus’ North Jutland, Denmark, offers together with the local business offices counselling to about 1200 entrepreneurs and SME’s each year. NiN has an annual budget of about 5.4 million DKK (2009 prices), partly funded by the Regional Fund of the European Union.
This evaluation focuses on two of NiN’s core counselling ‘products’ which are basic counselling before start-up with private-sector advisors and extended start-up assistance after the business has begun.
AKF, Danish Institute of Governmental Research, was invited to undertake a statistical evaluation of the impact of these services to assess their effects – specifically on new ven-tures’ size, survival and growth. It was also invited to comment on possible improvements in the targeting of these programmes.
In this evaluation a distinction is made between businesses seeking assistance in 2002-2003 and those seeking assistance in 2004-2005 because the service and rules of eligibil -ity changed during that time.
Key ResultsThe key results for the 2002-2003 cohorts were:
1 Basic counselling provided by private-sector advisors enhanced the two-year sur-vival rate of new firms by 8%, the three-year survival rate by 6% and the four-year survival rate by 5%.
2 Basic counselling also enhanced subsequent job creation and sales. Concretely, three years after participation the programme had contributed to 165 new jobs and to an average increase in terms of sales of 127,000 DKK. The programme effects on job creation and firm turnover tend to wear off over time.
3 Basic counselling had no significant impact on the growth of the new ventures in either period.
4 Extended start-up assistance further enhanced the two-year and three-year sur-vival rates by 7.6%, and the four-year survival rate by 6.4%.
5 Extended start-up assistance further contributed to job creation and sales of new ventures.
6 Unlike basic counselling, extended start-up assistance did enhance the growth rate of businesses. Concretely, start-up support led to a 3% higher frequency of new firms which grow (in terms of sales or employees) at least 20%.
The key results for the 2004-2005 cohorts were:7 Basic counselling enhanced the one-year survival rate of new firms by 3%. Two-
and three-year survival rates cannot be calculated because the data are not yet available.
8 Basic counselling enhanced the one year employment size and sales turnover of new firms.
9 Extended start-up assistance enhanced one year survival rates by 12%.

10 Extended start-up assistance had no significant effect on employment size or sales turnover after one year.
Taking both groups together we found:11 Survival rates were higher than average for firms in the construction and hotel &
restaurant sectors.12 Survival rates were higher for businesses which had registered before obtaining
counselling, and lower for those registering whilst taking the advice or after taking the counselling.
13 Survival rates were higher amongst those using their full allocation of business ad-vice hours, and lower amongst those that ‘quit early’.
14 Survival rates were not particularly affected by the socioeconomic characteristics of the business owners such as their education, age, experience or gender.
InterpretationThe evaluation points to the business counselling provided by NiN having a positive im-pact on the performance of its clients. The statistical methods used to derive this result are leading edge and so provide policymakers with an improved basis for decision-making.
The analysis draws a clear distinction between businesses registered and assisted in 2002-2003 and those registered in 2004-2005. This is for two reasons which may be inter-connected. The first is that a key rule changed in 2004 when participants were charged an ‘entrance fee’ of 500 DKK. The second is that we observe changes in the composition of participants. For example, we find that those seeking basic business counselling in 2004-2005 – after the entrance fee is charged – were less likely to have registered their busi -ness with the relevant authorities than those seeking these services in 2002-2003. At the same time we find the opposite pattern among those participating in the start-up assist -ance in 2004-2005, that is this group was more likely to have registered their business than those seeking this type of programme in 2002-2003. The implication of this relates to Finding 12 above – that survival rates are higher when the business has registered prior to seeking advice. The effect of the ‘rule change’ may therefore partly explain the lower one-year survival rate of the 2004-2005 cohorts seeking basic counselling and the higher im-pact on survival figures of the 2004-2005 cohorts assisted during the start-up phase. Our interpretation is that perhaps some entrepreneurs, if they know they have to pay 500 DKK, will delay the registration decision until they have received basic counselling. However, at the same time the ‘entrance fee’ might deter the unconvinced, meaning that only strongly committed business owners use the extended counselling, thus explaining the high sur -vival rates of these businesses.
A second important difference between the 2002-2003 and 2004-2005 cohorts relates to the proportion of entrepreneurs who expect to start a new firm in the construction sec-tor (18% during 2002-2003 and 26% during 2004-2005). For 2002-2003 we observe that 9% of the participants in both basic and extended counselling had previous experience in the construction sector. In 2004-2005, 10% of the participants in basic counselling had ex -perience in construction, while 16% of the participants in extended counselling had similar experience. Thus, in 2004-2005 there was a growing interest for starting a new firm in construction, and this also attracted entrepreneurs with no previous job experience from the construction sector. However, changing sector may potentially be difficult. This seems to have a negative impact on entrepreneurs’ returns from participating in especially the

early phase of the programme, i.e. basic counselling. On the other hand, for those entre-preneurs who proceed to extended start-up counselling, sector change does not seem to reduce their gains from participating in the programme. Overall, the average effect of ex -tended start-up counselling is higher in 2004-2005 due to the higher proportion of firms in the construction sector which generally benefit mostly from NiN’s programme.
Finally, we find that having registered the firm before participation in basic coun-selling is a strong predictor of the programme effect. On average, firms that participated in NiN’s programme in 2002-2003 seemed to be better prepared for the programme in the sense that the time span between firm registration and programme participation was on average longer than what was the case for 2004-2005.
Implications for Policy Overall the counselling services – both basic and extended – appear to be effective in
terms of enhancing the performance of new firms. The positive evaluation of NiN counselling effects might be used to consider possible extension of similar support programmes to other regions with similar workforce and business sector distribu-tion.
This research has pointed to groups or types of entrepreneurs or new firms that seem to benefit most strongly from the take up of counselling services. We note that those who take up their full allocation of hours, and those who have already re-gistered their businesses prior to seeking counselling, do better. We therefore sug-gest that policymakers consider how to target such groups.
Some entrepreneurs wish to start a new firm in a sector in which they have no or only little previous job experience. Basic counselling to those entrepreneurs should be improved with a better assessment of whether their skills acquired through previ -ous job experience are sufficient to secure a satisfactory performance in the new sector.
Finally, we note that during the period, firms in construction, tourism and restaur -ants had high survival rates, but we suspect these sectors have performed less well recently due to the particularly severe economic downturn. This points to the need to continually monitor the outcomes, and in particular to update the survival rates of the 2004-2005 cohort of firms that used the counselling services.

Abstract1
We evaluate by means of the matching method the effect of two types of soft business sup-port measures, i.e. basic counselling before start and extended start-up counselling for en -trepreneurs from North Jutland, Denmark. Due to a change in the programme in 2004, we perform the analysis separately for the periods 2002-2003 and 2004-2005.
We find for the 2002-2003 cohorts that basic counselling provided by private-sector advisors enhanced the two-year survival rates of new firms by 8%, the three-year survival rate by 6% and the four-year survival rate by 5%. Basic counselling also enhanced sub -sequent job creation and sales, but it had no significant impact on the growth of new ven -tures. During 2002-2003, the other evaluated programme, extended start-up assistance, further enhanced the two-year and three-year survival rates by 7.6%, and the four-year survival rate by 6.4%, and contributed to job creation and sales of new ventures. Unlike basic counselling, extended start-up assistance also enhanced the growth rate of busi -nesses. In the subsequent evaluated period 2004-2005, we find that basic counselling con-tributed to a minor extent to survival rates of new firms, while at the same time extended start-up assistance increased its average effectiveness on survival rates.
We further explore the observable heterogeneity of the counselling impacts, and we find that the survival effect was higher than average for firms in the construction and hotel and restaurants sectors. At the same time we also find that the programme was most ef -fective for those entrepreneurial projects which at the participation time were most ad-vanced. In our study it turns out that the socioeconomic characteristics of the business owners like their education, age, experience or gender play a minor role in terms of effect -iveness of counselling. Finally, we also find for the case of extended start up assistance during 2002-2003 that this advice was most effective for those entrepreneurs who used their full allocation of business advice hours in basic counselling.
1 Financial support for this research was provided by the Danish Enterprise and Construction Authority. We are grateful for comments from David Storey, Anders Hoffmann and Hans Henrik Nørgaard, and the parti -cipants of several meetings at the Danish Enterprise and Construction Authority. We also thank Hans Peter Wolsing for supplying us with detailed information about North Jutland’s Entrepreneurial Network Assist -ance Programme and helping us with the interpretation of the data.

Contents1 Introduction........................................................................................9
2 The Scheme: North Jutland Entrepreneurial Network.....................13
3 Data...................................................................................................153.1 Data sources and covariates........................................................................153.2 Outcomes.....................................................................................................163.3 Treatment indicator and sample frame.......................................................17
4 Evaluation Problem, the Parameter of Interest and the Method of Matching...........................................................................................20
5 Results..............................................................................................225.1 Determinants of participation, overlap and matching quality.....................225.1.1 Estimation of the propensity score............................................................225.1.2 Overlap in covariate distribution...............................................................235.1.3 Assessing the quality of the matches........................................................245.2 Average treatment effect for the treated.....................................................255.3 Observable heterogeneity of the treatment effect.......................................27
6 Conclusion.........................................................................................30
References.....................................................................................................32
Dansk resumé................................................................................................35
APPENDIX 1. Matching Estimator................................................................38
APPENDIX 2. Additional Tables....................................................................41

1 IntroductionEntrepreneurial activity, i.e. the process of starting and continuing to expand new busi -ness (see Hart 2003), is considered by some authors as an important driver of competitive-ness of firms, job creation,2 innovation, and economic and social mobility (see Thurik 1999; Timmons 1999; Reynolds et al. 2000; Bednarzik 2000; Zacharakis et al. 2001; Keister 2000; Yusuf 2007). There is also evidence pointing to a moderate contribution of entre -preneurial projects on growth and unemployment, cf. Malchow-Møller et al. (2009a).
There is more controversy regarding the possible market failure of entrepreneurial activity. There are some authors who suggest that the number of new entrepreneurial ven-tures is lower than the social optimum (see Blanchflower & Oswald 1998; Storey 2003), due to lack of information at the entrepreneur side regarding the benefits of starting a business (see Blanchflower 1998 among others) and the usefulness of external expert ad -vice.3 There is also imperfect information on the side of financial institutions regarding the risk of lending to entrepreneurs.4 Glancey & McQuaid (2000) point out that the income re-distribution from market mechanisms can be unfair, discriminating certain groups from becoming entrepreneurs.5 However, there is also evidence suggesting that market failure might produce an excess of entrepreneurs (see Malchow-Møller et al. 2009b).
Entrepreneurship policy6 generally assumes that the level of entrepreneurial activity is below the optimum, and, by means of a variety of activities at different stages of the entre -preneurial process, aims at increasing the supply of entrepreneurs (see Mokry 1988). Sup -porting policies might be of microeconomic scope directly addressed to entrepreneurs’ needs or be implemented through macroeconomic policies aimed at for example providing infrastructure, adequate education, flexible labour markets, research and development.
Entrepreneurial policies are sometimes classified into soft or hard business support (see Storey 2000) depending on the degree of resources involved in supporting activities, where soft measures are the most widely spread entrepreneurial policy among high de -veloped countries. Soft business support encompasses counselling activities to entrepren-eurs before the start, counselling at the start-up phase, facilitating financial assistance, enhancing technology and access to technology and improving access to physical infra-structure, or advice after the start.
This paper evaluates the effect on new entrepreneurial ventures of two modalities of soft business support, basic counselling to potential entrepreneurs and extended start-up counselling to nascent entrepreneurs. These assistance programmes are among other sup-port offers that have been operating since 2002 in North Jutland, Denmark, and admin-
2 A recent Danish analysis suggests that entrepreneurial establishments account for about 8% of the total job cre -ation, cf. Malchow-Møller et al. (2009).
3 Potential entrepreneurs are individuals with business ideas who consider the possibility to start a new firm, while nascent entrepreneurs can be seen as entrepreneurs more advanced in the creation of a new firm since they are in -volved in several activities trying to start a new business (see Wagner 2004). There is evidence that only about half the nascent entrepreneurs establish a new operating firm and in addition very few of these new entrepreneurial firms grow (see Aldrich 1999).
4 Indeed, due to surveys on potential and new entrepreneurs’ experience with starting-up, capital constraints seem to be one of the most important obstacles for starting a new firm.
5 The presence of externalities, cf. Storey (2003) or barriers to entry (see Glancey & McQuaid 2000), are additional sources of entrepreneurship market failure pointed out in the literature.
6 Strictly speaking, entrepreneurship policy should be distinguished from small business policy in the sense that it focuses on potential or nascent entrepreneurs who are considering or trying to start new and dynamic firms (see Hart 2003).
10

istered by the county of North Jutland through the entity North Jutland Entrepreneurial Network (NiN).7
The evaluation of NiN’s programmes is interesting for several reasons. First, it is still not clear to what extent soft business support programmes have achieved ‘return’ on pub-lic expenditure (Atherton 2006), or in other words to what extent these programmes have reached those entrepreneurs who need advice the most (see Jansen & Weber 2004). Ideally, subsidised assistance programmes like NiN should meet the needs of entrepren-eurs negatively affected by market failure; that is those entrepreneurs who without assist -ance are not able to start a successful new venture. At the same time, this type of pro-grammes should also be able to identify unrealistic projects.
This paper tries to answer the question of to what extent subsided assistance from NiN makes a positive contribution in comparison to assistance provided by the market. Second, there is very scarce empirical evidence on the effect of assistance programmes to entre-preneurs in their earliest phase (see Wagner 2004; Peake & Marshall 2006), while there is much more evidence on assistance to new firms (see Wren & Storey 2002). Since Den-mark, although hosting relatively many start-ups, is not among the countries with the highest frequency of growth firms (see Danish Enterprise and Construction Authority 2009), our research is also relevant for regional policymakers.
For outside assistance to be of any importance, an entrepreneur must recognise his/her knowledge gap and hence the significance of outside assistance. In practice, not all en -trepreneurs actually obtain external assistance, and this – which might be partly caused by information deficiency – is also likely to be a consequence of not all entrepreneurs requir -ing assistance.8,9 According to Chrisman & McMullan (2002; 2004) the value of outsider as-sistance primarily comes from the opportunity for knowledge generation that it provides to an entrepreneur in the context of a specific venturing decision. An experienced outsider may direct and facilitate a contextual learning process that leads to a creation of a com -bination of tacit knowledge (which is primarily experience-based) and explicit knowledge (based on facts and theories).
This theory points to a relevant issue regarding the evaluation of assistance pro-grammes. Ideally, the evaluation of assistance impact on entrepreneurial projects should only compare entrepreneurs who need outside support, a characteristic which is usually unobservable in many datasets. As is discussed in more detail in the next two sections, due to our particular sample design, information from NiN records and programme organisa -tion, our dataset only includes entrepreneurs who require assistance. It is important to note that the results obtained in this paper cannot be extrapolated to all kinds of entre-preneurs. As is discussed in the data section, an important share of entrepreneurial pro -jects participating in the NiN programme is expected to start in the construction sector or in the finance, credit and real estate sector.
The evaluation of assistance programmes to entrepreneurs is still not fully developed, cf. Wren & Storey (2002). Yusuf (2007) remarks that despite the importance placed on promoting entrepreneurship and the abundance of resources committed to encourage en-trepreneurial activity, policymakers have primarily been operating in the dark. Most of ex -
7 From 2007 due to the Danish regional structural reform, the Region of North Jutland substitutes the County in the governance of NiN.
8 Storey (2003) has reported that less than half the UK entrepreneurs involved in entrepreneurial efforts obtain ex-ternal assistance.
9 In this paper we do not address the relevant question of who really self-selects into these types of programmes and why, since we only consider participants at different levels of counselling within NiN’s system.
11

isting evaluations do not properly control for selection bias. Several kinds of evaluation have been undertaken by public agencies and consultancy agencies, ranging from straight -forward monitoring of the users of the programme, to questionnaire surveys of firms’ self-evaluation (see Wren & Storey 2002).10
Selection bias might be partly caused by a higher participation propensity of entre-preneurial projects with the highest success potential (see Wren & Storey 2002; Storey 2003). However, adverse selection into the programme is also possible in the case that less experienced entrepreneurs or unemployed individuals seek start-up assistance (see Chrisman & McMullan 2004) to a higher extent than other groups of entrepreneurs.
The existing literature that takes account of selection (see Wren & Storey 2002; Storey 2000; 2003; Chrisman & McMullan 2002; 2004; Chrisman et al. 2005; Yusuf 2007) is based on the traditional two-step selection model proposed by Heckman (1979). Chrisman & McMullan (2004) evaluate several programmes organised by the US Small Business De -velopment Centers. In general, they find a positive and significant effect of outside assist -ance, and a positive relationship between the number of counselling hours and perform-ance.11 As another example, Yusuf (2007) studies entrepreneurship programmes in the US based on data from the Panel Study of Entrepreneurial Dynamics. Yusuf finds that guided preparation as an element of the entrepreneur’s interaction with the assistance pro -gramme contributes significantly to a positive start-up outcome, but contrarily to Chris-man & McMullan (2004), she finds that having participated in the assistance programme is more important than the time spent in the programme.
On the basic of a very rich set of individual characteristics and information from parti-cipation characteristics from NiN records, our paper applies the matching evaluation method to estimate the average treatment effect for the treated (ATT) of two sub-pro-grammes of NiN’s assistance system. We adopt a matching method since, among other fea-tures, this method does not impose such strong conditions on the outcome and participa-tion models as the traditional approach.12 Another important advantage of our approach is that the treatment effect is allowed to be different across different types of entrepreneurs. The information from such heterogeneity can be explored in order to improve the assist-ance programme.
As we discuss in the paper we control for a wide range of observables. Due to our par -ticular sample frame, the fact that entrepreneurs do not participate in all sub-pro-grammes, and the availability of some variables13, which are rarely available in empirical studies, we are able to control for a wide range of factors which are usually unobservable, particularly in the evaluation of start-up support. In the case of basic counselling, the se -lection on observables assumption might be seen as strong, but the very similar observ -able characteristics of control and treatment groups for the evaluation of basic advice sug-gest that selection bias due to unobservables might be of a very moderate nature. The
10 Danish Enterprise and Construction Authority (2003) carried out a thorough evaluation of the NiN programme, one of the Danish ‘contact points’ for entrepreneurs. Contact points were aimed at creating better coordination of the entrepreneurial programmes at the local (municipality) and regional (county) level. Rambøll ( Danish Enterprise and Construction Authority 2003) emphasised the NiN programme as a positive example of an entrepreneur programme within the Danish context of contact points for SMEs. The PLS Rambøll evaluation was primarily a qualitative evalu -ation based on focus-group interviews, and therefore its conclusions cannot strictly speaking be considered as an evaluation of assistance impact.
11 Similarly, we find that the number of hours of basic counselling by private-sector consultants interact positively with extended start-up assistance (see section 5).
12 The matching method is non-parametric and therefore we do not need to impose restrictions on the outcome model (see Wooldridge 2002).
13 Like the expected sector for the new venture or the expected juridical form for the new venture.
12

sample design used in the empirical application is somewhat similar to that used in Wren and Storey (2002).
Our main results show that both sub-programmes have a positive effect on the surviv -orship and size of new entrepreneurial ventures which are the main aims of the coun-selling programmes. In addition, the extended start-up counselling has a positive impact on firm growth. We also find evidence on heterogeneous programme impacts. Thus, pro-gramme impact depends on observable characteristics, e.g. whether the entrepreneur ex-pects to start a new firm in the construction sector. Such information can be relevant for improvement of counselling targeting. Our main contribution to the literature is the ap-plication of modern evaluation techniques to estimate the ATT of two types of soft busi -ness support programmes on the basis of a unique dataset of potential and nascent entre-preneurs.
The paper is organised as follows. Section 2 describes the main features of the coun-selling offered by NiN and discusses the main outcomes of the different levels of coun-selling, which are used in our evaluation to control for unobservable characteristics. Sec -tion 3 describes the different data sources, and the covariate set, used in the matching method, discusses the definition of outcomes and treatment indicators and justifies the sample frame chosen in the empirical evaluation. Section 4 explains our econometric ap -proach, the identification assumptions and sketches the estimator applied in the paper. Section 5 discusses our empirical work, with focus on the estimation of the propensity score, overlap and matching quality, describes the main results in terms of the average treatment effect for the treated and discusses the heterogeneity of the assistance effect in terms of observable entrepreneur characteristics. Section 6 concludes. The details of the matching algorithm used in the paper are confined to appendix 1. Appendix 2 contains tables not included in the main text.
13

2 The Scheme: North Jutland Entrepreneurial NetworkEntrepreneurship policy in Denmark is governed by the Danish Enterprise and Construc-tion Authority and primarily operated at the regional level as a cooperation between re -gions (before 2007, counties) and the municipalities’ business centres. One example of a programme promoting entrepreneurship is the NiN Programme. The overall aim of NiN is to facilitate soft business support and promote cooperation among entrepreneurs in all sectors except agriculture, fisheries, fur and forestry.
The support system provided by NiN has been operating in North Jutland since 2002, and it has a yearly intake of about 1200 participants, mostly entrepreneurs, but also some small and medium enterprises. The annual budget is about 5.4 million DKK (2009 prices) which is supported by the Regional Fund of the European Union.14
NiN’s core counselling ‘products’ are: Basic counselling with the local (municipal) business centre; basic counselling with private-sector advisors; extended counselling dur -ing the start with start-up consultants; and extended counselling after the start with start-up consultants for entrepreneurs. On top of this, NiN has subsidised the participation at entrepreneurial networks, and until 2004 NiN also organised mentor counselling and addi-tional counselling for projects with high growth potential. The main focus of NiN’s sup -porting activities is to secure start-ups and survivorship. However, from 2009 NiN is run-ning a programme focusing on firms’ growth.
Let us describe in more detail the aim, participant characteristics and the typical out -come of the different types of counselling offered by NiN, which play an important role in the way we construct our sample and control for unobservables. The first level of coun-selling and starting point for most participants is the basic counselling offered by the local business centres to those entrepreneurs who express their needs for assistance. 15 At this level, counselling focuses on determining the needs and viability of the different entre-preneurial projects. Business ideas and the entrepreneurs’ skills to develop them are as-sessed, and unrealistic projects are motivated not to continue.16 For those more realistic business projects the idea and its implementation are discussed thoroughly including the potential necessity of fulfilment of public requirements. At the end of this first basic coun -selling an individualised counselling plan is designed for each entrepreneur. The coun-selling plan establishes the need for assistance in terms of hours and type of advisers at subsequent levels of NiN’s assistance system. At this stage most participants are potential entrepreneurs when they contact NiN and do not have a business plan. At this level there are also some participants who are already owners of a firm as a secondary occupation and wish to become owners as their primary activity.
For those entrepreneurs who decide to take up the second level of basic counselling, NiN offers vouchers to private-sector consultants. Concretely, NiN subsidises roughly 50% of the market price of the adviser’s fee.17 Private counselling is typically advice from an auditor on budgetary and economic questions, and possibly assistance from a lawyer on legal matters. There is at most four hours of this type of assistance. It is important to note that not everybody exhausts the four hours. The average number of hours was about three
14 NiN is actually administered by Region North Jutland via the NiN entity. Previously, before the structural reform in 2007 it was administered by North Jutland County.
15 Contact between entrepreneurs and the assistance programme is established when entrepreneurs contact local business offices asking for assistance. There is no fee to do so, and the first level of basic counselling is gratis.
16 About 3% of the entrepreneurs are recommended not to continue with their business idea.17 NiN’s high ‘market share’ of entrepreneurs enables them to acquire good offers on counselling for their clients.
14

for those participating in 2002-2003, while it was roughly three and a half for those parti -cipating in the period 2004-2005. The variation in terms of hours of private basic coun-selling is very likely to capture different unobservable characteristics of participants like motivation or experience, since the main reason for a reduced number of hours is that the participant voluntarily drops out.18 The outcome of private-sector basic counselling is a completed business plan and budget, which serves the potential entrepreneur as a reliable decision tool concerning the start-up of the new venture and its survivorship. We evaluate this sub-programme for two time periods, 2002-2003 and 2004-2005. We do so because in 2004 an ‘entrance fee’ of 500 DKK was required in addition to the 50% of the market price to participate in further NiN assistance offers, and this might influence selection. There were also other changes in subsequent counselling programmes which might also influ-ence who selects NiN’s assistance. As discussed in the next section, the characteristics of the 2002-2003 and 2004-2005 participants are slightly different, and due to the fact that the evaluated effect is specific to the characteristics of entrepreneurs (see Imbens & Wooldridge 2009) we decided to split the sample into two.
The next level of counselling is the extended start-up advice under firm start provided by start-up consultants. This group of advisers was selected by NiN from a pool of applic -ants due to their expertise in advising entrepreneurs in small and medium-sized enter-prises. They are typically auditors, lawyers, advertising agencies or other general consult -ants. The aim of NiN’s start-up assistance is to create a more coherent overview of the strategy and necessary activities with respect to financing, marketing, and a range of practical matters regarding start-up of the firm. Most of the participants of this coun -selling have participated in the basic counselling described above, but firms that started within the last 12 months before assistance can also participate. As in the case of private basic advice, participants pay 50% of the consultancy fee and the remainder is covered by NiN. In this case, the maximum number of hours changed in 2004 from eight to four. As in the case of private basic counselling, the composition of treatment group changes across time, and therefore we estimate the effect of this sub-programme separately for the time periods 2002-2003 and 2004-2005.
After the actual start-up of the firm, new firms are advised on the basic of the experi-ence of the first months of operations of the business. At this level, new firms are offered an adjustment plan in order to secure survivorship and growth by, for example, improving the firm’s intake of customers. Participants in this part of the programme are firms that are 36 months old at the most. The outcome of this assistance programme is a revised business plan and a new budget.
We evaluate the effect of the second and third sub-programme, which is private basic counselling and extended start-up counselling. We do not evaluate this first level of basic counselling because we do not have any supplementary information on which non-parti -cipants in North Jutland are potential entrepreneurs who require assistance. We do not consider the counselling after start, because the number of participants in this programme is not big enough to get a reliable evaluation, and in addition, we do not have information at firm level for many of the participating firms starting within the same year of participa-tion due to the fact that firm information is only available at a yearly basis.
18 We thank Hans Peter Wolsing, NiN’s coordinator, for pointing out this feature.
15

3 Data
3.1 Data Sources and CovariatesWe restrict our sample to entrepreneurs who at least participate at this first level of ad-vice and want to start a new venture as primary occupation. By doing so, we ensure that all entrepreneurs in our sample do have a realistic business idea and minimum skills to de -velop it, and in addition because they contact NiN and fulfil the first level of basic coun -selling, they acknowledge their need for assistance and are aware of specific assistance needs through their individualised counselling plan. More than 1/5 of the participants in NiN expect to open up a business in financial services and real estate, around 1/5 plan to go into construction and another 1/5 plan to open a firm within trade and repairs. Around 45% of the participants’ previous employment is in construction, trade and repairs and fin-ancial services and real estate, but in general, prospective entrepreneurs often change sector when they plan to open a business, and on average only around 1/3 of the parti -cipants plan to open a new firm in their previous sector of employment.
The dataset is based on the records of NiN for three groups of entrepreneurs who par -ticipated during the period 2002-2005 at different types of counselling. Concretely, the first group is composed by entrepreneurs who participated only in basic counselling at the local business offices and afterwards dropped out. The second group of entrepreneurs par-ticipated in both basic counselling at the local business offices and in basic counselling by private sub-contractors and then dropped out. Finally, the third group of entrepreneurs participated at both levels of basic counselling and then took up the extended start-up as -sistance. We use group 1 and 2 as control and treatment groups, respectively, for the eval -uation of basic assistance by private advisers, and we use group 2 and 3 as control and treatment groups, respectively, for the evaluation of the extended start-up assistance pro -gramme.19 As discussed in the previous section, both sub-programmes under evaluation experienced some changes in 2004 and therefore we perform a separate analysis for the periods 2002-2003 and 2004-2005.
Due to the non-observability of entrepreneurship status before the new venture starts, we construct our control groups with entrepreneurs, who participated in the sequence of NiN’s counselling and dropped out just before the evaluated programme. By doing so, we indirectly control for important unobservables, since from the participation at NiN’s first level of advice we know that the business idea of all (control and treated) entrepreneurs in the sample has been assessed and qualified as realistic by NiN, we also know that all (con -trol and treated) entrepreneurs in our sample require assistance, and in addition we know that they are aware of their needs because for those entrepreneurs who complete the first level of basic assistance, the local business office designs an individualised counselling plan specifying the particular needs of each entrepreneurial project.
In the evaluation of extended start-up counselling we are able to control for further un -observable characteristics since control and treated entrepreneurs have completed the first and second level of basic counselling, and therefore we know that these entrepren-eurs have a finished business plan and a budget completed with the assistance of NiN’s consultants.
19 Ideally, we would like to use sequential dynamic treatment analysis, but due to very short duration of programmes we cannot measure outcomes between the participation of two programmes.
16

The records of NiN’s administration contain information about participation date, ex-pected start date for the possible new firm, indicators for participation in all sub-pro -grammes, number of hours of effective assistance for each sub-programme, information on the expected sector for the new firm and expected juridical form for the new firm. 20 These records have been merged into individual and firm administrative records.
Individual information covers two years before participation and includes socioeco-nomic characteristics such as age, family composition, foreign born status, municipality of residence, education, primary and secondary occupation, primary occupational sector, per-sonal and partner’s socioeconomic status, earnings, taxable income, personal and part -ner’s aggregate assets, personal and partner’s liabilities,21 and actual experience.22
The personal information has been merged to longitudinal firm information obtained from administrative registers covering the year before participation and up to 2006. Firm data are mainly used to construct the outcome variables. We merge firm information after participation on start date, turnover, number of employees including the owner, and pos-sible firm closure date, in order to construct outcome variables. Most updated firm vari -ables at the time of this analysis covered up to December 2006, whereas firm closure date is available up to March 2008.23 We use firm’s start date which corresponds with the CVR registration date, to construct the covariate time from CVR registration to participation, a variable that captures maturity of the entrepreneurial project upon participation. This variable turns out to be highly correlated with outcome variables and participation propensity,24 and therefore we include interactions of this variable with several participa-tion characteristics: participation month, expected juridical form of the new firm and ex -pected change in the occupational sector with a possible new firm.25
We construct a measure of local unemployment before participation as the average of the unemployment rate of the municipality of residence and all neighbour municipalities weighted by the total number of unemployed individuals at the municipalities. The unem-ployment rates are measured as the average of the three months immediately before the participation month.
3.2 OutcomesWe evaluate the effect of NiN’s soft business support in terms of survivorship of the new entrepreneurial venture, size in terms of employees and turnover, and in terms of firm’s growth. It is important to note that the main aim of the evaluated programmes was not the firm’s growth, but the firm’s survivorship.
20 Expected sector for the new firm, hours of participation and precise participation date are rare variables in the em -pirical literature of soft business support evaluation, which greatly improve the quality of the evaluation.
21 From 1996 the information regarding assets and liabilities is not tax assessed, and can therefore only be used as a crude indicator of person and family financial wealth.
22 See for example table A1.23 Given the sample frame used in the application, we are able to construct survivorship variable for entrepreneurs
treated by the 2002-2003 programme up to four years after the new firm is registered in the CVR register. The CVR number is the identification number for firms in Denmark.
24 Note that we are considering potential and nascent entrepreneurs who register their new firm in the CVR register at most one year before programme participation and therefore whose firm is not really active upon participation.
25 On the basic of information on primary occupational sector before participation and expected sector for the new venture, we construct at dummy variable indicating whether the entrepreneurs expect to start a new firm in a dif -ferent sector.
17

The central outcome variable of our evaluation, ‘survivorship of a new entrepreneurial project’ is defined in a relatively restrictive way in order to evaluate NiN’s assistance re -garding the degree of fulfilment of its primary objective, which is promoting new ventures as the primary occupation of entrepreneurs. Therefore, we consider a new entrepreneurial project as surviving if: 1) the entrepreneur becomes employer as primary occupation of a new entrepreneurial venture; 2) the entrepreneur expects to start the new venture not later than one year after counselling; 3) the new firm is registered in the CVR register within one year before or after the participation date;26 4) the new firm is active at least one year after the participation date; 5) the new firm survives at least two years after CVR registration; and 6) the entrepreneur appears in the administrative register as employed in the new firm.
Note that despite most participants not being employers when they contact NiN, there are also participants who are already employers of a venture as a secondary occupation and wish to become primary employers of the existing firm. We observe as well in our sample a few non-employer participants who after assistance become employers as sec -ondary occupation. It is also possible that relatives, and not the future employers, particip -ate in the counselling activities, and therefore in spite of assistance might contribute to the new venture; it is not the participant who becomes primary employer. A third explana-tion for the relatively low survival rates is the presence in NiN’s own records of some par -ticipants who postpone the creation of a new firm several years after NiN’s assistance. Sometimes, the same entrepreneur participates several times, and can therefore be con-sidered as a potential entrepreneur who postpones the project in spite of NiN’s assistance. Finally, there are also participants who expected the date for the firm start to be far away from the participation date. These restrictive criteria imply that survival rates are relat -ively low in comparison to survival rates of new ventures. Concretely, in our dataset we observe that survivorship two years after the CVR registration for the participants in basic counselling at local business offices, participants in private basic counselling and parti -cipants in start-up advising in 2002-2003 are 0.362, 0.449 and 0.497, while the two-year survivorship for those who participated in 2004-2005 in these programmes was 0.388, 0.446 and 0.561, respectively.27
For our definition of a new entrepreneurial firm, we consider as outcomes its survivor-ship two, three and four years after the firm is registered in the CVR register. We do so, because some participants have already registered a CVR number for their firm, and this measure gives a more precise measure of length of firm activity than just survivorship from the participation date, since it is possible that some nascent entrepreneurs have not already registered the new firm. We also measure the size effect of assistance in terms of turnover and number of employees one, two and three years after the participation year. Our last outcome variable is a dummy indicating whether the new entrepreneurial firm grows at least 20% in terms of turnover or number of employees the second and third year after participation.28
26 We have restricted success to firm start at most one year after participation, in order to avoid attributing a success counselling which occurred a long time ago. There are relatively few participants who have postponed firm start several years and therefore the results are robust to establishing a time limit with a longer time horizon like 1.5 or 2 years.
27 The three-year survival rates for these three groups participating in 2002-2003 are 0.360, 0.429 and 0.483, and the four-year survival rates are 0.354, 0.412 and 0.463, respectively.
28 According to the OECD a growth firm is a firm not older than five years which presents an annual average turnover growth or annual employment growth of at least 20% during a three-year period.
18

Given the availability of data we are only able to measure two years survivorship, turnover one year after participation and number of employees one year after participa -tion for entrepreneurs participating during the period 2004-2005.
3.3 Treatment Indicator and Sample Frame The initial treatment group for the evaluation of private basic counselling comprises 807 entrepreneurs during the period 2002-2003, and 734 during the period 2004-2005. In the case of extended start-up counselling the start-point treatment groups comprise 859 and 666 observations for the periods 2002-2003 and 2004-2005, respectively. The control sample for private basic counselling is initially 551 and 573 for both sub-periods, while the control sample for extended start-up counselling is the treated sample used in the evalu -ation of private basic advice.
The number of observations is reduced by the availability of individual and firm inform-ation necessary to construct covariates and outcomes. After imposing these restrictions the final dataset used includes in the case of basic counselling 609 treated and 467 con-trols for the period 2002-2003, and 556 treated and 465 controls for the period 2004-2005. In the case of extended start-up programme evaluation the sample for the period 2002-2003 comprises 608 treated and 609 controls, and 464 treated and 556 controls for the period 2004-2005.
In spite of the control group being of moderate size, the fact that our control group is composed by entrepreneurs participating in previous NiN sub-programmes implies that there are no very big differences in terms of confounding variables. As can be seen in sec -tion 5, in spite of the moderate sample size, the quality of our matched control groups is quite good.29
Tables A3 to A6 in appendix 2 present a description of the socioeconomic and particip -ation characteristics of treated and control entrepreneurs. 30 This statistic is more inform-ative that merely comparing covariate means since it takes into account the different dis -persion of treated and control covariate distributions. As seen in these tables, there is not a big difference between control and treated entrepreneurs before participation, but still there are differences for some relevant covariates.
Generally, and irrespective of the sub-programme and the period under evaluation, treated entrepreneurs are less credit constrained before participation than the controls, in the sense that the treated entrepreneurs’ income and assets are slightly higher than that of the control entrepreneurs. Therefore, it is very important to control for the fact that fin-ancial needs among control entrepreneurs might be higher than among treated entrepren-eurs.
If we take a look at the different samples, entrepreneurs participating in basic coun-selling with private sub-contractors have more experience, higher income, higher assets, but also higher liabilities than entrepreneurs who did not participate at this programme. Another relevant difference is that a lower proportion of the treated group than of the con-trol group were students before assistance. It is also possible to see for both periods under evaluation that in the case of basic assistance the treated group differs in terms of educa-tional variables from the control group without a clear pattern. While there are some rel -
29 See section 5.30 Note that for comparison purposes we report covariate means for the treated group and normalised differences
(between means of treated and control group).
19

evant differences in terms of individual characteristics for controls and treated entrepren-eurs participating in basic counselling, on average the participation characteristics are quite similar for the two groups. The only relevant difference is observed in the 2004-2005 sample where a higher proportion of treated expected to start a firm in the construction sector. Finally, another difference in the 2004-2005 sample is that local unemployment was lower for the treated than for the control group.
As seen from tables A5 and A6 there are also significant differences between the entre-preneurs who participated in the extended start-up programme and those who did not. In this case we observe that the treated group, in addition to having higher income and earn-ings than the controls, is older and more educated than the control group. As in the case of basic assistance, the participants of extended start-up support do not differ that much in terms of in which sector they expect to start the new firm. However, and different from the case of basic counselling, there is an important difference between participation charac-teristics of the treated group and the control group. Concretely, those participating i start-up assistance spent more time with previous basic counselling than the control group. It is known that the entrepreneurs with higher education tend to attend more hours to the ba -sic assistance programme than entrepreneurs with lower education, but the educational differences are not big enough to justify such a difference in terms of intensity of particip -ation in basic counselling, indicating that the intensity of participating in a previous pro -gramme is likely to capture unobservables like motivation and engagement.31
It is also worth noting that there are some differences between treated and control group in terms of municipality of residence and in terms of year and month of participa-tion. For example, there is a different proportion of treated than controls irrespective of the programme who have residence in Frederikshavn, while there are also differences in terms of Aalborg residence for basic counselling during 2002-2003. These are municipalit -ies contributing with relatively many participants, and therefore it is important to match the treated and control groups in terms of residence, since residence is a strong predictor for which local business office entrepreneurs contact and are first assisted in the NiN’s se-quential programme. In the case of participation date, it is important to control for month and year of participation, since together with local unemployment capture time and muni -cipality specific business cycle, which can have an important impact on the start of new firms.
The differences between treated and control entrepreneurs are reflecting self-selection and in order to evaluate the real impact of NiN’s sub-programmes free from selection bias, we use a matching method based on the propensity score, a method which is sketched in the next section, and explained in detail in appendix 1.
It is also worth highlighting that there are no significant differences in terms of time between CVR registration and participation, this indicating – as we have mentioned before – that controls are quite similar to our treated entrepreneurs in terms of maturity of their entrepreneurial project upon participation.
31 We thank Hans Peter Wolsing, NiN’s coordinator, for this suggestion.
20

4 Evaluation Problem, the Parameter of Interest and the Method of Matching
The objective of this paper is to estimate the contribution of NiN’s assistance programme to entrepreneurs’ success several years after counselling. To do so, ideally, we should use data obtained from a group of entrepreneurs randomly assigned to a particular pro -gramme and another one excluded from assistance, and compare their performance. How-ever, there is not experimental data available, and instead this paper, given the particular sample design and the availability of a very rich dataset describing entrepreneurs’ charac-teristics regarding their socioeconomic status and their participation, adopts a quasi-ex -perimental approach.
As seen in sub-section 3.3, for both private basic and extended start-up counselling there are some differences between control and treatment groups potentially affecting en-trepreneurs’ outcomes and participation propensity, which need to be accounted for. We use matching to transform the control group according to the covariate distribution of the corresponding treatment group under the selection on observables assumption.
We define the effect of a particular sub-programme on entrepreneur i in terms of po-tential outcomes
∆ i≡ Y i (1 )−Y i (0 )
where Y i (1 ) is the vector of outcomes in case of sub-programme participation for entre-preneur i, and Y i (0 ) is the vector of outcomes in case of no participation for the same en-trepreneur. Obviously, we face a missing information problem because we do not observe the counterfactual outcome (Y i (0 )) for entrepreneurs participating in the sub-programme. In spite of this problem, under certain conditions it is possible to identify the average treatment effects for entrepreneurs with characteristics X i=x,
ATT ( x )≡ E (∆i|T i=1 , X i=x )
where T i=1 indicates that the entrepreneur i has been exposed to a particular NiN sub-programme, and X i is a vector of entrepreneur and participation characteristics which cause both participation and outcomes. In order to highlight the evaluation challenge of this paper, let us rewrite ATT ( x ) as follows:
ATT ( x )=E ¿.
where E ¿ is observable, but E ¿ is not, and has to be estimated with information from non-participants (T i=0).
There are different ways to do so (see Imbens & Wooldridge 2009), and this paper as-sumes strong ignorability of treatment (see Rosenbaum & Rubin 1983), i.e. it is assumed:
i. Unconfoundedness: E (Y i (0 )|T i ,X i)=E (Y i (0 )|X i),
21

ii. Common support: Pr (T i=1|X i=x )<1for all X i=x
Unconfoundedness requires that beyond the observed covariates X i there are no (unob-served) characteristics of the entrepreneur associated with both participation and the en-trepreneur’s outcome in absence of NiN’s assistance. The assumption of common support, expressed in terms of the participation model, the so-called propensity score, states that ATT ( x ) is only identifiable for the treated entrepreneurs for which we can find controls.
In other terms, in order to identify the average counselling effect, unconfoundedness requires that we are able to observe all characteristics that both affect the outcome vari -able and the propensity to participate in the programme. The common support assumption states that we can only estimate the average effect over the population of participants for whom we can find an identical entrepreneur in the control group.
We have a specific complication for the evaluation of private basic counselling due to the fact that many entrepreneurs participating in this assistance programme participate in the extended start-up programme as well. Since we only have the starting date for parti -cipation in the whole NiN assistance programme and the very short duration of sub-pro-grammes, we do not have a proper outcome variable after each sub-programme in order to apply a dynamic treatment method. In order to identify the effect of basic counselling with private sub-contractors alone, we use as treatment group those entrepreneurs who parti -cipated in this programme and did not participate in posterior counselling offers like the extended start-up advice.
In this paper we are interested in the estimation of the average treatment effect for the treated entrepreneurs:
ATT ≡ N1−1 ∑
i :T i=1ATT (x)
and we use a matching type estimator for ATT (and also for its variance), which can be written:
A T T=N1−1 ∑
i :T =1
❑
Y i− ∑i :T =0
❑
ωiY i.
where the weights ωi are obtained as a function of the vector of programme assignments and the matrix of covariates. We use propensity score matching for the evaluation of basic counselling with private sub-contractors, and we use matching on propensity score and some additional covariates for the estimation of the ATT in the case of start-up assistance. This last estimator is similar to the one proposed by Lechner et al. (2006) and Behncke et al. (2008).
We choose kernel type matching due to the moderate size of our control group and re -strict neighbours to a close area around the treated entrepreneurs in order to avoid bad matches. The use of radius matching implies that each treated is matched to a particular set of controls with propensity score values or Mahalanobis distance values within a re -stricted area. The imposition of a calliper (maximum distance in terms of propensity score or balancing score) implies that at least each treated entrepreneur is matched to one con -
22

trol, on average each treated entrepreneur is matched to 12 and 16 controls in the case of basic counselling during the periods 2002-2003 and 2004-2005, respectively; and to 18 and 9 controls in the case of start-up counselling during the periods 2002-2003 and 2004-2005, respectively.
We correct the ATT estimator with a regression-based bias correction suggested by Im-bens (2004). The rationale behind this correction is that although the covariates of the matched control sample will be very similar to the treated sample, these values will not be identical, and the differences between covariates might dominate the distribution of the estimator. As described in more detail in appendix 1 we adjust the matching estimator by means of regression for the remaining differences in terms of covariates.
23

5 Results
5.1 Determinants of Participation, Overlap and Matching Quality
5.1.1 Estimation of the Propensity ScoreThe choice of covariates is crucial. So far the strong ignorability of treatment has been jus -tified based on an assumption that all relevant covariates are controlled for. In practice, the covariate set has to be selected inspired by existing empirical and theoretical studies (see Poschke 2008; Caliendo & Kritikos 2007; Blanchflower & Oswald 1998; Wagner 2004; Goetz 2006; Iversen et al. 2006; Peake & Marshall 2006; Evans & Leighton 1998). Unfor-tunately, there is no formal guide for choosing the covariates; in particular there is no jus -tification for selecting variables based on a goodness-of-fit criterion (Heckman & Navarro-Lozano 2004). In section 3 it was seen that some characteristics of the groups participat -ing in the different sub-programmes were different, this suggests that balancing the cov -ariates is important in this context, and the purpose of the matching estimator is to bal -ance the covariate distribution of the control group to the distribution of covariates of the treatment group. One approach to selecting the covariate set is to first take a stance on what covariates should not be adjusted for (Imbens 2004), and then, conditional on that, to argue what variables should be included in the covariate set. Conditional independence imposes the restriction that the covariate set is not affected by treatment itself, so one way of assuring this is to include only variables that are measured before participation. In our case we include variables measured the year before participation and other variables measured just before receiving assistance as for example the expected sector or the parti -cipation month.
Therefore, entrepreneurs are compared in terms of their socioeconomic characteristics measured before participation and in terms of characteristics of participation. Our selec-tion on observables assumption therefore requires that once we have controlled for ob-servables entrepreneurs do not intentionally self-select into the programme. Concretely, we consider a very wide range of characteristics regarding entrepreneur and characterist -ics of participation, and due to the high proportion of unemployed and students among the participants a measure of local unemployment rate.
Due to the importance of the covariate Days between CVR registration and participa-tion we have specified the propensity score including interaction of this covariate with Sole proprietorship new firm, with Expected change of occupational sector and with the dummies indicating Participation month. Concretely, participation month denotes the month of the year for which the control or the treated entrepreneur participated in basic counselling at the local business office. We have also included the interaction of woman dummy and children between 0 and 2 years old. The re-specification of the propensity score in order to reach a reasonable fit is an advantage of matching with respect to re -gression, since the propensity score specification is not affected by the treatment effects, and is not affected by pre-testing.
Estimates of the propensity score for the four sub-programmes under evaluation are presented in tables A1 and A2 in appendix 2. As can be appreciated at first glance, many coefficients are insignificant especially in the case of basic counselling with private sub-contractors. The inclusion of too many covariates might potentially add noise to the final estimation. However, what is really important is if the matching algorithm balances the co -
24

variate distributions, and as shown in the next sub-section while many parameters are not estimated significantly tables A3 to A6 suggest that the matching procedure is able to bal -ance the covariates for the four samples used in the paper.
As seen in these tables, for both basic counselling and start-up assistance there are few general patterns across the two sub-periods under consideration, which seems to sug -gest a change in the composition of participants over time.
In the case of start-up assistance (table A2), there are several common patterns across the two sub-periods, which are worth mentioning. The number of hours received of basic counselling with private sub-contractors seems to be a good predictor for start-up assist -ance. As discussed below, there are different socioeconomic factors that might explain the variation at Hours of NiN Basic Counselling by sub-suppliers, and therefore given we con-trol for a very wide range of socioeconomic factors, the very high positive partial correla -tion of this covariate is likely to capture unobservables. In addition, the entrepreneur’s in-come appears to be positively correlated with the propensity to receive extended start-up support.
There is a general pattern across the two sub-programmes and the two sub-periods considered. The parameter estimates suggest that the propensity to additional assistance tends to be positively correlated with time between CVR registration and participation.
5.1.2 Overlap in Covariate DistributionAs discussed in section 4, ATT is only identified for those treated entrepreneurs (T i=1) for whom it is possible to find at least one control entrepreneur with very similar characterist -ics X i. The lack of overlap between the covariate distribution of the treated and control groups is one of the main concerns behind the applicability of the matching method. In or -der to assess overlap, we might as a starting point consider the difference in terms of nor-malised means of covariates. From section 3, there are not very big differences between covariates.
Even in the case of minor differences between each covariate there may still be re-gions of the covariate distribution with positive density at the treated group, but no dens -ity at the control group. Typically, this is the case for the propensity score being 1 or tak -ing very high values. In addition, observations with a propensity score close to 1 contrib-ute very much to the variance of the estimator (see Abadie & Imbens 2006). So, in order to improve overlap, we adopt the rule-of-thumb proposed by Crump et al. (2008) and exclude all treated and control observations with an estimated propensity score higher than 0.9 or lower than 0.1.
As can be seen from the estimated density function of propensity scores for treated and control groups (figure 5.1) there is quite a good overlap for basic counselling, and reasonable overlap for the case of start-up assistance.
25

Figure 5.1 Overlap of predicted participation probabilities for treated and control (broken lines) entrepreneurs
Note: From left to right figures corresponding to periods 2002-2003 and 2004-2005, respectively, and from top to bot -tom figures corresponding to basic counselling with private sub-contractors to extended start-up counselling.
5.1.3 Assessing the Quality of the MatchesMost often the quality of the matching procedure is assessed by comparing the normalised difference of covariate means of treated and matched control sample. If matching does a good job any significant differences will be reduced (see Rosenbaum & Rubin 1983).
This method is not entirely informative in our case, since our final estimator combines matching and regression adjustment. So in addition to reporting normalised mean differ -ences after matching (column 3 of tables A3 to A6) we report as in Behncke et al. (2008) a t-test for the significance of treatment effect for the treated on each covariate (column 4 of tables A3 to A6). Under the unconfoundedness condition, the treatment effect of the addi -tional assistance programme on each covariate is zero. Therefore, we use each covariate measured before the treatment date as it was an outcome variable and by means of the same matching estimator used for evaluating the effect in terms of outcomes, we estimate ATT for each covariate and construct the t-test.
At this point it is important to note that we have chosen the calliper in order to secure the insignificant treatment effect on each covariate at the 10% level. Initially, we have ap-plied propensity score matching for all sub-programmes. However, in the case of start-up
26

assistance propensity score matching was not able to eliminate imbalance in covariates, and therefore we have used these covariates together with the propensity score to con-struct a balancing score based on Mahalanobis distance. As shown in tables A3 to A6 we were able for the four sub-programmes to obtain quite a good matching quality in terms of covariates. As can be seen from tables A3 and A4, the normalised difference of means after matching is very much in line with the t-test for the case of basic counselling this indicat-ing that there are probably not big differences between the treated and matched control sample and therefore bias adjustment does not make a big difference. However, in the case of an extended start-up programme it is possible to appreciate some covariates with normalised differences close to 20% and at the same time insignificant t-test values, this suggesting that bias adjustment is active in the case of a start-up programme.
In the case of a start-up programme for both sub-periods propensity score matching was not able to eliminate imbalances in all covariates, and therefore we have finally matched on the propensity score and these additional covariates. Concretely, in the case of start-up support during 2002-2003, the propensity score matching method did not ad -just properly for Days between CVR registration and participation and Income one year before, while in the case of 2004-2005 start-up assistance the propensity score was not able to eliminate the imbalance in terms of Unemployed one year before participation and the Hadsund residence.
5.2 Average Treatment Effect for the Treated
Table 5.1 shows the matching estimates for basic counselling with private sub-contractors and extended start-up counselling for the periods 2002-2003 and 2004-2005. Due to data limitations for sub-programmes corresponding to 2004-2005 we are only able to estimate the survivorship effect two years from the CVR registration, turnover and employment one year after the participation year. A common pattern of the four programmes evaluated is that they positively contribute to the survivorship and size of entrepreneurial firms several years after counselling. As can also be seen from table 5.1, extended start-up assistance has a statistically significant positive effect on the growth of the new entrepreneurial firms of assisted entrepreneurs.
Let us take a more detailed look at the results. If we consider assistance during 2002-2003, we can see that on average basic counselling increases the survivorship propensity two years after assistance by about 8%, three years after by about 6.1% and four years after by 5.2%. These figures might not seem very high, but it is worth noting that we have evaluated separately the effect for each sub-programme. Therefore, for entrepreneurs who in addition received extended start-up assistance during 2002-2003, the frequency of sur-vivorship two years after increases by an additional 7.6% that means an overall increase of about 15.6%. A very similar picture arises in the case of survivorship three and four years after. In this case, the assistance by NiN’s start-up consultants increased the frequency of entrepreneurial projects which survive three and four years, by 7.6% and 6.4%, respect -ively.
NiN’s basic counselling and start-up assistance had also a positive effect on the size of the new ventures. Concretely, for basic counselling the average effect in terms of number of employees was about 0.5 employees. With a total number of assisted entrepreneurs of about 600, the programme roughly speaking creates an additional 300 new jobs in North Jutland one year after participation. The effect of basic counselling (for 2002-2003) de -clines during the second and third year after participation. This seems to suggest that in
27

the long-run the success of the programme in terms of size might be more moderate than the figures immediately after participation suggest.
In the case of start-up extended assistance we have slightly different results. In this case, it seems that employment effects are fully manifested after two years from the parti -cipation year. One year after counselling, the average employment effect in spite of being positive is not statistically significant. However, two and three years after the start-up ex -tended support have even a higher employment effect than basic counselling. As seen from table 5.1, the impact of the start-up programme on employment of new ventures declines the third year after participation compared to the second year. However, as opposed to the results for the basic programme, the effect on sales is increasing over time, this suggest -ing that firms assisted by the start-up programme become more productive with respect to the hypothetical situation where they had not participated.
The start-up counselling during 2002-2003 also contributes to increase the frequency of firms which grow fast (defined as firms with an annual growth in terms of employees or sales of at least 20%). Concretely, this programme increases the proportion of firms which grow fast between the first and second year after participation and again between the second and third year by a good 3%. These are maybe not very big numbers, but it is worth noting that the main aim of the sub-programmes under evaluation was to guarantee the survival of the firm. In the case of basic counselling there is a positive but insignificant effect on the number of growth firms.
As partially detected from the estimation of the participation model (see tables A1 and A2), there seems to be a change in the effects of programmes in 2004-2005. As described in section 2, in 2004 several changes in terms of the extension and price of assistance were introduced. Concretely, while in 2002-2003 there was no fee for participating in ba-sic counselling with private sub-contractors other than the 500 DKK in consultant rates. From 2004, the entrepreneurs had to pay an entrance fee in addition to the fee for coun -selling with private advisers. At the same time, the maximum duration of extended start-up counselling was reduced from eight to four hours. It is not clear to what extent these changes might influence the average effect, since together with exogenous time effects, like business cycle, changes are likely to affect the composition of treatment groups. As can be appreciated from the changes across time in the composition of treatment groups it seems that there is a higher proportion of participants who have been previously unem-ployed, particularly in the basic counselling.
As seen in table 5.1, we find that basic counselling has a lower effect on survivorship two years after the CVR registration; it has a relatively similar effect on employment, while it seems to have a bigger impact on turnover. In the case of extended start-up assist -ance, we find a higher effect on survivorships two years after, and positive but insignific -ant effects on the size of the new ventures. As is discussed in section 3, our estimates have to be interpreted as conditional to the characteristic of the treatment group, and therefore it is likely that in case the socioeconomic characteristics of the participation group change over time, the average effects might also change. As is shown in the next sub-section the effect of assistance seems to vary with few characteristics of entrepreneurs.
The results are robust to more conservative specifications of the propensity score in terms of a total set of covariates, the results are also robust using a logit propensity score instead of a probit model, and are robust to different radius length around the chosen cal -liper, which is quite conservative in order to preclude bias.32
32 Sensitivity check results are available upon request.
28

Table 5.1 Average counselling effect for the participants in NiN’s sub-programmes
2002-2003 2004-2005Basic counselling with private sub-contractors
ATT Standard error
ATT Standard error
Survivorship 2 years from CVR registration 8.03% 1.95% 3.23% 2.18%Survivorship 3 years from CVR registration 6.14% 1.90%Survivorship 4 years from CVR registration 5.20% 1.77%Employment 1 year after participation year 0.483 0.161 0.368 0.116Employment 2 years after participation year 0.313 0.143Employment 3 years after participation year 0.271 0.154Turnover 1 year after participation year 178 52 306 103Turnover 2 years after participation year 131 58Turnover 3 years after participation year 127 66Growth firm 2 years after participation year 2.08% 1.19%Growth firm 3 years after participation year 0.48% 1.05%
2002-2003 2004-2005Extended counselling under start with start-up consultants
ATT Standard error
ATT Standard error
Survivorship 2 years from CVR registration 7.62% 2.23% 12.61% 3.61%Survivorship 3 years from CVR registration 7.59% 2.15%Survivorship 4 years from CVR registration 6.43% 2.10%Employment 1 year after participation year 0.242 0.315 0.574 0.381Employment 2 years after participation year 0.539 0.194Employment 3 years after participation year 0.495 0.236Turnover 1 year after participation year 225 75 227 392Turnover 2 years after participation year 294 103Turnover 3 years after participation year 357 146Growth firm 2 years after participation year 3.33% 1.55%Growth firm 3 years after participation year 3.12% 1.05%
Note: See the matching methods described in appendix 1.
5.3 Observable Heterogeneity of the Treatment Effect
A priori, heterogeneity in response to assistance should be expected due to the fact that participants form a very heterogeneous group. Assistance might be more effective for men than women, for native entrepreneurs than foreign born ones, for entrepreneurs who ex-pect to start new firms in a particular sector or who come from different sectors. It is im-portant to note that for many categories we do not have enough information to obtain reli -able treatment effects for sub-samples, and therefore we choose to run regression of indi -vidual effects on all confounding variables used in the matching.
The matching estimator produces individual estimates of the effect of soft business support. It is therefore possible to explore whether there are systematic differences in re-sponses across different observed characteristics, i.e. observable heterogeneity. This is done by regressing the estimated treatment effects in terms of all 11 outcome variables for
29

the 2002-2003 programmes and in terms of three outcome variables for the 2004-2005 programmes. Coefficients from OLS regressions of treatment effects on all covariates are presented in tables A7 to A12. The parameters in these tables have been standardised, im -plying that they should be interpreted as the effect of a one standard deviation change in the covariate. In this way the relative importance of the covariate can be assessed in terms of coefficient size.
The results presented in these tables indicate first of all that the effect of counselling changes only with some, but not all of the characteristics of the entrepreneurs. If we focus on survivorship effects, we can appreciate that the general pattern across programmes and periods is that the number of days from CVR registration is a very good predictor of success (see tables 5.2 and 5.3). This variable can be seen as a proxy for maturity of the entrepreneurial project upon participation in the programme. As can be seen from the sample, we have entrepreneurs who registered their firm well in advance of counselling, while others did so after counselling.
Another common pattern across programs and periods is that entrepreneurs who ex-pect to start a firm in the construction sector (see tables 5.2 and 5.3), and in the case of extended start up we find that those who expect to start a business at hotel and restaurant sector (see tables 5.2 and 5.3) are more successful other characteristics being equal. If we focus on basic counselling, we can see that days from the CVR registration are positively correlated with the survivorship in both periods. However, there is an important differ -ence. In the second period the observable variation of the survivorship effect is mainly dominated by the variation of days since the CVR registration. However, for the new ven -ture that is expected to start in a different sector than their previous sector of occupation, the time between CVR registration and participation does not seem to impact the pro-gramme. As can be seen from table 5.2, there are considerably many entrepreneurs who expect to change sector in favour of construction, but our results suggest that this case has not been especially favoured by basic counselling in the period 2004-2005. The posit -ive impact of time since CVR registration is further reduced in the case of a new firm re -gistered as a sole proprietorship firm.
Due to the fact that we are estimating the average effect across the treated entrepren-eurs, and therefore the effects are sample specific, the results might indicate that the ba -sic counselling has not been especially good for entrepreneurs who changed sector during 2004-2005. It is also interesting to note another difference across time. Survivorship ef -fects were smaller for those with basic education or vocational secondary education for those assisted in 2002-2003. However, for those assisted in 2004-2005, the effect is larger for these types of education.
In the case of start-up assistance we also appreciate relevant differences across the two periods. For those assisted during 2002-2003 the effect on survivorship increased with hours of basic counselling, while the effect decreased for immigrants, and entrepreneurs with short and medium high education, for those previously employed in the transport sec-tor, in public administration or in the teaching sector, or for those who were students the year before counselling. For those assisted during 2004-2005, the survivorship effect in -creases for those entrepreneurs previously employed in the finance, credit and real estate sector, those expecting to start a construction firm, a hotel or restaurant, while the effect decreases with age, with number of children 0-1 year old, for entrepreneurs who were pre-viously unemployed or for entrepreneurs who were multi-employed. There is no clear pat -tern in which socioeconomic characteristics might affect the effectiveness of assistance.
30

If we now focus on employment effects, we can appreciate similar results for covariate Days between CVR registration and participation for basic counselling. This covariate has an important positive influence on the employment effect, whereas this positive effect is reduced in case of the new firm having been registered as a sole proprietorship firm, and in the period 2004-2005 if the new firm is expected to change sector. If we focus on gen -eral patterns across basic and start-up counselling the employment effect increases in case the new firm is expected to operate in the construction sector or hotel and restaurant sector.
31

Table 5.2 Heterogeneity of two years survivorship effect (basic counselling)Mean of treated
t-test Std. coef.
Expected construction 0.18 ** 0.11Expected hotel or restaurant 0.08 ** 0.09Days between CVR registration and participation 3.11 *** 0.25Days between CVR registration as sole proprietorship firm and participa-tion
2.38 *** 0.36
Days between CVR registration and April participation 0.93 *** -0.36
Expected construction 0.26 0.07Expected hotel or restaurant 0.08 0.06Days between CVR registration and participation 1.61 *** 6.71Days between CVR registration in a new sector and participation 1.39 *** -5.80Days between CVR registration and February participation 0.04 ** -0.20Days between CVR registration and March participation 0.02 *** 0.18Days between CVR registration and September participation 0.07 ** -0.28Days between CVR registration and October participation *** -0.17
Note: *, **, and *** denotes 10%, 5% and 1% significance of t-test of influence of covariate on a two-year surviv-orship effect.
Table 5.3 Heterogeneity of two years survivorship effect (start-up counselling)Mean of treated
t-test Std. coef.
Expected construction 0.18 *** 0.23Expected hotel or restaurant 0.08 ** 0.10Hours NiN Basic Counselling by sub-suppliers 3.05 *** 0.15Days between CVR registration and participation 2.98 ** 3.41Days between CVR registration and January participation 0.07 ** -0.27Days between CVR registration and March participation 0.68 ** -1.68Days between CVR registration and April participation 0.65 ** -1.06Days between CVR registration and May participation 0.43 ** -1.43Days between CVR registration and June participation 0.21 ** -0.69Days between CVR registration and July participation 0.32 *** -1.12Days between CVR registration and August participation 0.03 *** -0.30Days between CVR registration and November participation 0.52 ** -1.92
Expected construction 0.27 *** 0.30Expected hotel or restaurant 0.09 *** 0.23Days between CVR registration and March participation 0.14 ** 0.10Days between CVR registration and June participation 0.03 * 0.08Days between CVR registration and October participation 0.30 ** 0.10Days between CVR registration and November participation 0.71 ** 0.12
Note: *, **, and *** denotes 10%, 5% and 1% significance of t-test of influence of covariate on a two-year surviv-orship effect.
32

6 ConclusionThis paper applies matching on a unique dataset of potential and nascent entrepreneurs who received soft business assistance from North Jutland Entrepreneurial Network (NiN) in Denmark. An important proportion of entrepreneurial projects is expected to start in the construction sector (18% in 2002-2003 and 26% in 2004-2005) or in the finance sector (22% in 2002-2003 and 17% in 2004-2005). The paper assesses the survivorship, size and growth effect of two different types of assistance, basic counselling addressed to potential entrepreneurs and offered by private sector advisers, and extended counselling under start addressed to nascent entrepreneurs and administered by start-up consultants.
The identification of the average treatment effect for the treated relies on the selection on observables assumption. This is quite a strong assumption which requires that we ob -serve everything that both affects outcomes and the participation decision. We adopt this assumption for the evaluation of the two types of programmes, given the sequential parti -cipation of the treated group in the programme. However, it is obvious that in the case of evaluating the start-up advice we are able to ‘indirectly’ control for the widest range of un -observable characteristics: realism of the entrepreneurial project, necessity of assistance, knowledge of assistance needs, availability of a business plan and economic budget. Therefore, we should be more cautious when interpreting ATT for the case of basic coun-selling as a causal effect. However, as discussed by Frölich (2007), at least we can inter -pret the ATT for this programme as the difference in terms of outcomes between the treated group of entrepreneurs and the control group in the case this group presented the same observable characteristics as the treated group. We are confident that selection on non-observables is likely not to be a very important problem in this case, given the fact that the control and treatment groups are characterised by a very similar distribution of covariates which are potentially strongly correlated with unobservables.
Overall, the paper finds strong evidence that both counselling programmes contribute to their aim, which is to support survivorship of new entrepreneurial ventures. It is also found that both programmes contribute to the size of the new firms, and the extended start-up support has also a positive impact on the frequency of growth firms in North Jut -land. This research has also pointed to groups or types of entrepreneurs who seem to be-nefit most strongly from the take-up of counselling services. We note that those who take up their full allocation of hours, and those who have already registered their businesses prior to seeking counselling do better. Finally, we note that during the period, firms in construction, tourism and restaurants had high survival rates.
The analysis draws a clear distinction between businesses registered and assisted in 2002-2003 and those registered in 2004-2005. This is for two reasons which may be inter-connected. The first is that a key rule changed in 2004 when participants were charged an ‘entrance fee’ of 500 DKK. The second is that we observe changes in the composition of participants. For example, we find that those seeking basic business counselling in 2004-2005 – after the entrance fee is charged – were less likely to have registered their busi -ness with the relevant authorities than those seeking these services in 2002-2003. At the same time we find the opposite pattern among those participating in start-up assistance in 2004-2005, that is this group was more likely to have registered their business than those seeking this type of programme in 2002-2003. As is shown in the empirical analysis, sur -vival rates are higher when the business has registered prior to seeking advice. The effect of the ‘rule change’ may therefore partly explain the lower one-year survival rate of the 2004-2005 cohorts seeking basic counselling and the higher impact on survival figures of
33

the 2004-2005 cohorts assisted during the start-up phase. Our interpretation is that per -haps some entrepreneurs, if they know they have to pay 500 DKK, will delay the registra -tion decision until they have received basic counselling. However, at the same time the ‘entrance fee’ might deter the unconvinced, meaning that only strongly committed busi -ness owners use the extended counselling, thus explaining the high survival rate of these businesses.
A second important difference between the 2002-2003 and 2004-2005 cohorts relates to the proportion of entrepreneurs who expect to start a new firm in the construction sec-tor (18% during 2002-2003 and 26% during 2004-2005). We observe for 2002-2003 that 9% of the participants in both basic and extended counselling had previous experience in the construction sector. In 2004-2005, 10% of the participants in basic counselling had ex -perience in construction, while 16% of the participants in extended counselling had similar experience. Thus, in 2004-2005 there was a growing interest for starting a new firm in construction, and this also attracted entrepreneurs with no previous job experience from the construction sector. However, changing sector may potentially be difficult. This seems to have a negative impact on entrepreneurs’ returns from participating in especially the early phase of the programme, i.e. basic counselling. On the other hand, for those entre-preneurs who proceed to extended start-up counselling, sector change does not seem to reduce their gains from participating in the programme. Overall, the average effect of ex -tended start-up counselling is higher in 2004-2005 due to the higher proportion of firms in the construction sector who generally benefit mostly from NiN’s programme.
Finally, we find that having registered the firm before participation in basic coun-selling is a strong predictor of the programme effect. On average, firms that participated in NiN’s programme in 2002-2003 seemed to be better prepared for the programme in the sense that the time span between firm registration and programme participation was on average longer than what was the case for 2004-2005.
34

ReferencesAbadie, A. & G. Imbens (2006): Large Sample Properties of Matching Estimators for Aver-
age Treatment Effects. Econometrica, 74(1):235-67.
Aldrich, H. (1999): Organizations Evolving. Newbury Park, CA: Sage Publications.
Atherton, A. (2006): Should Government be Stimulating Start-ups? An Assessment of the Scope for Public Intervention in New Venture Formation. Environment and Planning C: Government and Policy, 24:21-36.
Bednarzik, R.W. (2000): The Role of Entrepreneurship in U.S. and European Job Growth. Monthly Labor Review, 123:3-16.
Behncke, S.; M. Frölich & M. Lechner (2008): Unemployed and their caseworkers: should they be friends or foes? IZA DP No. 3149.
Blanchflower, D.G. & A.J. Oswald (1998): What Makes an Entrepreneur? Journal of Labor Economics, 16(1):26-60.
Caliendo, M. & A.S. Kritikos (2007): Is Entrepreneurial Success Predictable? An Ex-Ante Analysis of the Character-Based Approach. IZA DP No. 2687.
Chrisman, J.J & W.E. McMullan (2002): Some additional comments on the sources and measurements of the benefits of small business assistance programs. Journal of Small Business Management, 40:43-50.
Chrisman, J.J & W.E. McMullan (2004): Outsider Assistance as a Knowledge Resource for New Venture Survival. Journal of Small Business Management, 42:229-244.
Chrisman, J.J.; W.E. McMullan & J. Hall (2005): The Influence of Guided Preparation on the Long-term Performance of New Ventures. Journal of Business Venturing, 20:769-791.
Crump, R.; V.J. Hotz, G.W. Imbens & O. Mitnik (2008): Dealing with Limited Overlap in Es -timation of Average Treatment Effects. Biometrika, 96(1):187-199.
Danish Enterprise and Construction Authority (2003): Eftersyn af lokale kontaktpunkter for iværksættere. Report made by PLS Rambøll Management A/S.
Danish Enterprise and Construction Authority (2009): Iværksættere med udenlandsk bag-grund.
Evans, D.S. & L.S. Leighton (1998): Some Empirical Aspects of Entrepreneurship. The American Economic Review, 79:519-535.
Frölich,M. (2007): Propensity score matching without conditional independence assump-tion – with an application to the gender wage gap in the UK. Econometrics Journal, 10:359-407.
35
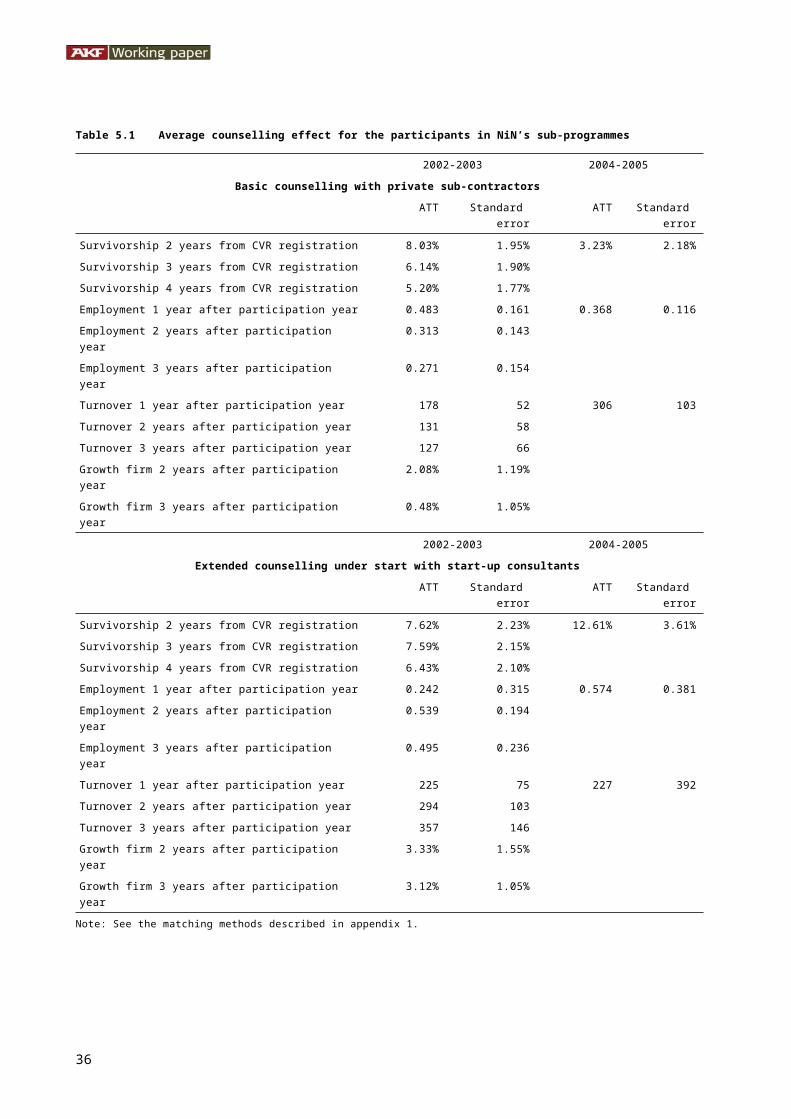
Glancey, K.S. & R.W. McQuaid (2000): Entrepreneurial Economics. New York: St. Martin’s Press.
Goetz, S.J. (2006): The Place-Based Structural Determinants and Effects of Self-Employ-ment. Final Report to the Ewing Marion Kauffman Foundation.
Hart, D.M. (2003): Emergence of Entrepreneurship Policy. Cambridge University Press.
Heckman, J. (1979): Sample selection bias as a specification error. Econometrica, 12:1-144.
Heckman J. & S. Navarro-Lozano (2004): Using Matching, Instrumental Variables, and Control Functions to Estimate Economic Choice Models. Review of Economics and Statistics, 86(1):30-57.
Imbens, G.W. (2004): Nonparametric Estimation of Average Treatment Effects under Exo-geneity: A Review. Review of Economics and Statistics, 86(1):4-29.
Imbens, G.W. & J.M. Wooldridge (2009): Recent Developments in the Econometrics of Pro-gram Evaluation. IZA.
Imbens, G.W. & J.M. Wooldridge (2009): Recent developments in econometrics of program evaluation. Journal of Economic Literature, 47:5-86.
Iversen, J.; N. Malchow-Møller & A. Sørensen (2006): Returns to Schooling in Self-Employ-ment – Where are they? DP 2006-19, Centre for Economic and Business Research, Copenhagen Business School.
Jansen, D. & M. Weber (2004): Helping Hands and Entrepreneurship – Supporting Newly Founded Firms. In M. Dowling, J. Schmude and D.Z. Knyphausen-Aufsess (eds.): Ad-vances in Interdisciplinary European Entrepreneurship Research . New Brunswick, NJ: Transaction Publishers.
Keister, L.A. (2000): Wealth in America: Trends in Wealth Inequality. Cambridge, Cam-bridge University Press.
Lechner, M.; R. Miquel & C. Wunsch (2006): Long-run effects of public sector sponsored training in West Germany. Revised version of Discussion Paper 2004-19, Department of Economics, University of St. Gallen.
Malchow-Møller, N.; B. Schjerning & A. Sørensen (2009a): Entrepreneurship, Job Cre -ation, and Wage Growth. Forthcoming in Small Business Economics.
Malchow-Møller, N., J.R. Markusen & J.R. Skaksen (2009b): Labour Market Institutions, Learning, and Self-Employment. Forthcoming in Small Business Economics.
Mokry, B.W. (1988): Entrepreneurship and Public Policy: Can Government Stimulate Busi-ness Startups? Westport, CT: Quorum Books.
36

OECD (2007): OECD Framework for the Evaluation of SME and Entrepreneurship Policies and Programmes. OECD Publishing.
Peake, O. & M.I. Marshall (2006): What do We Really Know about Entrepreneurs? An Ana-lysis of Nascent Entrepreneurs in Indiana. Working Paper # 06-14, Department of Ag-ricultural Economics, Purdue University.
Poschke, M. (2008): Who Becomes an Entrepreneur? Labor Market Prospects and Occupa-tional Choice. IZA DP No. 3816.
Reynolds, P.D.; M. Hay & S.M. Camp (2000): Global Entrepreneurship Monitor: 1999. Kan-sas City, MO: Kauffman Center for Entrepreneurial Leadership.
Rosenbaum P. & D.B. Rubin (1983): The Central Role of the Propensity Score in Observa -tional Studies for Causal Effects. Biometrica, 70:41-55.
Storey, D. (2000): Six Steps to Heaven: Evaluating the Impact of Public Policies to Support Small Business in Developed Economies. In D.L. Sexton & H. Landstrom: The Black-well Handbook of Entrepreneurship. Oxford Blackwell Publishers.
Storey, D. (2003): Entrepreneurship, Small and Medium Sized Enterprises and Public Policies. In Z.J. Acs & D.B. Audretsch (eds.): Handbook of Entrepreneurship Research. Kluwer Academic Publishers: 473-511.
Thurik, A.R. (1999): Entrepreneurship, Industrial Transformation and Growth. In G.D. Libecap: The Sources of Entrepreneurial Activity. Greenwich, CT: JAI Press.
Timmons, J.A. (1999): New Venture Creation: Entrepreneurship for the 21st Century. Bo-ston: Irwin McGraw-Hill.
Wagner, J. (2004): Nascent Entrepreneurs. IZA Discussion Paper Series No. 1293.
Wooldridge, J.M. (2002): Econometric Analysis of Cross Section and Panel Data. Mas-sachusetts Institute of Technology.
Wren, C. & D.J. Storey (2002): Evaluating the effect of soft business support upon small firm performance. Oxford Economic Papers, 54(2):334-365.
Yusuf, J.-E. Wie (2007): The Effectiveness of Entrepreneurial Start-up Assistance Pro-grams: Evidence from the U.S. Panel Study of Entrepreneurial Dynamics . PhD disser-tation, Martin School of Public Policy and Administration, University of Kentucky.
Zacharakis, A.L.; P.D. Reynolds & W.D. Bygrave (2001): Global Entrepreneurship Monitor, United States of America, 2001 Executive Report. Kansas City, MO: Kauffman Center for Entrepreneurial Leadership.
37

Dansk resumé
BaggrundNordjysk iværksætter Netværk (NiN), som er en enhed koordineret af Væksthus Nordjylland i samarbejde med de lokale erhvervskontorer, tilbyder hvert år rådgivning til omkring 1200 iværksættere og små og mellemstore virksomheder. NiN har et årligt budget på omkring 5,4 millioner kroner (2009-priser), som delvist finansieres af EU’s regionalfond.
Denne evaluering fokuserer på to af NiN’s kerneydelser, nemlig basisrådgivning før start hos private rådgivere samt udvidet rådgivning under og umiddelbart efter virksomhedsstart.
AKF, Anvendt KommunalForskning, er blevet bedt om at gennemføre en statistisk evaluering af betydningen af disse programmer med henblik på at måle deres effekt på nye virksomheders overlevelse, størrelse og vækst. AKF’s evaluering peger også på en række muligheder for yderligere at målrette programmerne til brugerne.
Evalueringen skelner mellem udbyttet af rådgivning mv. i to separate perioder, nemlig 2002-2003 og 2004-2005. Det skyldes, at der skete nogle ændringer i programmerne ved starten af 2004.
HovedresultaterHovedresultaterne for 2002-2003-årgangen er:
1 Basisrådgivning fra private rådgivere øgede overlevelsesraten for nye virksomheder. Overlevelsen to år efter deltagelse var 8% højere for deltagere, overlevelsesraten var 6% højere tre år efter deltagelse, mens fireårsoverlevelsen var 5% højere for virksomheder, der havde deltaget i programmerne.
2 Basisrådgivning øgede også jobskabelse og omsætning. Konkret havde virksomheder, der deltog, i alt skabt 165 ekstra nye job, mens den gennemsnitlige omsætning var 127.000 kroner højere for deltagervirksomheder end for tilsvarende ikke-deltagervirksomheder. De positive programeffekter på jobskabelse og omsætning er imidlertid faldende i årene efter deltagelse.
3 Basisrådgivning havde ingen signifikant betydning for væksten i iværksættervirksomhederne.
4 Udvidet rådgivning under og efter starten øgede yderligere overlevelsessandsynligheden to og tre år efter start med 7,6%, mens overlevelsen fire år efter deltagelse var 6,4% højere i deltagervirksomheder i forhold til tilsvarende virksomheder, der ikke havde deltaget.
5 Udvidet rådgivning under og efter start bidrog yderligere til jobskabelse og omsætning.
6 I modsætning til basisrådgivning, betød udvidet rådgivning under og efter start højere vækstrater for deltagervirksomhederne. Konkret betød det, at rådgivning under start bidrog til, at 3% flere nye virksomheder blev vækstvirksomheder, hvilket betyder, at andelen af virksomheder med en vækst i løbet af de første tre år er på mindst 20%.
38

Hovedresultater for 2004-2005-årgangen er:7 Basisrådgivning øgede overlevelsesraten efter et år med 3%. Overlevelsesrater to
og tre år efter deltagelse kan ikke beregnes, da data for de seneste år endnu ikke er til rådighed.
8 Basisrådgivning betød højere beskæftigelse og omsætning for nye virksomheder et år efter deltagelse.
9 Udvidet rådgivning under start øgede overlevelseschancen et år efter deltagelse med 12%.
10 Udvidet rådgivning under start havde ikke nogen signifikant effekt på beskæftigelse og omsætning et år efter deltagelse.
For begge grupper under ét finder vi:11 Overlevelsessandsynligheden var højere end gennemsnittet for virksomheder i
byggeriet samt hotel- og restaurationssektoren.12 Overlevelsessandsynligheden var højere for virksomheder, der havde registreret
deres nye virksomheder i CVR-registret (Det centrale virksomhedsregister), før de modtog rådgivning, og overlevelsen var tilsvarende lavere for de virksomheder, som registrerede deres nye virksomheder i løbet af eller efter rådgivningsforløbet.
13 Overlevelsessandsynligheden var højere blandt de virksomheder, der fuldt ud benyttede sig af NiN’s rådgivningstilbud, og tilsvarende lavere for de virksomheder, der valgte at afbryde rådgivningsforløbet før, de havde udnyttet rådgivningstilbuddet fuldt ud.
14 Overlevelsessandsynligheden var ikke specielt påvirket af iværksætternes socioøkonomiske karakteristika såsom uddannelse, alder, erfaring og køn.
Fortolkning af resultaterEvalueringen peger på, at NiN’s rådgivningsprogrammer til iværksættere har en positiv betydning for, hvordan brugerne af NiN klarer sig. Evalueringen anvender nye og sofistikerede metoder til at belyse sammenhængen mellem programmerne og de målsætninger, der var formuleret for programmet. Dermed sikres det, at politikere og beslutningstagere får det bedst mulige grundlag for at prioritere og træffe beslutninger vedrørende dette eller lignende programmer.
Analysen påpeger, at der er nogle klare forskelle mellem virksomheder, der deltog i perioden 2002-2003, og virksomheder, der deltog i 2004-2005. Disse forskelle kan forklares ved to forhold. For det første gennemførtes med start fra 2004 en ændring i programmet i form af en ”entrébillet” på 500 kroner som brugerbetaling for at deltage i programmet. For det andet skete der en ændring i, hvilke typer virksomheder der deltog i programmet. For eksempel finder vi, at de virksomheder, som deltog i basisrådgivning i 2004-2005, havde en lavere sandsynlighed for at have registreret deres virksomhed i CVR-registret end de iværksættere, som deltog i 2002-2003. Dette billede hænger fint sammen med punkt 12 ovenfor, hvoraf det fremgik, at overlevelsessandsynligheden var højere for virksomheder, der havde registreret deres virksomhed, før de opsøgte rådgivning. Virkningen af denne regelændring kan således delvis forklare de lavere overlevelsesrater et år efter virksomhedsstart for 2004-2005-årgangene, som opsøger basisrådgivning, samt den højere effekt på overlevelse for den del af 2004-2005-årgangene, som deltog i udvidet
39

rådgivning under start. Vores fortolkning af dette er, at der muligvis er nogle iværksættere, som vil vælge at udsætte deres beslutning om registrering, indtil de har modtaget basisrådgivning. Imidlertid kan det samtidig tænkes, at ”entrébilletten” vil afskrække nogle af de iværksættere, som er i tvivl om, hvorvidt deres idé holder. Det betyder, at kun de mest selvsikre og overbeviste iværksættere anvender udvidet rådgivning under start, hvilket muligvis kan forklare de høje overlevelsesrater for udvidet rådgivning.
En anden væsentlig forskel mellem 2002-2003-årgangene og 2004-2005-årgangene relaterer sig til andelen af iværksættere, som forventer at starte nyt firma i bygge- og anlægssektoren (18% i 2002-2003 mod 26% i 2004-2005). 9% af deltagerne havde i 2002-2003 tidligere erfaring fra byggeriet. I 2004-2005 havde 10% af deltagerne i basisrådgivning tidligere erfaring fra bygge- og anlægssektoren, mens 16% af deltagerne i udvidet rådgivning under start havde lignende erfaring. Der var således i 2004-2005 en voksende interesse for at starte ny virksomhed i bygge- og anlægssektoren, hvilket også tiltrak iværksættere uden tidligere erfaring fra byggebranchen. Brancheskift kan imidlertid være vanskeligt. Det ser ud til at have en negativ betydning for iværksætteres udbytte af deltagelse i den tidlige fase af programmet, nemlig basisrådgivning. Derimod ser det ud til, at brancheskift ikke påvirker udbyttet af deltagelse for de iværksættere, som fortsætter til udvidet rådgivning under start. Alt i alt er gennemsnitseffekten af udvidet rådgivning under start højere i 2004-2005 end i 2002-2003 på grund af den højere andel af iværksættere, der ønsker at starte i bygge- og anlægssektoren, der generelt har haft det største udbytte af deltagelse i NiN-programmet.
Endelig finder vi, at det at have registreret sin virksomhed før deltagelse i basisrådgivning har betydning for, hvor stort udbyttet er af rådgivning. I gennemsnit ser det således ud til, at virksomheder, som deltog i NiN’s program i 2002-2003, var bedre forberedt til programmet, idet tidsperioden mellem CVR-registrering og deltagelse i rådgivningsprogrammet i gennemsnit var længere i 2002-2003 end i 2004-2005.
Policy-anbefalinger Alt i alt er rådgivningsprogrammerne – både basisrådgivning og udvidet rådgivning –
effektive i forhold til at forbedre iværksætternes økonomiske præstationer. Resultaterne af evalueringen kan således give anledning til overvejelser om at indføre lignende programmer i andre regioner, der ligner Nordjylland med hensyn til arbejdsstyrke og erhvervsstruktur.
Denne evaluering udpeger to grupper af iværksættere, der især ser ud til at have højt udbytte af deltagelse i rådgivning. Det gælder for det første virksomheder, som fuldt ud udnytter deres rådgivningstilbud. Og det gælder for det andet de virksomheder, der er velforberedte før programdeltagelse, hvilket bl.a. aflæses af, at de har registreret deres virksomhed i CVR-registret. Vi foreslår derfor, at beslutningstagere i systemet forsøger at målrette indsatsen mod disse grupper af iværksættere.
Nogle iværksættere ønsker at starte ny virksomhed i en branche, hvorfra de har ingen eller kun lidt tidligere erhvervserfaring. Basisrådgivning til denne type iværksættere kunne forbedres, bl.a. kunne det være gavnligt med en forbedret indledende vurdering af, hvorvidt deres forudsætninger fra tidligere joberfaring er tilstrækkelige til at sikre en tilfredsstillende udvikling for dem i en ny branche.
40

Endelig er det værd at bemærke, at virksomheder i bygge- og anlægsbranchen samt turismeerhvervet i løbet af den observerede periode havde særligt høje overlevelsesrater. Det kan tænkes, at netop disse sektorer har klaret sig noget dårligere under den seneste økonomiske krise. Dette understreger behovet for en løbende overvågning af udviklingen især i forhold til overlevelsesraterne for iværksættere, der deltog i rådgivning i 2004-2005.
41

APPENDIX 1. Matching EstimatorIn this paper we use matching based primarily on the propensity score. Concretely, in the case of basic counselling we use propensity score matching, while we in the case of start-up assistance include additional covariates in order to make the method robust to possible misspecifications of the propensity score in a similar way like Lechner et al. (2006) and Behncke et al. (2008). Concretely, in the case of start-up counselling during the period 2002-2003 we include in the balancing score covariates “income one year before participa -tion” and “time from CVR registration to participation”, while in the case of start-up coun -selling during the period 2004-2005 we include the covariates “unemployment one year before participation” and “Hadsund residence one year before participation”.
Given the moderate size of the control sample we use radius kernel matching, and combine the matching method with bias adjustment with regression in order to prevent bias due to remaining differences between covariate distributions. The standard error is estimated with the method proposed by Abadie & Imbens (2006). We now describe the de-tails of the two methods used in the paper.
Step 1. Propensity score estimationThe propensity score is a probit model estimated by maximum likelihood, from which we obtain the predicted participation probabilities
pi=Pr (T i=1|X i )
for each treated and each control observation.
Step 2. Sample trimming
Those treated and control observations with pi larger than 0.9 or pi smaller than 0.1 are deleted to avoid limited overlap (see Crump et al. 2008), and improve the precision of the estimator.
Step 3. Determining neighboursa. Matching on the propensity score
For each treated observation we find the first nearest control observation in terms of the propensity score. We pick up the radius that guarantees no significant treatment effect on each single covariate at 10% level. For those treated observations with nearest control outside radius we pick up the nearest neighbour, for remaining treated observations we use all control observations within the radius where we weight them according to a triangular kernel.
b. Matching on the propensity score and additional covariatesIn the case of 2002-2003 start-up assistance, we are not able to eliminate on the basic of the propensity score alone, the imbalance in terms of the covariates Days between CVR registration and participation and Income one year before participation. While in the case of 2004-2005 start-up assistance propensity score matching does not reduce the difference in terms of Entrepreneur is unemployed one year before participation
42

and Hadsund residence. Therefore, as is done in Behncke et al. (2008) we use these covariates together with the propensity score to construct a balancing score based on Mahalanobis distance. Concretely, for each treated observation we find the first nearest control observation in terms of the Mahalanobis distance δ i=min M i(X i−X j):
M i(X i−X j)=( pi− p j , (~X i−~X j )
' )Ω−1 ( p i− p j , (~X i−~X j)
')'.where we use pi and the two additional covariates, denoted ~X , and where Ω is the sample covariance matrix of X at the control sample. Differently from Behncke et al. (2008), the propensity score is not dominated by the covariates, and therefore we do not modify Ω . As in the case of propensity score matching, we pick up the radius that guarantees no significant treatment effect on each single covariate at 10% level. For those treated observations with the nearest control outside radius we pick up the nearest neighbour in terms of Mahalanobis distance, for remaining treated observa-tions we use all control observations within the radius.
Step 4. Initial estimation of average treatment effect for the treated
We calculate A T T 0 with radius kernel matching:
A T T 0=N1−1 ∑
i :T =1¿¿¿
where Y i (1 )=Y i and
Y i (0 )=∑
j : T=0
❑
Y j ∙Kh(M (X i−X j))
∑j :T =0
❑
Kh(M (X i−X j))
where Kh is a kernel function and M (X i−X j) is the Mahalanobis distance between X i and X j, where in case of basic counselling X= p, and in the case start-up assistance X=¿ where ~X denotes the additional covariates.
The estimator can also be written in terms of weighted averages of outcomes:
A T T 0=N1−1 ∑
i :T =1
❑
Y i− ∑i :T =0
❑
ω iY i
where
ωi=N 1−1 ∑
j : T=0
❑
Kh ¿¿¿
43

Step 5. Bias adjustment and final estimation of average treatment effect for the treatedIn order to adjust possible bias arising due to remaining covariate differences between the treated and matched control sample, we correct the initial estimate A T T 0 according to the method proposed by Imbens (2004):
A T T=A T T 0+(N 1−1 ∑
i : T=1
❑
X i− ∑i :T =0
❑
ωi X i)'
β0,
where β0 is obtained by weighted regression of outcomes Y i on X i in the control sample
where the weights are the same than those used to construct A T T 0, and X i includes the propensity score in the case of basic counselling and the propensity score and additional covariates in the case of extended start-up counselling. By using a regression weighted by ωi we are excluding those control observations which are not neighbours of any treated observations.
Step 6. Non-parametric estimation of the variance of A T TThe variance of A T T is estimated with the method proposed by Abadie & Imbens (2006):
Var ( A T T )=N1−2 ∑
i :T =1σ1
2 ( X i )+ ∑i : T=0
ωi2 σ0
2 (X i )
where the weights are treated as given and N1−1 ∑
i :T =1
❑
Y i and ∑i :T =0
❑
ω0 iY i are obtained from in-
dependent samples. The conditional variance σ 12 ( X i) is estimated by matching within the
treatment group with the method of one nearest neighbour based on the propensity score:
σ 12 (X i)=
(Y i−Y nn (i ))2
2
so that, in this case, each treated observation is matched to the ‘closest’ treated observa -tion, and the associated outcomes are used to estimate σ 1
2 ( X i). The same method is used to
estimate σ 02 ( X i ), where in this case each control observation is matched to its nearest
neighbour control observation. The bias adjustment () does not affect the variance of A T T and therefore is not taken into account to estimate the variance (see Abadie & Imbens 2006).
44

APPENDIX 2. Additional TablesTable A1: Probit estimates for propensity score (basic counselling with private sub-contractors)
2002-2003 2004-2005All sample Trimmed sample All sample Trimmed sample
Number of treated entrepreneurs 609 94% 556 94%Number of control entrepreneurs 467 99% 465 99%
Coefficient Standard error
Coefficient Standard error
Constant -0.30 0.43 0.73 0.45 *Characteristics of nascent entrepreneur
Age -0.01 0.01 0.00 0.01Woman -0.05 0.11 0.06 0.12Partner one year before 0.15 0.15 0.13 0.12Number of children at age 0 one year be-fore
-0.15 0.18 -0.15 0.18
Number of children at age 1-2 one year before
-0.20 0.15 0.00 0.14
Number of children at age 3-6 one year before
0.15 0.09 * 0.12 0.09
Number of children at age 7-10 one year before
-0.02 0.09 -0.06 0.09
Woman with children at age 0-2 one year before
0.26 0.21 0.00 0.19
Foreign born one year before 0.08 0.19 -0.06 0.21Outside North Jutland residence one year before
0.11 0.24 0.09 0.23
Arden residence one year before 0.00 0.32 0.45 0.45Brovst residence one year before 0.45 0.29 -0.36 0.31Brønderslev residence one year before 0.13 0.23 -0.24 0.24Dronninglund residence one year before -0.04 0.26 -0.50 0.39Farsø residence one year before 1.21 0.43 *** -0.37 0.36Fjerritslev residence one year before 0.31 0.34 0.48 0.33Frederikshavn residence one year before 0.74 0.26 *** 0.37 0.25Hadsund residence one year before 0.60 0.37 * 0.78 0.37 **Hirtshals residence one year before 0.80 0.43 * 0.77 0.48 *Hjørring residence one year before 0.65 0.25 *** 0.24 0.22Hobro residence one year before 0.77 0.29 *** 0.16 0.29Løgstør residence one year before 0.48 0.31 0.49 0.38Nibe residence one year before 0.20 0.32 0.20 0.39Pandrup residence one year before 0.31 0.35 0.00 0.32Sindal residence one year before -0.48 0.35 0.20 0.33Skagen residence one year before 1.17 0.33 *** -0.46 0.31Støvring residence one year before -0.14 0.30 -0.68 0.36 *Sæby residence one year before 0.54 0.28 ** -0.12 0.26Åbybro residence one year before 0.78 0.28 *** 0.15 0.29
45

Aalborg residence one year before 0.18 0.18 -0.11 0.17Aars residence one year before 0.59 0.41 -0.43 0.34Basic school or preparatory education one year before
-0.11 0.20 -0.15 0.20
Upper secondary education one year be-fore
-0.06 0.25 -0.11 0.27
Vocational secondary education or basic training one year before
0.35 0.30 -0.40 0.32
Trade or office education one year before -0.04 0.21 -0.11 0.23Iron and metal or supplementary educa-tion one year before
0.04 0.20 0.01 0.20
Short high education one year before 0.05 0.25 -0.44 0.25 *Medium high education one year before 0.00 0.24 0.08 0.24Bachelor or Long high education or re-search one year before
-0.24 0.26 -0.17 0.28
Raw Materials Extraction one year before 0.95 0.34 *** 0.02 0.30Industry I one year before 0.14 0.17 0.14 0.23Industry II one year before -0.01 0.18 -0.16 0.18Industry III one year before 0.05 0.25 0.14 0.26Construction one year before 0.00 0.19 -0.21 0.19Hotel or restaurant one year before -0.11 0.22 -0.21 0.24Transport firm one year before 0.20 0.22 -0.03 0.21Finance, credit or real estate one year before
-0.09 0.16 -0.11 0.16
Public administration or teaching one year before
-0.13 0.20 0.10 0.18
Health care or Welfare one year before -0.04 0.19 -0.24 0.16Other services one year before 0.01 0.19 -0.29 0.24Experience one year before 0.01 0.02 -0.02 0.02Experience2 one year before 0.00 0.00 0.00 0.00Primary employer 2 years before -0.10 0.33 0.75 0.55Primary employer one year before 0.40 0.24 * 0.14 0.35Secondary employer one year before 0.54 0.42 0.61 0.63Unemployed one year before 0.02 0.17 0.32 0.15 **Secondary job one year before -0.12 0.11 0.11 0.12Student one year before 0.09 0.15 -0.26 0.16 *Earnings one year before 0.00 0.00 0.00 0.00 *Income one year before 0.00 0.00 0.00 0.00Income two years before 0.00 0.00 0.00 0.00Assets one year before 0.00 0.00 0.00 0.00Liabilities one year before 0.00 0.00 0.00 0.00Partner is employer one year before -0.18 0.24 -0.39 0.25Partner's income one year before 0.00 0.00 0.00 0.00Partner's assets one year before 0.00 0.00 0.00 0.00Partner's liabilities one year before 0.00 0.00 * 0.00 0.00
46

Characteristics of participation in NiN counsellingExpected raw materials extraction -0.36 0.31 -0.26 0.30Expected industry I -0.22 0.18 0.05 0.23Expected industry II -0.20 0.52Expected industry III -0.06 0.34Expected construction 0.00 0.14 0.29 0.14 **Expected hotel. restaurant 0.13 0.18 0.30 0.19Expected transport firm -0.06 0.24 -0.15 0.25Expected finance, credit, real estate 0.02 0.13 -0.01 0.15Expected public administration, teaching 0.14 0.29 0.52 0.27 **Expected health care, welfare 0.55 0.23 *** 0.00 0.20Expected other services -0.10 0.16 0.02 0.182002/2004 participation 0.08 0.09 -0.34 0.09 ***February participation -0.15 0.25 -0.03 0.22March participation 0.11 0.19 0.29 0.21April participation 0.00 0.23 0.12 0.25May participation 0.00 0.22 0.06 0.22June participation -0.02 0.22 0.43 0.23 *July participation -0.30 0.25 0.22 0.30August participation -0.15 0.22 0.16 0.22September participation -0.03 0.22 0.29 0.22October participation -0.09 0.22 0.10 0.23November participation -0.33 0.22 0.32 0.21December participation 0.05 0.21 0.25 0.24Days between CVR registration and parti-cipation
0.01 0.00 * 0.05 0.02 **
Days between CVR registration in a new sector and participation
-0.01 0.02
Days between CVR registration as sole prop. firm and participation
0.00 0.00 0.00 0.01
Days between CVR registration and Janu-ary participation
0.00 0.01
Days between CVR registration and Febru-ary participation
-0.03 0.02
Days between CVR registration and March participation
0.09 0.13
Days between CVR registration and April participation
0.00 0.00 -0.02 0.02
Days between CVR registration and May participation
0.02 0.01 * -0.04 0.02 **
Days between CVR registration and June participation
-0.01 0.01 -0.05 0.02 ***
Days between CVR registration and July participation
0.03 0.02 **
Days between CVR registration and August participation
0.00 0.01 -0.03 0.02 *
Days between CVR registration and September participation
-0.02 0.02
47

Days between CVR registration and November participation
-0.03 0.02 *
Quarterly Local unemployment rate -0.01 0.04 -0.07 0.04 **Notes: Industry I includes food, beverage, tobacco, textile, leather, wood, paper, graphic; industry II includes mineral,
oil, chemical, rubber, plastic, stone, clay, glass, iron, metal; industry III includes machinery, electronic, vehicles, furniture. Maximum Likelihood estimates of the probit model. Robust Standard Errors. *** indicates significance at 1%, ** indicates significance at 5%, and * indicates significance at 10%.
Table A2: Probit estimates for propensity score (extended start-up counselling)
2002-2003 2004-2005All sample Trimmed sample All sample Trimmed sample
Number of treated entrepreneurs 608 91% 464 95%Number of control entrepreneurs 609 87% 556 94%
Coefficient Standard error
Coefficient Standard error
Constant -1.60 0.45 *** -2.14 0.47 ***Characteristics of nascent entrepreneur
Age 0.00 0.01 0.00 0.01Woman 0.03 0.11 0.12 0.12Partner one year before -0.14 0.14 0.06 0.12Number of children at age 0 one year before 0.27 0.15 * 0.04 0.18Number of children at age 1-2 one year be-fore
0.34 0.14 ** -0.04 0.14
Number of children at age 3-6 one year be-fore
0.01 0.08 0.00 0.08
Number of children at age 7-10 one year be-fore
-0.16 0.09 * -0.01 0.09
Woman with children at age 0-2 one year be-fore
-0.15 0.18 0.20 0.19
Foreign born one year before -0.04 0.22 0.02 0.23Outside North Jutland residence one year be-fore
0.27 0.25 0.26 0.23
Arden residence one year before 0.20 0.31 0.56 0.32 *Brovst residence one year before -1.61 0.44 *** -1.16 0.60 **Brønderslev residence one year before -0.75 0.30 ** -0.12 0.30Dronninglund residence one year before -0.51 0.33 0.97 0.36 ***Farsø residence one year before -0.35 0.40 -0.34 0.44Fjerritslev residence one year before 0.22 0.31 -0.23 0.29Frederikshavn residence one year before 0.12 0.28 0.02 0.26Hadsund residence one year before 0.92 0.29 *** 0.72 0.25 ***Hirtshals residence one year before 0.58 0.34 * 0.00 0.34Hjørring residence one year before -0.02 0.26 0.24 0.21Hobro residence one year before 0.10 0.27 0.25 0.26Løgstør residence one year before -0.29 0.31 0.03 0.32Nibe residence one year before 0.04 0.34 -0.30 0.45Pandrup residence one year before 0.19 0.36 0.65 0.29 **Sindal residence one year before 0.59 0.36 0.39 0.32
48

Skagen residence one year before -1.40 0.46 *** -0.70 0.49Støvring residence one year before 0.55 0.32 * -0.04 0.43Sæby residence one year before 0.06 0.29 0.47 0.26 *Åbybro residence one year before -1.01 0.33 *** -0.50 0.33Aalborg residence one year before 0.25 0.21 0.04 0.18Aars residence one year before 0.13 0.35 0.34 0.36Basic school or preparatory education one year before
-0.31 0.19 * -0.06 0.19
Upper secondary education one year before 0.28 0.25 0.22 0.28Vocational secondary education or basic training one year before
-0.15 0.27 0.65 0.30 **
Trade or office education one year before -0.09 0.19 0.22 0.21Iron and metal or supplementary education one year before
-0.18 0.18 -0.11 0.18
Short high education one year before 0.05 0.22 0.27 0.24Medium high education one year before 0.04 0.23 -0.08 0.23Bachelor or Long high education or research one year before
0.31 0.24 -0.01 0.27
Raw Materials Extraction one year before -0.31 0.30 -0.29 0.40Industry I one year before -0.39 0.16 ** 0.03 0.23Industry II one year before -0.16 0.17 0.13 0.19Industry III one year before 0.18 0.20 -0.17 0.27Construction one year before -0.16 0.17 0.46 0.18 ***Hotel or restaurant one year before -0.52 0.23 ** 0.40 0.25Transport firm one year before -0.41 0.22 * -0.32 0.24Finance, credit or real estate one year before -0.12 0.15 0.15 0.17Public administration or teaching one year before
-0.23 0.19 0.17 0.17
Health care or Welfare one year before -0.37 0.19 * -0.21 0.18Other services one year before -0.33 0.20 * 0.78 0.23 ***Experience one year before 0.03 0.02 0.03 0.02 Experience2 one year before 0.00 0.00 0.00 0.00Primary employer two years before 0.57 0.34 * 0.04 0.41Primary employer one year before 0.28 0.22 0.06 0.33Secondary employer one year before -0.20 0.33 -0.65 0.60Unemployed one year before 0.02 0.19 0.10 0.16Secondary job one year before -0.02 0.11 -0.10 0.12Student one year before 0.40 0.15 *** 0.03 0.18Earnings one year before 0.00 0.00 * 0.00 0.00Income one year before 0.00 0.00 0.00 0.00Income two years before 0.00 0.00 * 0.00 0.00 ***Assets one year before 0.00 0.00 0.00 0.00Liabilities one year before 0.00 0.00 0.00 0.00Partner is employer one year before 0.16 0.21 0.05 0.27Partner's income one year before 0.00 0.00 0.00 0.00 ***
49

Partner's assets one year before 0.00 0.00 0.00 0.00 ***Partner's liabilities one year before 0.00 0.00 0.00 0.00 ***Characteristics of participation in NiN coun-sellingExpected raw materials extraction 0.48 0.29 * 0.01 0.35Expected industry I 0.07 0.17 0.10 0.22Expected construction 0.15 0.13 0.01 0.14Expected hotel, restaurant 0.27 0.18 0.16 0.19Expected transport firm 0.05 0.26 -0.26 0.31Expected finance, credit, real estate 0.04 0.13 0.16 0.15Expected public administration, teaching 0.39 0.25 0.24 0.26Expected health care, welfare 0.51 0.19 *** 0.34 0.20 *Expected other services 0.08 0.17 -0.24 0.202002/2004 participation 0.10 0.09 0.17 0.09 *February participation 0.00 0.23 0.31 0.22March participation -0.12 0.18 -0.05 0.22April participation -0.05 0.22 0.12 0.25May participation -0.18 0.22 0.15 0.23June participation 0.09 0.21 -0.13 0.23July participation 0.22 0.24 0.05 0.30August participation -0.10 0.21 -0.13 0.23September participation 0.04 0.20 -0.02 0.22October participation 0.24 0.20 0.02 0.23November participation 0.05 0.21 -0.42 0.23 *December participation 0.31 0.19 * -0.02 0.24Hours NiN basic counselling by sub-suppliers 0.32 0.05 *** 0.17 0.04 ***Days between CVR registration and particip-ation
0.08 0.04 * 0.00 0.00
Days between CVR registration in a new sec-tor and participation
0.01 0.01 ** 0.00 0.00
Days between CVR registration as sole prop. firm and participation
0.02 0.01 *** 0.01 0.00
Days between CVR registration and January participation
-0.11 0.05 **
Days between CVR registration and March participation
-0.11 0.04 ** 0.03 0.01 ***
Days between CVR registration and April par-ticipation
-0.12 0.04 *** -0.01 0.01
Days between CVR registration and May par-ticipation
-0.11 0.04 ** 0.00 0.01
Days between CVR registration and June par-ticipation
-0.12 0.05 *** 0.04 0.02 *
Days between CVR registration and July parti-cipation
-0.11 0.04 **
Days between CVR registration and August participation
-0.11 0.04 **
Days between CVR registration and October participation
-0.13 0.05 *** 0.00 0.01
50

Days between CVR registration and Novem-ber participation
-0.10 0.04 ** 0.00 0.00
Quarterly local unemployment rate 0.03 0.05 0.04 0.03Note: See notes in table A1.
51

Table A3: Matching quality (basic counselling with private sub-contractors, 2002-2003)
Mean of treated group in covariate X k
Normalised mean dif-ference in covariate X k between treated and control group
Normalised mean dif-ference in covariate X k between treated and matched control group
t-test for insignific-ant treat-ment ef-fect on co-variate X k
Characteristics of nascent entrepreneurAge 34.29 11.23 0.25 0.03Woman 0.34 -3.58 3.23 0.40Partner one year before 0.66 9.43 -3.41 -0.52Number of children at age 0 one year before 0.07 -0.99 4.20 0.65Number of children at age 1-2 one year before 0.12 -2.44 -2.30 -0.26Number of children at age 3-6 one year before 0.27 12.67 -2.96 -0.27Number of children at age 7-10 one year before 0.24 4.70 -1.59 -0.19Woman with children at age 0-2 one year before 0.07 -0.23 -1.76 -0.18Foreign born one year before 0.06 -3.12 6.65 1.29Outside North Jutland residence one year before 0.05 -6.14 4.44 0.75Arden residence one year before 0.02 -7.11 0.33 0.06Brovst residence one year before 0.04 5.75 2.55 0.33Brønderslev residence one year before 0.06 -7.13 0.94 0.18Dronninglund residence one year before 0.03 -9.25 -0.74 -0.13Farsø residence one year before 0.01 7.17 4.41 0.53Fjerritslev residence one year before 0.02 5.55 4.70 0.50Frederikshavn residence one year before 0.08 15.04 -10.56 -0.86Hadsund residence one year before 0.02 2.31 -0.36 -0.05Hirtshals residence one year before 0.01 5.03 0.12 0.02Hjørring residence one year before 0.06 9.82 -6.77 -0.75Hobro residence one year before 0.03 10.13 4.80 0.64Løgstør residence one year before 0.03 6.61 -12.29 -0.90Nibe residence one year before 0.02 -1.69 1.41 0.23Pandrup residence one year before 0.02 -0.17 -2.69 -0.33Sindal residence one year before 0.01 -11.06 -1.33 -0.25Skagen residence one year before 0.04 16.94 -1.85 -0.11Støvring residence one year before 0.02 -9.57 1.24 0.28Sæby residence one year before 0.04 7.10 3.50 0.46Åbybro residence one year before 0.04 12.41 5.92 0.70Aalborg residence one year before 0.26 -11.58 2.39 0.39Aars residence one year before 0.02 6.91 3.77 0.47Basic school or preparatory education one year before 0.23 -7.65 -0.79 -0.10Upper secondary education one year before 0.05 -7.00 2.41 0.45Vocational secondary education or basic training one year before
0.03 5.23 1.19 0.16
Trade or office education one year before 0.16 3.46 -4.58 -0.49
52

Mean of treated group in covariate X k
Normalised mean dif-ference in covariate X k between treated and control group
Normalised mean dif-ference in covariate X k between treated and matched control group
t-test for insignific-ant treat-ment ef-fect on co-variate X k
Iron and metal or supplementary education one yearBefore
0.24 9.11 -0.17 -0.02
Short high education one year before 0.06 2.61 0.77 0.10Medium high education one year before 0.09 4.88 -0.93 -0.12Bachelor or long high education or research one yearBefore
0.06 -12.67 1.22 0.21
Raw Materials Extraction one year before 0.02 7.76 0.60 0.06 Industry I one year before 0.09 6.14 1.14 0.13 Industry II one year before 0.08 3.03 8.61 1.41 Industry III one year before 0.04 5.02 -11.11 -1.34 Construction one year before 0.09 5.92 -4.50 -0.47 Hotel or restaurant one year before 0.05 -1.01 -4.36 -0.44 Transport firm one year before 0.05 6.00 0.63 0.08 Finance, credit or real estate one year before 0.10 -8.14 2.44 0.41 Public administration or teaching one year before 0.07 -1.10 -2.81 -0.35 Health care or welfare one year before 0.08 -0.35 -1.54 -0.18 Other services one year before 0.06 1.78 2.38 0.34Experience one year before 11.24 21.77 -5.34 -0.66 Experience2 one year before 188.85 18.31 -4.85 -0.52Primary employer two years before 0.02 -0.45 1.57 0.23Primary employer one year before 0.05 4.88 0.12 0.01Secondary employer one year before 0.01 7.43 6.37 0.98Unemployed one year before 0.06 -5.11 -6.64 -0.76Secondary job one year before 0.20 1.06 -2.78 -0.28Student one year before 0.10 -10.18 -2.71 -0.36Earnings one year before 248.98 16.64 -2.24 -0.30Income one year before 300.73 16.66 -4.01 -0.47Income two years before 253.96 20.53 2.77 0.37Assets one year before 514.18 9.89 4.34 0.68Liabilities one year before 526.37 12.41 5.66 0.84Partner is employer one year before 0.04 -0.03 -3.98 -0.46Partner's income one year before 178.10 5.07 -5.04 -0.72Partner's assets one year before 371.12 6.15 0.92 0.15Partner's liabilities one year before 374.90 7.78 2.00 0.30Characteristics of participation in NiN counsellingExpected raw materials extraction 0.02 -0.94 -5.83 -0.72Expected industry I 0.07 -3.02 2.68 0.41Expected construction 0.18 5.00 -6.22 -0.72Expected hotel. restaurant 0.08 4.25 2.55 0.30Expected transport firm 0.03 -3.19 0.95 0.15
53

Mean of treated group in covariate X k
Normalised mean dif-ference in covariate X k between treated and control group
Normalised mean dif-ference in covariate X k between treated and matched control group
t-test for insignific-ant treat-ment ef-fect on co-variate X k
Expected finance, credit, real estate 0.21 -6.73 3.51 0.52Expected public administration, teaching 0.02 3.86 8.26 1.64Expected health care, welfare 0.05 8.75 -2.36 -0.26Expected other services 0.10 0.35 -1.18 -0.122002 participation 0.48 6.78 -6.55 -0.77February participation 0.05 -5.98 1.89 0.35March participation 0.15 4.98 -6.98 -0.77April participation 0.09 -1.33 1.92 0.30May participation 0.10 3.75 -1.10 -0.12June participation 0.08 -0.01 3.82 0.54July participation 0.05 -4.99 0.39 0.04August participation 0.07 0.62 4.81 0.69September participation 0.08 2.58 4.81 0.74October participation 0.09 -1.82 -2.79 -0.33November participation 0.07 -9.88 -3.84 -0.58December participation 0.09 6.09 8.08 1.26Days between CVR registration and participation 3.11 -1.21 3.05 0.58Days between CVR registration as sole proprietorshipfirm and participation
2.38 -2.86 3.58 0.79
Days between CVR registration and January participation 0.14 -5.23 1.26 0.33Days between CVR registration and April participation 0.93 2.87 3.10 0.58Days between CVR registration and May participation 0.19 3.49 3.29 0.71Days between CVR registration and June participation 0.30 -3.55 1.28 0.35Days between CVR registration and July participation 0.13 4.21 4.15 0.60Days between CVR registration and August participation 0.22 -0.20 0.37 0.07Quarterly local unemployment rate 7.02 7.13 -2.09 -0.27
Notes: Normalised mean difference in covariate X k between treated and control group is 100
X k1−X k
0
√Var ( X k1 )+Var (X k
0)2
; normalised mean difference in covariate X k between treated and matched control group is
100X k
1−∑T=0
❑i X k0
√Var ( Xk1 )+Var (X k
0)2
; t-test for insignificant treatment effect on covariate is t=A T T X k
SD(A T T X k)
, where
ATT and its standard error are estimated with the same method than ATT in terms of outcomes. An average number of 12 controls entrepreneurs, standard deviation of 7 and maximum number of 32 controls are used for each treated. See matching method 1 in appendix 1.
54

Table A4: Matching quality (basic counselling with private sub-contractors, 2004-2005)
Mean of treated group in covariate X k
Normalised mean dif-ference in covariate X k between treated and con-trol group
Normal-ised mean difference in covari-ate X k between treated and matched control group
t-test for insignific-ant treat-ment ef-fect on co-variate X k
Characteristics of nascent entrepreneurAge 34.32 7.44 -2.01 -0.25Woman 0.37 -0.43 -0.64 -0.07Partner one year before 0.64 16.18 -2.16 -0.33Number of children at age 0 one year before 0.07 -5.73 -2.84 -0.42Number of children at age 1-2 one year before 0.15 1.76 4.87 0.63Number of children at age 3-6 one year before 0.27 7.79 -1.75 -0.19Number of children at age 7-10 one year before 0.23 0.42 1.53 0.20Woman with children at age 0-2 one year before 0.08 -2.53 4.63 0.80Foreign born one year before 0.05 -2.88 0.43 0.06Outside North Jutland residence one year before 0.07 7.14 2.61 0.33Arden residence one year before 0.02 12.51 10.92 1.68Brovst residence one year before 0.02 -7.17 -1.14 -0.21Brønderslev residence one year before 0.04 -8.32 0.68 0.12Dronninglund residence one year before 0.01 -6.71 2.11 0.45Farsø residence one year before 0.02 -3.17 3.03 0.57Fjerritslev residence one year before 0.03 12.88 7.68 0.93Frederikshavn residence one year before 0.07 11.16 -3.48 -0.34Hadsund residence one year before 0.02 8.97 -8.79 -0.65Hirtshals residence one year before 0.01 9.69 -20.96 -0.68Hjørring residence one year before 0.08 9.11 -3.31 -0.33Hobro residence one year before 0.03 7.77 1.41 0.17Løgstør residence one year before 0.02 8.97 4.89 0.67Nibe residence one year before 0.02 1.98 -2.12 -0.24Pandrup residence one year before 0.02 -0.68 -1.04 -0.14Sindal residence one year before 0.02 2.43 0.29 0.03Skagen residence one year before 0.02 -10.49 -1.41 -0.25Støvring residence one year before 0.01 -10.68 0.35 0.08Sæby residence one year before 0.04 1.78 3.73 0.58Åbybro residence one year before 0.03 2.36 -4.98 -0.59Aalborg residence one year before 0.26 -21.04 -1.27 -0.15Aars residence one year before 0.02 -4.63 -1.28 -0.18Basic school or preparatory education one year before 0.24 -6.16 2.68 0.40Upper secondary education one year before 0.05 -7.37 -10.96 -0.82Vocational secondary education or basic training one year before
0.02 -9.38 -0.68 -0.13
Trade or office education one year before 0.12 1.09 0.49 0.06
55

Mean of treated group in covariate X k
Normalised mean dif-ference in covariate X k between treated and con-trol group
Normal-ised mean difference in covari-ate X k between treated and matched control group
t-test for insignific-ant treat-ment ef-fect on co-variate X k
Iron and metal or supplementary education one yearbefore
0.25 14.61 1.40 0.14
Short high education one year before 0.05 -16.23 -1.45 -0.29Medium high education one year before 0.12 6.88 -0.19 -0.02Bachelor or Long high education or research one year before
0.05 -4.75 1.15 0.17
Raw Materials Extraction one year before 0.02 5.28 7.84 1.43Industry I one year before 0.05 6.13 -9.47 -0.64Industry II one year before 0.07 -1.87 -0.36 -0.04Industry III one year before 0.04 5.67 5.43 0.76Construction one year before 0.10 3.19 1.94 0.27Hotel or restaurant one year before 0.03 -3.48 0.62 0.09Transport firm one year before 0.05 -0.21 1.04 0.16Finance, credit or real estate one year before 0.10 -5.59 -7.59 -0.69Public administration or teaching one year before 0.09 5.18 4.67 0.69Health care or Welfare one year before 0.12 -1.34 0.35 0.05Other services one year before 0.03 -8.66 -5.95 -0.82Experience one year before 11.59 17.13 -1.35 -0.19Experience2 one year before 195.75 15.13 0.24 0.03Primary employer two years before 0.01 2.00 -2.17 -0.23Primary employer one year before 0.02 -1.67 0.25 0.04Secondary employer one year before 0.01 4.32 -27.69 -0.76Unemployed one year before 0.11 3.26 3.46 0.53Secondary job one year before 0.18 5.20 -9.71 -0.84Student one year before 0.09 -17.23 4.11 0.79Earnings one year before 241.00 15.28 -2.18 -0.28Income one year before 286.95 13.98 -2.76 -0.30Income two years before 249.93 12.59 -2.04 -0.28Assets one year before 507.96 6.33 -1.08 -0.16Liabilities one year before 547.94 10.41 -6.65 -0.82Partner is employer one year before 0.04 0.80 3.21 0.50Partner's income one year before 179.18 12.81 -4.16 -0.35Partner's assets one year before 380.59 4.40 2.91 0.43Partner's liabilities one year before 450.19 6.07 -0.75 -0.08Characteristics of participation in NiN counsellingExpected raw materials extraction 0.02 -4.54 -5.36 -0.66Expected industry I 0.05 -0.78 -1.34 -0.18Expected industry II 0.01 -3.30 -14.01 -0.80Expected industry III 0.02 3.08 6.47 0.93Expected construction 0.26 18.59 6.96 0.84
56
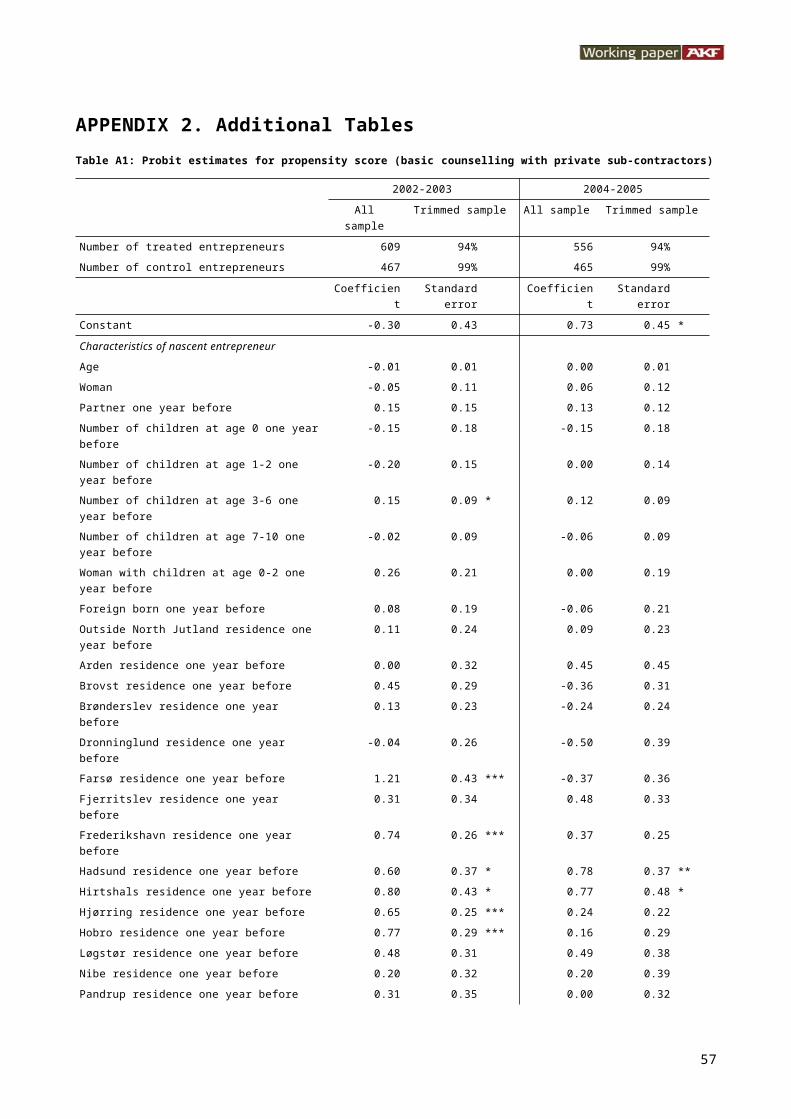
Mean of treated group in covariate X k
Normalised mean dif-ference in covariate X k between treated and con-trol group
Normal-ised mean difference in covari-ate X k between treated and matched control group
t-test for insignific-ant treat-ment ef-fect on co-variate X k
Expected hotel, restaurant 0.08 5.81 -8.11 -0.63Expected transport firm 0.03 -8.85 -0.14 -0.03Expected finance, credit, real estate 0.17 -8.96 -5.46 -0.56Expected public administration, teaching 0.03 5.64 3.59 0.49Expected health care, welfare 0.07 -1.05 3.64 0.58Expected other services 0.08 -4.44 3.20 0.502004 participation 0.40 -24.04 -3.69 -0.43February participation 0.08 -8.10 1.99 0.33March participation 0.10 -1.41 8.94 1.46April participation 0.06 -1.49 -3.44 -0.43May participation 0.09 -10.16 1.49 0.25June participation 0.09 6.50 7.78 1.29July participation 0.04 2.15 -1.31 -0.18August participation 0.10 0.10 -5.33 -0.47September participation 0.10 4.36 -0.94 -0.11October participation 0.08 -0.82 -0.98 -0.13November participation 0.11 7.16 0.85 0.10December participation 0.08 4.56 -5.57 -0.43Days between CVR registration and participation 1.61 3.30 2.05 0.29Days between CVR registration in a new sector andparticipation
1.39 3.24 2.20 0.30
Days between CVR registration as sole proprietorship firm and participation
1.34 3.13 2.57 0.35
Days between CVR registration and Februaryparticipation
0.04 -3.84 -5.45 -0.87
Days between CVR registration and March participation 0.02 2.99 -2.93 -0.27Days between CVR registration and April participation 0.27 2.26 0.78 0.10Days between CVR registration and May participation 0.26 -1.38 2.64 0.76Days between CVR registration and June participation 0.03 -6.02 -0.94 -0.36Days between CVR registration and August participation 0.87 6.11 2.64 0.33Days between CVR registration and Septemberparticipation
0.07 -2.32 -2.01 -0.26
Days between CVR registration and Novemberparticipation
0.01 -7.55 -8.63 -1.06
Quarterly local unemployment rate 8.16 -17.85 -5.77 -0.68Notes: See notes in table A3. An average number of 16 control entrepreneurs, standard deviation of 8 and maximum
number of 32 controls are used for each treated. See matching method 1 in appendix 1.
57
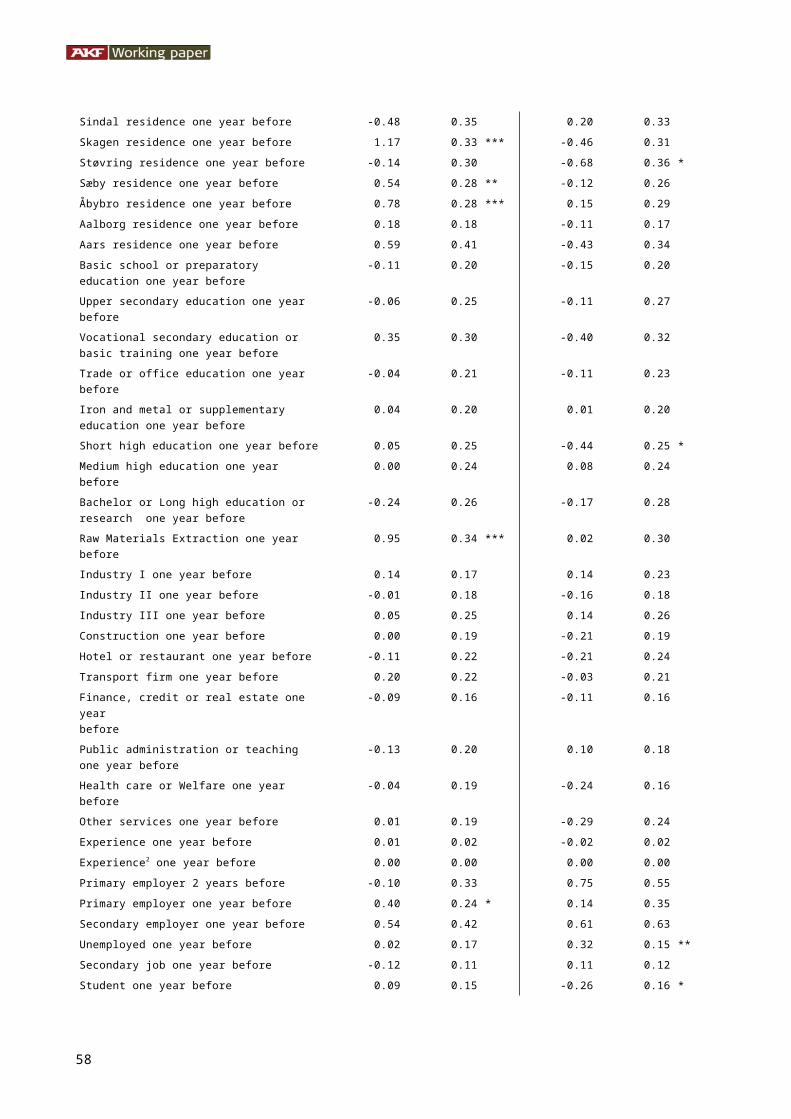
Table A5: Matching quality (extended start-up counselling, 2002-2003)
Mean of treated group in covariate X k
Normal-ised mean difference in covari-ate X k between treated and con-trol group
Normal-ised mean difference in covari-ate X k between treated and matched control group
t-test for insignific-ant treat-ment ef-fect on co-variate X k
Characteristics of nascent entrepreneurAge 35.35 9.41 -7.49 -0.86Woman 0.34 1.86 1.10 0.13Partner one year before 0.67 1.58 -2.84 -0.39Number of children at age 0 one year before 0.08 0.48 7.54 1.27Number of children at age 1-2 one year before 0.15 9.74 1.60 0.19Number of children at age 3-6 one year before 0.28 2.37 4.42 0.58Number of children at age 7-10 one year before 0.20 -7.69 -3.59 -0.51Woman with children at age 0-2 one year before 0.07 0.62 4.81 0.73Foreign born one year before 0.04 -4.66 -7.45 -0.80Outside North Jutland residence one year before 0.07 7.41 0.18 0.02Arden residence one year before 0.03 8.41 4.31 0.48Brovst residence one year before 0.00 -11.97 -1.84 -0.45Brønderslev residence one year before 0.01 -15.65 0.83 0.19Dronninglund residence one year before 0.02 -6.58 0.85 0.17Farsø residence one year before 0.01 -8.47 -0.49 -0.11Fjerritslev residence one year before 0.03 3.56 -5.21 -0.58Frederikshavn residence one year before 0.07 -7.03 2.19 0.35Hadsund residence one year before 0.05 21.09 -7.35 -0.53Hirtshals residence one year before 0.05 17.61 -1.29 -0.15Hjørring residence one year before 0.08 1.88 -7.92 -0.84Hobro residence one year before 0.04 1.71 2.34 0.34Løgstør residence one year before 0.02 -6.75 2.68 0.50Nibe residence one year before 0.02 1.68 8.20 1.55Pandrup residence one year before 0.02 2.83 -8.00 -0.84Sindal residence one year before 0.02 7.05 -3.35 -0.33Skagen residence one year before 0.00 -15.09 -0.56 -0.16Støvring residence one year before 0.03 5.03 3.04 0.37Sæby residence one year before 0.05 -1.22 -0.97 -0.13Åbybro residence one year before 0.01 -20.19 -0.83 -0.24Aalborg residence one year before 0.29 3.10 6.95 0.83Aars residence one year before 0.02 -0.79 -3.73 -0.53Basic school or preparatory education one year before 0.15 -15.86 -3.54 -0.46Upper secondary education one year before 0.06 4.36 -0.89 -0.13Vocational secondary education or basic training one year before
0.04 -1.07 0.92 0.13
Trade or office education one year before 0.17 1.92 -0.12 -0.01Iron & metal or supplementary education one year be-fore
0.20 -8.21 4.37 0.64
58

Mean of treated group in covariate X k
Normal-ised mean difference in covari-ate X k between treated and con-trol group
Normal-ised mean difference in covari-ate X k between treated and matched control group
t-test for insignific-ant treat-ment ef-fect on co-variate X k
Short high education one year before 0.08 4.83 4.94 0.62Medium high education one year before 0.11 6.20 -1.17 -0.14Bachelor or long high education or research one yearbefore
0.10 11.99 0.34 0.03
Raw materials extraction one year before 0.02 -5.98 2.05 0.34 Industry I one year before 0.07 -4.99 -6.79 -0.74 Industry II one year before 0.08 2.41 3.63 0.49 Industry III one year before 0.06 7.21 4.35 0.56 Construction one year before 0.08 -1.68 4.43 0.68 Hotel or restaurant one year before 0.02 -6.30 4.78 0.97 Transport firm one year before 0.03 -5.80 0.26 0.04 Finance. credit or real estate one year before 0.11 0.35 -4.01 -0.50 Public administration or teaching one year before 0.07 2.07 -10.56 -0.95 Health care or welfare one year before 0.08 2.47 -5.75 -0.64 Other services one year before 0.05 -1.32 0.56 0.07Experience one year before 12.39 9.41 -8.54 -1.02 Experience2 one year before 220.08 7.36 -8.48 -0.91Primary employer two years before 0.02 2.83 -0.14 -0.02Primary employer one year before 0.06 0.28 2.51 0.39Secondary employer one year before 0.02 0.67 3.14 0.52Unemployed one year before 0.06 -3.69 2.16 0.19Secondary job one year before 0.21 2.69 -8.72 -0.97Student one year before 0.12 5.72 8.45 1.13Earnings one year before 282.60 13.62 1.03 0.12Income one year before 325.48 9.04 -0.06 -0.01Income two years before 269.63 6.25 -5.85 -0.73Assets one year before 565.26 2.13 -2.59 -0.32Liabilities one year before 567.73 0.36 -2.31 -0.37Partner is employer one year before 0.06 7.39 -7.73 -0.74Partner's income one year before 180.79 2.87 -2.83 -0.39Partner's assets one year before 374.16 0.13 -0.52 -0.09Partner's liabilities one year before 378.84 -0.61 -1.22 -0.20Characteristics of participation in NiN counsellingExpected raw materials extraction 0.02 -2.04 -2.70 -0.38Expected industry I 0.08 3.19 3.06 0.39Expected construction 0.18 2.70 3.83 0.50Expected hotel, restaurant 0.08 1.07 0.72 0.09Expected transport firm 0.03 -0.95 -1.35 -0.20Expected finance, credit, real estate 0.22 1.54 2.41 0.33Expected public administration, teaching 0.02 2.83 1.21 0.18
59

Mean of treated group in covariate X k
Normal-ised mean difference in covari-ate X k between treated and con-trol group
Normal-ised mean difference in covari-ate X k between treated and matched control group
t-test for insignific-ant treat-ment ef-fect on co-variate X k
Expected health care, welfare 0.09 8.95 2.73 0.26Expected other services 0.08 -4.94 -6.99 -0.722002 participation 0.52 7.32 1.26 0.15February participation 0.05 -1.27 -2.59 -0.35March participation 0.12 -7.57 5.20 0.89April participation 0.07 -5.67 -6.17 -0.75May participation 0.07 -12.28 3.92 0.59June participation 0.09 -1.04 1.33 0.19July participation 0.05 2.13 -8.19 -1.04August participation 0.06 -3.66 3.37 0.58September participation 0.08 1.77 4.31 0.55October participation 0.09 2.12 7.64 1.13November participation 0.09 4.47 1.02 0.13December participation 0.14 14.37 -12.89 -1.19Hours NiN Basic Counselling by sub-suppliers 3.05 38.92 1.33 0.20Days between CVR registration and participation 2.98 -2.17 1.38 0.15Days between CVR registration in a new sector andparticipation
2.06 -1.79 1.78 0.17
Days between CVR registration as sole proprietorship firm and participation
2.81 0.51 3.95 0.41
Days between CVR registration and January participation 0.07 -3.84 -0.97 -0.22Days between CVR registration and March participation 0.68 3.71 0.29 0.04Days between CVR registration and April participation 0.65 -0.56 4.55 0.43Days between CVR registration and May participation 0.43 -2.85 4.42 0.43Days between CVR registration and June participation 0.21 -2.98 2.93 0.65Days between CVR registration and July participation 0.32 0.96 -14.00 -1.63Days between CVR registration and August participation 0.03 5.97 6.00 1.00Days between CVR registration and October participation 0.04 -4.19 6.00 0.82Days between CVR registration and Novemberparticipation
0.52 -1.51 2.77 0.45
Quarterly Local unemployment rate 6.89 -2.64 -0.45 -0.07Notes: See notes table A3. An average number of 18 control entrepreneurs, standard deviation of 9 and maximum
number of 38 controls are used for each treated. See matching method 2 in appendix 1.
60

Table A6: Matching quality (extended start-up counselling, 2004-2005)
Mean of treated group in covariate X k
Normalised mean dif-ference in covariate X k between treated and control group
Normalised mean dif-ference in covariate X k between treated and matched control group
t-test for insignificant treatment effect on covariate X k
Characteristics of nascent entrepreneurAge 35.54 14.07 5.53 0.51Woman 0.37 2.42 6.95 0.73Partner one year before 0.66 2.01 2.56 0.25Number of children at age 0 one year before 0.08 0.73 0.24 0.03Number of children at age 1-2 one year before 0.15 -2.14 1.35 0.17Number of children at age 3-6 one year before 0.27 -0.53 0.67 0.07Number of children at age 7-10 one year before 0.22 -1.93 8.96 1.27Woman with children at age 0-2 one year before 0.08 0.97 4.31 0.55Foreign born one year before 0.04 -4.69 2.80 0.47Outside North Jutland residence one year before 0.07 0.25 5.69 0.82Arden residence one year before 0.03 6.66 -2.56 -0.23Brønderslev residence one year before 0.03 -3.66 -4.25 -0.45Dronninglund residence one year before 0.03 15.50 1.85 0.08Farsø residence one year before 0.01 -4.15 -1.57 -0.23Fjerritslev residence one year before 0.02 -7.63 2.18 0.41Frederikshavn residence one year before 0.05 -8.63 -4.41 -0.57Hadsund residence one year before 0.06 16.45 0.00 0.00Hirtshals residence one year before 0.03 8.00 8.70 1.29Hjørring residence one year before 0.11 9.54 -4.92 -0.35Hobro residence one year before 0.04 -1.17 3.11 0.46Løgstør residence one year before 0.02 -1.84 -0.76 -0.07Nibe residence one year before 0.01 -4.15 1.50 0.28Pandrup residence one year before 0.04 8.80 0.82 0.10Sindal residence one year before 0.03 1.36 1.28 0.17Skagen residence one year before 0.00 -12.64 -3.79 -0.93Støvring residence one year before 0.01 -2.45 2.86 0.59Sæby residence one year before 0.04 1.31 -0.95 -0.11Åbybro residence one year before 0.02 -8.76 1.87 0.41Aalborg residence one year before 0.26 -1.39 -3.08 -0.33Aars residence one year before 0.02 0.61 -3.69 -0.46Basic school or preparatory education one year be-fore
0.17 -13.08 -6.47 -0.64
Upper secondary education one year before 0.05 0.94 6.59 1.03Vocational secondary education or basic training one year before
0.03 6.55 7.18 0.99
Trade or office education one year before 0.15 7.13 -0.94 -0.08Iron and metal or supplementary education one year before
0.20 -13.43 2.72 0.37
61
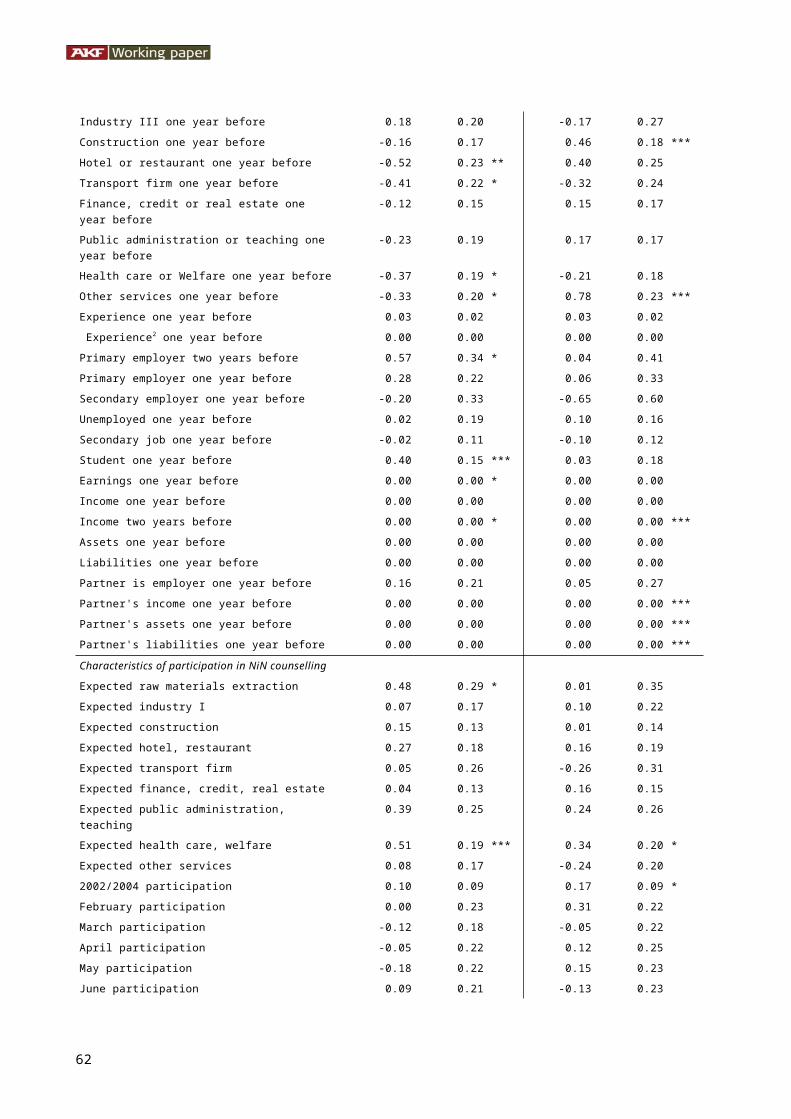
Mean of treated group in covariate X k
Normalised mean dif-ference in covariate X k between treated and control group
Normalised mean dif-ference in covariate X k between treated and matched control group
t-test for insignificant treatment effect on covariate X k
Short high education one year before 0.09 16.61 -13.85 -1.07Medium high education one year before 0.13 3.13 4.48 0.51Bachelor or long high education or research one year before
0.06 6.65 3.44 0.39
Raw materials extraction one year before 0.01 -8.17 -4.62 -0.90 Industry I one year before 0.05 -2.85 -4.86 -0.55 Industry II one year before 0.08 3.96 -6.01 -0.64 Industry III one year before 0.03 -5.31 -2.04 -0.27 Construction one year before 0.16 16.14 2.22 0.21 Hotel or restaurant one year before 0.04 3.21 5.04 0.72 Transport firm one year before 0.03 -12.66 3.15 0.57 Finance, credit or real estate one year before 0.11 4.97 -12.58 -1.08 Public administration or teaching one year before 0.11 4.12 8.49 1.28 Health care or welfare one year before 0.08 -8.09 8.42 1.61 Other services one year before 0.06 11.45 -7.21 -0.47Experience one year before 13.02 17.25 4.38 0.40 Experience2 one year before 234.26 15.09 2.96 0.28Primary employer two years before 0.01 0.11 -20.28 -0.95Primary employer one year before 0.02 -0.29 -14.48 -0.85Secondary employer one year before 0.00 1.05 3.66 0.61Unemployed one year before 0.11 1.04 0.00 0.00Secondary job one year before 0.17 -4.45 3.32 0.48Student one year before 0.08 -3.47 3.37 0.44Earnings one year before 273.33 19.44 7.35 0.61Income one year before 324.72 23.62 1.38 0.13Income two years before 286.28 30.07 -1.21 -0.11Assets one year before 575.10 12.20 1.36 0.15Liabilities one year before 594.54 8.69 -2.12 -0.25Partner is employer one year before 0.03 -2.65 -12.87 -1.01Partner's income one year before 187.30 4.06 6.63 0.80Partner's assets one year before 457.36 5.74 4.48 0.84Partner's liabilities one year before 462.50 2.30 4.19 0.89Characteristics of participation in NiN counsellingExpected raw materials extraction 0.02 -2.18 -6.87 -0.76Expected industry I 0.05 2.63 1.90 0.25Expected construction 0.27 0.13 8.87 0.79Expected hotel, restaurant 0.09 1.52 8.33 1.15Expected transport firm 0.02 -5.44 1.42 0.25Expected finance, credit, real estate 0.18 4.66 -3.77 -0.41Expected public administration, teaching 0.04 -0.16 -1.46 -0.16Expected health care, welfare 0.09 7.84 -7.95 -0.63
62

Mean of treated group in covariate X k
Normalised mean dif-ference in covariate X k between treated and control group
Normalised mean dif-ference in covariate X k between treated and matched control group
t-test for insignificant treatment effect on covariate X k
Expected other services 0.07 -5.77 -3.42 -0.302004 participation 0.45 11.53 -9.81 -1.17February participation 0.12 13.72 1.34 0.10March participation 0.10 -1.26 9.59 1.54April participation 0.07 6.01 1.07 0.11May participation 0.12 9.59 0.20 0.02June participation 0.09 0.18 -5.87 -0.52July participation 0.04 -0.16 -7.65 -0.61August participation 0.07 -7.84 -5.69 -0.61September participation 0.09 -6.31 3.01 0.46October participation 0.09 -0.17 7.53 1.09November participation 0.07 -16.41 -11.40 -1.03December participation 0.08 2.32 6.82 1.05Hours NiN basic counselling by sub-suppliers 3.42 31.84 5.34 0.62Days between CVR registration and participation 4.96 4.48 6.49 0.93Days between CVR registration in a new sector and participation
2.96 2.79 2.72 0.37
Days between CVR registration as sole proprietorship firm and participation
3.65 4.37 6.49 0.96
Days between CVR registration and March participa-tion
0.14 3.14 5.28 0.84
Days between CVR registration and April participa-tion
0.18 -0.48 0.67 0.12
Days between CVR registration and May participation 0.93 5.68 3.86 0.43Days between CVR registration and June participa-tion
0.03 -0.16 -0.08 -0.02
Days between CVR registration and October particip-ation
0.30 1.98 3.10 0.51
Days between CVR registration and November parti-cipation
0.71 -1.88 -3.45 -0.44
Quarterly Local unemployment rate 8.19 5.77 -6.68 -0.91Notes: See table A3. An average number of 9 controls entrepreneur, standard deviation of 6 and maximum number of
26 controls are used for each treated. See matching method 2 in appendix 1.
63

Table A7: Standardised coefficients from OLS regression of entrepreneur treatment effects on covariates (basic counselling with private sub-contractors, 2002-2003)
EffectCovariates Survivorship 2
years from CVR registration
Survivorship 3 years from CVR registra-tion
Survivorship 4 years from CVR registra-tion
Employment 1 year after par-ticipation year
Employment 2 years after participation year
Employment 3 years after participation year
Characteristics of nascent entrepreneurAge -0.12 * -0.10 -0.06 -0.04 -0.04 -0.03Woman 0.03 0.01 -0.01 0.09 * -0.02 -0.02Partner one year before 0.12 * 0.11 * 0.10 0.06 0.11 ** 0.13 ***Number of children at age 0 one year before -0.06 -0.08 * -0.04 0.06 -0.01 -0.03Number of children at age 1-2 one year before -0.09 * -0.06 -0.01 -0.05 -0.06 * -0.03Woman with children at age 0-2 one year before 0.04 0.01 -0.03 -0.03 0.08 ** 0.04Outside North Jutland residence one year before 0.03 0.04 0.02 -0.01 0.02 0.06 *Dronninglund residence one year before 0.04 -0.01 -0.06 0.10 ** 0.00 0.00Løgstør residence one year before -0.06 -0.05 -0.05 -0.04 -0.07 ** -0.07 **Nibe residence one year before 0.08 * 0.09 * 0.11 ** 0.03 0.10 *** 0.08 **Skagen residence one year before 0.13 0.03 0.01 0.03 0.08 ** -0.04Aalborg residence one year before -0.14 * -0.13 -0.16 * 0.01 -0.08 -0.07Basic school or preparatory education one year before
-0.19 ** -0.21 *** -0.22 *** 0.06 0.02 -0.01
Vocational secondary education or basic training one year before
-0.12 ** -0.12 ** -0.15 *** 0.00 -0.03 0.00
Trade or office education one year before -0.11 -0.13 * -0.10 0.01 0.03 0.01Short high education one year before -0.12 ** -0.14 *** -0.15 *** 0.07 -0.02 -0.01 Raw materials extraction one year before -0.05 -0.04 -0.05 -0.05 -0.06 ** -0.09 *** Industry II one year before -0.09 ** -0.08 * -0.07 -0.05 -0.08 *** -0.07 ** Hotel or restaurant one year before 0.08 * 0.08 * 0.06 0.03 0.06 ** 0.01 Finance, credit or real estate one year before 0.03 0.05 0.04 0.14 *** -0.03 0.01 Health care or welfare one year before 0.00 -0.03 -0.01 -0.04 -0.07 ** -0.06 * Other services one year before 0.06 0.08 * 0.05 -0.02 0.01 0.02Unemployed one year before -0.02 0.00 0.00 -0.07 * -0.03 -0.01Secondary job one year before -0.06 -0.05 -0.01 -0.09 ** -0.08 ** -0.08 ***Characteristics of participation in NiN counselling

EffectCovariates Survivorship 2
years from CVR registration
Survivorship 3 years from CVR registra-tion
Survivorship 4 years from CVR registra-tion
Employment 1 year after par-ticipation year
Employment 2 years after participation year
Employment 3 years after participation year
Expected raw materials extraction 0.02 0.03 0.08 * 0.06 0.08 ** 0.16 ***Expected construction 0.11 ** 0.16 *** 0.23 *** 0.01 0.04 0.06 *Expected hotel, restaurant 0.09 ** 0.08 * 0.11 ** 0.00 0.04 0.05 *Expected transport firm -0.03 -0.04 -0.01 -0.07 * -0.02 -0.02Expected public administration, teaching 0.03 0.05 0.08 * -0.01 0.02 0.04Expected health care, welfare 0.04 0.06 0.09 ** 0.03 0.07 ** 0.07 **Expected other services -0.01 0.03 0.06 0.03 0.03 0.09 **February participation -0.04 -0.02 -0.01 -0.04 -0.06 * -0.06 *November participation 0.01 0.03 0.03 0.17 *** -0.04 -0.01Days between CVR registration and participation 0.25 *** 0.28 *** 0.29 *** 0.82 *** 1.54 *** 1.51 ***Days between CVR registration as soleproprietorship firm and participation
0.36 *** 0.19 0.11 -0.19 -1.04 *** -1.18 ***
Days between CVR registration and Januaryparticipation
0.04 0.08 * 0.03 -0.07 0.02 0.03
Days between CVR registration and Aprilparticipation
-0.36 *** -0.23 ** -0.16 -0.33 *** -0.08 0.14 *
Days between CVR registration and Augustparticipation
0.04 0.03 0.07 -0.19 *** -0.38 *** -0.26 ***
Notes: We only report estimates for those covariates which appear as significant. The full table is available upon request. *** indicates significance at 1%, ** indicates significance at 5% and * indicates significance at 10%.

Table A8: Standardised coefficients from OLS regression of entrepreneur treatment effects on covariates(basic counselling with private sub-contractors, 2002-2003)
EffectCovariates Turnover 1 year
after participation year
Turnover 2 years after participation year
Turnover 3 years after participation year
Growth firm 2 years after parti-cipation year
Growth firm 3 years after parti-cipation year
Characteristics of nascent entrepreneurNumber of children at age 1-2 one year before -0.05 -0.05 -0.03 -0.07 -0.09 **Outside North Jutland residence one year before -0.03 -0.03 -0.02 0.00 -0.08 *Arden residence one year before -0.07 -0.07 * -0.08 ** -0.07 -0.04Dronninglund residence one year before 0.09 * 0.03 0.00 -0.01 0.01Løgstør residence one year before -0.07 -0.08 ** -0.08 ** -0.06 0.06Nibe residence one year before 0.16 *** 0.16 *** 0.15 *** -0.06 -0.01Skagen residence one year before 0.14 ** 0.09 * 0.08 -0.08 -0.02Åbybro residence one year before -0.05 -0.09 ** -0.08 * -0.05 -0.09Basic school or preparatory education one year be-fore
-0.03 -0.03 -0.08 -0.11 -0.16 ***
Upper secondary education one year before -0.07 -0.04 -0.05 -0.05 -0.12 **Vocational secondary education or basic training one year before
-0.07 -0.06 -0.07 -0.10 * -0.26 ***
Trade or office education one year before 0.01 0.05 -0.01 -0.04 -0.25 ***Iron and metal or supplementary education one year before
-0.06 0.00 -0.03 -0.09 -0.19 ***
Short high education one year before -0.06 -0.01 -0.06 -0.05 -0.20 ***Medium high education one year before -0.05 -0.03 -0.06 -0.14 * -0.18 ***Industry I one year before 0.06 0.02 0.00 -0.04 -0.10 **Industry II one year before -0.05 -0.06 -0.08 * -0.04 -0.05Hotel or restaurant one year before 0.10 ** 0.07 * 0.04 0.01 -0.07Health care or welfare one year before -0.04 -0.05 -0.06 0.00 -0.08 *Other services one year before -0.04 -0.01 -0.02 0.10 ** 0.01Secondary job one year before -0.06 -0.08 ** -0.07 * -0.02 0.00Student one year before 0.04 0.07 0.07 * 0.06 -0.01Assets one year before 0.07 -0.02 -0.04 -0.05 -0.10 *Partner is employer one year before 0.02 0.01 0.02 -0.08 * -0.32 ***Partner's assets one year before 0.01 0.04 0.04 0.24 ** 0.03

EffectCovariates Turnover 1 year
after participation year
Turnover 2 years after participation year
Turnover 3 years after participation year
Growth firm 2 years after parti-cipation year
Growth firm 3 years after parti-cipation year
Characteristics of participation in NiN counsellingExpected raw materials extraction 0.03 0.04 0.07 * -0.02 -0.03Expected industry I -0.04 -0.04 -0.05 0.01 0.12 **Expected construction 0.04 0.07 * 0.06 0.18 *** 0.03Expected finance, credit, real estate -0.02 -0.01 -0.03 0.07 0.15 ***Expected other services 0.03 0.05 0.04 0.09 * 0.012002 participation 0.04 0.01 0.01 -0.05 0.59 ***February participation -0.07 -0.08 * -0.06 -0.03 0.13 **May participation -0.06 -0.05 -0.05 0.02 0.12 **November participation 0.10 * 0.04 0.02 0.07 0.09Days between CVR registration and participation 0.54 *** 0.79 *** 0.93 *** 0.43 *** -0.35 **Days between CVR registration as sole proprietor-ship firm andparticipation
-0.21 -0.38 *** -0.57 *** -0.08 0.02
Days between CVR registration and January parti-cipation
-0.01 0.05 -0.01 0.11 ** -0.02
Days between CVR registration and April participa-tion
-0.04 0.13 0.24 ** -0.12 0.05
Days between CVR registration and July participa-tion
-0.01 0.00 -0.02 -0.04 0.11 **
Days between CVR registration and August particip-ation
-0.13 *** -0.22 *** -0.23 *** -0.13 *** 0.02
Quarterly local unemployment rate 0.00 -0.03 -0.02 0.03 0.09 **Note: See notes in table A7.
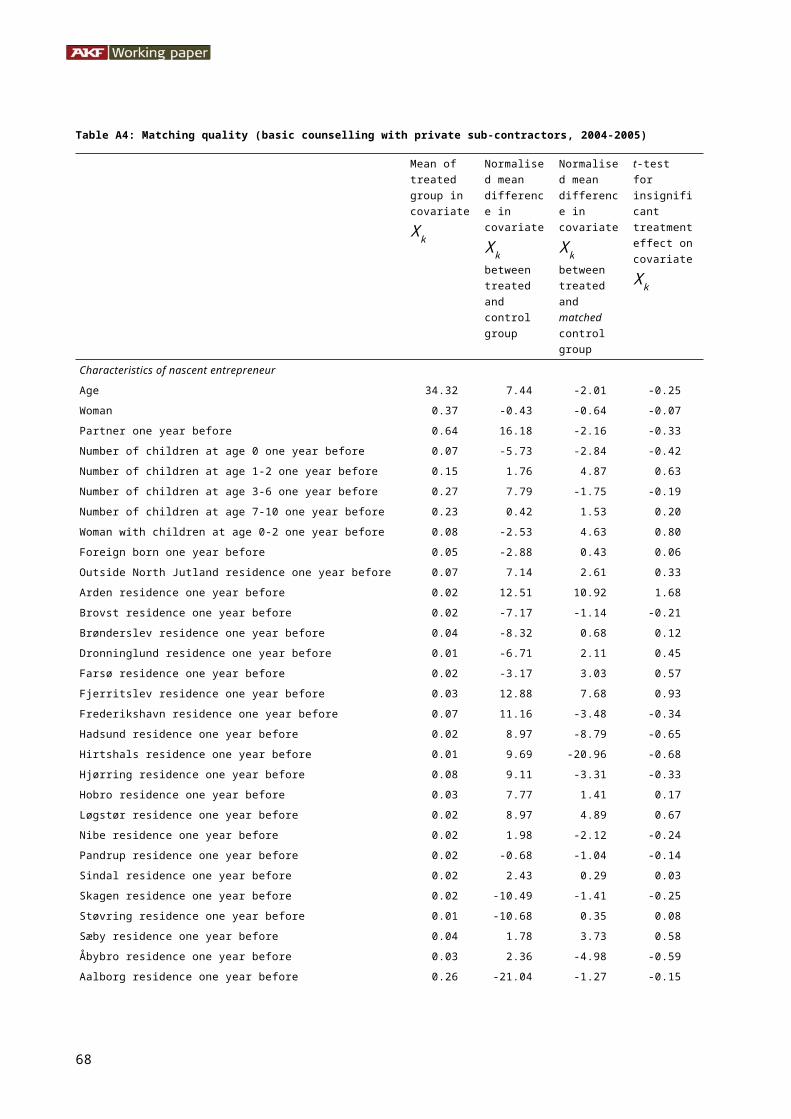
Table A9: Standardised coefficients from OLS regression of entrepreneur treatment effects on cov-ariates (basic counselling with private sub-contractors, 2004-2005)
EffectCovariates Survivorship 2
years from CVR registra-tion
Employment 1 year after participation year
Turnover 1 year after par-ticipation year
Characteristics of nascent entrepreneurAge -0.07 -0.09 -0.09 *Woman 0.11 * 0.04 0.01Outside North Jutland residence one year before 0.12 ** 0.04 -0.03Brønderslev residence one year before 0.11 ** 0.10 ** 0.07 *Dronninglund residence one year before 0.07 0.08 ** 0.03Hirtshals residence one year before 0.12 *** 0.03 0.01Nibe residence one year before 0.13 *** 0.04 0.00Basic school or preparatory education one year before 0.14 * 0.12 * 0.10 *Vocational secondary education or basic training one year before
0.09 * 0.13 *** 0.08 **
Trade or office education one year before 0.16 0.14 ** 0.13 **Iron and metal or supplementary education one year before 0.18 ** 0.08 0.05Hotel or restaurant one year before 0.17 *** 0.13 *** 0.03Experience one year before 0.16 0.26 * 0.24 **Assets one year before -0.14 * -0.02 0.01Liabilities one year before 0.16 ** 0.08 0.03Characteristics of participation in NiN counsellingExpected construction 0.07 0.09 * 0.01Expected public administration, teaching 0.09 * 0.02 -0.03Days between CVR registration and participation 6.71 *** 4.72 ** 3.35 **Days between CVR registration in a new sector and particip-ation
-5.80 *** -3.33 ** -1.46
Days between CVR registration as sole proprietorship firm and participation
-1.83 -3.01 * -2.38 *
Days between CVR registration and February participation -0.20 ** -0.04 0.00Days between CVR registration and March participation 0.18 *** 0.05 0.03Days between CVR registration and September participation -0.28 ** 0.02 -0.03Days between CVR registration and November participation -0.17 *** 0.03 0.11 ***
Note: See notes in table A7.
68

Table A10: Standardised coefficients from OLS regression of entrepreneur treatment effects on covariates(extended start-up counselling with private sub-contractors, 2002-2003)
EffectCovariates Survivorship 2
years from CVR registra-tion
Survivorship 3 years from CVR registra-tion
Survivorship 4 years from CVR registration
Employment 1 year after par-ticipation year
Employment 2 years after participation year
Employment 3 years after participation year
Characteristics of nascent entrepreneurAge 0.05 0.08 0.05 0.08 0.08 0.06Number of children at age 7-10 one year before 0.04 0.06 0.06 0.01 0.09 * 0.09 *Foreign born one year before -0.07 -0.08 * -0.09 ** -0.03 -0.03 -0.03Outside North Jutland residence one year before 0.00 0.00 -0.02 0.14 ** 0.09 0.09Hirtshals residence one year before -0.04 -0.04 -0.05 0.01 -0.14 * -0.15 *Pandrup residence one year before -0.03 -0.01 -0.03 0.04 -0.04 -0.03Sindal residence one year before 0.10 * 0.07 0.04 -0.07 -0.08 -0.09Sæby residence one year before 0.03 0.04 0.01 0.02 -0.12 * -0.11Åbybro residence one year before -0.07 -0.06 -0.05 0.02 -0.12 ** -0.11 **Basic school or preparatory education one year before
0.02 0.02 0.01 0.15 ** 0.15 * 0.11
Iron and metal or supplementary education one year before
-0.10 -0.12 * -0.13 * 0.13 * 0.03 -0.02
Short high education one year before -0.11 * -0.12 ** -0.11 ** 0.04 -0.02 -0.03Medium high education one year before -0.13 ** -0.14 ** -0.13 * 0.06 0.02 -0.02 Industry II one year before -0.07 -0.06 -0.07 -0.09 * -0.06 -0.04 Transport firm one year before -0.11 *** -0.10 ** -0.09 ** -0.04 -0.06 -0.05 Public Administration or teaching one year Before
-0.11 ** -0.11 ** -0.12 ** -0.04 -0.07 -0.05
Health care or Welfare one year before -0.09 * -0.08 ** -0.06 -0.05 -0.10 * -0.07Primary employer two years before -0.07 -0.09 * -0.08 -0.14 ** -0.17 *** -0.17 ***Primary employer one year before 0.02 0.02 0.01 0.23 *** 0.27 *** 0.26 ***Secondary job one year before 0.02 0.02 0.02 -0.08 * 0.00 -0.01Student one year before -0.08 * -0.08 * -0.08 * -0.05 -0.09 * -0.08 *Assets one year before 0.11 0.14 * 0.07 -0.06 -0.10 -0.08Partner's income one year before 0.12 * 0.10 0.08 -0.02 0.01 -0.01Characteristics of participation in NiN counsellingExpected construction 0.23 *** 0.23 *** 0.26 *** 0.15 *** 0.19 *** 0.15 **

EffectCovariates Survivorship 2
years from CVR registra-tion
Survivorship 3 years from CVR registra-tion
Survivorship 4 years from CVR registration
Employment 1 year after par-ticipation year
Employment 2 years after participation year
Employment 3 years after participation year
Expected hotel, restaurant 0.10 ** 0.10 * 0.12 *** 0.05 0.05 0.02Expected other services 0.08 * 0.11 ** 0.12 *** -0.04 0.03 0.02April participation -0.05 -0.08 -0.12 ** -0.09 -0.06 -0.07June participation -0.10 -0.08 -0.09 -0.05 -0.11 * -0.10August participation -0.08 -0.07 -0.08 0.09 * 0.12 ** 0.10 *November participation -0.13 ** -0.15 *** -0.16 *** -0.06 -0.08 -0.08Hours NiN Basic Counselling by sub-suppliers 0.15 *** 0.15 *** 0.10 ** 0.08 * 0.10 * 0.09 *Days between CVR registration and participation 3.41 ** 3.09 ** -0.80 1.24 1.90 1.76Days between CVR registration in a new sector and participation
-0.01 0.04 -0.07 0.32 *** -0.04 -0.01
Days between CVR registration as soleproprietor firm and participation
-0.06 0.59 * 1.61 *** 0.09 -0.12 0.19
Days between CVR registration and Januaryparticipation
-0.27 ** -0.29 ** -0.06 -0.10 -0.15 -0.15
Days between CVR registration and March participation
-1.68 ** -1.88 ** -0.28 -0.93 -0.92 -0.98
Days between CVR registration and May participation
-1.43 ** -1.53 ** -0.26 -0.80 -0.66 -0.71
Days between CVR registration and April participation
-1.06 ** -0.98 ** -0.10 -0.42 -0.51 -0.57
Days between CVR registration and June participation
-0.69 ** -0.68 ** -0.16 -0.30 -0.34 -0.41
Days between CVR registration and July participation
-1.12 *** -1.13 ** -0.26 -0.52 -0.51 -0.55
Days between CVR registration and August participation
-0.30 **** -0.31 *** -0.18 ** -0.14 * -0.15 * -0.15 *
Days between CVR registration and October participation
-0.07 -0.09 0.07 -0.45 *** -0.07 -0.08
Days between CVR registration and November participation
-1.92 ** -2.13 ** -0.57 -0.80 -1.06 -1.17
Quarterly local unemployment rate -0.06 -0.07 -0.09 0.06 0.19 ** 0.18 **Note: See notes in table A7.
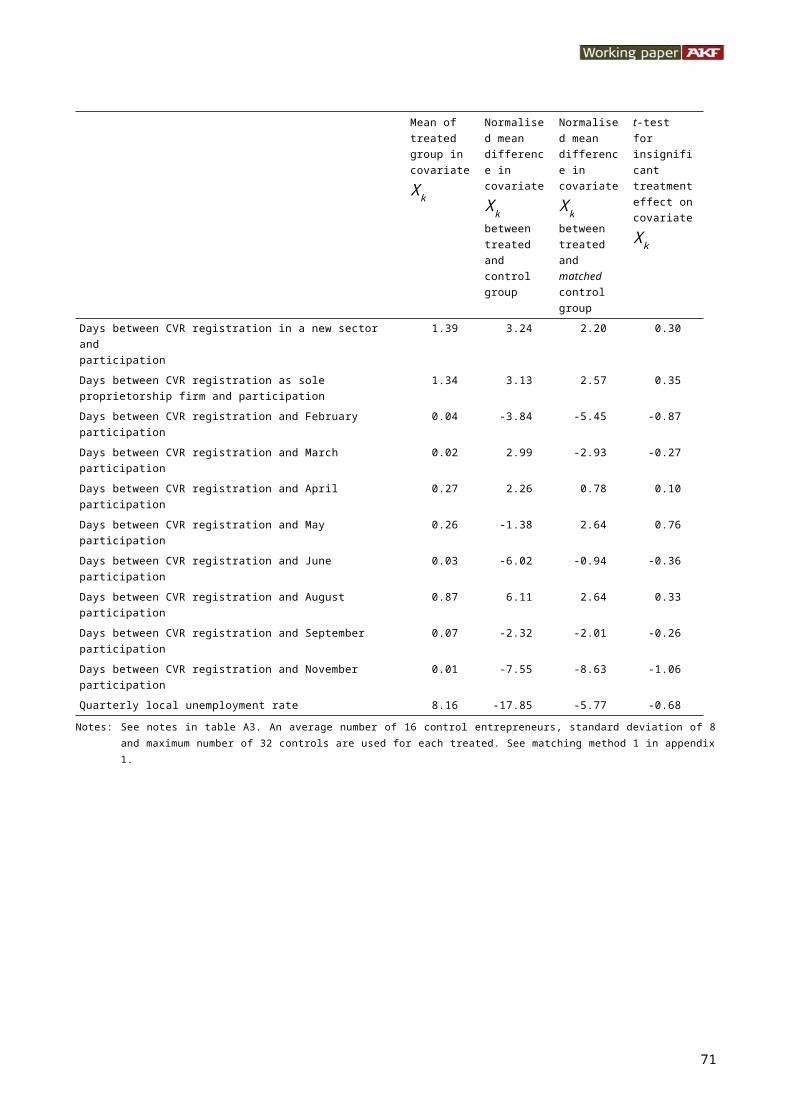
Table A11: Standardised coefficients from OLS regression of entrepreneur treatment effects on covariates(extended start-up counselling with private sub-contractors, 2002-2003)
EffectCovariates Turnover 1
year after par-ticipation year
Turnover 2 years after par-ticipation year
Turnover 3 years after par-ticipation year
Growth firm 2 years after par-ticipation year
Growth firm 3 years after participation year
Characteristics of nascent entrepreneurAge 0.07 0.05 0.02 0.01 -0.07Woman 0.10 * 0.05 0.04 0.02 0.08Number of children at age 0 one year before 0.00 0.01 0.00 0.11 ** 0.03Number of children at age 1-2 one year before 0.06 0.08 0.12 ** 0.01 -0.05Arden residence one year before -0.08 -0.09 * -0.10 * -0.05 -0.02Dronninglund residence one year before -0.07 -0.08 -0.10 * -0.03 0.02Farsø residence one year before 0.02 0.19 *** 0.10 ** 0.08 -0.03Hobro residence one year before 0.11 * 0.06 0.06 -0.01 0.02Sindal residence one year before -0.04 -0.03 -0.05 0.12 ** -0.01Basic school or preparatory education one year before 0.26 0.21 *** 0.16 ** -0.10 -0.14 **Upper secondary education one year before 0.08 *** 0.08 0.02 -0.08 -0.08Vocational secondary education or basic training one year before 0.05 0.06 0.01 -0.09 * -0.07Trade or office education one year before 0.12 0.12 0.10 -0.14 * -0.21 ***Iron and metal or supplementary education one year before 0.14 * 0.13 * 0.04 -0.14 * -0.23 ***Short high education one year before 0.07 0.05 0.00 -0.13 ** -0.15 ***Medium high education one year before 0.07 0.05 -0.01 -0.16 ** -0.21 ***Bachelor or Long high education or research one year before 0.07 0.06 -0.01 -0.14 * -0.18 ** Industry II one year before -0.10 ** -0.09 * -0.05 -0.07 -0.04 Construction one year before 0.01 0.02 0.01 -0.06 -0.09 * Finance, credit or real estate one year before -0.02 -0.02 -0.04 0.10 ** 0.03 Health care or welfare one year before -0.09 * -0.07 -0.07 -0.04 -0.01 Other services one year before -0.08 -0.09 ** -0.06 0.01 0.01Primary employer two years before -0.19 -0.14 *** -0.17 *** 0.02 -0.02Primary employer one year before 0.31 *** 0.26 *** 0.31 *** -0.03 0.02Income one year before -0.10 -0.16 -0.23 ** -0.18 -0.17Income two years before -0.05 0.01 0.08 0.10 0.19 **Assets one year before -0.05 -0.05 -0.03 0.13 * 0.07

EffectCovariates Turnover 1
year after par-ticipation year
Turnover 2 years after par-ticipation year
Turnover 3 years after par-ticipation year
Growth firm 2 years after par-ticipation year
Growth firm 3 years after participation year
Partner is employer one year before -0.03 *** -0.01 -0.05 0.00 -0.06Partner's assets one year before -0.08 -0.01 0.00 -0.02 -0.14 *Partner's liabilities one year before 0.07 -0.02 0.01 -0.02 0.15 *Characteristics of participation in NiN counsellingExpected construction 0.23 *** 0.19 *** 0.17 *** 0.12 ** 0.18 ***Expected public administration, teaching 0.02 0.09 ** 0.04 0.05 0.09 **Expected health care, welfare 0.03 0.06 0.13 ** 0.01 0.03Expected other services -0.02 0.03 0.03 -0.02 0.10 *Hours NiN basic counselling by sub-suppliers 0.13 *** 0.14 *** 0.11 ** 0.10 ** 0.03Days between CVR registration and participation 2.09 2.93 ** 1.94 5.30 *** 0.03Days between CVR registration in a new sector and participation 0.01 -0.06 -0.02 -0.08 -0.25 **Days between CVR registration as sole proprietor firm and particip-ation
0.10 -0.73 *** -0.06 -0.69 ** -0.31
Days between CVR registration and January participation -0.18 -0.19 -0.17 -0.37 *** -0.01Days between CVR registration and March participation -1.17 -1.11 -0.95 -2.32 *** 0.60Days between CVR registration and May participation -1.03 -0.96 -0.78 -1.90 *** 0.28Days between CVR registration and April participation -0.58 -0.62 -0.53 -1.42 *** 0.04Days between CVR registration and June participation -0.43 -0.45 -0.38 -1.04 *** 0.22Days between CVR registration and July participation -0.65 -0.64 -0.53 -1.39 *** 0.22Days between CVR registration and August participation -0.16 ** -0.20 ** -0.14 * -0.39 *** 0.03Days between CVR registration and October participation -0.21 ** -0.17 * -0.07 -0.26 *** 0.02Days between CVR registration and November participation -1.37 -1.39 -1.17 -2.86 *** 0.20
Note: See notes in table A7.

Table A12: Standardised OLS coefficients from regression of entrepreneur treatment effects on cov-ariates (extended start-up counselling, 2004-2005)
EffectCovariates Survivorship 2
years from CVR registration
Employment 1 year after par-ticipation year
Turnover 1 year after participa-tion year
Characteristics of nascent entrepreneurAge -0.18 ** -0.08 -0.14Number of children at age 0 one year before -0.09 * -0.06 0.01Frederikshavn residence one year before -0.01 0.17 ** 0.10Hadsund residence one year before 0.11 * 0.21 *** 0.13 **Hirtshals residence one year before 0.16 *** 0.19 *** 0.09Hjørring residence one year before 0.06 0.14 * 0.05Hobro residence one year before -0.01 0.07 0.08Skagen residence one year before 0.10 ** 0.05 0.05Sæby residence one year before -0.07 0.08 0.14 ** Construction one year before -0.08 -0.05 -0.16 ** Finance, credit or real estate one year before 0.10 * 0.06 -0.05 Other services one year before 0.09 * 0.02 -0.08Unemployed one year before -0.12 ** -0.04 -0.03Secondary job one year before -0.11 ** -0.04 -0.08Income one year before 0.12 * 0.05 0.09Partner's liabilities one year before 0.30 * 0.18 0.21Characteristics of participation in NiN counsellingExpected raw materials extraction 0.02 0.12 ** 0.04Expected construction 0.30 *** 0.21 *** 0.27 ***Expected hotel, restaurant 0.23 *** 0.22 *** 0.11Expected public administration, teaching 0.10 ** 0.15 *** 0.05Days between CVR registration in a new sector andparticipation
-0.03 0.09 0.19 *
Days between CVR registration and March participation 0.10 ** 0.06 0.03Days between CVR registration and May participation 0.16 0.35 ** 0.17Days between CVR registration and June participation 0.08 * 0.03 -0.01Days between CVR registration and October participa-tion
0.10 ** 0.05 0.00
Days between CVR registration and November participa-tion
0.12 ** 0.03 0.04
Note: See notes in table A7.
73
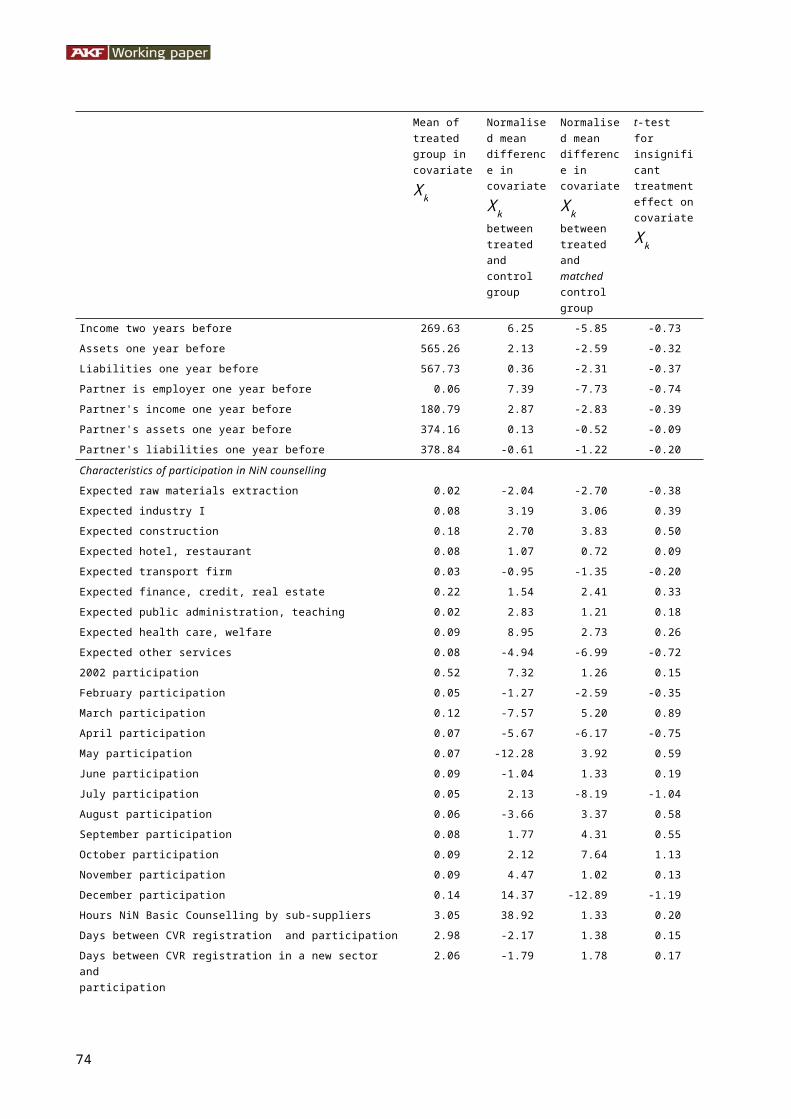
74

There is an ongoing debate on whether soft business assistance, the most widely applied entrepreneurial policy instrument in de-veloped countries, reaches those entrepreneurs who need ad-vice the most due to failure at the entrepreneurial activity mar-ket. We evaluate by means of matching the effect of two types of soft support measures, i.e. basic counselling with private-sector consultants before firm starts and extended counselling upon firm’s start. The empirical analyses are performed using a data-set of approximately 2200 entrepreneurs. The dataset has been constructed by combining information from the administrators of the programme with registry information from Statistics Den-mark.