Evaluating Questionnaire Issues in Mail Surveys of All ... · National Crime Victimization Survey...
22
Evaluating Questionnaire Issues in Mail Surveys of All Adults in a Household Douglas Williams, J. Michael Brick, Sharon Lohr, W. Sherman Edwards, Pamela Giambo (Westat) Michael Planty (Bureau of Justice Statistics)
Transcript of Evaluating Questionnaire Issues in Mail Surveys of All ... · National Crime Victimization Survey...

Evaluating Questionnaire Issues in Mail
Surveys of All Adults in a Household
Douglas Williams, J. Michael Brick, Sharon Lohr, W. Sherman Edwards,
Pamela Giambo (Westat)
Michael Planty (Bureau of Justice Statistics)
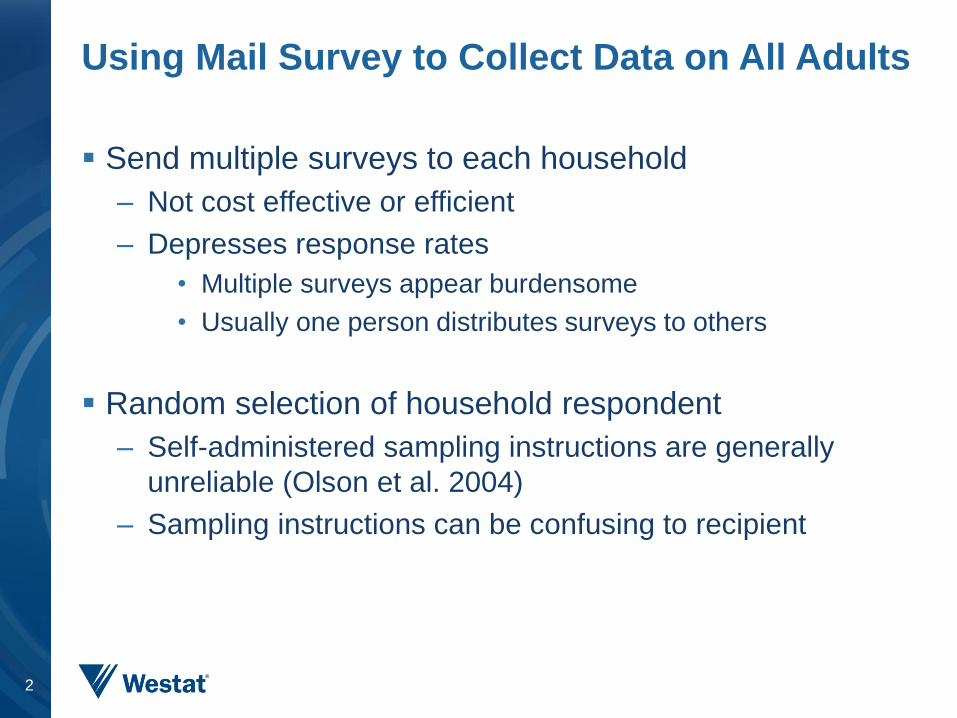
Using Mail Survey to Collect Data on All Adults
Send multiple surveys to each household
– Not cost effective or efficient
– Depresses response rates
• Multiple surveys appear burdensome
• Usually one person distributes surveys to others
Random selection of household respondent
– Self-administered sampling instructions are generally
unreliable (Olson et al. 2004)
– Sampling instructions can be confusing to recipient
2
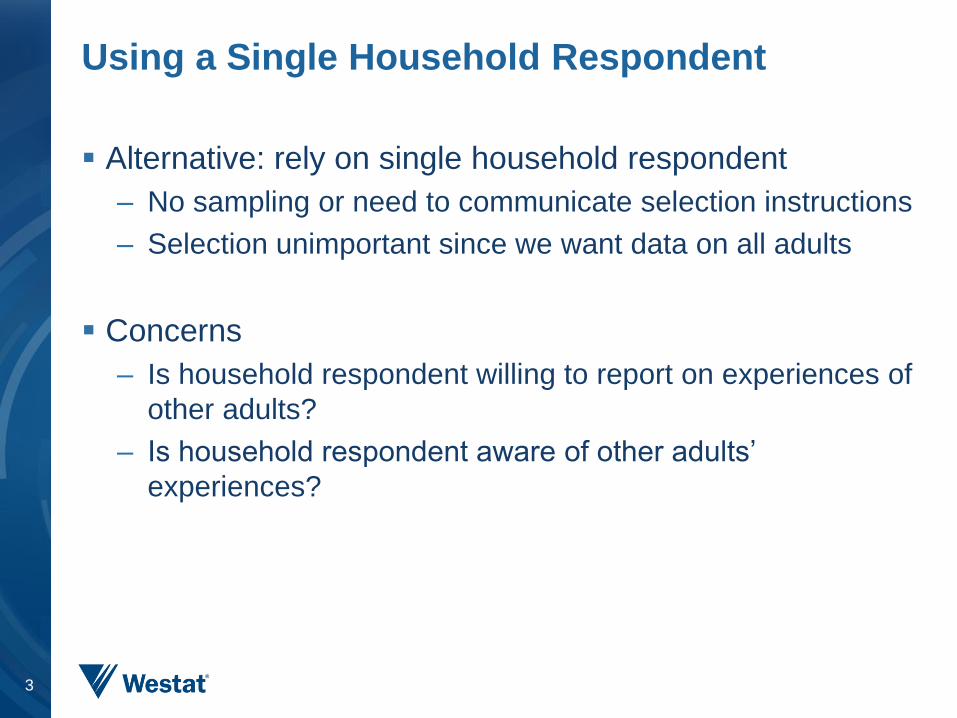
Using a Single Household Respondent
Alternative: rely on single household respondent
– No sampling or need to communicate selection instructions
– Selection unimportant since we want data on all adults
Concerns
– Is household respondent willing to report on experiences of
other adults?
– Is household respondent aware of other adults’
experiences?
3
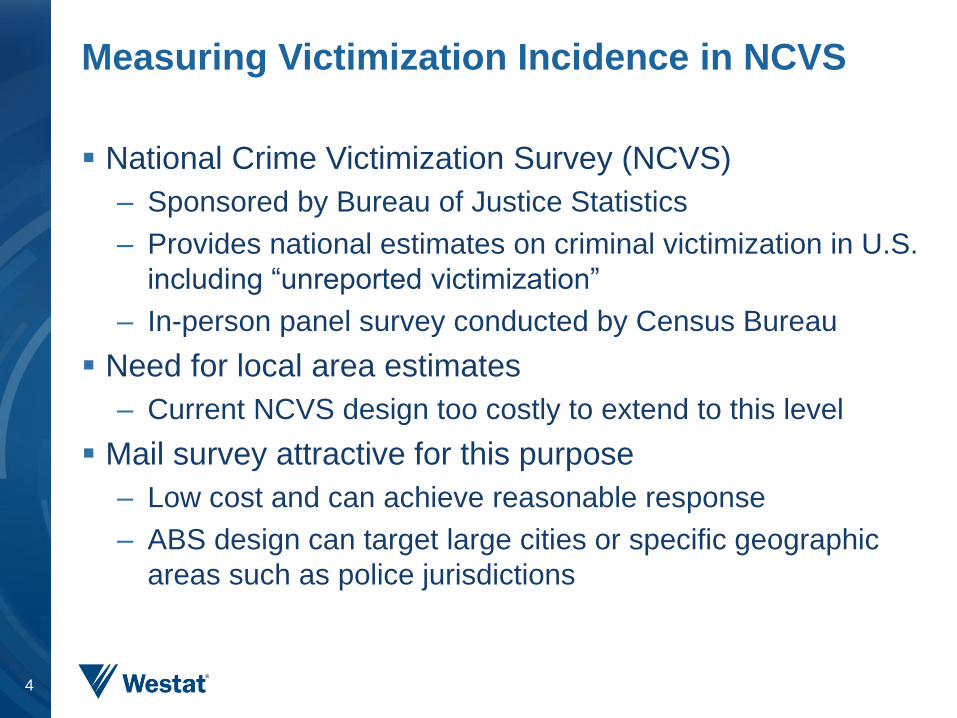
Measuring Victimization Incidence in NCVS
National Crime Victimization Survey (NCVS)
– Sponsored by Bureau of Justice Statistics
– Provides national estimates on criminal victimization in U.S.
including “unreported victimization”
– In-person panel survey conducted by Census Bureau
Need for local area estimates
– Current NCVS design too costly to extend to this level
Mail survey attractive for this purpose
– Low cost and can achieve reasonable response
– ABS design can target large cities or specific geographic
areas such as police jurisdictions
4
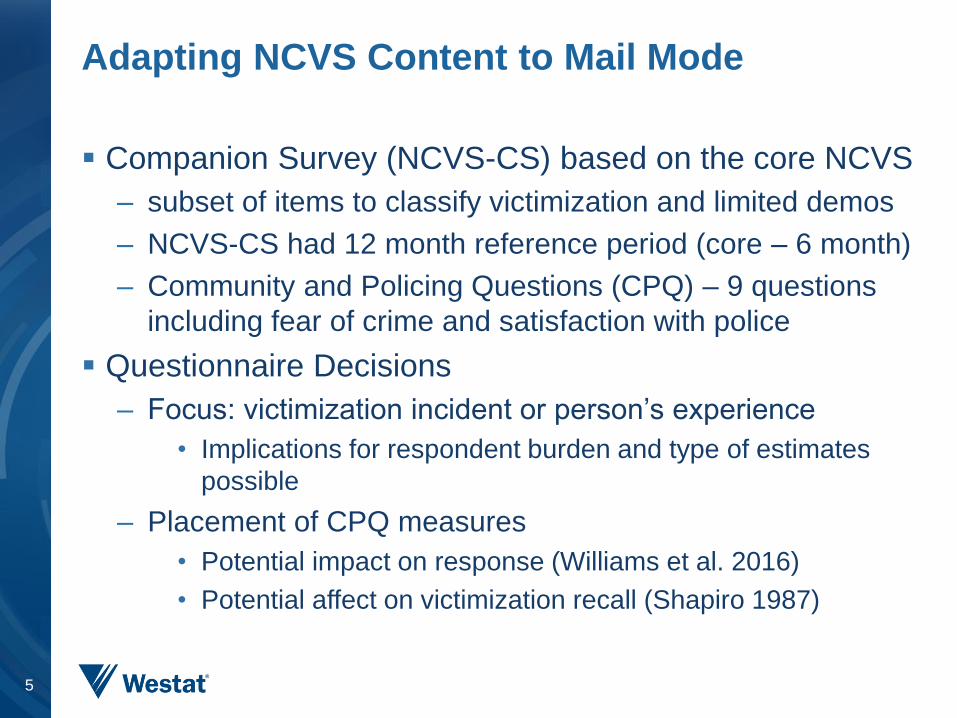
Adapting NCVS Content to Mail Mode
Companion Survey (NCVS-CS) based on the core NCVS
– subset of items to classify victimization and limited demos
– NCVS-CS had 12 month reference period (core – 6 month)
– Community and Policing Questions (CPQ) – 9 questions
including fear of crime and satisfaction with police
Questionnaire Decisions
– Focus: victimization incident or person’s experience
• Implications for respondent burden and type of estimates
possible
– Placement of CPQ measures
• Potential impact on response (Williams et al. 2016)
• Potential affect on victimization recall (Shapiro 1987)
5

Field Test Experiments and Outcomes
Questionnaire Version x Form Experiment
– Goal is to identify superior questionnaire approach
• Version: ILS (Incident Level Survey); PLS (Person Level
Survey)
• Form: (A) CPQ asked first; (B) CPQ asked last
– Outcome measures
• Unit response rates
• Item nonresponse
• Correlations with NCVS
6
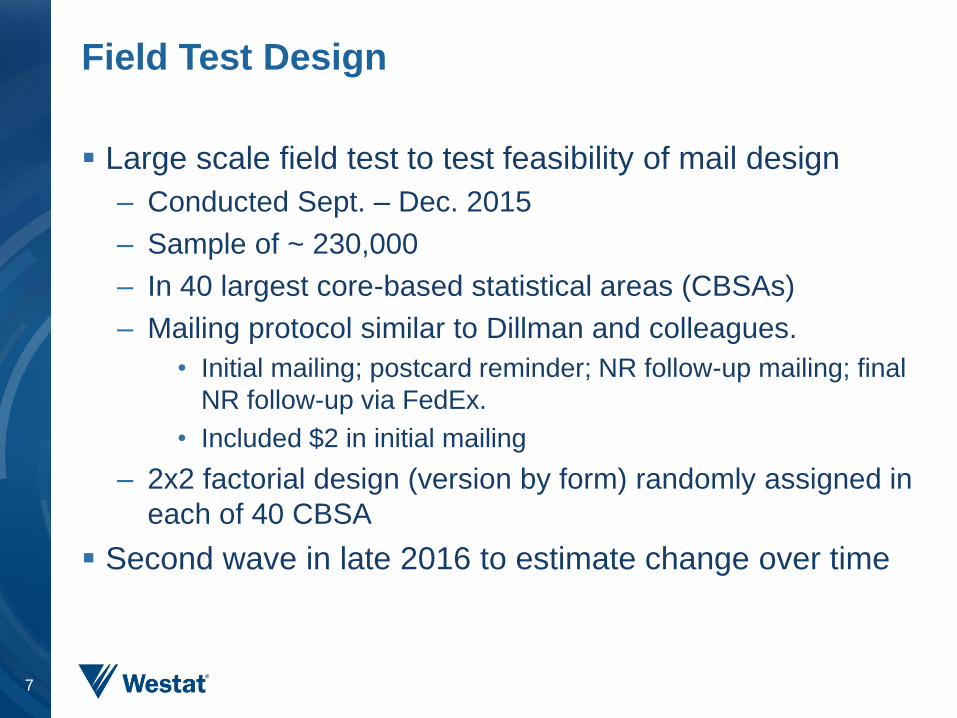
Field Test Design
Large scale field test to test feasibility of mail design
– Conducted Sept. – Dec. 2015
– Sample of ~ 230,000
– In 40 largest core-based statistical areas (CBSAs)
– Mailing protocol similar to Dillman and colleagues.
• Initial mailing; postcard reminder; NR follow-up mailing; final
NR follow-up via FedEx.
• Included $2 in initial mailing
– 2x2 factorial design (version by form) randomly assigned in
each of 40 CBSA
Second wave in late 2016 to estimate change over time
7

Results
8

Results: Response Rates
Overall response rate
– AAPOR RR3: 47.1 (across version & form)
Response rate by Version (ILS vs PLS) across Forms
– ILS: 43.6%
– PLS: 44.2%
– Roughly equivalent performance (small, but significant
difference z = -2.75, P = 0.006)
Results by Form (A – CPQ first/B – CPQ last)
– Differential response by Version (ILS & PLS)
9

Results: Response Rates by Version & Form
10
ILS: CPQ items presented last, response significantly
depressed (z = 5.83, P = 0.003)
PLS: No difference by CPQ placement
Version Overall Form A Form B
ILS 43.6% 44.5% 42.7%
PLS 44.2% 44.2% 44.2%
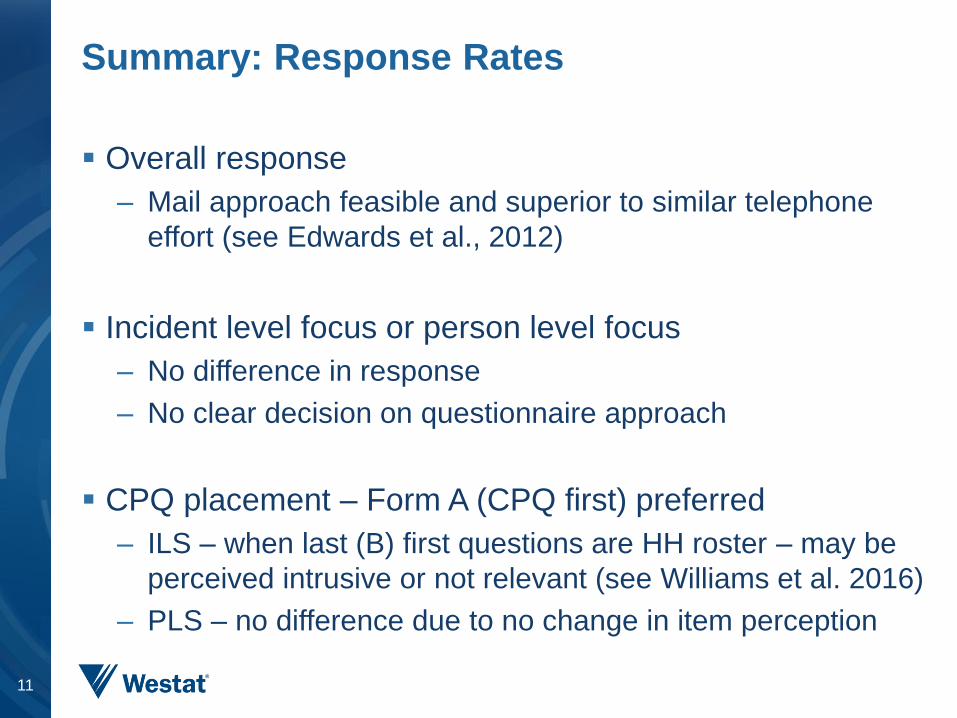
Summary: Response Rates
Overall response
– Mail approach feasible and superior to similar telephone
effort (see Edwards et al., 2012)
Incident level focus or person level focus
– No difference in response
– No clear decision on questionnaire approach
CPQ placement – Form A (CPQ first) preferred
– ILS – when last (B) first questions are HH roster – may be
perceived intrusive or not relevant (see Williams et al. 2016)
– PLS – no difference due to no change in item perception
11

Results: Item Nonresponse – Victimization Date
Date used to determine eligibility of incident
– If missing, assumed ineligible
– Acceptable if outside ref period – can determine eligibility
– ILS: unique incidents – up to 4 violent & 4 property starting
with most recent
– PLS: any experience – most recent only for each type
(physical attack, threats, sexual assault, personal theft)
Hypothesis
– ILS: more temporally distant have more item NR
– PLS: adults reported later (adult 3 or 4) have more item NR
12

Results: ILS Date Item Nonresponse
13
Both Forms Form A Form B
Outside Missing Valid Outside Missing Valid Outside Missing Valid
Violent
Number 1 15.2% 6.0% 78.9% 17.5% 6.2% 76.3% 12.2% 5.7% 82.1%
Number 2 20.6% 14.2% 65.2% 22.6% 12.4% 65.0% 18.2% 16.4% 65.5%
Property
Number 1 12.0% 5.1% 83.0% 13.5% 5.6% 80.8% 10.2% 4.4% 85.4%
Number 2 10.5% 10.6% 78.9% 9.9% 12.3% 77.7% 11.3% 8.1% 80.6%
Number 3 9.2% 19.4% 71.4% 9.1% 19.4% 71.4% 9.1% 40.3% 50.6%
Number 4 5.3% 73.7% 21.0% 4.6% 78.5% 16.9% 7.4% 59.3% 33.3%
Later victimizations have increasing item nonresponse
– More difficult to recall
– Ambiguity about when event occurred?
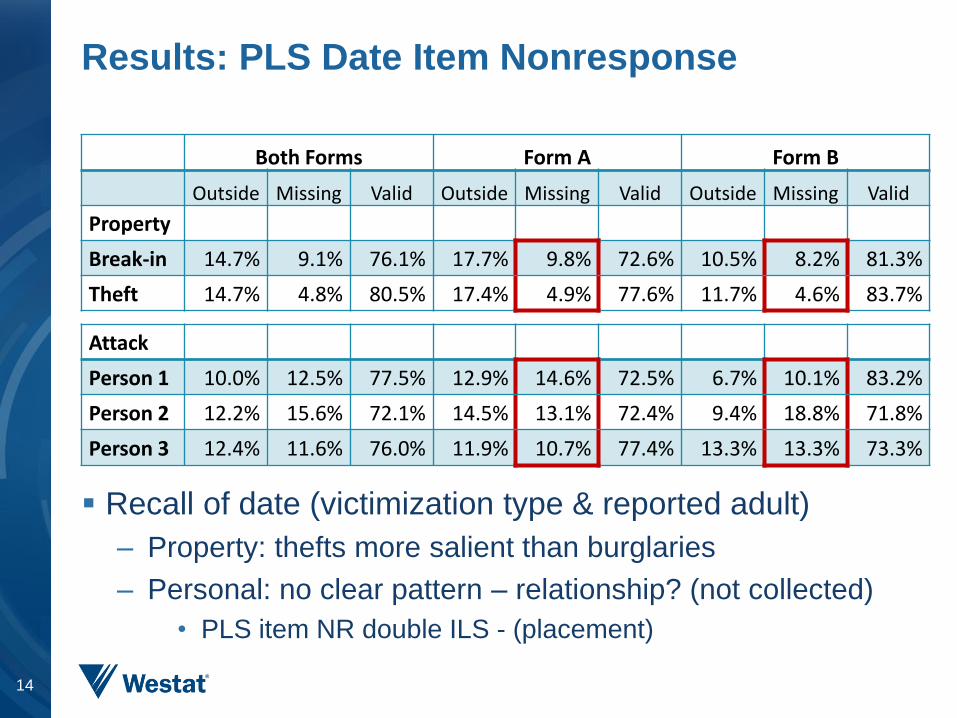
Results: PLS Date Item Nonresponse
14
Both Forms Form A Form B
Outside Missing Valid Outside Missing Valid Outside Missing Valid
Property
Break-in 14.7% 9.1% 76.1% 17.7% 9.8% 72.6% 10.5% 8.2% 81.3%
Theft 14.7% 4.8% 80.5% 17.4% 4.9% 77.6% 11.7% 4.6% 83.7%
Attack
Person 1 10.0% 12.5% 77.5% 12.9% 14.6% 72.5% 6.7% 10.1% 83.2%
Person 2 12.2% 15.6% 72.1% 14.5% 13.1% 72.4% 9.4% 18.8% 71.8%
Person 3 12.4% 11.6% 76.0% 11.9% 10.7% 77.4% 13.3% 13.3% 73.3%
Recall of date (victimization type & reported adult)
– Property: thefts more salient than burglaries
– Personal: no clear pattern – relationship? (not collected)
• PLS item NR double ILS - (placement)
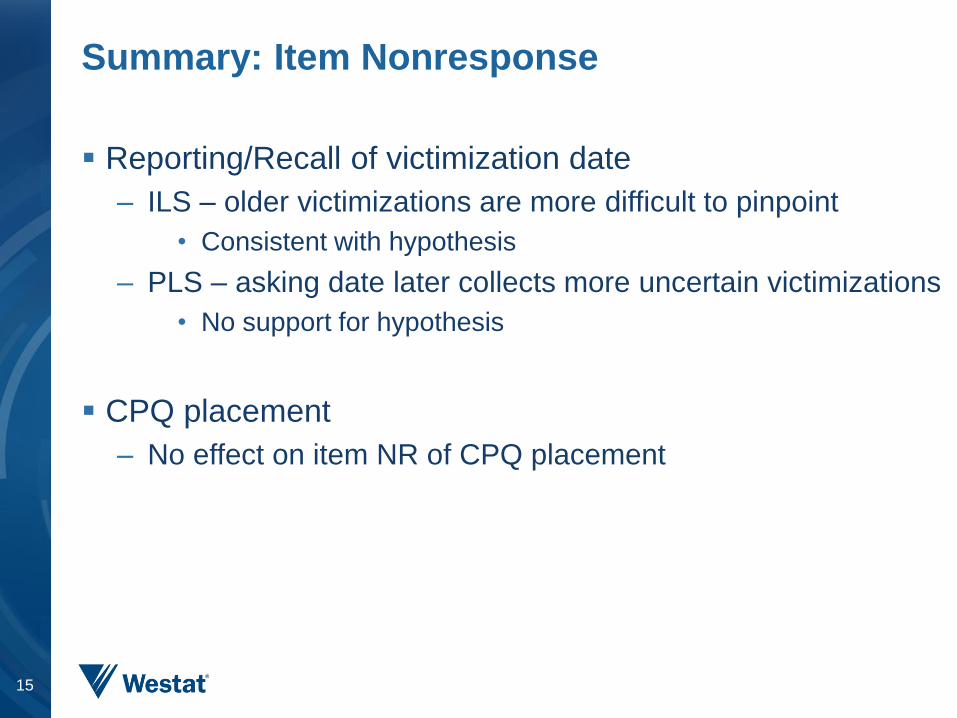
Summary: Item Nonresponse
15
Reporting/Recall of victimization date
– ILS – older victimizations are more difficult to pinpoint
• Consistent with hypothesis
– PLS – asking date later collects more uncertain victimizations
• No support for hypothesis
CPQ placement
– No effect on item NR of CPQ placement
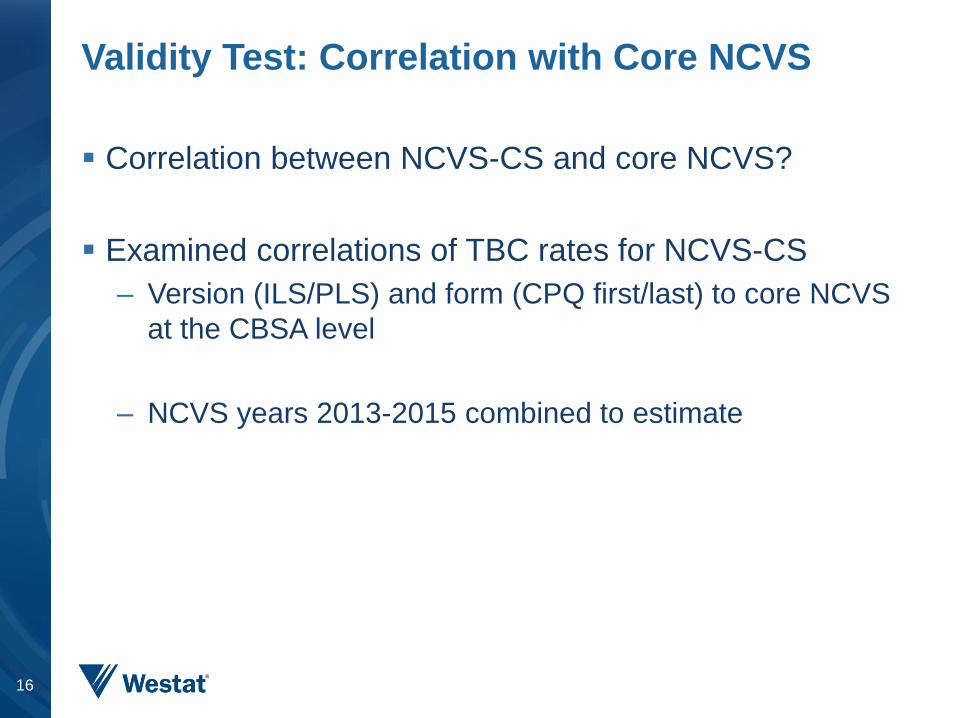
Validity Test: Correlation with Core NCVS
Correlation between NCVS-CS and core NCVS?
Examined correlations of TBC rates for NCVS-CS
– Version (ILS/PLS) and form (CPQ first/last) to core NCVS
at the CBSA level
– NCVS years 2013-2015 combined to estimate
16
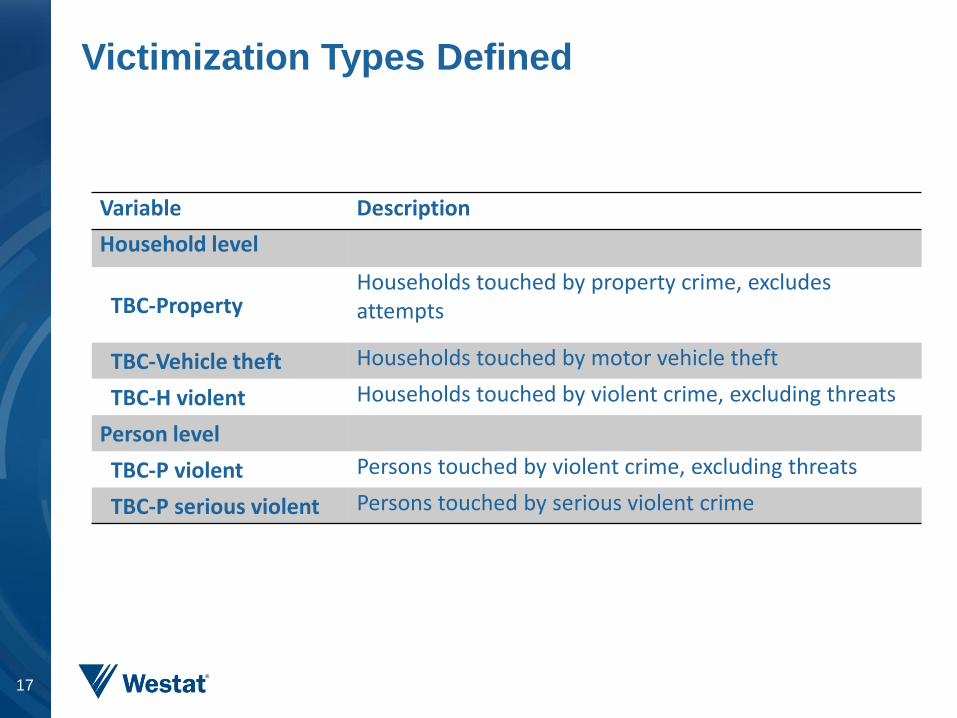
Victimization Types Defined
Variable Description
Household level
TBC-Property Households touched by property crime, excludes attempts
TBC-Vehicle theft Households touched by motor vehicle theft
TBC-H violent Households touched by violent crime, excluding threats
Person level
TBC-P violent Persons touched by violent crime, excluding threats
TBC-P serious violent Persons touched by serious violent crime
17

Results: Correlations with NCVS
18
NCVS -core NCVS-CS ILS-both ILS A ILS B PLS-both PLS A PLS B
TBC-Property TBC-Property1 0.64*** 0.67*** 0.52*** 0.65*** 0.67*** 0.56***
TBC-Vehicle theft TBC-Vehicle theft 0.34* 0.34* 0.18 0.59*** 0.71*** 0.26
TBC-H violent TBC-H violent1 0.54*** 0.40* 0.44** 0.47** 0.33* 0.24
TBC-P violent TBC-P violent1 0.45** 0.14 0.48** 0.50*** 0.39* 0.29
TBC-P serious viol TBC-P serious viol 0.47** 0.14 0.50*** 0.51*** 0.44** 0.30
* p < 0.05; ** p < 0.01; *** p < 0.001
Correlations: all positive and nearly all significant between
core NCVS and NCVS-CS
– Questionnaire version – similar; vehicle theft higher for PLS
– CPQ placement
• ILS form A higher for property; form B higher for personal violent
• PLS for A slightly higher for prop and violent victimization
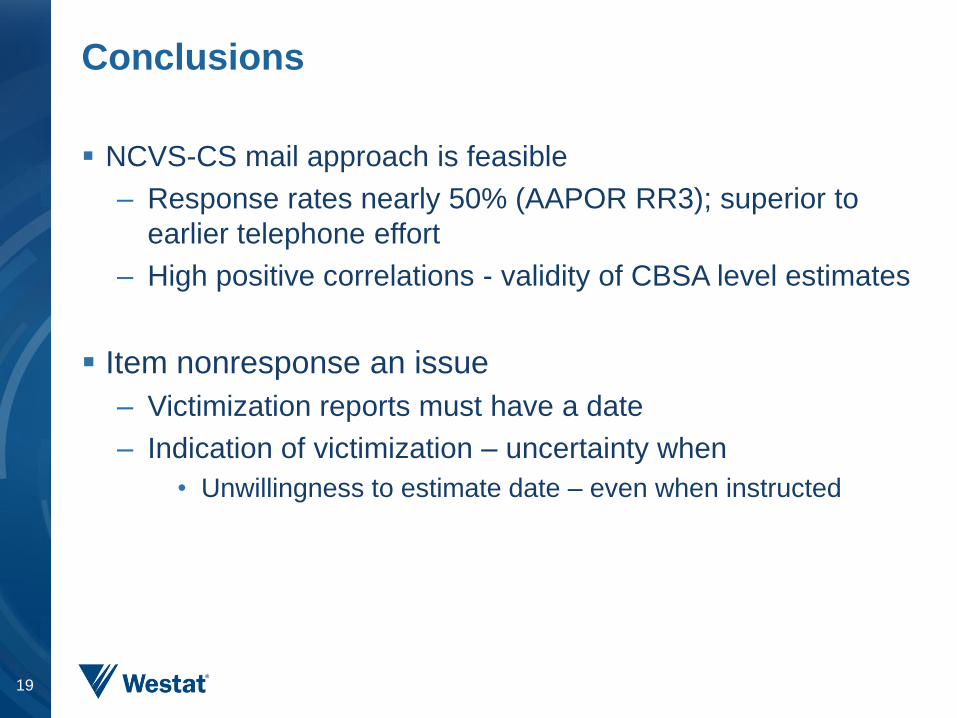
Conclusions
NCVS-CS mail approach is feasible
– Response rates nearly 50% (AAPOR RR3); superior to
earlier telephone effort
– High positive correlations - validity of CBSA level estimates
Item nonresponse an issue
– Victimization reports must have a date
– Indication of victimization – uncertainty when
• Unwillingness to estimate date – even when instructed
19
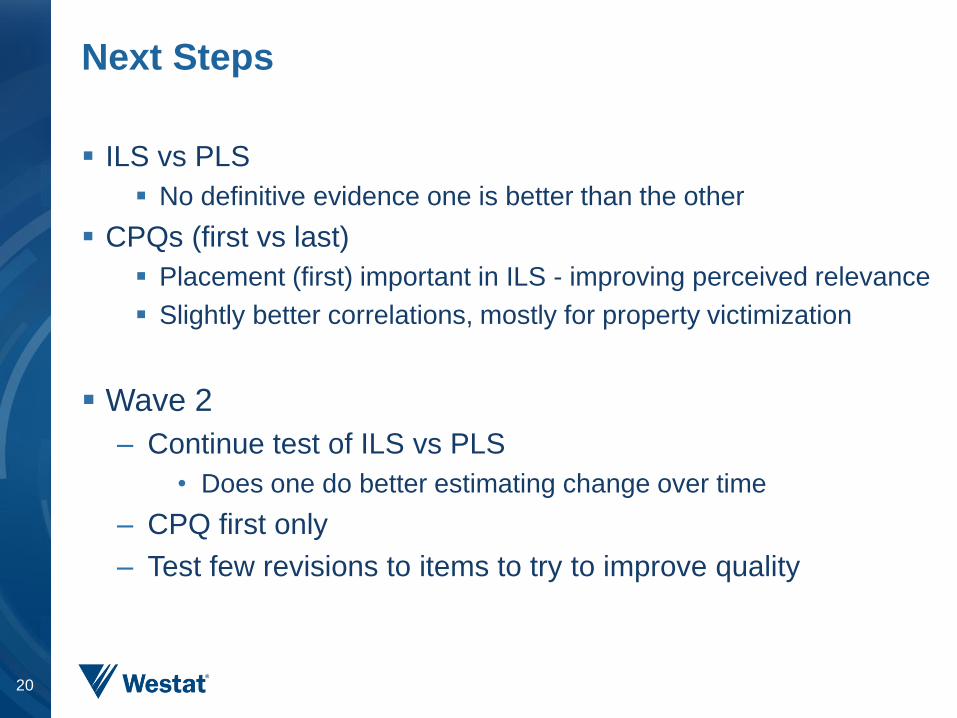
Next Steps
ILS vs PLS
No definitive evidence one is better than the other
CPQs (first vs last)
Placement (first) important in ILS - improving perceived relevance
Slightly better correlations, mostly for property victimization
Wave 2
– Continue test of ILS vs PLS
• Does one do better estimating change over time
– CPQ first only
– Test few revisions to items to try to improve quality
20

References
Dillman, Don. A., Smyth, J. D., & Christian, L. M. 2009. Internet, Mail, and
Mixed-Mode Surveys. The Tailored Design Method. 3rd ed. Hoboken, New
Jersey, USA: John Wiley & Sons, 234-99.
Edwards, W. S., Brick, J. M., & Lohr, S. L. (2012). Designing a low(er)-cost
companion to the National Crime Victimization Survey. In Federal
Committee on Statistical Methodology conference,
www.fcsm.gov/events/papers2012.html
Olson, K., Stange, M., & Smyth, J. (2014). Assessing within-household
selection methods in household mail surveys. Public Opinion Quarterly,
nfu022.
Shapiro, Gary M. 1987. Interviewer-Respondent Bias Resulting from Adding
Supplemental Questions. Journal of Official Statistics, 3(2), 155-168.
Williams, Douglas, J. Michael Brick, Jill Montaquila, and Daifeng Han. 2016.
Effects of Screening Questionnaires on Response in a Two-Phase Postal
Survey. International Journal of Social Research Methodology, 19(1), 51-67.
22