Evaluating leaf litter beetle data sampled by Winkler ... · Evaluating leaf litter beetle data...
14
Revista Brasileira de Entomologia 55(2): 253–266, junho, 2011 Data obtained in ecological studies deeply depend on the used sampling design and methodology. Most uncertainties of analysis results accrue from sample sizes too small for adequate power in tests of significance, the usage of “pseudo- replicates” instead of true replication and the missing knowledge of how well the spot sample represents the “tar- get” population (see Hurlbert 1984; Eberhardt & Thomas 1991). This is especially true for studies focusing on insect assemblages in tropical forests, where inventories are poorly known (Kim 1993; Stork 1994) and the environment is very heterogeneous. As sample size and number of true replicates are often influenced by limitations in time, manpower and cost effectiveness, the usage of sampling methods which fo- cus on snap-shots of the population in space and time are popular, in particular for sampling leaf litter invertebrates such as beetles. However, occurrence and abundance of epigeic beetle assemblages can vary throughout the year, mediated by changing environmental conditions (Wolda 1988). Therefore, the reliability of results obtained by snap- shot methods has to be evaluated. Many studies focusing on inventories and comparing beetle assemblages, cope with the problem of fluctuating beetle occurrences by expanding the sampling time. This extension could encompass a vegetation period or several years. A commonly used sampling method for this approach is pitfall trapping (e.g., Work et al. 2002). Many studies us- ing pitfall traps showed that beetle species occurrences change throughout the year or at least show clear seasonal abundance patterns (e.g., French & Elliott 1999; Finn et al. 2001; Jay- Robert et al. 2008). These results support the necessity of Evaluating leaf litter beetle data sampled by Winkler extraction from Atlantic forest sites in southern Brazil Philipp Werner Hopp 1 , Edilson Caron 2 , Richard Ottermanns 1 & Martina Roß-Nickoll 1 1 Institute for Environmental Research, University of Aachen, Worringerweg 1, 52064 Aachen, Germany. [email protected]; [email protected]; [email protected] 2 Campus Palotina, Universidade Federal do Paraná, Rua Pioneiro, 2153, Jardim Dallas, 85950–000 Palotina-PR, Brazil. [email protected] ABSTRACT. Evaluating leaf litter beetle data sampled by Winkler extraction from Atlantic forest sites in southern Brazil. To evaluate the reliability of data obtained by Winkler extraction in Atlantic forest sites in southern Brazil, we studied litter beetle assemblages in secondary forests (5 to 55 years after abandonment) and old-growth forests at two seasonally different points in time. For all regeneration stages, species density and abundance were lower in April compared to August; but, assemblage compo- sition of the corresponding forest stages was similar in both months. We suggest that sampling of small litter inhabiting beetles at different points in time using the Winkler technique reveals identical ecological patterns, which are more likely to be influenced by sample incompleteness than by differences in their assemblage composition. A strong relationship between litter quantity and beetle occurrences indicates the importance of this variable for the temporal species density pattern. Additionally, the sampled beetle material was compared with beetle data obtained with pitfall traps in one old-growth forest. Over 60% of the focal species captured with pitfall traps were also sampled by Winkler extraction in different forest stages. Few beetles with a body size too large to be sampled by Winkler extraction were only sampled with pitfall traps. This indicates that the local litter beetle fauna is domi- nated by small species. Hence, being aware of the exclusion of large beetles and beetle species occurring during the wet season, the Winkler method reveals a reliable picture of the local leaf litter beetle community. KEYWORDS. Coleoptera; comparison; pitfall traps; sampling method; seasonality. RESUMO. Avaliação dos besouros da liteira amostrados por extração Winkler na Floresta Atlântica do Sul do Brasil. Para avaliar a confiabilidade dos dados obtidos pela extração Winkler em coletas na Floresta Atlântica do Sul do Brasil, nós estudamos as assem- bléias de besouros da liteira em florestas secundárias (5 a 55 anos após abandono) e no estágio avançado em dois pontos no tempo sazonalmente diferentes. Para todos os estágios de renegeração, a densidade e abundância das espécies foram menores em abril comparado a agosto; porém, a composição das assembléias dos estágios florestais correspondentes foi similar em ambos os meses. Nós sugerimos que amostragens de pequenos besouros habitantes de liteira em diferentes pontos no tempo usando o método Winkler revelam padrões ecológicos idênticos. Um forte relacionamento entre a quantidade da liteira e a ocorrência de besouros indica a importância dessa variável no padrão temporal de densidade das espécies. Adicionalmente, o material amostrado foi comparado com dados de besouros obtidos utilizando armadilhas do tipo pitfall em um estágio avançado de regeneração. Cerca de 60% das espécies de interesse capturadas em pitfall foram também amostradas pela extração Winkler. Poucos besouros com tama- nho corporal grande para ser amostrado pela extração Winkler foram capturados com a armadilha pitfall. Isso indica que a fauna local de besouros da liteira é dominada por espécies pequenas. Portanto, sabendo da exclusão das espécies grandes e das espécies que ocorrem durante a estação chuvosa, o método Winkler revela um cenário confiável da comunidade local de besouros da literia. PALAVRAS-CHAVE. Armadilha pitfall; Coleoptera; comparação; métodos de amostragem; sazonalidade.
Transcript of Evaluating leaf litter beetle data sampled by Winkler ... · Evaluating leaf litter beetle data...

Revista Brasileira de Entomologia 55(2): 253–266, junho, 2011
Data obtained in ecological studies deeply depend on theused sampling design and methodology. Most uncertaintiesof analysis results accrue from sample sizes too small foradequate power in tests of significance, the usage of “pseudo-replicates” instead of true replication and the missingknowledge of how well the spot sample represents the “tar-get” population (see Hurlbert 1984; Eberhardt & Thomas1991). This is especially true for studies focusing on insectassemblages in tropical forests, where inventories are poorlyknown (Kim 1993; Stork 1994) and the environment is veryheterogeneous. As sample size and number of true replicatesare often influenced by limitations in time, manpower andcost effectiveness, the usage of sampling methods which fo-cus on snap-shots of the population in space and time arepopular, in particular for sampling leaf litter invertebrates
such as beetles. However, occurrence and abundance ofepigeic beetle assemblages can vary throughout the year,mediated by changing environmental conditions (Wolda1988). Therefore, the reliability of results obtained by snap-shot methods has to be evaluated.
Many studies focusing on inventories and comparingbeetle assemblages, cope with the problem of fluctuatingbeetle occurrences by expanding the sampling time. Thisextension could encompass a vegetation period or severalyears. A commonly used sampling method for this approachis pitfall trapping (e.g., Work et al. 2002). Many studies us-ing pitfall traps showed that beetle species occurrences changethroughout the year or at least show clear seasonal abundancepatterns (e.g., French & Elliott 1999; Finn et al. 2001; Jay-Robert et al. 2008). These results support the necessity of
Evaluating leaf litter beetle data sampled by Winkler extraction fromAtlantic forest sites in southern Brazil
Philipp Werner Hopp1, Edilson Caron2, Richard Ottermanns1 & Martina Roß-Nickoll1
1Institute for Environmental Research, University of Aachen, Worringerweg 1, 52064 Aachen, Germany. [email protected];[email protected]; [email protected]
2Campus Palotina, Universidade Federal do Paraná, Rua Pioneiro, 2153, Jardim Dallas, 85950–000 Palotina-PR, Brazil. [email protected]
ABSTRACT. Evaluating leaf litter beetle data sampled by Winkler extraction from Atlantic forest sites in southern Brazil. Toevaluate the reliability of data obtained by Winkler extraction in Atlantic forest sites in southern Brazil, we studied litter beetleassemblages in secondary forests (5 to 55 years after abandonment) and old-growth forests at two seasonally different points intime. For all regeneration stages, species density and abundance were lower in April compared to August; but, assemblage compo-sition of the corresponding forest stages was similar in both months. We suggest that sampling of small litter inhabiting beetles atdifferent points in time using the Winkler technique reveals identical ecological patterns, which are more likely to be influenced bysample incompleteness than by differences in their assemblage composition. A strong relationship between litter quantity andbeetle occurrences indicates the importance of this variable for the temporal species density pattern. Additionally, the sampledbeetle material was compared with beetle data obtained with pitfall traps in one old-growth forest. Over 60% of the focal speciescaptured with pitfall traps were also sampled by Winkler extraction in different forest stages. Few beetles with a body size too largeto be sampled by Winkler extraction were only sampled with pitfall traps. This indicates that the local litter beetle fauna is domi-nated by small species. Hence, being aware of the exclusion of large beetles and beetle species occurring during the wet season, theWinkler method reveals a reliable picture of the local leaf litter beetle community.
KEYWORDS. Coleoptera; comparison; pitfall traps; sampling method; seasonality.
RESUMO. Avaliação dos besouros da liteira amostrados por extração Winkler na Floresta Atlântica do Sul do Brasil. Para avaliar aconfiabilidade dos dados obtidos pela extração Winkler em coletas na Floresta Atlântica do Sul do Brasil, nós estudamos as assem-bléias de besouros da liteira em florestas secundárias (5 a 55 anos após abandono) e no estágio avançado em dois pontos no temposazonalmente diferentes. Para todos os estágios de renegeração, a densidade e abundância das espécies foram menores em abrilcomparado a agosto; porém, a composição das assembléias dos estágios florestais correspondentes foi similar em ambos os meses.Nós sugerimos que amostragens de pequenos besouros habitantes de liteira em diferentes pontos no tempo usando o métodoWinkler revelam padrões ecológicos idênticos. Um forte relacionamento entre a quantidade da liteira e a ocorrência de besourosindica a importância dessa variável no padrão temporal de densidade das espécies. Adicionalmente, o material amostrado foicomparado com dados de besouros obtidos utilizando armadilhas do tipo pitfall em um estágio avançado de regeneração. Cerca de60% das espécies de interesse capturadas em pitfall foram também amostradas pela extração Winkler. Poucos besouros com tama-nho corporal grande para ser amostrado pela extração Winkler foram capturados com a armadilha pitfall. Isso indica que a faunalocal de besouros da liteira é dominada por espécies pequenas. Portanto, sabendo da exclusão das espécies grandes e das espéciesque ocorrem durante a estação chuvosa, o método Winkler revela um cenário confiável da comunidade local de besouros da literia.
PALAVRAS-CHAVE. Armadilha pitfall; Coleoptera; comparação; métodos de amostragem; sazonalidade.

254 Hopp et al.
Revista Brasileira de Entomologia 55(2): 253–266, junho, 2011
long-term sampling using pitfall traps for ecological beetlestudies. However, despite the advantages of using pitfall traps,this method bears many sources of error (Adis 1979). Numer-ous studies showed that catches are dependent on temperature(Raworth & Choi 2001), vegetation structure and density (Top-ping & Sunderland 1992; Melbourne 1999; Bonte et al. 2002),season (Raworth & Choi 2001; Topping & Sunderland 1992)and the activity of ground dwelling species (Morrill et al. 1990).Furthermore, the catches are influenced by the duration of sam-pling (Riecken 1999), the killing agent used (Weeks &McIntyre 1997) and by species-specific escape abilities(Halsall & Wratten 1988). Lang (2000) concluded that the re-lationship between pitfall trap catches and actual populationdensities appeared to be either absent, weak or highly variableamong taxa, habitat and time of the season.
Litter sifting with Winkler extraction (Besuchet et al.1987), an alternative sampling method which provides anarea related measure of faunal assemblages independent ofspecies activity, was shown to more efficiently sample antspecies (Olsen 1991; Fisher & Robertson 2002; Martelli etal. 2004; but, see Parr & Chown 2001) and more adequatelypictured ant (Ivanov & Keiper 2009) and harvestmen (Bancila& Plaiasu 2009) assemblages than did pitfall traps. We arenot aware of any comparable study for beetles; however, re-sults will surely depend on the beetle family studied. However,the Winkler method is, due to its destructive manner and itssensitivity to the actual moisture content of the sampledmaterial, not suitable to sample insect assemblages over alonger time span or during periods of high precipitation.
Recently we analyzed leaf litter beetle data obtained us-ing litter sifting with Winkler extraction in a chronosequenceapproach to evaluate the ecological response of leaf litterbeetles to forest regrowth in the submontane Atlantic forestof Southern brazil (Hopp et al. 2010). In order to evaluatethe reliability and suitability of using this method to gener-ate ecological data for litter inhabiting beetle assemblages,we aimed in the present study to estimate the quality of datareceived by litter sifting.
First, we estimated the variations of beetle occurrences attwo different points in time using litter sifting and Winklerextraction. The aim was to evaluate the variation of beetle as-semblages at different points in time and to test if sample setscollected in a different season result in a similar recovery pat-tern during forest regeneration recently postulated by theauthors (Hopp et al. 2010). Second, we examined, if litter quan-tity (revealed as regionally important factor for the diversityand distribution of litter beetles) affects a temporal pattern.This was done to distinguish between seasonal differences andenvironmental factor mediated differences in species densityand abundance. Third, we analyzed beetle data, which wassampled using pitfall traps in one old-growth forest stand. Theaim was to estimate, to which extent the litter sifting data re-flected the data obtained from the pitfall trap sampling.
To accomplish these aims we answered the following re-search questions: 1) Do species density, abundance andcomposition of beetle species sampled by litter sifting differ
between two sampling dates, featuring different environmen-tal conditions? 2) Do beetle assemblages sampled by littersifting at these different sampling dates show the same pat-terns along successional stages? 3) Does litter volume affecttemporal variations in the species density pattern? 4) Is the“pitfall trap fauna” observed different to the “Winkler fauna”?
MATERIAL AND METHODS
Study sites and design. The study was conducted insubmontane Atlantic forests, which are situated in the mu-nicipalities of Antonina and Guaraqueçaba, Paraná, Brazil.We installed study sites in different aged secondary forests(Stage 1: ~8 yrs after abandonment; Stage 2: 12–15 yrs, Stage3: 35–50 yrs) and old-growth forest (> 100 yrs), which werelocated in the reserve Serra do Itaqui (Itaqui, Fig.1), ownedby the NGO Sociedade de Pesquisa em Vida Selvagem(SPVS), to investigate the temporal variations in beetle oc-currences sampled using the Winkler technique. All studysites were installed on cambisol to avoid effects of soil typeon beetle density and composition. The study sites were scat-tered over the reserve to avoid bias due to spatial distanceamong replicate sites. Beetles were sampled in each studysite at two sampling dates: April 2007 and August 2007. Thesesampling dates were chosen, because of two important rea-sons: First, April, which marks the end of the hot wet seasonand the beginning of the cool dryer season and August, whichrepresents the end of the cool dryer season, are two season-ally different points in time, varying strongly in theirenvironmental conditions. Second, the lower precipitation inthese months sets suitable conditions for extracting beetlesusing the Winkler technique.
The beetles were sifted from leaf litter of twenty 1-m2
quadrates per study site. One square meter (1-m2) leaf littersamples were taken every 5 m along two parallel 50 mtransects (separated by 20 m). These were installed at least50 m from the forest edge to exclude edge effects. The entireleaf litter of 1-m2 forest floor, including little twigs and partlydecomposed organic material, was sifted in several portionsthrough a ten mm mesh by intensively shaking a bag-sievefor approximately one minute for each portion. After sifting,samples were transferred into a bag for transportation.Samples were extracted using the Winkler technique(Besuchet et al. 1987). The Winkler bags were suspendedfor 3 days, which could be shown suitable for a comparativeleaf litter beetle survey (Krell et al. 2005). No further handsorting was performed. To avoid great differences in mois-ture content of the sampled leaf litter, I only collected on drydays when there had been no rain the previous day. Nine beetlefamilies (Staphylinidae, Curculionidae, Carabidae, Tenebrio-nidae, Eucinetidae, Leiodidae, Endomychidae, Hydrophilidaeand Cerylonidae; here denoted as “reduced family set”) werestudied to characterize species density, abundance and as-semblage composition of each study site. Staphylinidae,Curculionidae and Carabidae were chosen because of theirhigh number of individuals in the samples. The less abun-

255Evaluating leaf litter beetle data sampled by Winkler extraction from Atlantic forest sites
Revista Brasileira de Entomologia 55(2): 253–266, junho, 2011
dant families were chosen because of; (a) an adequate cer-tainty of determination, due to large morphological variety(Tenebrionidae, Leiodidae) or moderate species numbers(Endomychidae, Eucinetidae, Cerylonidae), and (b) theirpresence in almost every investigated forest stage, whichenabled a detection of species shift during secondary suc-cession within beetle families (Hydrophilidae, Tenebrio-nidae). Additionally, the possibility to cooperate with spe-cialists in some beetle families influenced the selection. Thesampled individuals were sorted to morphospecies or, if pos-sible, to species. Aleocharinae, Pselaphinae, Scydmaeninae(Staphylinidae), Scolytinae (Curculionidae) and the carabidgenus Oxydrepanus were excluded due to uncertainties inthe separation of morphospecies.
The pitfall trap sampling was conducted in one old-growthforest stand located in the reserve Rio do Cachoeira (Fig.1),owned by the NGO SPVS. The sampling was performed fromMarch 2007 to July 2008. Ten traps were activated everymonth for one week making a total of 2856 trapping hours.Traps were filled with a 2–4% formaldehyde solution andwere emptied after each sampling week to ensure a compari-son of the monthly catches. Scydmaeninae (Staphylinidae)was excluded from further analysis due to very small catchesand uncertainties in identification. Data from September andOctober 2007 had to be excluded from the analysis becauseseveral traps were destroyed by animals and flooded by rain-fall.
Additionally, for the comparison of the beetle materialgathered with the different sampling methods, we also usedbeetle data sampled by Winkler extraction in the same old-growth forest in the Rio do Cachoeira reserve. These data
were collected between June-July 2003 using the same studydesign and sampling protocol explained for Itaqui (also seeHopp et al. 2010).
Data analysis. Temporal variations of the “Winklerfauna”. To compare the species densities of the two sam-pling dates (Itaqui: April and August 2007) in each studysite, we estimated the total number of beetle species per 20m2 for each study site-sampling date combination using theJackknife 1 richness estimator (PCOrd 5; McCune & Mefford1999). The cumulated number of individuals per study sitewas used to compare the abundances between the two sam-pling dates. A t-test or u-test (if data do not indicate normaldistribution and equal variances) were conducted separatelyfor every forest stage, to test for statistical difference be-tween the sampling dates on a stage level. However,calculating the average species density or abundance of thedifferent sampling dates on the basis of three replicates perstage could mask differences occurring on site level throughhigh intra-site differences, which exceeds the site specifictemporal differences. Therefore, a one-sided paired t-test wasconducted among all sites to test for statistical differencebetween the sampling dates on site level (routine t.test in R,R Development Core Team 2009). Differences in assemblagecomposition among forest stages and sampling dates wereanalyzed using multi-response permutation procedure (MRPP;PCOrd 5). The pattern were visualized using nonmetric multi-dimensional scaling (NMDS, PCORD 5) ordination based onsquare root transformed data to down weight abundant spe-cies and Bray-Curtis distance measure.
Relationship of litter volume to species density. To testfor differences in litter volume between the two samplingdates (Itaqui: April and August 2007), we compared the lit-ter volumes of 20 m2 forest floor using a one-sided pairedt-test (routine t.test in R). The according assumption of nor-mal distribution was tested with the Lilliefors normality test(Dallal & Wilkinson 1986; routine lillie from package nortest[Gross 2006] in R). Linear correlation analysis between beetledensity and litter volume was performed using a linear model(routine lm in R). Linear modeling was also used to calculateANCOVA models, evaluating the differences in species den-sity between the two sampling dates independently from littervolume.
“Pitfall trap fauna” vs. “Winkler fauna”. Number ofspecies and activity abundance of the pitfall trap catches werecompared between the different sampling dates (= month) onthe basis of; (1) all sampled beetle species (2) only the beetlespecies, which belong to the “reduced family set”. For this,the catches of the ten pitfall traps were summed for eachmonthly sampling period. To evaluate the data quality and toverify if the monthly sampled numbers are biased by fluctua-tions in the completeness of the sampled data set, samplecompleteness was given for each month by dividing the num-ber of species captured through the estimated total number ofbeetles calculated using the Jackknife 1 estimator (EstimateS,Colwell 2006). Additionally, captures per trap were given forsingle species, which showed high abundances and featured a
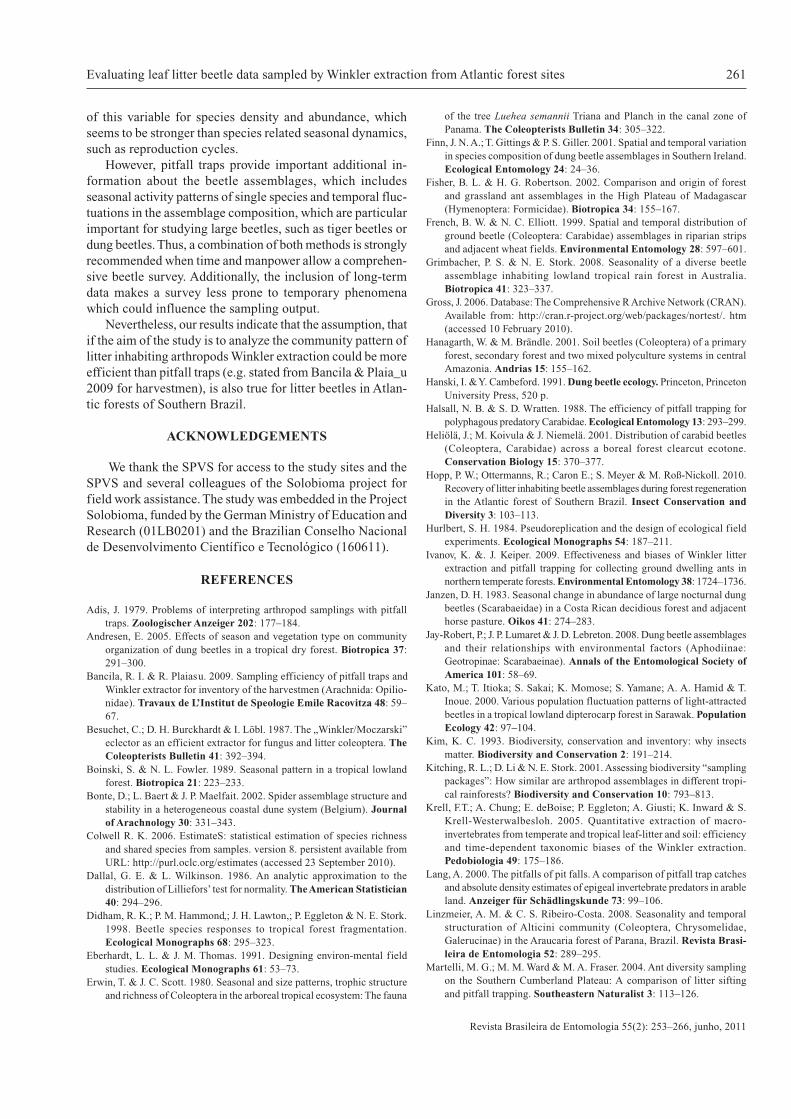
Fig. 1. Location of the two nature reserves Serra do Itaqui and Rio doCachoeira owned by the NGO SPVS, in which the study sites were in-stalled. The reserves are situated in the municipalities of Guaraqueçabaand Antonina, within the APA Guaraqueçaba, Paraná, Brazil.

256 Hopp et al.
Revista Brasileira de Entomologia 55(2): 253–266, junho, 2011
noticeable abundance pattern. This was done to acquire anindication if differences in abundance are related to high num-bers of catches in single traps and consequently could becoincidental rather than real abundance peaks.
To compare the beetle material gathered from the differ-ent methods, we explored which species caught with pitfalltraps were also obtained by litter sifting, by comparing theset of species, belonging to the “reduced family set”, sampledwith pitfall traps in one old-growth forest with species datasampled by litter sifting; (i) at the same site in June-July 2003(see Hopp et al. 2010), (ii) in old-growth forest sites of Itaquisampled in August 2007, (iii) in old-growth forest sites ofItaqui sampled in April 2007 and (iv) in secondary forests(Stage 1–3) of Itaqui sampled in August/April 2007.
RESULTS
Beetle data. A total of 3210 beetles and 155 specieswere extracted from 440 m2 leaf litter in different foreststages of the Serra do Itaqui reserve using the Winkler tech-nique (Appendix I).
In 2856 hours of pitfall trapping, using ten traps in oneold-growth forest site, we sampled a total of 774 beetles rep-resenting 81 species. Most abundant families were Curcu-lionidae (216 individuals), in particular Scolytinae (189),Staphylinidae (171), Hydrophilidae (96), Scarabaeidae (90)and Nitidulidae (85). Most abundant species were ScolytinaeMS 4 (110 individuals), Hydrophilidae MS 3 (80) andAleocharinae MS 55 (75). The proportion of singletons anddoubletons using pitfall traps was comparably high (54%) tothat obtained by litter sifting (33–74%).
Temporal variations of the “Winkler fauna”. Speciesdensities estimated (Jackknife 1) for 20m2 forest floor werelower in April than in August (2007) in all sites, with the ex-ception of one old-growth forest site (Fig. 2). Due to vastdifferences between the replicate sites of the different stagesat both sampling dates, the differences in species density werenot significant on stage level (t/u-test, n = 3; Stage 1: p = 0.12,Stage 2: p = 0.33, Stage 3: p = 0.62, Stage 4: p = 0.14). How-ever, a paired t-test among all sites showed that significantlymore beetle species were sampled in August compared to April(n = 11, t = 3.2611, df = 10, p = 0.004). Coinciding to thepattern of species density, we found significantly more beetleindividuals in all study sites by sampling in August comparedto April (Fig. 2). However, due to pronounced differences be-tween the replicate sites, the abundances were not significantlydifferent between the two sampling dates on stage level.
The beetle assemblage composition in sites of Stages 1and 2 were very heterogeneous. They showed great differ-ences between both the different sites and the sampling datesof the same site (Fig. 3). Accordingly, the assemblages of thestudy sites sampled in August and April (2007) were, due tothe high inter-replicate differences, not significantly differ-ent for Stage 1 (MRPP, n = 3, p = 0.42; significances for Stage2 could not be calculated as only two replicate sites existed).The beetle assemblages of Stages 3 and 4 were much less
Fig. 2. Estimated total species density (A) and abundance (B) of 20 m2 forestfloor at two different sampling dates in secondary forests and old-growthforests in submontane Atlantic forests of the Serra do Itaqui reserve, Brazil.Each study site (square: site 1, circle: site 2, triangle: site 3) of the differentforest stages (1–4) was separately analyzed for sampling in April 2007 (fullsymbols/bars) and August 2007 (open symbols/bars). Species numbers aredisplayed as Jackknife 1 (Jack 1) estimation with standard deviation. Abun-dances are displayed as cumulative number of individuals for 20 1-m2 samples.
Fig. 3. Nonmetric multidimensional Scaling (NMDS) ordination of litterinhabiting beetle assemblages, according to successional stage (Stages 1–4, replicate sites a-c) and sampling date (full squares: April 2007, opencircles: August 2007). Sites grouped closer together are more similar inspecies composition. 2D plot based on square root transformed abundancedata and Bray-Curtis distance (final stress of solution: 0.17).
A
B

257Evaluating leaf litter beetle data sampled by Winkler extraction from Atlantic forest sites
Revista Brasileira de Entomologia 55(2): 253–266, junho, 2011
variable (Fig. 3). Their assemblages were not notably differ-ent between the sampling dates (MRPP, n = 3, Stage 3: p = 0.20;Stage 4: p = 0.34). Furthermore, Stages 3 and 4 showed nosignificant difference between each other independent of thesampling date. However, Stages 3 and 4 showed a significantdifferent species composition compared to Stages 1 and 2.
Relationship of litter volume to species density. Littervolume were significantly higher in August 2007 comparedto April 2007 (paired t-test: t = 7.9617, df = 10, p < 0.001).Linear correlation analysis, relating the estimated speciesdensity to the leaf litter volume of 20 m2 forest floor, revealedthat the estimated number of species at all sites-sampling datecombinations showed a strong linear relationship to litter vol-ume for April as well as August (April: adjusted R2 = 0.62,p = 0.002, August: 0.47 and 0.012 resp., Fig. 4). This correla-tion is so strong, that species density does not show asignificant relation to sampling date anymore when partiallingout the effect of litter volume first (see Table I).
“Pitfall trap fauna” vs. “Winkler fauna”. Beetle catcheswith pitfall traps varied strongly among the monthly sam-plings; but showing no general difference between the wetseason (December-March 2008) and the dryer season (June-
October 2007; Fig. 5). However, activity abundance curvesfor single species showed that a few abundant species (e.g.Deltochilum sp.1) occurred only in the rainy and the inter-mediate season, but, were absent in the dryer season (Fig. 6).Most species were caught in low abundances; some through-out the whole year showing no seasonal related occurrencesor abundance peaks, others as singletons. Almost all speciesof the “reduced family set” belonged to this group.
Table I. Results of ANCOVA on the effect of litter volume on beetle speciesdensity at two different sampling points. Litter volume was added ascovariable and sampling date as fixed factor.
t value p
Intercept -2.101 0.05001
Litter 3.829 0.00123
Sampling date 0.805 0.43123
Sampling date x litter -0.856 0.40334
Fig. 4. Scatter plots of species density vs. litter volume per 20 m2 forestfloor including linear correlation analysis for forests located in Itaqui re-serve sampled in August (A) and April 2007 (B).
A
B
From the total of 81 species captured with pitfall traps, 43species (53%) were members of the “reduced family set” (TableII). Sixty-two percent (27 species) of these 43 species werealso found by litter sifting and Winkler extraction (Table II).We found 17 (40%) of the 43 species by litter sifting in July
Fig. 5. Patterns for number of individuals (full circles, solid line) and spe-cies (open triangles, dashed line) captured with pitfall traps in an old-growthforest of Cachoeira reserve from March 2007 to July 2008. Curves wereplotted for all species captured (A) and a reduced data set covering thespecies, which belonged to the beetle families also studied using litter sift-ing (B). September and October 2007 were excluded due to unreliablesamples. Numbers in figure (A) indicate the percentage of sample com-pleteness calculated by dividing the number of sampled species throughthe estimated total number of species using the Jackknife estimation.
A
B

258 Hopp et al.
Revista Brasileira de Entomologia 55(2): 253–266, junho, 2011
2003 at the same study site (Table II, Stage 4 [C3F]). Eight ofthe 17 species were not captured during the dryer season us-ing pitfall traps. Almost half (47%) of the 43 species werefound by litter sifting in the three old-growth forest sites ofItaqui reserve (April + August). However, none of these spe-cies were exclusively found by litter sifting in April 2007 (TableII). Many of the 43 species were also found in sites of othersuccessional stages, mostly old secondary forests. The 16 spe-cies not found with litter sifting but captured with pitfall trapswere mainly caught in low abundances. Except for the carabidspecies Pterostichini MS1, none of these species featured anotably larger body size than species of the “reduced familyset”. The species collected with pitfall traps which were notrecognized by litter sifting belonged to the Scolytinae(Curculionidae), Histeridae, Nitidulidae, Cincindelidae andAleocharinae (Staphylinidae). As Scolytinae (Curculionidae),Nitidulidae and Aleocharinae (Staphylinidae) were also fre-quently sampled by litter sifting but not further determined,these species cannot be compared between the two samplingmethods. However, no histerid (2 species found with pitfalltraps), cincindelid (1 species) nor scarabaeid (9 species) spe-cies were sampled by litter sifting at any sampling date,successional stage and location.
DISCUSSION
Temporal variations of the “Winkler fauna”. Speciesdensity and abundance of litter beetles clearly differed be-tween the two sampling dates: April and August 2007.
Surprisingly, more species with more individuals weresampled in August compared to April. This was quite unex-pected, as April is temporally much closer to the wet season.This period has often shown to have higher species richnessand abundance in tropical forests (at least at the beginningand the end of the wet season) compared to dryer phasesthroughout the year. Such increase of abundance and speciesrichness near the wet season was shown for Chrysomelids inAraucaria forests (Linzmeier & Ribeiro-Costa 2008), arbo-real beetles of the tree Luehea seemannii in the canal zone ofPanama (Erwin & Scott 1980) or dung beetles in Costa Ricandeciduous forests (Janzen 1983) and Mexican tropical dryforests (Andresen 2005). Reasons for the increase of abun-dance and species richness near the wet season were givenas; (1) a higher availability of food resources, such as theflush of new leafs (Boinski & Fowler 1989) or flowers (Katoet al. 2000), which often occurs at the beginning and the endof the wet season, (2) subsequent occurrences of predatorsthrough the increase of the abundance of its prey (Wolda1978) or (3) rainfall adapted reproduction cycles (Hanski &Cambeford 1991). In contrast to these results, Grimbacher& Stork (2008), who studied the seasonality of beetles usingMalaise and flight-interception traps in an Australianrainforest, found that although individual species were patchyin their temporal distribution, a wet season peak of insectactivity could not be observed. They suggested that this couldbe due to a missing uniform pattern of insect seasonality forthe humid tropics. Nevertheless, they showed that canopy-caught and larger beetles (> 5 mm) showed greater seasonalityand peaked later in the year compared to smaller or ground-caught beetles. Boinski & Fowler (1989), who investigatedfoliage phenology and arthropod abundance in a regenerat-ing lowland rainforest of Costa Rica also found that in contrastto arboreal arthropods, the arthropod fauna of dead, suspendedleafs showed little seasonality. Our results are in accordancewith these findings as, in spite of differences in species den-sity and abundance, the assemblage composition of matureforests was stunningly similar between the two samplingdates. Together, with results of the pitfall trap sampling onecan surmise that the micro-beetle assemblages of Atlanticforest leaf litter vary to some degree throughout the year,otherwise show little seasonal trend (also see Smythe 1982).Clear differences between the two sampling dates of the youngregeneration stages (Stages 1 and 2) reflect the differencesbetween the replicate sites at the same sampling date and forthat reason are most probably related to other causes thanthe temporal dynamics of their inhabiting species. Accord-ingly, the recovery pattern of species composition duringforest regeneration was almost identical at the two samplingdates. Thus, we suggest that sampling at different points intime using the Winkler technique and focusing on small lit-ter inhabiting beetles, reveals identical ecological patternsregarding forest regeneration. Furthermore, these patterns areidentified by very similar data sets, whose deviations are morelikely influenced by sample incompleteness than by strongdifferences in their assemblage composition. Similar beetle
Fig. 6. Activity abundance curves for species sampled with pitfall traps inan old-growth forest from March 2007 to July 2008. Curves are presentedfor abundant species, which do not occur in the dryer season between Juneand October (A) and which occurred in all seasons (B). September andOctober 2007 were excluded due to unreliable samples.
B
A

259Evaluating leaf litter beetle data sampled by Winkler extraction from Atlantic forest sites
Revista Brasileira de Entomologia 55(2): 253–266, junho, 2011
Table II. Comparison of the occurrence of beetle species (Curculionidae [excluding Scolytinae], Leiodidae, Carabidae [excluding Oxydrepanus],Staphylinidae [excluding Aleocharinae, Pselaphinae, Scydmaeninae], Tenebrionidae, Endomychidae, Eucinetidae and Hydrophilidae), sampled with pitfalltraps in one old-growth forest site of Cachoeira reserve (C3F) from March 2007 to July 2008 with species data sampled by litter sifting; (i) at the samesite (C3F) in June-July 2003, (ii) in old-growth forest sites of Itaqui reserve sampled in August 2007 (n = 3), (iii) in old-growth forest sites of Itaquireserve sampled in April 2007 (n = 3) and (iv) in secondary forests (Stage 1-3) of Itaqui sampled in August/April 2007 (n = 18). The pitfall trap catcheswere subdivided into four seasonal segments: wet season, intermediate months between wet season and dryer season, dryer season and intermediate monthsbetween dryer season and wet season. Catches in any month of a seasonal segment or by litter sifting at different sampling dates and successional stagesare indicated by check marks, independent of the number of individuals found.
Species Family
Sampling method and sampling date
Pitfall trap (Stage 4, C3F, March 2007 – July 2008) Litter sifting
Wet seasonDec-Mar
IntermediateApr-May
Dryer seasonJun-Sep
IntermediateOct-Nov
Stage 4 (C3F)
Cachoeira Jul-03Stage 4
Itaqui Aug-07Stage 4
Itaqui-Apr-07Othersites
Ithaura anaspis Curculionidae
Tylodina MS 13 Curculionidae
Eucatops sp. 1 Leiodidae
Apenes sp. 1 Carabidae
Anotylus sp. 1 Staphylinidae
Dibelonetes sp. 1 Staphylinidae
Thinocharis sp. 1 Staphylinidae
Jentozkus sp. 1 Eucinetidae
Molytina MS 2 Curculionidae
Tylodes sp. 1 Curculionidae
Paulipalpina sp. 1 Leiodidae
Anaedus sp. 3 Tenebrionidae
Anaedus sp. 4 Tenebrionidae
Echiaster sp. 1 Staphylinidae
Platydema sp. 1 Tenebrionidae
Ibicarella sp. 1 Endomychidae
Xenaster sp. 1 Staphylinidae
Conotrachelus sp. 1 Curculionidae
Dibelonetes sp. 4 Staphylinidae
Acarotopus sp. 1 Staphylinidae
Loxandrus sp. 3 Carabidae
Thinocharis sp. 2 Staphylinidae
Paratachys sp. 2 Carabidae
Pentagonica sp. 2 Carabidae
Leiodidae MS 2 Leiodidae
Cryptorhyn. MS 9 Curculionidae
Tylodina MS 12 Curculionidae
Anaedus sp.6 Tenebrionidae
Anotylus sp.5 Staphylinidae
Hydroph. MS 3 Hydrophilidae
Hydroph. MS 4 Hydrophilidae
Hydroph. MS 5 Hydrophilidae
Hydroph. MS 6 Hydrophilidae
Thinocharis sp.4 Staphylinidae
Tachyporinae MS 4 Staphylinidae
Thoracophorus sp.4 Staphylinidae
Euaestethinae MS 1 Staphylinidae
Xantholini MS 2 Staphylinidae
Apenes sp.2 Carabidae
Pterostichini MS 1 Carabidae
Anotylus sp.6 Staphylinidae
Cryptorhyn. MS 10 Curculionidae
Curculionidae MS 1 Curculionidae

260 Hopp et al.
Revista Brasileira de Entomologia 55(2): 253–266, junho, 2011
recovery pattern found in Cachoeira reserve strongly sup-port that assumption (Hopp et al. 2010).
But why did we find such great differences in speciesdensity and abundance between the sampling dates? We foundan explanation for the difference in species density by mea-suring litter volume, which has already shown to substantiallyaffect species density along the successional gradient (seeHopp et al. 2010). Regression analysis revealed that (1) spe-cies density was linearly correlated to the amount of leaf litterindependent of the sampling date (see Fig. 4) and (2) thatspecies density does not show a significant relation to sam-pling date anymore when partialling out the effect of littervolume first. Consequently, a strong interconnection betweenlitter quantity and beetle occurrences seems to mediate abun-dance and species density, not only along a successionalgradient, but also among seasonal variations of this physicalparameter.
Nevertheless, a higher amount of leaf litter in August canbe either a meaningful part of the temporal diversity patternswithin tropical forests or be a sampling artifact. Both sam-plings were conducted by the same person using the sameequipment and the same extraction protocol. As the seasonaldifferences in abundance are very high and are assumed tohighly exceed the level of sampling inexactness, we rate op-erator related differences in the beetle data as negligible.Moreover, many studies showed that litter fall in tropical for-ests features a clear seasonal pattern, with generally higherlitter fall in the dryer season compared to the wet season(Boinski & Fowler 1989; Martínez-Yrízar & Sarukhán 1990;Wieder & Wright 1995). Therefore, higher litter fall in themonths of the dryer season may provide more habitable sub-strate for litter inhabiting beetles and results in higherabundances and species densities without generally alteringthe beetle assemblage composition. This is indicated by lowabundances of many additional species and by the presenceof the most dominant species during both sampling dates.However, higher litter fall during and at the end of the wetseason compared to the dryer season were recently measuredin different stages of dune associated broad-leaf forests, whichare situated close to the study area (personal communicationK. Diekow [UFPR]). This indicates that further research hasto be undertaken for a deeper understanding of the interac-tion between fluctuations in litter fall, litter volume and litterinhabiting beetle diversity in Brazilian Atlantic forest eco-systems.
Comparison of “Winkler fauna” and “pitfall trapfauna”. Winkler extraction and pitfall traps are two com-monly used sampling methods to explore epigeal beetleassemblages. In temperate regions pitfall traps were fre-quently used to study large ground related beetles, such ascarabids (e.g., Niemelä et al. 1993; Heliölä et al. 2001). TheWinkler technique was often used to sample less mobile, smallbodied beetles, such as weevils (Besuchet et al. 1987). Thus,the Winkler extraction lacks a great portion of the beetle com-munity, as the usage of a beetle sieve with a distinct meshsize of ~1 cm excludes larger beetles per se.
Ten pitfall traps, which we installed in one Brazilian At-lantic old-growth forest, sampled with 365 individualsrepresenting 21 species surprisingly few beetles. Over 60%of these species sampled with pitfall traps were also sampledby Winkler extraction. Although surely more large beetleswould be found by expanding the sampling effort, it indi-cates that the local leaf litter beetle fauna is mainly constitutedof small (< 3 mm) to very small (< 1 mm) beetles. This iscongruent with findings of Hanagarth & Brändle (2001) andDidham et al. (1998), who studied soil and litter inhabitingbeetles in Amazonian forests.
Additionally, it shows that, whereas pitfall samples in thesame area obviously add additional species by samplingthroughout the year, most of these species would probablyhave already been obtained by the Winkler technique. Thisseems to be true for many beetle families in tropical forestlitter, including the beetle families analyzed in this study;but, did not apply to some beetle families, which feature largespecies, such as Cincindelidae, Scarabaeidae or Nitidulidaeas well as families which are known to strongly depend onhigh moisture levels, such as most Hydrophylidae. As a re-sult, pitfall trapping seems to be essential if aiming to obtaina preferably complete species inventory of these families.However, the pitfall trap data failed to display a reliable pic-ture of the beetle assemblages in leaf litter of the studiedold-growth forest. Many very abundant beetle species werenot sampled or only in very low abundances, suggesting enor-mous effort to get data sets, which are statistically analyzable.For this reason, being aware of the exclusion of large beetlespecies and those occurring in wet season, the Winkler methodseems to reveal a much better picture of the litter inhabitingbeetle community.
CONCLUSIONS
It is common knowledge that the choice of the samplingmethod strongly influences the resulting faunal assemblages(Kitching et al. 2001). Accordingly, the sampling method hasto be chosen carefully when aiming to explore ecologicalpatterns for distinct faunal assemblages, which should givebasic data for conservation strategies. This is not only truefor tropical forests and gains particular importance whenexamining ecological patterns for faunal groups seldom stud-ied today, such as micro-beetle assemblages in Braziliansubmontane Atlantic forest ecosystems.
This study provides the first results of comparing Winklerextraction and pitfall trap sampling for studying litter inhab-iting beetle assemblages in Atlantic forests. The resultsrevealed that Winkler extraction during the dryer season pro-vides a suitable approach to study general ecological patternsof litter inhabiting beetle assemblages. By that means, simi-lar results at two seasonally different points in time suggestthat data obtained at one point in time are reliable and notstrongly biased by seasonal dynamics of species presenceand abundance. The strong relationship of the beetle data tolitter volume confirms the important modulating character
261Evaluating leaf litter beetle data sampled by Winkler extraction from Atlantic forest sites
Revista Brasileira de Entomologia 55(2): 253–266, junho, 2011
of this variable for species density and abundance, whichseems to be stronger than species related seasonal dynamics,such as reproduction cycles.
However, pitfall traps provide important additional in-formation about the beetle assemblages, which includesseasonal activity patterns of single species and temporal fluc-tuations in the assemblage composition, which are particularimportant for studying large beetles, such as tiger beetles ordung beetles. Thus, a combination of both methods is stronglyrecommended when time and manpower allow a comprehen-sive beetle survey. Additionally, the inclusion of long-termdata makes a survey less prone to temporary phenomenawhich could influence the sampling output.
Nevertheless, our results indicate that the assumption, thatif the aim of the study is to analyze the community pattern oflitter inhabiting arthropods Winkler extraction could be moreefficient than pitfall traps (e.g. stated from Bancila & Plaia_u2009 for harvestmen), is also true for litter beetles in Atlan-tic forests of Southern Brazil.
ACKNOWLEDGEMENTS
We thank the SPVS for access to the study sites and theSPVS and several colleagues of the Solobioma project forfield work assistance. The study was embedded in the ProjectSolobioma, funded by the German Ministry of Education andResearch (01LB0201) and the Brazilian Conselho Nacionalde Desenvolvimento Científico e Tecnológico (160611).
REFERENCES
Adis, J. 1979. Problems of interpreting arthropod samplings with pitfalltraps. Zoologischer Anzeiger 202: 177–184.
Andresen, E. 2005. Effects of season and vegetation type on communityorganization of dung beetles in a tropical dry forest. Biotropica 37:291–300.
Bancila, R. I. & R. Plaiasu. 2009. Sampling efficiency of pitfall traps andWinkler extractor for inventory of the harvestmen (Arachnida: Opilio-nidae). Travaux de L’Institut de Speologie Emile Racovitza 48: 59–67.
Besuchet, C.; D. H. Burckhardt & I. Löbl. 1987. The „Winkler/Moczarski”eclector as an efficient extractor for fungus and litter coleoptera. TheColeopterists Bulletin 41: 392–394.
Boinski, S. & N. L. Fowler. 1989. Seasonal pattern in a tropical lowlandforest. Biotropica 21: 223–233.
Bonte, D.; L. Baert & J. P. Maelfait. 2002. Spider assemblage structure andstability in a heterogeneous coastal dune system (Belgium). Journalof Arachnology 30: 331–343.
Colwell R. K. 2006. EstimateS: statistical estimation of species richnessand shared species from samples. version 8. persistent available fromURL: http://purl.oclc.org/estimates (accessed 23 September 2010).
Dallal, G. E. & L. Wilkinson. 1986. An analytic approximation to thedistribution of Lilliefors’ test for normality. The American Statistician40: 294–296.
Didham, R. K.; P. M. Hammond,; J. H. Lawton,; P. Eggleton & N. E. Stork.1998. Beetle species responses to tropical forest fragmentation.Ecological Monographs 68: 295–323.
Eberhardt, L. L. & J. M. Thomas. 1991. Designing environ-mental fieldstudies. Ecological Monographs 61: 53–73.
Erwin, T. & J. C. Scott. 1980. Seasonal and size patterns, trophic structureand richness of Coleoptera in the arboreal tropical ecosystem: The fauna
of the tree Luehea semannii Triana and Planch in the canal zone ofPanama. The Coleopterists Bulletin 34: 305–322.
Finn, J. N. A.; T. Gittings & P. S. Giller. 2001. Spatial and temporal variationin species composition of dung beetle assemblages in Southern Ireland.Ecological Entomology 24: 24–36.
Fisher, B. L. & H. G. Robertson. 2002. Comparison and origin of forestand grassland ant assemblages in the High Plateau of Madagascar(Hymenoptera: Formicidae). Biotropica 34: 155–167.
French, B. W. & N. C. Elliott. 1999. Spatial and temporal distribution ofground beetle (Coleoptera: Carabidae) assemblages in riparian stripsand adjacent wheat fields. Environmental Entomology 28: 597–601.
Grimbacher, P. S. & N. E. Stork. 2008. Seasonality of a diverse beetleassemblage inhabiting lowland tropical rain forest in Australia.Biotropica 41: 323–337.
Gross, J. 2006. Database: The Comprehensive R Archive Network (CRAN).Available from: http://cran.r-project.org/web/packages/nortest/. htm(accessed 10 February 2010).
Hanagarth, W. & M. Brändle. 2001. Soil beetles (Coleoptera) of a primaryforest, secondary forest and two mixed polyculture systems in centralAmazonia. Andrias 15: 155–162.
Hanski, I. & Y. Cambeford. 1991. Dung beetle ecology. Princeton, PrincetonUniversity Press, 520 p.
Halsall, N. B. & S. D. Wratten. 1988. The efficiency of pitfall trapping forpolyphagous predatory Carabidae. Ecological Entomology 13: 293–299.
Heliölä, J.; M. Koivula & J. Niemelä. 2001. Distribution of carabid beetles(Coleoptera, Carabidae) across a boreal forest clearcut ecotone.Conservation Biology 15: 370–377.
Hopp, P. W.; Ottermanns, R.; Caron E.; S. Meyer & M. Roß-Nickoll. 2010.Recovery of litter inhabiting beetle assemblages during forest regenerationin the Atlantic forest of Southern Brazil. Insect Conservation andDiversity 3: 103–113.
Hurlbert, S. H. 1984. Pseudoreplication and the design of ecological fieldexperiments. Ecological Monographs 54: 187–211.
Ivanov, K. &. J. Keiper. 2009. Effectiveness and biases of Winkler litterextraction and pitfall trapping for collecting ground dwelling ants innorthern temperate forests. Environmental Entomology 38: 1724–1736.
Janzen, D. H. 1983. Seasonal change in abundance of large nocturnal dungbeetles (Scarabaeidae) in a Costa Rican decidious forest and adjacenthorse pasture. Oikos 41: 274–283.
Jay-Robert, P.; J. P. Lumaret & J. D. Lebreton. 2008. Dung beetle assemblagesand their relationships with environmental factors (Aphodiinae:Geotropinae: Scarabaeinae). Annals of the Entomological Society ofAmerica 101: 58–69.
Kato, M.; T. Itioka; S. Sakai; K. Momose; S. Yamane; A. A. Hamid & T.Inoue. 2000. Various population fluctuation patterns of light-attractedbeetles in a tropical lowland dipterocarp forest in Sarawak. PopulationEcology 42: 97–104.
Kim, K. C. 1993. Biodiversity, conservation and inventory: why insectsmatter. Biodiversity and Conservation 2: 191–214.
Kitching, R. L.; D. Li & N. E. Stork. 2001. Assessing biodiversity “samplingpackages”: How similar are arthropod assemblages in different tropi-cal rainforests? Biodiversity and Conservation 10: 793–813.
Krell, F.T.; A. Chung; E. deBoise; P. Eggleton; A. Giusti; K. Inward & S.Krell-Westerwalbesloh. 2005. Quantitative extraction of macro-invertebrates from temperate and tropical leaf-litter and soil: efficiencyand time-dependent taxonomic biases of the Winkler extraction.Pedobiologia 49: 175–186.
Lang, A. 2000. The pitfalls of pit falls. A comparison of pitfall trap catchesand absolute density estimates of epigeal invertebrate predators in arableland. Anzeiger für Schädlingskunde 73: 99–106.
Linzmeier, A. M. & C. S. Ribeiro-Costa. 2008. Seasonality and temporalstructuration of Alticini community (Coleoptera, Chrysomelidae,Galerucinae) in the Araucaria forest of Parana, Brazil. Revista Brasi-leira de Entomologia 52: 289–295.
Martelli, M. G.; M. M. Ward & M. A. Fraser. 2004. Ant diversity samplingon the Southern Cumberland Plateau: A comparison of litter siftingand pitfall trapping. Southeastern Naturalist 3: 113–126.
262 Hopp et al.
Revista Brasileira de Entomologia 55(2): 253–266, junho, 2011
Martínez-Yrízar, A. & J. Sarukhán. 1990. Litterfall patterns in tropicaldecidious in Mexico over a five year period. Journal of TropicalEcology 6: 438–444.
McCune, B. & M. J. Mefford. 1999. PC-ORD. Multivariate Analysis ofEcological Data. Version 5.0, Gleneden Beach, MjM Software Design,237 p.
Melbourne, B. A. 1999. Bias in the effect of habitat structure on pitfalltraps: an experimental evaluation. Australian Journal of Ecology 24:228–239.
Morrill, W. L.; D. G. Lester & A. E. Wrona. 1990. Factors affecting efficiencyof pitfall traps for beetles (Coleoptera: Carabidae and Tenebrionidae).Journal of Entomological Science 25: 284–293.
Niemelä, J.; D. Langor & J. R. Spence. 1993. Effects of clearcut harvestingon boreal ground beetle assemblages (Coleoptera, Carabidae) in WesternCanada. Conservation Biology 7: 551–561.
Olsen, D. M. 1991. A comparison of the efficacy of litter sifting and pitfalltraps for sampling leaf litter ants (Hymenoptera, Formicidae) in a tro-pical wet forest, Costa Rica. Biotropica 23: 166–172.
Parr, C. & S. L. Chown. 2001. Inventory and bioindicator sampling: testingpitfalls and Winkler methods with ants in a South African Savanna.Journal of Insect Conservation 5: 27–36.
Raworth, D. A. & M. Y. Choi. 2001. Determining numbers of active carabidbeetles per unit area from pitfall trap data. Entomologia Experimentaliset Applicata 98: 95–108.
R Development Core Team. 2009. R: A language and environment forstatistical computing. Vienna, Austria. R Foundation for StatisticalComputing. Available from http://www.r-project.org. htm (accessed 10February 2010).
Riecken, U. 1999. Effects of short-term sampling on ecologicalcharacterization and evaluation of epigeic spider communities and theirhabitats for site assessment studies. Journal of Arachnology 27: 189–195.
Smythe, N. 1982. The seasonal abundance of night-flying insects in aneotropical forest, p. 309–318. In: Leigh, E. G. Jr.; A. S. Rand & D. M.Windsor (eds). The ecology of a tropical forest. Washington, DC,Smithsonian Institution Press, 503 p.
Stork, N. E. 1994. Inventories of biodiversity: more than a question ofnumbers, p. 81–100. In: Forey, P. I.; C. J. Humphries & R. I. Vane-Wright (eds). Systematics and conservation evaluation. Oxford,Clarendon Press, 438 p.
Topping, C. J. & K. D. Sunderland. 1992. Limitations to the use of pitfalltraps in ecological studies exemplified by a study of spiders in a fieldof winter wheat. Journal of Applied Ecology 29: 485–491.
Weeks, R. D. & N. E. McIntyre. 1997. A comparison of live versus killpitfall trapping techniques using various killing agents. EntomologiaExperimentalis et Applicata 82: 267–273.
Wieder, R. K. & S. J. Wright. 1995. Tropical forest litter dynamics and dryseason irrigation on Barro Colorado Island, Panama. Ecology 76: 1971–1979.
Wolda H. 1978. Seasonal fluctuations in rainfall, food and abundance oftropical insects. Journal of Animal Ecology 47: 369–381.
Wolda H. 1988. Insect seasonality: Why? Annual Review of Ecology andSystematics 19: 1–18.
Work, T. T.; C. M. Buddle; L. M. Korinus & J. R. Spence. 2002. Pitfall trapsize and capture of three taxa of litter dwelling arthropods: Implicationsfor biodiversity studies. Environmental Entomology 31: 438–448.
Received 23/9/2010; accepted 3/5/2011Editor: Rodrigo Krüger

263Evaluating leaf litter beetle data sampled by Winkler extraction from Atlantic forest sites
Revista Brasileira de Entomologia 55(2): 253–266, junho, 2011
Appendix I. Beetles (Staphylinidae [excluding Aleocharinae, Pselaphinae and Scydmaeninae], Curculionidae [excluding Scolytinae], Carabidae [excludingOxydrepanus], Endomychidae, Hydrophilidae, Tenebrionidae, Leiodidae, Cerylonidae, Eucinetidae) sampled by litter sifting and Winkler extraction insubmontane secondary (Stage 1: ~ 8 yrs, Stage 2: 12–15 yrs, Stage 3: 35–50 yrs) and old–growth forests (> 100 yrs) of the Serra do Itaqui reserve, Paraná,Brazil. Beetles were sampled at two different sampling dates: April and August 2007. a–c indicates the replicates of each forest stage.
No. Species
Sampling date and successional stage
July-August 2007 April-May 2007
1a 1b 1c 2a 2b 2c 3a 3b 3c 4a 4b 4c 1a 1b 1c 2a 2b 2c 3a 3b 3c 4a 4b 4c
Staphylinidae
Paedarinae
1 Acarotopus sp. 1 – – – 1 – 4 5 10 6 8 5 5 – – – – – – 2 1 3 1 1 –
2 Astenus sp. 1 – 3 – – – – – – – – – – – – – – – – – – – – – –
3 Biocrypta sp. 2 – 1 2 – – – – – – – – – – – 8 – – – – – – – – –
4 Biocrypta sp. 5 – – – 1 – – – – 2 – – – – – – – – – – – – – – –
5 Dibelonetes sp. 1 – – – – – – 2 30 9 2 10 6 – – – – – – 2 7 9 – 4 –
6 Dibelonetes sp. 2 – – – – – – – – – – – – – – – – – – – – – – – 1
7 Dibelonetes sp. 3 – – – – – 2 – – – 3 1 1 – – – 1 – – – – 2 4 4 1
8 Dibelonetes sp. 4 – – – – – – 1 – – – – – – – – – – – – – – – – –
9 Echiaster sp. 1 – – – 4 – 6 35 131 37 13 36 26 – – – – – 3 7 21 7 2 18 9
10 Homaeotarsus sp. 1 – 1 4 – 1 5 – – – – – – – – 2 – – 1 – – – – – –
11 Homaeotarsus sp. 2 – – 2 – – – – – – – – – – – – – – – – – – – – –
12 Homaeotarsus sp. 4 – – 1 – – – – – – – – – – – – – – – – – – – – –
13 Ronetus sp. 1 – – 1 – – – – – – – – – – – – – – – – – – – – –
14 Ronetus sp. 3 – – 2 – – 1 – 9 – – 1 4 – – 1 1 1 – – – – – – –
15 Scopaeus sp. 2 – – – – – – – – – – – – 1 – – – – – – – – – – –
16 Stenopholea sp. 1 – – – – – – – 1 – – 1 – – – – 1 – – – – – – 1 –
17 Suniotrichus sp. 1 – 1 – – 1 – 2 7 – – – 4 – – – – – – 1 3 – – 1 –
18 Suniotrichus sp. 5 – – – – – – – – 1 – – 2 – – – – – – – – 1 – – –
19 Thinocharis sp. 1 – – 1 6 – – – 22 67 14 60 4 – – – 10 – – – 34 83 10 87 9
20 Thinocharis sp. 2 – – – – – – – – – – – 3 – – 1 – – – – – – – – –
21 Thinocharis sp. 3 – – 11 – 1 – – – – – – 1 – – 4 – – – – – – – – –
22 Xenaster sp. 1 1 – – – – – 3 – 2 – – 2 – – – – – – – – – – 1 1
23 Xenaster sp. 2 – – – – – – – – – – – – – – – – – – – 1 – – – –
24 Oedichirus sp. 1 3 – 3 – 2 1 1 1 – – 1 2 – – – 1 – – 3 – 1 2 – –
25 Oedichirus sp. 2 – – – – – – – 1 – – 2 – – – – – – – – – – – – 1
26 Oedichirus sp. 4 – – – 3 – – 1 6 4 1 3 11 – – – – – – 1 10 4 – 3 5
27 Palaminus sp. 4 – – – – – – – – – – – – 1 – – – – – – – – – 1 –
Scaphidiinae
28 Baeocera sp. 1 1 – 1 2 1 1 1 5 4 3 32 3 – – – – – – – 1 1 – 11 –
29 Scaphisoma sp. 1 – – – 1 – – – 21 – 3 25 9 – – – – – – – 17 1 1 20 –
30 Scaphisoma sp. 2 – – – – – – – – – – – – – – 1 – – – – – – – – –
Staphylininae
Xantholinini
31 Renda sp. 1 – – – – – – – – – – – – – – – – – – – – 1 – – –
32 Xantolini MS 1 – – – – – – – – – – – – – – – – – – – – – – – 1
Staphylinini
33 Philotalpus sp. 1 1 – – – 1 – – 1 – – – – – – – – – – – – – – – –
34 Staphylinini MS 1 – – – – – – – – – 1 – – – – – – – – – – – – – –
35 Xanthypigina MS 1 – – – – – – – – – 1 – – – – – – – – – – 4 – – –
Piestinae
36 Piestus schadei – – – – – – – – 8 16 – 1 – – – – – – – 1 – – 4 –
Oxytelinae
37 Anotylus sp. 1 – 1 – – – – 1 4 1 16 – 10 – – – – – – – – – – – –
38 Anotylus sp. 4 – – – – – – – – – – – 1 – – – – – – – – – – – –
Osoriinae
39 Holotrochus micans – – – – – – – 3 – – 1 – – – – – – – – – – – – –
40 Holotrochus schubarti – – – – – – – – – – – 1 – – – – – – – – – – – –
41 Holotrochus sp. 1 – – – – – – – – – – – – – – – – – – – – – – 1 –
42 Holotrochus vianai – – – – – – – – – – 1 – – – – – – – – – – – – –
43 Osoriellus sp. 2 – – – – – – – – – – – – – – – – – – – – – – 1 –
Continue

264 Hopp et al.
Revista Brasileira de Entomologia 55(2): 253–266, junho, 2011
Appendix I. Continued.
No. Species
Sampling date and successional stage
July-August 2007 April-May 2007
1a 1b 1c 2a 2b 2c 3a 3b 3c 4a 4b 4c 1a 1b 1c 2a 2b 2c 3a 3b 3c 4a 4b 4c
44 Osoriinae MS 1 – – – – – – – – – – – – – – – – – 1 – – – – – –
45 Osorius peruvianus – – – – – – – – – – – – – – – – – – – – – – 2 –
46 Osorius piceus – – – – – – – – – – – – – – – – – – – – – – 1 –
47 Osorius wasmanni – – – – – – – – – – 1 – – – – – – – – – – – 13 –
48 Ouloglene sp. 1 – – – – – – – – – 3 16 – – – – – – – – – – – – –
49 Thoracophorus sahlbergi – – – – – – – – – – – – – – – – – – – – – – – 1
Euaesthetinae
50 Edaphus bryanti – – – – – – – – – 1 – – – – – 1 – – – – – – – –
51 Edaphus depressus – – – – – – – – – – 7 – – – – 1 – – – – – – – –
52 Edaphus hoppi – – – – – – – – – – 1 – – – – – – – – – – – – –
Steninae
53 Stenus sp. 1 – – – – – – – 4 3 – 1 5 – – – – – – 2 1 1 – – –
54 Stenus sp. 2 – 1 – – – – – – – – – – – – – – – – – – – – – –
Tachyporinae
55 Bryoporus sp. 1 – – – – – – – – – – 1 – – – – – – – – – – – – –
56 Cileoporus sp. 1 – – – – – – – – 3 – – – – – – – – – – – – – – –
57 Coproporus sp. 1 – – – – – – – – – – – – – – – – – – – – – – 1 –
58 Sepedophilus sp. 1 – – – 1 – – – – – – – 1 – – – – – – – – – – – –
59 Tachyporinae MS 1 – – – – – – – – – – – – – – – – – – – – – – 1 –
60 Tachyporinae MS 2 – – – – – – – – – – – – – – – 1 – – – – – – – –
61 Tachyporinae MS 3 – – – – – – – 5 – – – – – – – – – – – – – – – –
Megalopsidiinae
62 Clivilispinus politus – – – – – – – – – – – – – – – – – – – 1 – – – –
Curculionidae
Molytinae
63 Molytina MS 1 – – – 1 – – 1 – – 1 – – – – – – – – 2 1 – – 1 –
64 Molytina MS 2 – – – 7 – – 3 17 7 1 24 12 – – – 2 – – 6 10 5 2 19 3
65 Conotrachelus sp. 1 – – – – – – – 1 – – – – – – – – – – – – – – – –
66 Conotrachelus sp. 8 – – – – – – – – – – – – – – – – – – – – – – – 1
67 Conotrachelus sp. 5 – – – 1 1 1 – – 1 1 – – – – – – – – – – – – – –
68 Conotrachelus sp. 7 – – 1 – – – – – – – – – – – – – 1 – – – – – – –
69 Ithaura anaspis – – – – – – – – – 4 5 – – – – – – – – – – – 1 –
Conoderinae
70 Conoderinae MS 1 – – 2 1 – – – – 1 – 3 1 – – – – – 1 – – – – – –
Cossoninae
71 Cossoninae MS 6 – – – 1 – – – – – – – – – – – 1 – – – – – – – 1
72 Cossoninae MS 9 – – – 1 – – – – – – – – – – – – – – – – – – 1 –
Cryptorhynchinae
73 Cryptorhynch. Ms 3 1 – – – – – – – – – – – – – – – – – – – – – – –
74 Cryptorhynch. Ms 7 – – – – – – 1 – – 1 – – – – – – – – – – – – – –
75 Cryptorhynch. Ms 8 – – – – – – – – – – – – 1 – – – – – – – – – – –
76 Cryptorhynch. Ms 9 1 – 2 – – – – – – – – – 2 – – – – – – – – – – –
77 Tylodes sp. 1 – – – – – – – 1 – – – – – – – – – – – – – – – –
78 Tylodina MS 18 – – – 1 – – – – – – – – – – – – – – – – – – – –
79 Tylodina MS 8 – – – – – – – 4 – 1 4 2 – – – – – – – 4 – – – –
80 Tylodina MS 11 – – – 3 – – 8 – – 1 2 7 – – – 1 – – 6 – – – – 5
81 Tylodina MS 16 – – – 11 – 2 – – 7 – – – – – – – – 1 – – 9 – – –
82 Tylodina MS 1 – – – 1 – – 3 6 14 6 14 9 – – – 1 – – 1 – 1 – 4 –
83 Tylodina MS 3 – – – – – – – 6 – 2 – – – – – – – – – 3 1 – – –
84 Tylodina MS 6 – – – – – – – 2 1 1 3 – – – – – – – – 4 1 – 1 –
85 Tylodina MS 7 – – – 1 1 1 4 21 4 9 40 44 – – – – – – 1 6 – 2 25 1
86 Tylodina MS 15 – – – 5 – – – 2 2 1 – 1 – – – – – – – 1 2 – – –
Erirhininae
87 Oryzophagus oryzae – – – – – – – – – – – – – – – – 1 – 1 – – – – –
Continue

265Evaluating leaf litter beetle data sampled by Winkler extraction from Atlantic forest sites
Revista Brasileira de Entomologia 55(2): 253–266, junho, 2011
Appendix I. Continued.
No. Species
Sampling date and successional stage
July-August 2007 April-May 2007
1a 1b 1c 2a 2b 2c 3a 3b 3c 4a 4b 4c 1a 1b 1c 2a 2b 2c 3a 3b 3c 4a 4b 4c
Baridinae
88 Baridinae MS 2 – – – – – – – 1 – – – – – – – – – – – – – – – –
89 Baridinae MS 4 – – – – – – – 1 – – – – – – – – – – – – – – – –
Entiminae
90 Naupactus sp. 1 – – 1 – – – – – – – – – – – – – – – – – – – – –
Anypotactini
91 Hypantus teretirostris – 2 – – – – – – – – – – – – – – – – – – – – – –
Rhythirrininae
92 Listronotus sp. 1 – 1 – – – – – – – – – – – – – – – – – – – – – –
Apioninae
93 Apion sp. 2 – 1 – – – – – – – – – – – – – – – – – – – – – –
Curculioninae
94 Anthonomus sp. 1 1 – – – – – – – – – – – – – – – – – – – – – – –
95 Sibinia sp. 1 – – – – – – – – – – – – 1 – – – – – – – – – – –
Eugnominae
96 Udeus sp. 2 – – – – – – – 1 – – – – – – – – – – – – – – – –
Carabidae
Carabinae
97 Pseudaptinus sp. 1 1 – 1 – – – – – – – – – – – – – – – – – – – – –
98 Pseudaptinus sp. 2 – – – – – – – – – – 2 – – – – – – – – – – – – –
99 Paratachys sp. 1 – – – 1 – – – 26 – 1 1 24 – – – 4 – – – 7 1 3 2 1
100 Paratachys sp. 2 – – – – – – – 1 – 1 – – – – – – – – – – – 2 – –
101 Paratachys sp. 3 – – – – – – – – – – – 1 – – – – – – – – – – – –
102 Paratachys sp. 9 – – – – – – – – – – – – – – – – – – – – – – 2 –
103 Paratachys sp. 10 – 11 1 – – – – – – – – – – – – – – – – – – – – –
104 Paratachys sp. 11 – – 1 – – – – – – – – – – – – – – – – – – – – –
105 Polyderidius sp. 1 – 4 3 – – – – – – – – – – – – – – – – – – – – –
106 Xystosomus inflatus 1 – – 1 – – – 15 11 6 18 16 – – – – – – – 4 2 1 4 6
107 Xystosomus tholus – – – 45 – 6 59 114 77 19 99 41 – – – 25 – 2 8 37 20 7 62 14
108 Pentagonica media – – – – – – – 1 – – – – – – – – – – – – – – – –
109 Pentagonica sp. 2 – – – – – – – – – – – 2 – – – – – – – – – – – –
110 Pentagonica sp. 4 – – – – – – – – – – – – – – – – – – – 1 – – – 1
Harpalinae
111 Lebia sp. 1 – – – – – – – – – 1 – – – – – – – – – – – – – –
112 Apenes sp. 1 – – – – – 1 1 – 1 – – – – – – – – – – – – – 1 –
113 Harpalini MS 1 – – – – – – – – – – – – – – 4 – – – – – – – – –
114 Selenophorus sp. 2 – – – – 1 – – – – – – – – – – – – – – – – – – –
115 Selenophorus sp. 3 – – – – – – – – – – – – – – – – 1 – – – – – – –
116 Selenophorus sp. 4 – – – – – – 1 – – – – – – – – – – – – – – – – –
117 Selenophorus sp. 6 – – – – – – – – – – 1 – – – – – – – – – – – – –
118 Selenophorus sp. 7 – 1 – – – – – – – – – – – – – – – – – – – – – –
119 Loxandrus sp. 2 – – – – – – – – 1 – – – – – – – – – – – – – – –
120 Loxandrus sp. 3 – – – – – – – – – – – 1 – – – – – – – – – – – –
121 Helluomorpha sp. 1 – – – – – – – – – – 1 – – – – – – – – – – – – –
Endomychidae
Eupsilobiinae
122 Ibicarella sp. 1 2 – – – – – – – – – 67 – – – – – – – – – – – 41 –
Cerylonidae
123 Cerylonidae Ms 2 – – – – – – – – – – – 1 – – – – – – – – – – – –
124 Philothermus sp. 1 – – – – – – – 8 2 – 6 8 – – – – – – 1 6 – – 9 1
125 Lapethus sp. 2 – – – – 1 – – – – – – – – – – – – – – – – – – –
Leiodidae
126 Leiodidae MS 2 – – – – – – – – – – – – – – – – – 3 – – 1 – – –
127 Leiodidae MS 5 – – – – – 1 – – – – – – – – – – – – – – – – – –
Continue

266 Hopp et al.
Revista Brasileira de Entomologia 55(2): 253–266, junho, 2011
Appendix I. Continued.
No. Species
Sampling date and successional stage
July-August 2007 April-May 2007
1a 1b 1c 2a 2b 2c 3a 3b 3c 4a 4b 4c 1a 1b 1c 2a 2b 2c 3a 3b 3c 4a 4b 4c
128 Aglyptinus sp. 2 – – – – – – – 1 – – – – – – – – – – – – – – – –
129 Eucatops sp. 1 – – – 11 – 13 5 24 16 6 10 8 – – – 5 – – 1 1 3 2 4 1
130 Paulipalpina sp. 1 – – – – – – – 24 – 1 – – – – – – – – – 9 – 2 1 –
Tenebrionidae
131 Tenebrionidae MS 1 – – – 2 – – – – – – – – – – – – – – – – – – – –
132 Tenebrionidae MS 2 – – – – – – – – – – – – – – – – – – – 1 – – – –
133 Tenebrionidae MS 3 – 1 – – – – – – – – – – – – – – – – – – – – – –
134 Tenebrionidae MS 4 – – – – – – – – – – 1 – – – – – – – – – – – – –
135 Tenebrionidae MS 5 – – – – – – – – – – – – – – – – – – – 1 – – – –
136 Tenebrionidae MS 7 – – – – – – – – – – – – – – – 1 – – – – – – – –
137 Tenebrionidae MS 8 – – – – – – – – – – – – – – – – – – 1 – – – – –
138 Tenebrionidae MS 9 – – – – – – – 1 – 1 – 1 – – – – – – – – – – – –
139 Tenebrionidae MS 10 – – – – – – – 1 – – – – – – – – – – – – – – – –
140 Tenebrionidae MS 11 – – 1 – – – – – – – – – – – – – – – – – – – – –
141 Tenebrionidae MS 13 – – – – – – – – – – – – – – – – – – 1 – – – – –
142 Anaedus sp. 1 – – – – – – – – – – – 2 – – – – – – – – – – – –
143 Anaedus sp. 3 – 3 1 1 4 1 3 1 1 1 1 – – – 1 1 – – – – – – – 1
144 Anaedus sp. 4 – – – – – 4 1 4 – 1 8 1 – – – 1 – 1 – – 2 1 2 1
145 Anaedus sp. 7 – – – – – – – – – – – 1 – – – – – – 1 – – – – 1
146 Anaedus sp. 9 – 1 – – – – – – – – – – – – – – – – – – – – – –
147 Anaedus sp. 10 – 1 – – – – – – – – – – – – – – – – – – – – – –
148 Anaedus sp. 12 – – – – – – – – – – – 1 – – – – – – – – – – – –
149 Platydema sp. 1 – – – 1 – – – – – – – 7 – – – – – – – – – 1 – 2
150 Tyrtaeus plaumanni – – – – – – – – 1 – – – – – – – – – – – – – – –
Phrenapatinae
151 Peneta sp. 2 – – – – – – – – – – – 1 – – – – – – – – – – – –
Hydrophilidae
152 Hydrophilidae MS 2 – – – – – 1 – – – – – 2 – – – – – – – 1 – 1 – –
153 Cyclotypus sp. 1 – – – – 1 – – – – 1 – – – – – – – – – – 3 2 – –
154 Phaenonotum sp. 1 – – – – – – – – – – – – 3 1 1 – – – – – – – – –
Eucinetidae
155 Jentozkus sp. 1 – – – – – – – – 1 – – 1 – – – – – – – – – – – –