Evaluating interannual water storage changes at...
12
Evaluating interannual water storage changes at watersheds in Illinois based on long-term soil moisture and groundwater level data Dingbao Wang 1 Received 5 April 2011 ; revised 4 January 2012 ; accepted 27 January 2012 ; published 1 March 2012. [1] The annual water storage changes at 12 watersheds in Illinois are estimated based on the long-term soil moisture and groundwater level observations during 1981–2003. Storage change is usually ignored in mean annual and interannual water balance calculations. However, the interannual variability of storage change can be an important component in annual water balance during dry or wet years. Annual precipitation anomaly is partitioned into annual runoff anomaly, annual evaporation anomaly, and annual storage change. The estimated annual storage change ratios vary from 60% to 40% at the study watersheds. The interannual variability of evaporation is not strongly correlated with the interannual variability of precipitation, but is correlated with the interannual variations of effective precipitation. As a response to the interannual variability of precipitation, the interannual variation of evaporation is smaller than those of runoff and storage change. The effect of annual water storage change increases the correlation coefficients between annual evaporation ratio and climate dryness index. Therefore, interannual water storage changes need to be included in the estimation of evaporation and total water supply in the Budyko framework. Effective precipitation can be used as a substitute for precipitation when computing evaporation ratio and climate dryness index. Citation: Wang, D. (2012), Evaluating interannual water storage changes at watersheds in Illinois based on long-term soil moisture and groundwater level data, Water Resour. Res., 48, W03502, doi:10.1029/2011WR010759. 1. Introduction [2] Long-term mean annual water balance at the water- shed scale has been a fundamental research question in hydrological science : P ¼ E þ Q þ S; (1) where P, E, and Q are mean annual precipitation, evapora- tion, and runoff, respectively ; DS is the mean annual change of water storage. Budyko [1958] postulated that the partitioning of P, to first order, was determined by the com- petition between available water (P) and available energy measured by potential evaporation (E p ). On the basis of data sets from a large number of watersheds and the work of Schreiber [1904] and Ol’dekop [1911], Budyko [1974] developed a relationship between evaporation ratio (E/P) and climate dryness index (E p /P). In the literature, other functional forms of Budyko-type curves have been devel- oped for the long-term water balance [e.g., Pike, 1964; Fu, 1981; Choudhury, 1999; Zhang et al., 2001; Porporato et al., 2004 ; Yang et al., 2008 ; Gerrits et al., 2009]. [3] Besides the climate dryness index, the effects of other variables on the mean annual water balance have been stud- ied to explain the observed deviation from the Budyko curve, e.g., the competing effects of climate fluctuations and watershed storage capacity [Milly, 1994a, 1994b], rain- fall seasonality and soil moisture capacity [Sankarasubra- manian and Vogel, 2002; Potter et al., 2005; Hickel and Zhang, 2006; Zhang et al., 2008], the relative infiltration capacity, relative soil water storage, and the watershed av- erage slope [Yang et al., 2007], climate seasonality, soil properties and topography [Yokoo et al., 2008], vegetation type [Zhang et al., 2001 ; Oudin et al., 2008], vegetation dy- namics [Donohue et al., 2007, 2010], and human activities [Wang and Hejazi, 2011]. [4] Recently, water balance estimates at finer temporal scales have been studied, especially the interannual vari- ability of precipitation partitioning. The Budyko-type func- tions have been extended to study the relationship between the annual evaporation ratio and annual climate dryness index [Yang et al., 2007, 2009; Zhang et al., 2008]. Potter and Zhang [2009] tested the relationship with six functional forms of Budyko-type curves and one linear model, and found that rainfall seasonality was important in determin- ing the functional forms. Jothityangkoon and Sivapalan [2009] examined the effects of intra-annual variability of rainfall (e.g., storminess and seasonality) on the interan- nual variability of the annual water balance through the simulation of annual runoff in three semiarid watersheds in Australia and New Zealand. 1 Department of Civil, Environmental, and Construction Engineering, University of Central Florida, Orlando, Florida, USA. Copyright 2012 by the American Geophysical Union 0043-1397/12/2011WR010759 W03502 1 of 12 WATER RESOURCES RESEARCH, VOL. 48, W03502, doi:10.1029/2011WR010759, 2012
Transcript of Evaluating interannual water storage changes at...

Evaluating interannual water storage changes at watersheds inIllinois based on long-term soil moisture and groundwaterlevel data
Dingbao Wang1
Received 5 April 2011; revised 4 January 2012; accepted 27 January 2012; published 1 March 2012.
[1] The annual water storage changes at 12 watersheds in Illinois are estimated based onthe long-term soil moisture and groundwater level observations during 1981–2003. Storagechange is usually ignored in mean annual and interannual water balance calculations.However, the interannual variability of storage change can be an important component inannual water balance during dry or wet years. Annual precipitation anomaly is partitionedinto annual runoff anomaly, annual evaporation anomaly, and annual storage change. Theestimated annual storage change ratios vary from �60% to 40% at the study watersheds.The interannual variability of evaporation is not strongly correlated with the interannualvariability of precipitation, but is correlated with the interannual variations of effectiveprecipitation. As a response to the interannual variability of precipitation, the interannualvariation of evaporation is smaller than those of runoff and storage change. The effect ofannual water storage change increases the correlation coefficients between annualevaporation ratio and climate dryness index. Therefore, interannual water storage changesneed to be included in the estimation of evaporation and total water supply in the Budykoframework. Effective precipitation can be used as a substitute for precipitation whencomputing evaporation ratio and climate dryness index.
Citation: Wang, D. (2012), Evaluating interannual water storage changes at watersheds in Illinois based on long-term soil moisture
and groundwater level data, Water Resour. Res., 48, W03502, doi:10.1029/2011WR010759.
1. Introduction[2] Long-term mean annual water balance at the water-
shed scale has been a fundamental research question inhydrological science:
P ¼ E þ Qþ�S; (1)
where P, E, and Q are mean annual precipitation, evapora-tion, and runoff, respectively; DS is the mean annualchange of water storage. Budyko [1958] postulated that thepartitioning of P, to first order, was determined by the com-petition between available water (P) and available energymeasured by potential evaporation (Ep). On the basis ofdata sets from a large number of watersheds and the workof Schreiber [1904] and Ol’dekop [1911], Budyko [1974]developed a relationship between evaporation ratio (E/P)and climate dryness index (Ep/P). In the literature, otherfunctional forms of Budyko-type curves have been devel-oped for the long-term water balance [e.g., Pike, 1964; Fu,1981; Choudhury, 1999; Zhang et al., 2001; Porporatoet al., 2004; Yang et al., 2008; Gerrits et al., 2009].
[3] Besides the climate dryness index, the effects of othervariables on the mean annual water balance have been stud-ied to explain the observed deviation from the Budykocurve, e.g., the competing effects of climate fluctuationsand watershed storage capacity [Milly, 1994a, 1994b], rain-fall seasonality and soil moisture capacity [Sankarasubra-manian and Vogel, 2002; Potter et al., 2005; Hickel andZhang, 2006; Zhang et al., 2008], the relative infiltrationcapacity, relative soil water storage, and the watershed av-erage slope [Yang et al., 2007], climate seasonality, soilproperties and topography [Yokoo et al., 2008], vegetationtype [Zhang et al., 2001; Oudin et al., 2008], vegetation dy-namics [Donohue et al., 2007, 2010], and human activities[Wang and Hejazi, 2011].
[4] Recently, water balance estimates at finer temporalscales have been studied, especially the interannual vari-ability of precipitation partitioning. The Budyko-type func-tions have been extended to study the relationship betweenthe annual evaporation ratio and annual climate drynessindex [Yang et al., 2007, 2009; Zhang et al., 2008]. Potterand Zhang [2009] tested the relationship with six functionalforms of Budyko-type curves and one linear model, andfound that rainfall seasonality was important in determin-ing the functional forms. Jothityangkoon and Sivapalan[2009] examined the effects of intra-annual variabilityof rainfall (e.g., storminess and seasonality) on the interan-nual variability of the annual water balance through thesimulation of annual runoff in three semiarid watersheds inAustralia and New Zealand.
1Department of Civil, Environmental, and Construction Engineering,University of Central Florida, Orlando, Florida, USA.
Copyright 2012 by the American Geophysical Union0043-1397/12/2011WR010759
W03502 1 of 12
WATER RESOURCES RESEARCH, VOL. 48, W03502, doi:10.1029/2011WR010759, 2012

[5] Similar to equation (1), the water balance at the an-nual scale is
Pi ¼ Ei þ Qi þ�Si; (2)
where Pi, Ei, and Qi are annual precipitation, evaporation,and runoff at year i, respectively; DSi is the annual waterstorage change at the watershed scale. The effects of waterstorage change on annual water balance have been consid-ered in several studies. Pike’s [1964] functional form wasbased on the interannual variability of water balance forfour watersheds in Malawi. The annual changes in ground-water storage were accounted for by constructing depletioncurves under which the area was integrated to obtain a rela-tionship between flow and storage left in the watershed atthe end of the dry season. The annual storage change isnegligible compared with precipitation and runoff in thefour watersheds (Table 1 in the work of Pike [1964]).Zhang et al. [2008] found that Fu’s equation, one func-tional form of Budyko-type curves, performed poorly onestimating annual streamflow in some watersheds in Aus-tralia, and they explained that it might be because of theimpact of watershed water storage, which could not beneglected at the annual scale. Donohue et al. [2010] studiedthe annual water balance at 221 watersheds in Australiaand found that the effect of nonsteady state conditions wasan important source of variation at the annual scale andneeded to be accounted for. During multiyear droughts, theannual storage change in the Murray Darling Basin can beup to twice the annual streamflow [Leblanc et al., 2009].Flerchinger and Cooley [2000] studied the water balanceof the Upper Sheep Creek watershed, a 26-ha semiaridmountainous sub-basin within the Reynolds Creek experi-mental watershed in southwest Idaho, United States. Dur-ing 1985–1994, the minimum and maximum ratios ofannual storage change (including soil moisture and ground-water) to annual precipitation were �0.45 and 0.2, respec-tively, with the average absolute value of the ratios overthe 10 yr being 0.16. The average ratio of annual runoff toannual precipitation (i.e., runoff coefficient) was found tobe 0.05. Thus, the annual storage carryover is significant inthis watershed. Milly and Dunne [2002] accounted for theinterannual storage change in the analysis of discharge var-iations for 175 large basins worldwide with a median area
of 51,000 km2, and found that the annual storage changeeffect was important in some basins. Wang et al. [2009]found that the base flow-dominated basins in NebraskaSand Hills exhibited a negative relationship betweenðPi � QiÞ=Pi and Epi=Pi when ignoring DSi, and that theinterannual water storage change was not negligiblebecause of the slow response of the base flow to the inter-annual change in precipitation.
[6] Therefore, the carryover of water storage, throughinteractions with seasonally varying climate inputs, willhave an impact on the amount of runoff produced withinthe year, and hence mean annual water balance and theinter- and intra-annual variability of runoff yield and waterbalance [Zhang et al., 2008; Jothityangkoon and Sivapa-lan, 2009; Cheng et al., 2011]. The Budyko frameworkassumes the steady state of water balance at long-termaverages, i.e., �S ¼ 0 in equation (1) [Donohue et al.,2007]; but at the annual scale, the effect of water storagechange on the water balance generally needs to be takeninto account [Zhang et al., 2008; Donohue et al., 2010].However, because of the limitation of data availability onEi and DSi, the annual evaporation is usually computed onthe basis of Ei ¼ Pi � Qi by assuming the steady state con-dition, i.e., �Si ¼ 0 [e.g., Potter and Zhang, 2009; Yanget al., 2009]. It is necessary to examine the extent of whichstorage carryover affects the annual water balance usingstorage measurement data directly. To address this issue,this paper studies the interannual water storage changebased on long-term soil moisture and groundwater levelmeasurements in Illinois, and quantifies the impacts of stor-age change on the water balance at the mean annual andinterannual scales. In section 2, the study watersheds andthe corresponding data sets are introduced, and then themethods for estimating the storage change at the annualscale are described. The results and discussions are pre-sented in sections 3 and 4, respectively. Conclusions aresummarized in the section 5.
2. Data and Methods2.1. Data Sets
[7] Both soil moisture and groundwater level observa-tion data were obtained from the Illinois State Water
Table 1. Twelve USGS Gauges and Corresponding Dataa
IndexUSGS
Gauge IDDrainage
Area (km2) P (mm) Ep (mm) Q (mm) Ep/P E/P Qs/Q
Observations
Soil Moisture Ground Water
1 3345500 3926 1025 937 320 0.91 0.69 0.59 2 12 3381500 8034 1091 1008 373 0.92 0.66 0.50 2 13 5435500 3434 887 962 294 1.08 0.67 0.80 1 04 5440000 2846 900 916 295 1.02 0.67 0.70 1 05 5447500 2598 914 980 270 1.07 0.70 0.73 0 16 5552500 6843 899 904 300 1.01 0.67 0.77 0 27 5570000 4237 928 1009 281 1.09 0.70 0.63 1 08 5584500 1696 966 995 268 1.03 0.72 0.49 0 19 5585000 3349 965 992 267 1.03 0.72 0.51 0 010 5592500 5025 1003 968 311 0.97 0.69 0.68 0 111 5593000 7042 1007 991 290 0.98 0.71 0.73 1 112 5594000 1904 1015 1018 289 1.00 0.72 0.46 0 0
aMean annual precipitation (P), potential evaporation (Ep), streamflow (Q), climate dryness index (Ep/P), mean annual evaporation ratio (E/P) whereE ¼ P � Q, the ratio of base flow to the total streamflow (Qs/Q), and the number of soil moisture and groundwater stations located in each watershed.
W03502 WANG: INTERANNUAL WATER STORAGE CHANGES W03502
2 of 12

Survey (ISWS). ISWS collected measurements of the soilmoisture content at 19 locations throughout the state of Illi-nois as shown in Figure 1, beginning at most sites in 1981and ending at some stations in 2004 [Scott et al., 2010].The soil moisture content is measured for the top 10 cmand then for 20 cm layers down to a depth of 2 m (i.e., atotal of 11 layers) with the neutron probe technique, cali-brated with gravimetric observations [Hollinger and Isard,1994]. The soil moisture is routinely observed on a bi-weekly basis during the growing season (March–October)and monthly thereafter. The vegetation at all stations isrural grass, except for one station with bare soil measure-ments. Figure 1B shows the land use and land cover map.The main land use is agricultural land, which includes ruralgrassland where the soil moisture is measured. This dataset has been documented by Hollinger and Isard [1994] indetail, and is part of the Global Soil Moisture Data Bank[Robock et al., 2000].
[8] Since the 1960s, the Groundwater Division of ISWShas been collecting groundwater level data for shallowunconfined groundwater at 17 wells throughout the state ofIllinois (Figure 1). All of the wells are far from streams orpumping wells [Changnon et al., 1988]. The groundwaterlevel is measured on monthly intervals.
[9] The data availability of long-term observations ofsoil moisture and groundwater level in Illinois provides aunique opportunity to study the annual storage carryover atthe watershed scale. The soil moisture data set has beenused to study the water balance in the Illinois River basin[Niemann and Eltahir, 2004], to understand the characteris-tics of deep-layer hydrologic memory on surface energyfluxes [Amenu et al., 2005], and to simulate the water
balance in the Illinois River basin [Yeh and Eltahir, 2005].The combined soil moisture content and groundwater leveldata have been used to estimate the monthly evaporation[Yeh et al., 1998] and to validate the total water storagevariation estimates from the Gravity Recovery and ClimateExperiment (GRACE) satellite data [Swenson et al., 2006],both of which were done at the spatial scale of the entirestate of Illinois. Recently, Yeh and Famiglietti [2009]applied the combined data sets to soil water balance com-putation for estimating the regional recharge to and evapo-ration from groundwater.
[10] The watersheds included in the international ModelParameter Estimation Experiment (MOPEX) data set,which includes the daily precipitation and streamflow datafrom 1948 to 2003 [Duan et al., 2006], are selected for theanalysis considering the locations of soil moisture andgroundwater level observation sites. The MOPEX data sethas been used to study the functional model of water bal-ance variability [Sivapalan et al., 2011] and the sensitivityof fast and slow runoff components to precipitation change[Harman et al., 2011]. Monthly potential evaporation,which is computed by the Priestley-Taylor method, isaggregated into annual values at the watershed scale[Priestley and Taylor, 1972; Zhang et al., 2010]. TwelveMOPEX watersheds, which cover or are close to soil mois-ture and groundwater measurement stations, were selectedfor the analysis in this study (panel A in Figure 1). Thenumber of soil moisture and groundwater stations locatedin each watershed is shown in Table 1, which also showsthe drainage area, mean annual precipitation, potentialevaporation, streamflow, climate dryness index, mean an-nual evaporation ratio (E/P), the ratio of base flow to the
Figure 1. (a) Spatial distribution of USGS streamflow gauges of MOPEX data set, soil moisture mea-surement sites, and groundwater level observation wells (b) the land use and land cover.
W03502 WANG: INTERANNUAL WATER STORAGE CHANGES W03502
3 of 12
total streamflow, and the number of soil moisture andgroundwater stations located in each watershed. The drain-age area of the selected watersheds ranges from 1700 km2
to 8000 km2. In the 12 watersheds, the mean annual precip-itation varies from 887 mm to 1091 mm; the climate dry-ness index is in a small range from 0.91 to 1.08; and themean annual evaporation ratio ranges from 0.66 to 0.72.
2.2. Estimation of Annual Storage Change
[11] The total water storage change for a watershed atyear i includes three storage components:
�Si ¼ �Ssm;i þ�Sgw;i þ�Ssw;i; (3)
where �Ssm;i is soil moisture change; �Sgw;i is unconfinedgroundwater storage change; �Ssw;i is the surface waterstorage change such as snow pack and lakes. The confinedaquifer storage change is assumed to be negligible or theinteraction between the deep confined aquifer and the sur-face water is negligible. The water balance is accounted forbased on water year, and the water storage change is com-puted based on the difference of storage in September fromconsecutive years. Since there is no snow storage in Sep-tember in the state of Illinois and since surface water stor-age is small compared with the soil moisture andgroundwater storage, �Ssw;i is assumed to be negligible[Yeh et al., 1998]. There is no significant reservoir or lakewithin the watersheds except the one draining to gauge sta-tion 5593000 (Figure 1B). Rodell and Famiglietti [2001]demonstrated that surface water storage variability in Illi-nois was, in nonflood years, at least an order of magnitudesmaller than soil moisture and groundwater variability.
[12] The spatial distribution of soil moisture, ground-water level, and streamflow observations are shown in panelA of Figure 1. Based on the data availability, the annual
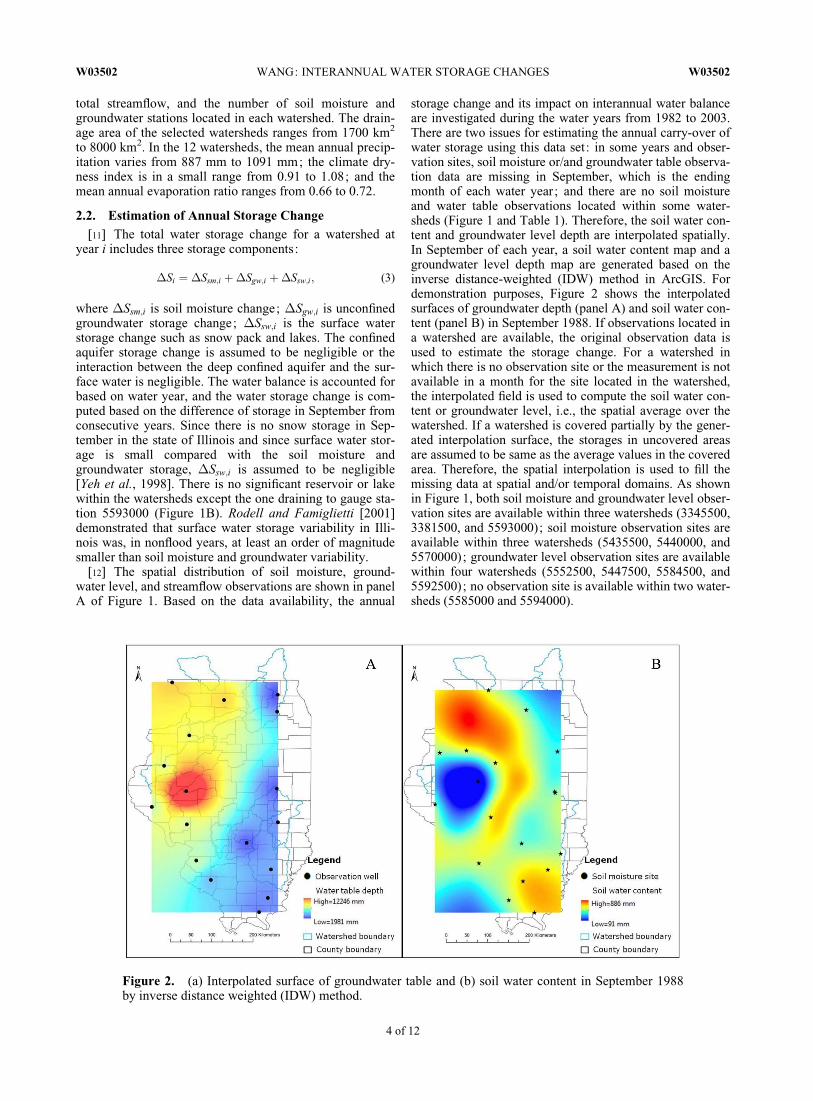
storage change and its impact on interannual water balanceare investigated during the water years from 1982 to 2003.There are two issues for estimating the annual carry-over ofwater storage using this data set: in some years and obser-vation sites, soil moisture or/and groundwater table observa-tion data are missing in September, which is the endingmonth of each water year; and there are no soil moistureand water table observations located within some water-sheds (Figure 1 and Table 1). Therefore, the soil water con-tent and groundwater level depth are interpolated spatially.In September of each year, a soil water content map and agroundwater level depth map are generated based on theinverse distance-weighted (IDW) method in ArcGIS. Fordemonstration purposes, Figure 2 shows the interpolatedsurfaces of groundwater depth (panel A) and soil water con-tent (panel B) in September 1988. If observations located ina watershed are available, the original observation data isused to estimate the storage change. For a watershed inwhich there is no observation site or the measurement is notavailable in a month for the site located in the watershed,the interpolated field is used to compute the soil water con-tent or groundwater level, i.e., the spatial average over thewatershed. If a watershed is covered partially by the gener-ated interpolation surface, the storages in uncovered areasare assumed to be same as the average values in the coveredarea. Therefore, the spatial interpolation is used to fill themissing data at spatial and/or temporal domains. As shownin Figure 1, both soil moisture and groundwater level obser-vation sites are available within three watersheds (3345500,3381500, and 5593000); soil moisture observation sites areavailable within three watersheds (5435500, 5440000, and5570000); groundwater level observation sites are availablewithin four watersheds (5552500, 5447500, 5584500, and5592500); no observation site is available within two water-sheds (5585000 and 5594000).
Figure 2. (a) Interpolated surface of groundwater table and (b) soil water content in September 1988by inverse distance weighted (IDW) method.
W03502 WANG: INTERANNUAL WATER STORAGE CHANGES W03502
4 of 12
[13] The soil moisture storage change is computed by thedifference of total soil water content at the top 2 m soilbetween two consecutive years. Changes in groundwaterdepth are converted to changes in groundwater storage bymultiplying the specific yield which is in the range of 0.08–0.1 [Yeh et al., 1998]. To be conservative on the effect ofstorage change, a value of 0.08 is used in this paper so thatthe lower value of specific yield will result in less ground-water storage change estimation, which is the product of awater level change and specific yield. The water level inshallower wells can be <2 m in depth, which implies thatthe soil moisture data may at times include water in boththe root zone and the saturated zone. Following Swensonet al. [2006], to avoid the repetitive accounting of ground-water storage, if the water table depth is <2 m deep, thewater table depth is set to 2 m in the computation ofgroundwater storage change.
[14] The long-term average storage change can be com-puted from the annual storage changes:
�S ¼ 1
N
XN
i¼1
�Si; (4)
where N is the total number years for the long-term aver-age. Generally, �Si is positive in wet years and negative indry years, and �S is negligible with a large enough valueof N.
2.3. Anomalies of Precipitation, Runoff, andEvaporation
[15] The interannual variability of storage changeresponding to the variability of interannual precipitation isinvestigated. Subtracting equation (1) from equation (2),with negligible long-term mean annual storage change (DS)one obtains:
~Pi ��Si ¼ ~Qi þ ~Ei; (5)
where ~Pi is the annual anomalous precipitation at the yeari and is defined as
~Pi ¼ Pi � P: (6)
Similarly, ~Qi and ~Ei are the annual anomalous runoffand evaporation, respectively. The partitioning of mean an-nual precipitation can be characterized by the Budyko-type curves. The effective precipitation anomaly, which isthe difference from anomalous precipitation and storagechange (~Pi ��Si), will be partitioned into runoff and evap-oration anomalies at the annual scale. If the annual storagechange is negligible, evaporation and runoff anomalies sumto the precipitation anomaly [Milly and Dunne, 2002]. Theratio of runoff anomaly to precipitation anomaly, ~Q=i
~Pi, isusually called sensitivity of runoff to rainfall [Schaake,1990; Dooge, 1992; Milly and Dunne, 2002; Harmanet al., 2011].
3. Results[16] The storage changes at two temporal scales are pre-
sented: mean annual and interannual storage carryover.
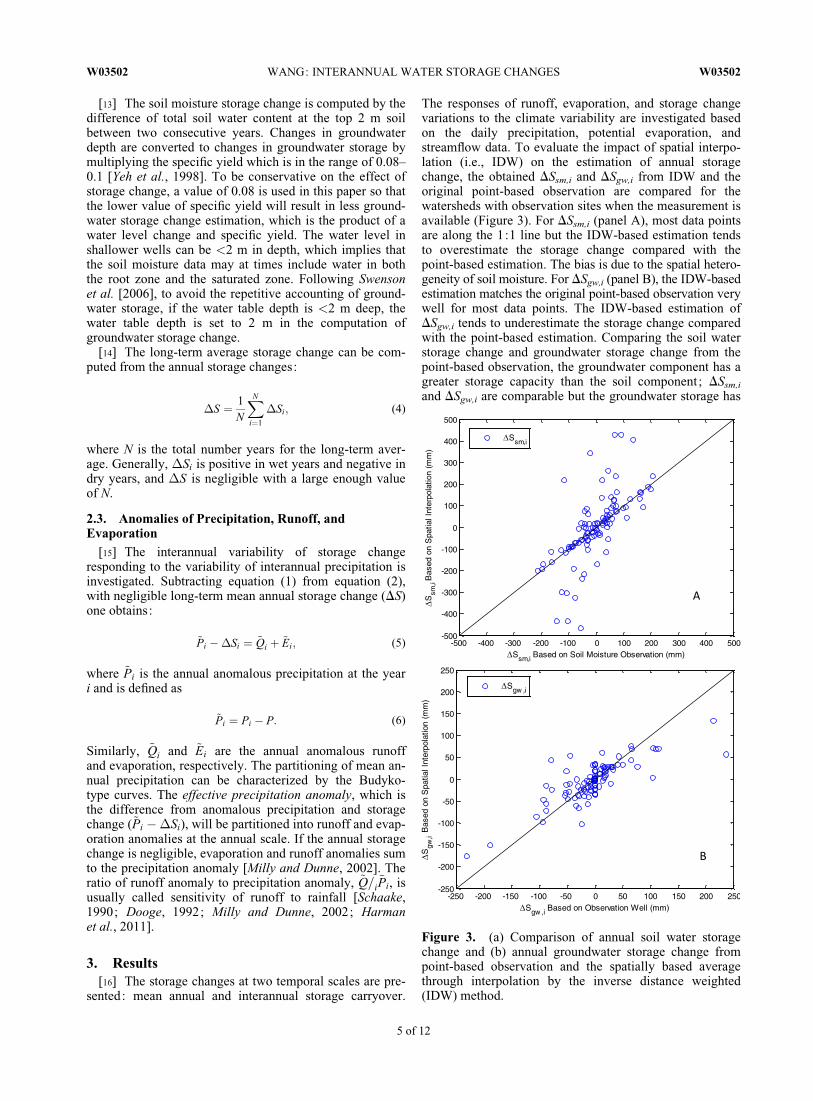
The responses of runoff, evaporation, and storage changevariations to the climate variability are investigated basedon the daily precipitation, potential evaporation, andstreamflow data. To evaluate the impact of spatial interpo-lation (i.e., IDW) on the estimation of annual storagechange, the obtained DSsm,i and DSgw,i from IDW and theoriginal point-based observation are compared for thewatersheds with observation sites when the measurement isavailable (Figure 3). For DSsm,i (panel A), most data pointsare along the 1:1 line but the IDW-based estimation tendsto overestimate the storage change compared with thepoint-based estimation. The bias is due to the spatial hetero-geneity of soil moisture. For DSgw,i (panel B), the IDW-basedestimation matches the original point-based observation verywell for most data points. The IDW-based estimation ofDSgw,i tends to underestimate the storage change comparedwith the point-based estimation. Comparing the soil waterstorage change and groundwater storage change from thepoint-based observation, the groundwater component has agreater storage capacity than the soil component; DSsm,i
and DSgw,i are comparable but the groundwater storage has
Figure 3. (a) Comparison of annual soil water storagechange and (b) annual groundwater storage change frompoint-based observation and the spatially based averagethrough interpolation by the inverse distance weighted(IDW) method.
W03502 WANG: INTERANNUAL WATER STORAGE CHANGES W03502
5 of 12

higher lower and upper bounds (i.e., �250 mm for DSgw,i
and 200 mm for DSsm,i). As shown in Table 1, the ratio ofbase flow to the total streamflow (Qs/Q) during the 22-yrperiod is higher than 0.50, except for two watersheds withvalues of 0.49 and 0.46, and the highest Qs/Q value is 0.80in watershed 5435500.
3.1. Mean Annual Storage Change DS
[17] Figure 4 shows the ratio of average annual storagechange to mean annual precipitation, DS/P, for each water-shed. Among the 12 watersheds, the minimum value ofDS/P is �2.6%, the maximum value is 1.4%, and the aver-age value of j�S=Pj is 0.9%. In this study, the value of N is22, and the storage change is considerably small comparedwith the mean annual rainfall ; thus, if N is large enough(e.g., N > 30 yr), DS is indeed negligible.
3.2. Annual Storage Change
3.2.1. Annual Soil Moisture Storage Change VersusAnnual Groundwater Storage Change
[18] The storage change includes two components in thestudy watersheds: soil water storage change and ground-water storage change. Lo et al. [2010] studied the estimatedGRACE total water storage anomalies against the observedwater table depth averaged over Illinois for the period of2003–2005 and found the correlation coefficient betweentotal water storage anomalies and water table depth to be0.87. Thus, the total storage change and the groundwaterlevel fluctuation is highly positively correlated. Figure 5plots the annual soil moisture storage change versus the an-nual groundwater storage change from all 12 watersheds(the data points are excluded when the water table depth islower than 2 m). The correlation coefficient between DSsm,i
and DSgw,i is 0.4. The lower bound of the storage change ofsoil moisture is around �200 mm except five points, whichare due to interpolation errors as shown in Figure 3.Groundwater storage changes are in the range between�300 mm and 300 mm.
3.2.2. Annual Total Water Storage Change[19] The estimated annual total water storage changes
are presented in section 3.2.2. The histogram of the annualstorage change ratio, which is defined as the ratio of annualstorage change (DSi) to annual precipitation Pi, from all 12watersheds in all of the years is shown in Figure 6. Themode of the distribution is approximately of zero value of
annual storage change ratio. The distribution has a longerand thicker tail of negative valued DSi/Pi. Excluding thepoints in the outliers from spatial interpolation, the mini-mum and maximum annual storage change ratios are�60% and 40%, respectively. Figure 7 shows the exceed-ance probability distribution of the absolute values of an-nual storage change ratios for all of the watersheds in allyears. Values of j�Si=Pij are larger than 10% during 40%of the years and larger than 5% during 70% of the years.Therefore, neglecting interannual storage carryover duringwet or dry years can be problematic in the watersheds ofstudy.
Figure 4. Ratio of mean annual storage change to meanannual precipitation (DS/P). The catchment indexes corre-spond to the indexing in Table 1.
Figure 5. Annual soil moisture storage change (DSsm,i)versus annual groundwater storage change (DSgw,i).
Figure 6. Histogram of annual storage change ratioDSi/Pi.
W03502 WANG: INTERANNUAL WATER STORAGE CHANGES W03502
6 of 12

3.2.3. Response of Annual Storage Change to AnnualPrecipitation Variability
[20] In order to compare the annual anomalies betweenwatersheds, the annual precipitation anomaly ratio isdefined as j~Pi=Pj; where P is the mean annual precipitationfor the corresponding watershed. The annual storagechange ratio (DSi/P) versus the annual precipitation anom-aly ratio from all of the watersheds is shown in panel A inFigure 8. The correlation coefficient between DSi/P and~Pi=P is 0.42. According to the Budyko curve, the sensitiv-ity of runoff to rainfall change is closer to 1 under energy-limited conditions, but closer to 0 under water-limited con-ditions [Koster and Suarez, 1999]. The study watershedsare located in the equivalent climate region where Ep/P is�1.0. The correlation coefficient between ~Qi=P versus~Pi=P is high, up to 0.73 as shown in panel B; but the an-nual evaporation anomaly ratio ~Ei=P and ~Pi=P are poorlycorrelated, with a coefficient of 0.02 (panel C). The annualevaporation anomaly ratio ~Ei=P versus the annual effectiveprecipitation anomaly ratio, ð~Pi ��SiÞ=P, has a correla-tion coefficient of 0.71 as shown in panel B. Therefore, theinterannual variability of evaporation is not strongly corre-lated with the interannual variability of precipitation, but iscorrelated with the interannual variations of effective pre-cipitation. This suggests that the interannual variability ofevaporation in the study watersheds is mainly dependent onprecipitation anomaly and the annual storage carryover.
Figure 8. (a) Annual storage change ratio, (b) annual runoff anomaly ratio, (c) annual evaporationanomaly ratio versus annual effective precipitation anomaly ratio, and (d) annual evaporation anomalyratio versus annual effective rainfall anomaly ratio.
Figure 7. Exceedance probability of absolute values ofannual storage change ratios.
W03502 WANG: INTERANNUAL WATER STORAGE CHANGES W03502
7 of 12

Figure 9. Annual Ei/Pi versus Epi/Pi for each watershed during 1982–2003.
W03502 WANG: INTERANNUAL WATER STORAGE CHANGES W03502
8 of 12
4. Discussions4.1. Annual Storage Change Effects in the BudykoFramework
[21] Figure 9 shows annual Ei/Pi versus Epi/Pi in theBudyko framework for all 12 watersheds with the annualevaporation estimated by two water balance methods: first,the annual storage change is assumed to be negligible, i.e.,Ei ¼ Pi � Qi ; and second, the annual storage change esti-mated from the soil moisture and groundwater level obser-vation is used to estimate the annual evaporation, i.e., Ei ¼Pi � Qi � DSi. The evaporation data of black dots are fromthe first method assuming DSi ¼ 0, and the evaporationdata of red stars is adjusted by the estimated annual storagechange. Because of the effects of annual water storage car-ryover, the data points tend to move upward for large val-ues of dryness indexes but move downward for smallvalues of dryness indexes as compared with the case ignor-ing annual carryover. Especially for very high values ofdryness index (for example, watershed 5435500 in Figure9), the evaporation can exceed precipitation because thewater storage is utilized for the water supply during dryyears. As shown in Figure 1B, the main land use in thestudy watersheds is agricultural land and the human activ-ities such as urbanization are minimum. Therefore, thegroundwater pumping, if it exists, is mainly for irrigation.Under these circumstances, the total supply of waterincludes both precipitation and soil water storage. Forexample, one data point, which is the year 1988, is locatedabove the line of Ei/Pi ¼ 1 for watershed 5435500. The val-ues of Ei/Pi and Epi/Pi are 1.1 and 1.7, respectively, and thesoil moisture change is �105 mm, and the groundwaterstorage change is �188 mm. For watershed 5447500, thevalues of Ei/Pi and Epi/Pi in 1988 are 1.1 and 1.6, respec-tively, and the soil moisture change is �117 mm, and thegroundwater storage change is �205 mm, where thegroundwater storage change is twice of soil moisture stor-age change. Extreme drought occurred during 1988 inNorth America, which included Illinois [Trenberth et al.,1988; Lamb, 1992]. During this drought year, annual evap-oration exceeded the annual precipitation. Watersheds withEi > Pi have been reported in Australia and India [Talsmaand Gardner, 1986; Calder et al., 1997], and the water useby Eucalyptus species is greater than rainfall input duringdry years.
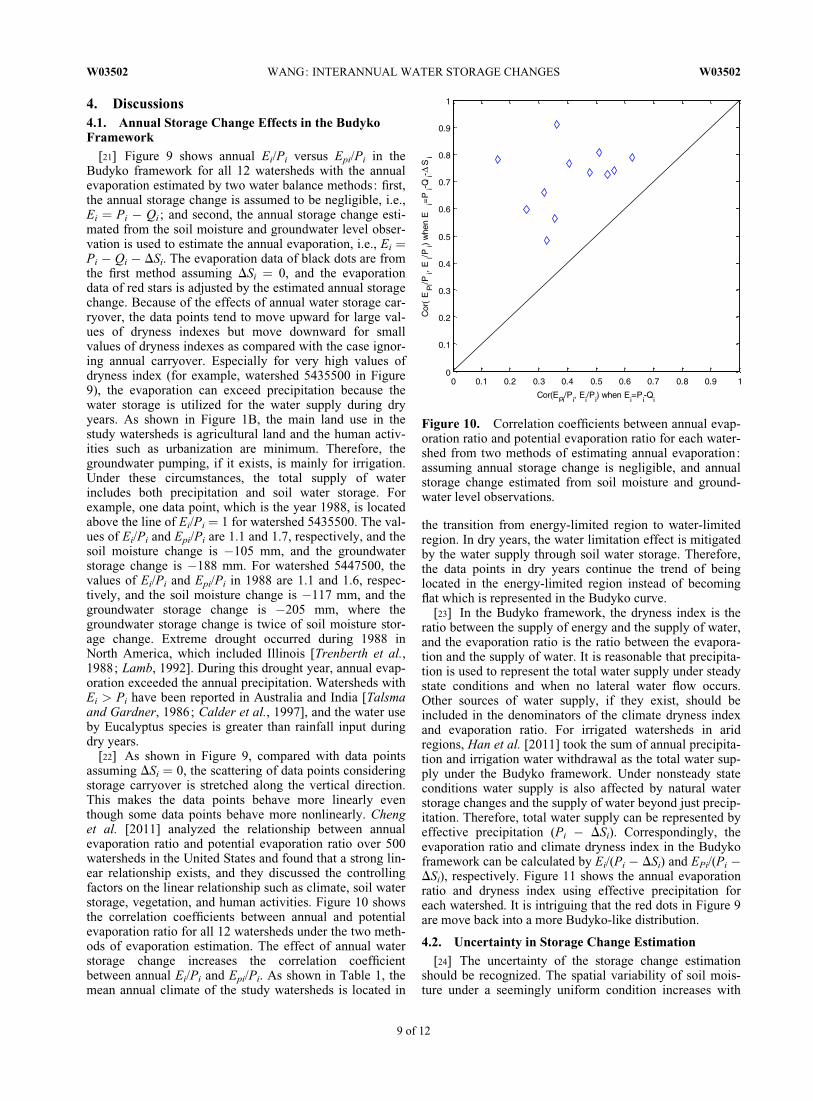
[22] As shown in Figure 9, compared with data pointsassuming DSi ¼ 0, the scattering of data points consideringstorage carryover is stretched along the vertical direction.This makes the data points behave more linearly eventhough some data points behave more nonlinearly. Chenget al. [2011] analyzed the relationship between annualevaporation ratio and potential evaporation ratio over 500watersheds in the United States and found that a strong lin-ear relationship exists, and they discussed the controllingfactors on the linear relationship such as climate, soil waterstorage, vegetation, and human activities. Figure 10 showsthe correlation coefficients between annual and potentialevaporation ratio for all 12 watersheds under the two meth-ods of evaporation estimation. The effect of annual waterstorage change increases the correlation coefficientbetween annual Ei/Pi and Epi/Pi. As shown in Table 1, themean annual climate of the study watersheds is located in
the transition from energy-limited region to water-limitedregion. In dry years, the water limitation effect is mitigatedby the water supply through soil water storage. Therefore,the data points in dry years continue the trend of beinglocated in the energy-limited region instead of becomingflat which is represented in the Budyko curve.
[23] In the Budyko framework, the dryness index is theratio between the supply of energy and the supply of water,and the evaporation ratio is the ratio between the evapora-tion and the supply of water. It is reasonable that precipita-tion is used to represent the total water supply under steadystate conditions and when no lateral water flow occurs.Other sources of water supply, if they exist, should beincluded in the denominators of the climate dryness indexand evaporation ratio. For irrigated watersheds in aridregions, Han et al. [2011] took the sum of annual precipita-tion and irrigation water withdrawal as the total water sup-ply under the Budyko framework. Under nonsteady stateconditions water supply is also affected by natural waterstorage changes and the supply of water beyond just precip-itation. Therefore, total water supply can be represented byeffective precipitation (Pi � DSi). Correspondingly, theevaporation ratio and climate dryness index in the Budykoframework can be calculated by Ei/(Pi � DSi) and EPi/(Pi �DSi), respectively. Figure 11 shows the annual evaporationratio and dryness index using effective precipitation foreach watershed. It is intriguing that the red dots in Figure 9are move back into a more Budyko-like distribution.
4.2. Uncertainty in Storage Change Estimation
[24] The uncertainty of the storage change estimationshould be recognized. The spatial variability of soil mois-ture under a seemingly uniform condition increases with
Figure 10. Correlation coefficients between annual evap-oration ratio and potential evaporation ratio for each water-shed from two methods of estimating annual evaporation:assuming annual storage change is negligible, and annualstorage change estimated from soil moisture and ground-water level observations.
W03502 WANG: INTERANNUAL WATER STORAGE CHANGES W03502
9 of 12

Figure 11. Annual Ei/(Pi � DSi) versus Epi/(Pi � DSi) for each watershed during 1982–2003.
W03502 WANG: INTERANNUAL WATER STORAGE CHANGES W03502
10 of 12

depth, and the average standard deviation of all temporalobservations is 2.26% in the top 30 cm of soil and 5.19% inthe 170–200 cm layer [Scott et al., 2010]. The long-termobservations of volumetric soil moisture were conductedunder land cover of rural grassland and most of Illinois isunder an agricultural cover. There are five major factorsaffecting the accuracy of the estimated watershed waterstorage. First, the in situ soil moisture observations containmeasurement errors, due to the imperfect relationshipbetween the calibrated neutron probe response and the truesoil moisture content, and the uncertainty of the volumetricsoil moisture made in Illinois to be �5%–10% [Hollingerand Isard, 1994]. This uncertainty effects may be cancelledout on the change of watershed water storage. Second, con-sideration of the interpolation of soil moisture and thewater table depth in the spatial coverage of the watersheds.Third, the soil moisture is measured on a bi-weekly basis,and the soil moisture measurement at the end of September(usually during approximately 26–29 September) is usedfor computing the interannual soil moisture storage change.Soil moisture, especially at the top layers, may vary signifi-cantly during the measurement period. Fourth, a constantvalue of groundwater specific yield is used (i.e., 0.08)based on the literature. Fifth, consider that spatial interpola-tion of soil moisture and groundwater level when point-based observation is not available.
5. Summary and Conclusions[25] This paper aims to examine the extent to which
water storage carryover affects the annual water balance.The interannual variability of soil water storage changes atthe watershed scale is quantified directly using the long-term observations of soil moisture and groundwater leveldata in Illinois. The approach is applied to a total of 12watersheds on the basis of the available data sets. Themean annual storage change is indeed negligible in themean annual water balance, since the mean annual storagechange ratios (DS/P) vary from �2.6% to 1.4% and the av-erage of absolute value is 0.9% at the study watersheds.However, the interannual variability of storage change canbe a significant component in annual water balance duringdry and wet years, since the annual storage change ratios(DSi/Pi) vary from �60% to 40% in the study watershedswhere the interannual soil water and groundwater storagechanges are comparable.
[26] The effect of soil water capacity decreases the sensi-tivity of annual evaporation to the interannual variability ofprecipitation. The partitioning of the annual precipitationanomaly into annual streamflow and evaporation anomaliesis buffered by the interannual storage change. The correla-tion coefficients of the annual precipitation anomaly ratioversus the annual runoff anomaly ratio, annual storagechange ratio, and annual evaporation anomaly ratio are0.73, 0.42, and 0.02, respectively. The annual evaporationanomaly ratio is positively correlated with the annual effec-tive precipitation anomaly ratio and the correlation coeffi-cient is 0.71. If soil water storage changes were ignored, theinterannual variability of storage change would be countedin the evaporation variations, and the interannual variabilityof evaporation would be overestimated considerably.
[27] Because of the effects of annual water storage carry-over, the data points in the Budyko framework move
upward for large values of dryness indexes but move down-ward for small values of dryness indexes as compared withthe case ignoring annual carryover. Groundwater storageplays a more significant role, relative to soil moisture stor-age, on the annual water balance in drought years. For veryhigh values of dryness index, the evaporation ratios canexceed the water limit due to the buffering of water storagecapacity, especially groundwater storage. The effect of theannual water storage change increases the correlation coef-ficient between the annual evaporation ratio and the annualpotential evaporation ratio.
[28] These analyses, in conjunction with those of Fler-chinger and Cooley [2000], Milly and Dunne [2002], Zhanget al. [2008], Leblanc et al. [2009], Oishi et al. [2010], andDonohue et al. [2010], demonstrate that storage change atan annual timescale may need to be considered unlesssteady state conditions can be explicitly demonstrated instudy watersheds. Under nonsteady state conditions, waterstorage changes need to be included in the estimation ofevaporation and total water supply. Effective precipitationcan be used as a substitute for precipitation when computingevaporation ratio and climate dryness index.
[29] Acknowledgments. Partial financial support for the author wasprovided by the Walter and Betty Boardman Foundation at University ofCentral Florida. The author would like to thank the Illinois State WaterSurvey for providing the soil moisture and groundwater level data. Theauthor is also very grateful to the associate editor and three anonymousreviewers for their insightful and constructive feedback on this manuscript.
ReferencesAmenu, G. G., P. Kumar, and X.-Z. Liang (2005), Interannual variability of
deep-layer hydrologic memory and mechanisms of its influence on sur-face energy fluxes, J. Clim., 18, 5024–5045.
Budyko, M. I. (1958), The heat balance of the Earth’s surface (translatedfrom Russian by N. A. Stepanova), 259 pp., U.S. Dep. of Commer.,Washington, D.C.
Budyko, M. I. (1974), Climate and Life, 508 pp., Academic, N. Y.Calder, I. R., P. T. W. Rosier, K. T. Prasanna, and S. Parameswarappa
(1997), Eucalyptus water use greater than rainfall input––a possible ex-planation from southern India, Hydrol. Earth Syst. Sci., 1(2), 249–256.
Changnon, S. A., F. A. Huff, and C. F. Hsu (1988), Relations between pre-cipitation and shallow groundwater in Illinois, J. Clim., 1, 1239–1250.
Cheng, L., Z. Xu, D. Wang, and X. Cai (2011), Assessing interannualvariability of evapotranspiration at the catchment scale using satellite-based evapotranspiration data sets, Water Resour. Res., 47, W09509,doi:10.1029/2011WR010636.
Choudhury, B. J. (1999), Evaluation of an empirical equation for annualevaporation using field observations and results from a biophysicalmodel, J. Hydrol., 216, 99–110.
Donohue, R. J., M. L. Roderick, and T. R. McVicar (2007), On the impor-tance of including vegetation dynamics in Budyko’s hydrological model,Hydrol. Earth Syst. Sci., 11, 983–995.
Donohue, R. J., M. L. Roderick, and T. R. McVicar (2010), Can dynamicvegetation information improve the accuracy of Budyko’s hydrologicalmodel?, J. Hydrol., 390(1–2), 23–34.
Dooge, J. (1992), Sensitivity of runoff to climate change: A Hortonianapproach, Bull. Am. Meteorol. Soc., 73, 2013–2013.
Duan, Q., et al. (2006), The model parameter estimation experiment(MOPEX): An overview of science strategy and major results fromthe second and third workshops, J. Hydrol., 320, 3–17, doi:10.1016/j.jhydrol.2005.07.031.
Flerchinger, G. N., and K. R. Cooley (2000), A ten-year water balance of amountainous semi-arid catchment, J. Hydrol., 237, 86–99.
Fu, B. P. (1981), On the calculation of the evaporation from land surface (inChinese), Sci. Atmos. Sin., 5(1), 23–31.
Gerrits, A. M. J., H. H. G. Savenije, E. J. M. Veling, and L. Pfister (2009),Analytical derivation of the Budyko curve based on rainfall characteris-tics and a simple evaporation model, Water Resour. Res., 45, W04403,doi:10.1029/2008WR007308.
W03502 WANG: INTERANNUAL WATER STORAGE CHANGES W03502
11 of 12

Han, S., H. Hu, D. Yang, and Q. Liu (2011), Irrigation impact on annualwater balance of the oases in Tarim Basin, Northwest China, Hydrol.Processes, 25, 167–174.
Harman, C. J., P. A. Troch, and M. Sivapalan (2011), Functional model ofwater balance variability at the catchment scale: 2. Elasticity of fast andslow runoff components to precipitation change in the continental UnitedStates, Water Resour. Res., 47, W02523, doi:10.1029/2010WR009656.
Hickel, K., and L. Zhang (2006), Estimating the impact of rainfall seasonal-ity on mean annual water balance using a top-down approach, J. Hydrol.,331, 409–424.
Hollinger, S. E., and S. A. Isard (1994), A soil moisture climatology of Illi-nois, J. Clim., 7, 822–833.
Jothityangkoon, C., and M. Sivapalan (2009), Framework for explorationof climatic and landscape controls on catchment water balance, with em-phasis on inter-annual variability, J. Hydrol., 371, 154–168.
Koster, R. D., and M. J. Suarez (1999), A simple framework for examiningthe interannual variability of land surface moisture Fluxes, J. Clim., 12,1911–1917.
Lamb, P. J. (Ed.) (1992), The 1988–1989 drought in Illinois: Causes, dimen-sions, and impacts, Res. Rep. 121, 154 pp., Ill. State Water Surv.,Champaign.
Leblanc, M. J., P. Tregoning, G. Ramillien, S. O. Tweed, and A. Fakes(2009), Basin-scale, integrated observations of the early 21st centurymultiyear drought in southeast Australia, Water Resour. Res., 45,W04408, doi:10.1029/2008WR007333.
Lo, M.-H., J. S. Famiglietti, P. J.-F. Yeh, and T. H. Syed (2010), Improvingparameter estimation and water table depth simulation in a land surfacemodel using GRACE water storage and estimated base flow data, WaterResour. Res., 46, W05517, doi:10.1029/2009WR007855.
Milly, P. C. D. (1994a), Climate, interseasonal storage of soil-water, andthe annual water-balance, Adv. Water Resour., 17(1–2), 1–24.
Milly, P. C. D. (1994b), Climate, soil water storage, and the average annualwater balance, Water Resour. Res., 30, 2143–2156.
Milly, P. C. D., and K. A. Dunne (2002), Macroscale water fluxes, 2. Waterand energy supply control of their interannual variability, Water Resour.Res., 38(10), 1206, doi:10.1029/2001WR000760.
Niemann, J. D., and E. A. B. Eltahir (2004), Prediction of regional waterbalance components based on climate, soil, and vegetation parameters,with application to the Illinois River Basin, Water Resour. Res., 40,W03103, doi:10.1029/2003WR002806.
Oishi, A. C., R. Oren, K. A. Novick, S. Palmroth, and G. G. Ka (2010),Interannual invariability of forest evapotranspiration and its consequenceto water flow downstream, Ecosystems, 13, 421–436.
Ol’dekop, E. M. (1911), On evaporation from the surface of river basins (inRussion), Trans. Meteorol. Observ., 4, 200.
Oudin, L., V. Andreassian, J. Lerat, and C. Michel (2008), Has land cover asignificant impact on mean annual streamflow? An international assess-ment using catchments, J. Hydrol., 357, 303–316.
Pike, J. G. (1964), The estimation of annual runoff from meteorologicaldata in a tropical climate, J. Hydrol., 2, 116–123.
Porporato, A., E. Daly, and I. Rodriguez-Iturbe (2004), Soil water balanceand ecosystem response to climate change, Am. Nat., 164(5), 625–632.
Potter, N. J., and L. Zhang (2009), Interannual variability of catchmentwater balance in Australia, J. Hydrol., 369, 120–129.
Potter, N. J., L. Zhang, P. C. D. Milly, T. A. McMahon, and A. J. Jakeman(2005), Effects of rainfall seasonality and soil moisture capacity on meanannual water balance for Australian catchments, Water Resour. Res., 41,W06007, doi:10.1029/2004WR003697.
Priestley, C. H. B., and R. J. Taylor (1972), On the assessment of surface heat fluxand evaporation using large-scale parameters, Mon. Weather Rev., 100, 81–92.
Robock, A., Y. V. Konstantin, G. Srinivasan, J. K. Entin, S. E. Hollinger,N. A. Speranskaya, S. Liu, and A. Namkhai (2000), The global soil mois-ture data bank, Bull. Am. Meteorol. Soc., 81, 1281–1299.
Rodell, M., and J. S. Famiglietti (2001), An analysis of terrestrial waterstorage variations in Illinois with implications for the gravity recoveryand climate experiment (GRACE), Water Resour. Res., 37, 1327–1340.
Sankarasubramanian, A., and R. V. Vogel (2002), Annual hydroclimatol-ogy of the United States, Water Resour. Res., 38(6), 1083, doi:10.1029/2001WR000619.
Schaake, J. C. (1990), From climate to flow, in Climate Change and U.S.Water Resources (edited by P. E. Waggoner), chapt. 8, pp. 177–206, JohnWiley, N.Y.
Schreiber, P. (1904), Über die Beziehungen zwischen dem Niederschlagund der Wasserführung der Flüsse in Mitteleuropa, MeteorologischeZeitschrift, 21(10), 441–452.
Scott, R. W., E. C. Krug, and S. L. Burch (2010), Illinois soil moistureunder sod experiment, J. Hydrometeor., 11, 683–704, doi:10.1175/2009JHM1130.1
Sivapalan, M., M. A. Yaeger, C. J. Harman, X. Xu, and P. A. Troch (2011),Functional model of water balance variability at the catchment scale: 1.Evidence of hydrologic similarity and space-time symmetry, WaterResour. Res., 47, W02522, doi:10.1029/2010WR009568.
Swenson, S., P. J.-F. Yeh, J. Wahr, and J. Famiglietti (2006), A comparisonof terrestrial water storage variations from GRACE with in situ measure-ments from Illinois, Geophys. Res. Lett., 33, L16401, doi:10.1029/2006GL026962.
Talsma, T., and E. A. Gardner (1986), Soil-water extraction by a mixedeucalypt forest during a drought period, Aust. J. Soil Res., 24(1), 25–32.
Trenberth, K. E., G. W. Branstator, and P. A. Arkin (1988), Origins of the1988 North American Drought, Science, 424(4886), 1640–1645.
Wang D., and M. Hejazi (2011), Quantifying the relative contribution ofthe climate and direct human impacts on mean annual streamflow in thecontiguous United States, Water Resour. Res., 47, W00J12, doi:10.1029/2010WR010283.
Wang, T., E. Istanbulluoglu, J. Lenters, and D. Scott (2009), On the role ofgroundwater and soil texture in the regional water balance: An investiga-tion of the Nebraska Sand Hills, USA, Water Resour. Res., 45, W10413,doi:10.1029/2009WR007733.
Yang, D., F. Sun, Z. Liu, Z. Cong, G. Ni, and Z. Lei (2007), Analyzing spa-tial and temporal variability of annual water-energy balance in nonhumidregions of China using the Budyko hypothesis, Water Resour. Res., 43,W04426, doi:10.1029/2006WR005224.
Yang, D., W. Shao, P. J. F. Yeh, H. Yang, S. Kanae, and T. Oki (2009),Impact of vegetation coverage on regional water balance in the nonhu-mid regions of China, Water Resour. Res., 45, W00A14, doi:10.1029/2008WR006948.
Yang, H., D. Yang, Z. Lei, and F. Sun (2008), New analytical derivation ofthe mean annual water-energy balance equation, Water Resour. Res., 44,W03410, doi:10.1029/2007WR006135.
Yeh, P. J.-F., and E. A. B. Eltahir (2005), Representation of water tabledynamics in a land surface scheme, Part I : Model development, J. Clim.,18, 1861–1880.
Yeh, P. J.-F. and J. S. Famiglietti (2009), Regional groundwater evapotrans-piration in Illinois, J. Hydrometeor., 10(4), 464–478, doi:10.1175/2008JHM1018.1.
Yeh, P. J.-F., M. Irizarry, and E. A. B. Eltahir (1998), Hydroclimatology ofIllinois: A comparison of monthly evaporation estimates based onatmospheric water balance with estimates based on soil water balances,J. Geophys. Res., 103(D16), 19:823–19:837.
Yokoo, Y., M. Sivapalan, and T. Oki (2008), Investigating the roles of cli-mate seasonality and landscape characteristics on mean annual andmonthly water balances, J. Hydrol., 357, 255–269.
Zhang, K., J. S. Kimball, R. R. Nemani, and S. W. Running (2010), A con-tinuous satellite-derived global record of land surface evapotranspirationfrom 1983–2006, Water Resour. Res., 46, W09522, doi:10.1029/2009WR008800.
Zhang, L., W. R. Dawes, and G. R. Walker (2001), Response of mean an-nual evapotranspiration to vegetation changes at catchment scale, WaterResour. Res., 37(3), 701–708.
Zhang, L., N. Potter, K. Hickel, Y. Zhang, and Q. Shao (2008), Waterbalance modeling over variable time scales based on the Budykoframework––model development and testing, J. Hydrol., 360, 117–131.
D. Wang, Department of Civil, Environmental, and Construction Engi-neering, University of Central Florida, 4000 Central Florida Blvd., POBox 162450, Orlando, FL 32816, USA. ([email protected])
W03502 WANG: INTERANNUAL WATER STORAGE CHANGES W03502
12 of 12