Evaluating different options of integrating linked data ...
198
Evaluating different options of integrating linked data into standard geospatial web services for thematic mapping by Wiafe Owusu-Banahene (Student Number: 11372215) A thesis submitted in partial fulfilment of the requirements for the degree of Doctor of Philosophy (Geoinformatics) in the Faculty of Natural and Agricultural Sciences, University of Pretoria 2015 November © University of Pretoria
Transcript of Evaluating different options of integrating linked data ...

Evaluating different options of integrating linked
data into standard geospatial web services for
thematic mapping
by
Wiafe Owusu-Banahene
(Student Number: 11372215)
A thesis submitted in partial fulfilment of the requirements for the degree of
Doctor of Philosophy (Geoinformatics)
in the
Faculty of Natural and Agricultural Sciences,
University of Pretoria
2015 November
© University of Pretoria

i
Abstract
Evaluating different options of integrating linked data into standard
geospatial web services for thematic mapping
Candidate: Wiafe Owusu-Banahene Supervisor: Professor Serena Martha Coetzee
Degree: PhD (Geoinformatics) Department: Geography, Geoinformatics and Meteorology
The open data movement has resulted in many datasets on the web to be freely available for
anyone to freely access, use, modify and share for any purpose (subject, at most, to
requirements that preserve provenance and openness). The Linked Open Data (LOD) cloud is
an example of such an open data repository of attribute data in the form of billions of
Resource Description Framework triples on the Web. Visualising such open data in thematic
maps provides a powerful spatial analysis tool for planning and decision-making. In this
research, several styles of creating web thematic maps by integrating the attributes from the
LOD cloud with geometry in a spatial database server were investigated and evaluated.
Requirements for a specialised geospatial web service that combines linked data with
geospatial data to create thematic maps were specified. Standard technologies were used,
motivated by the widespread deployment of standardised web map services in the geospatial
community and the widespread publication of alphanumeric data (by statistical agencies) in
the LOD cloud. A specialisation of an Open Geospatial Consortium Web Map Service
(WMS) that creates web thematic maps by integrating alphanumeric linked data from the
LOD cloud with geometry in a spatial database server was conceptualised. Three integration
styles (referred to as design options) for this specialised web service were designed and
implemented. The first style integrates linked data with spatial data by an importer. The
second and third styles use a middleware and extension of a spatial database server
respectively to integrate linked data with spatial data. In each of the three styles, attributes are
retrieved from the LOD cloud through semantic queries and only the results of the semantic
query are visualised on the thematic map. In this way, the benefits of semantic queries are
exploited in the Semantic Web itself and the WMS mapping capabilities are used to visualise
the semantic query results on a thematic map by integrating these with geospatial data. The
three integration styles are critically evaluated against the specified requirements. This
research contributes to understanding the pros and cons of incorporating semantic (linked)
data models into standard geospatial web service models to create cartographic products (web
thematic maps). This research contributes to bridging the gap between linked data and web
thematic mapping.
Keywords: geospatial web service, thematic map, LOD cloud, linked data, integration, OGC
Web Map Service (WMS)

ii
Acknowledgements
To the Most High God be the glory!
With inexpressible gratitude: I would like to thank my supervisor, Prof. Serena Coetzee who
spent countless hours, days and weeks to ensure that I bring out the best in me, despite her
busy schedule all year long. You really are an inspiration to me! My sincere appreciation
goes to the German Academic Exchange Service (DAAD) for the partial funding of the
research described in this dissertation. The University of Ghana granted me a study leave
with pay; for this, I am grateful. The South Africa-Namibia bilateral project on spatial data
infrastructure (2012-2013) provided partial funding for me to attend a conference in Germany
in 2013. The said project created an opportunity for me to work with colleagues from
Namibia (Dr Martin Hopondoka, Dr Emma Nangolo and Mr Kisco Sinvula), Ghana (Mr
Foster Mensah) and South Africa (Prof. Serena Coetzee, Mr Antony Cooper and Miss
Victoria Rautenbach); for this I am thankful. It was great working with you all!
To my sweet wife Afua and my children Meroma, Mataya, Melkina and Manuella who
were with me during the full time studies in Pretoria, South Africa; I say, ‗Ayekoo‘
(translated from Twi as ‗well done‘). Without your understanding, unflinching support and
co-operation, I could not have come this far. My deepest gratitude goes to my parents:
Samuel Kwadwo Wiafe (late) and Juliana Serwaa for giving me the opportunity to be
educated amidst their disadvantaged financial circumstances. I cannot forget your support, Dr
Ransford Frempong (37 Military Hospital) and my cousin: Dr. Effah Kwabena Antwi (United
Nations University, Tokyo, Japan). I appreciate all your efforts!
I would like to make special mention of Miss Victoria Rautenbach who provided
administrative assistance all the time. Victoria I am grateful for everything
I am thankful to Dr Daniel Darkey, Sanet Eksteen and Erika Pretorius; staff of the
Department of Geography, Geoinformatics and Meteorology of the University of Pretoria, for
their support and comments during seminar presentations. To my postgraduate colleagues

iii
who worked with me in the same lab, Kisco Sinvula, Ditsela Jeofrey, Noh Teamrat and
Sammy Katumba. The fruitful discussions we had in the lab about our research projects had a
positive impact on this research.
My gratitude also goes to Prof. Hahns-Peter Baehr, Dr Charlotte Kaempf, Prof. Dieter
Prinz and all the postgraduate students of the Master Resources Engineering (2012-2014
intake) at Karlsruhe Institute of Technology, Karlsruhe, Germany for their participation,
comments and suggestions during the ―Alumni Get Together PhD presentations‖ in 2013. I
would like to also thank Professors Getrude Schaab and Reiner Jaegar of Hochschule
Karlsruhe (Karlsruhe University of Applied Sciences), Karlsruhe, Germany for their support
during my visit in August, 2013. ―Ich bin ihnen sehr dankbar‖ (I am very grateful).
My siblings, extended relatives, in-laws and some friends especially Mr Oppong
Amponsah and Dr Isaac K Nti supported me in diverse ways during this PhD journey. To all
of you, I say thank you.
Finally, I would like to express my heartfelt appreciation to Mrs Dakey of Ghana High
Commission in Pretoria, Oupa, Moses Maputuma (Bra Moss), Wendy and the family and
Violet (University of Pretoria).

iv
Preamble
Between 2012- 2013 I was involved in the South African –Namibian bilateral cooperation on
Namibian Spatial Data Infrastructure for Health. I was part of the team that represented South
Africa from the Centre for Geoinformation Science of the Department of Geography
Geoinformatics and Meteorology of the University of Pretoria. As part of the project, I led
the team in investing the SDI in Ghana resulting in the publication of a refereed book chapter
(Appendix C1). Appendix C1 presents the other publication from this project.
During my PhD studies, I was a lecturer for a Spatial Database short course organised by
the Computer Science Department under the Centre for Continuing Education (CEATUP) of
the University of Pretoria in June, 2012.
In 2011-2012, I represented the Department of Geography Geoinformatics and
Meteorology of the University of Pretoria on the South African Bureau of Standards (SANS)
TC 211 Committee on Geographic Information.

v
Table of Contents
ABSTRACT .................................................................................................................................................. I
ACKNOWLEDGEMENTS ............................................................................................................................. II
PREAMBLE .............................................................................................................................................. IV
TABLE OF CONTENTS ................................................................................................................................ V
LIST OF FIGURES ..................................................................................................................................... XII
LIST OF TABLES ....................................................................................................................................... XV
LIST OF ACRONYMS .............................................................................................................................. XVII
CHAPTER 1: INTRODUCTION .................................................................................................................... 1
BACKGROUND INFORMATION AND MOTIVATION .......................................................................................... 1 1.1
1.2 RESEARCH DESCRIPTION .......................................................................................................................... 5
1.2.1 Problem Statement .................................................................................................................. 5
1.2.2 Goal of this Research................................................................................................................ 6
1.2.3 Research Objectives ................................................................................................................. 7
1.2.4 Limitations of the Research ...................................................................................................... 7
1.2.5 Significance of the Research .................................................................................................... 8
1.3 SCIENTIFIC BACKGROUND ........................................................................................................................ 9
1.3.1 Cartography ........................................................................................................................... 10
1.3.2 Geographic Information Science ............................................................................................ 11
1.3.3 Computer Science ................................................................................................................... 13
1.4 RESEARCH APPROACH ........................................................................................................................... 14

vi
1.4.1 Conceptualising Geospatial Thematic Web Service ............................................................... 14
1.4.2 Critical Evaluation of Technology, Tools and Standards ........................................................ 15
1.4.3 Identify Requirements and Design Options ............................................................................ 15
1.4.4 Implementations .................................................................................................................... 16
1.4.5 Results and Evaluations ......................................................................................................... 16
1.5 BRIEF OVERVIEW OF CHAPTERS AND ITS CONTRIBUTIONS ............................................................................ 16
CHAPTER 2: STATE-OF-THE-ART ............................................................................................................. 19
INTRODUCTION.................................................................................................................................... 19 2.1
2.2 CARTOGRAPHY .................................................................................................................................... 19
2.2.1 Thematic Cartography ................................................................................................................. 19
2.2.2 Ubiquitous Cartography ............................................................................................................... 24
2.3 STANDARD BASED GEOSPATIAL WEB SERVICES .......................................................................................... 26
2.3.1 Web Services ................................................................................................................................ 26
2.3.2 Geospatial Web Services .............................................................................................................. 28
2.3.3 Geospatial Web Services Standards ....................................................................................... 28
2.4 LINKED DATA ...................................................................................................................................... 31
2.4.3 Principles of Linked Data ........................................................................................................ 31
2.4.4 Linked Open Data (LOD) Cloud ............................................................................................... 32
2.4.5 Statistics on the Linked Open Data Cloud .............................................................................. 34
2.4.6 Representing Linked Data ...................................................................................................... 35
2.4.7 Querying Linked Data ............................................................................................................. 36
2.4.8 Accessing Linked Data ............................................................................................................ 37
2.5 DATA INTEGRATION .............................................................................................................................. 37
2.5.1 Approaches to Data Integration .................................................................................................. 39

vii
2.5.2 Integrating Linked Data into (Spatial) Databases ........................................................................ 40
2.5.3 Relational Database to RDF Mapping Approaches ...................................................................... 42
2.6 OPEN SOURCE GEOSPATIAL SOFTWARE ......................................................................................................... 46
2.7 SPATIAL DATA INFRASTRUCTURES IN THIS RESEARCH ....................................................................................... 48
2.8 RELATED WORK .................................................................................................................................. 50
2.8.1 Creating Thematic Maps .............................................................................................................. 50
2.8.2Linked Data Web Mapping Applications....................................................................................... 51
2.8.3 Integrating Linked Data into (Spatial-) Databases....................................................................... 55
2.9 CONCLUSION ...................................................................................................................................... 57
CHAPTER 3: EVALUATION OF TECHNOLOGIES, TOOLS AND STANDARDS RELATED TO OPEN SOURCE
GEOSPATIAL WEB SERVICES ........................................................................................................................... 59
3.1 INTRODUCTION ........................................................................................................................................ 59
3.2 OVERVIEW OF THREE OPEN SOURCE WEB MAP SERVERS ............................................................................ 60
3.3 RELATED WORK ....................................................................................................................................... 61
3.4 EVALUATION PROCEDURE AND RESULTS ................................................................................................... 61
3.4.1 Ease of Installation ................................................................................................................. 63
3.4.2 Ease of Cartographic Workflow ............................................................................................. 64
3.4.3 Level of Support for Displaying Web Maps ............................................................................ 65
3.4.4 Level of Quality of Web Maps ................................................................................................ 67
3.4.5 Types of Output Formats Supported ...................................................................................... 71
3.4.6 Types of Input Data Supported .............................................................................................. 72
3.4.7 Levels of Support for Styling ................................................................................................... 74
3.4.8 Adherence to Standards ......................................................................................................... 76
3.4.9 User Documentation .............................................................................................................. 77

viii
3.5 SUMMARY AND ANALYSIS OF RESULTS ..................................................................................................... 77
3.6 CHOICE OF SPATIAL DATABASE MANAGEMENT SYSTEM............................................................................... 79
3.7 CONCLUSION ...................................................................................................................................... 80
CHAPTER 4: DESIGN OPTIONS FOR GEOSPATIAL THEMATIC WEB SERVICE .............................................. 82
4.1 INTRODUCTION.................................................................................................................................... 82
4.2 CONCEPTUALISATION OF GTWS ................................................................................................................. 82
4.2.1 Utilising Open source Geospatial Software to Access and Integrate Linked Data from the LOD
Cloud ............................................................................................................................................................ 84
4.3 IDENTIFYING REQUIREMENTS ...................................................................................................................... 86
4.3.1 Map Communication Model in the Linked Data Context ............................................................. 86
4.3.2 Requirements ............................................................................................................................... 89
4.3.3 Process Flow Modelling ............................................................................................................... 90
4.4 DESIGN OPTIONS ..................................................................................................................................... 91
4.4.1 GTWS-1: The Importer ................................................................................................................. 93
4.4.2 GTWS-2: The Middleware ............................................................................................................ 94
4.4.3 GTWS-3: The Extension ................................................................................................................ 95
CHAPTER 5: IMPLEMENTATIONS ................................................................................................. 98
5.1 INTRODUCTION ................................................................................................................................... 98
5.2 IMPLEMENTATION OF GTWS-1 .................................................................................................... 99
5.2.1 Assessing RDF from the LOD Cloud ................................................................................. 100
5.2.2 Loading Results of SPARQL Query into Spatial Database ............................................... 101
5.2.3 Connecting the PostGIS Database to GeoServer and Publishing the Data ...................... 102
5.2.4 Creating Styling for Choropleth Maps ............................................................................... 103
5.2.5 Creating a Proportional Symbol Map................................................................................. 106

ix
5.3 IMPLEMENTATION OF GTWS-2: THE MIDDLEWARE.................................................................. 106
5.4 IMPLEMENTATION OF GTWS-3 .................................................................................................. 109
CHAPTER 6: RESULTS AND DISCUSSION ................................................................................................ 113
6.1 INTRODUCTION ...................................................................................................................................... 113
6.2 EVALUATION OF THE DESIGN OPTIONS AGAINST THE REQUIREMENTS ........................................................... 113
6.3 EVALUATION OF THE IMPLEMENTATIONS AGAINST THE REQUIREMENTS ......................................................... 115
6.4 DISCUSSION OF THE DESIGN OPTIONS .................................................................................................... 118
6.4.1 Discussion of GTWS-1: the Importer .......................................................................................... 118
6.4.2 Discussion of GTWS-2: the Middleware ..................................................................................... 119
6.4.3 Discussion of GTWS-3: the Extension ......................................................................................... 119
6.5 DISCUSSION OF THE IMPLEMENTATIONS ................................................................................................. 120
6.5.1 Discussion of the Implementation of GTWS 1: the Importer ...................................................... 120
6.5.2 Discussion of the Implementation of GTWS 2: the Middleware ................................................ 121
6.5.3 Discussion of the Implementation of GTWS 3: the Extension .................................................... 121
6.6 DISCUSSION OF COMPARATIVE ISSUES.................................................................................................... 122
CHAPTER 7: CONCLUSION ..................................................................................................................... 127
7.1 INTRODUCTION ...................................................................................................................................... 127
7.2 SUMMARY OF FINDINGS ...................................................................................................................... 127
7.3 SUMMARY OF CONTRIBUTIONS ............................................................................................................. 131
7.3.1 Further Research Questions ....................................................................................................... 132
7.3.2 Design Options ........................................................................................................................... 132
7.3.3 Utilising Linked Data from the LOD Cloud in the Same Way as Other Geospatial Data ............ 132
7.3.4 Benefits and Drawbacks of Existing Geospatial Models ............................................................ 133
7.3.5 Setting the Stage for Dynamic Visualisation of Linked Data as Web Thematic Maps ............... 133

x
7.3.6 Potential of Open Source Geospatial Software in the Uptake of Linked Data ........................... 134
7.3.7 Extending the Current Architecture of Geospatial web service to Integrate Linked Data from the
LOD Cloud................................................................................................................................................... 134
7.3.8 Bridging the Gap between Linked Open Data and Web Thematic Mapping ............................. 134
7.3.9 Integrating Linked Data into Spatial Data Infrastructure .......................................................... 135
7.3.10 Ubiquitous Cartography in the Context of LOD Cloud .............................................................. 135
7.4 FUTURE WORK .................................................................................................................................. 135
7.4.1 Extending the Client to Integrate Linked Data ..................................................................... 135
7.4.2 Dynamic Visualisation and Automation ............................................................................... 136
7.4.3 Modifying OGC Web Services for Linked Data Consumption ............................................... 136
7.4.4 Integrating Linked Data from the LOD2 Cloud ..................................................................... 137
7.4.5 Making the LOD Cloud a Part of SDIs ................................................................................... 137
7.4.6 Developing Entirely New Open Source Geospatial Software ............................................... 137
7.4.7 Enabling Geospatial Web Services to Accommodate Internet of Things ............................. 137
REFERENCES .......................................................................................................................................... 139
APPENDIX A. IMPLEMENTATION OF GTWS-1 ........................................................................................ 160
A.1 SPARQL QUERY 1............................................................................................................................. 160
A.2 RESPONSE TO SPARQL QUERY 1 IN RDF/XML .......................................................................................... 160
A.3 RESPONSE TO SPARQL QUERY 1 IN CSV FORMAT ....................................................................................... 170
A.4 SQL SCRIPT FOR IMPLEMENTING THE INTEGRATOR IN GTWS-1 ...................................................................... 171
A.5 SLD CODES FOR GENERATING CHOROPLETH MAP SHOWING LANDLOCKED AND NON-LANDLOCKED COUNTRIES ...... 172
A.6 SLD CODES FOR GENERATING THE PROPORTIONAL SYMBOLS MAP SHOWING NOMINAL GDP PER CAPITA OF
COUNTRIES ........................................................................................................................................................ 173

xi
APPENDIX B. PUBLICATIONS FROM THIS RESEARCH ............................................................................. 177
B.1 REFEREED JOURNAL PUBLICATIONS ....................................................................................................... 177
B.2 REFEREED CONFERENCE PROCEEDINGS ....................................................................................................... 177
B.3 BOOK CHAPTERS .................................................................................................................................... 177

xii
List of Figures
Figure 1: Scientific background to the research described in this study .................................. 9
Figure 2: A thematic map showing the dominant source of water being used by households
in a district municipality, 2001 .................................................................................... 20
Figure 3: A choropleth map showing agricultural production (1999-2001) of countries ....... 23
Figure 4: A proportional symbol map showing transport sector gasoline fuel consumption of
countries (created with Indiemapper). ......................................................................... 23
Figure 5: Anatomy of a web service interaction. Purple arrows are the discovery, the blue
arrows are the request, and the red arrows are the response. (Banerjee et al., 2004) .. 27
Figure 6: OGC Web service instances classified by specification (Source: Lopez-Pellicer et
al., 2011). ..................................................................................................................... 30
Figure 7: LOD Cloud diagram and extract of the LOD Cloud diagram ................................. 33
Figure 8: Data integration system (Source: Lenzerini, 2002) ................................................. 38
43
Figure 9: Direct mapping of People and Address relational tables to RDF (source: Das et al.,
2012). ........................................................................................................................... 43
Figure 10: R2RML mapping of EMP table and example output (Source: Das et al., 2012 ). 45
Figure 11: Homepage of map4rdf (Source: http://oeg-dev.dia.fi.upm.es/map4rdf/) .............. 52
Figure 12: DBpedia Mobile's web page (Source : http://wiki.dbpedia.org/DBpediaMobile)52
Figure 13: Spatial@linkedscience interactive tool ................................................................. 53
Figure 14: LinkedGeoData browser (Source: http://browser.linkedgeodata.org/) ................. 54
Figure 15: RDF graph in Oracle (Source: Alexander and Ravada, 2006) .............................. 55
Figure 16: Input data for the evaluation of web map servers ................................................. 62
Figure 17: Conceptual design of the set up for analysing the ease of cartographic workflow
...................................................................................................................................... 65
Figure 18: Map in PNG from MapServer .............................................................................. 69
Figure 19: Map in PNG from QGIS Server. .......................................................................... 70

xiii
Figure 20: Map in PNG from GeoServer................................................................................ 70
Figure 21: Venn diagram showing number of output formats supported by GetMap requests.
...................................................................................................................................... 72
Figure 22: Number of input data supported. ........................................................................... 74
Figure 23: Number of SLD extensions supported. ................................................................. 75
Figure 24. Diagram showing the conceptualisation of a GTWS ........................................... 83
Figure 25: Spatial, non- spatial (attributes) and styling components of GTWS. .................... 84
Figure 26: The current relationship between free and open source geospatial software and the
LOD cloud. .................................................................................................................. 85
Figure 27: Approach to developing free and open source geospatial software to use the LOD
cloud. ............................................................................................................................ 85
Figure 28: A map communication model in the context of linked data, adapted from Slocum
et al. (2010). ................................................................................................................. 88
Figure 29: Process flow model for GTWS. ............................................................................ 91
Figure 30: Generic architecture of the web mapping component. .......................................... 92
Figure 31. GTWS-1: Importer ............................................................................................... 93
Figure 32: GTWS-2: The middleware .................................................................................... 94
Figure 33: GTWS-3: extension ............................................................................................... 96
Figure 34: Architecture of spatial database extension to LOD cloud (spatial2LOD) ............ 97
Figure 35: Implementation of GTWS-1: The importer. ...................................................... 100
Figure 36: WorldCountries_LandLocked table created in a PostGIS spatial database. ...... 102
Figure 37: GeoServer‘s Edit Layer user interface for the layer WorldCountries_LandLocked.
.................................................................................................................................... 103
Figure 38: The results of a GetMap request to the WMS 1.3.0. ........................................... 104
Figure 39: Choropleth map showing landlocked and non-landlocked countries in the world.
.................................................................................................................................... 105
Figure 40: Choropleth map showing population density (per square kilometre) of landlocked
countries in the world. ............................................................................................... 105

xiv
Figure 41: Proportional symbols map showing nominal GDP per capita of countries in the
world. ......................................................................................................................... 106
Figure 42: Implementation of GTWS-2: importer. ............................................................... 107
Figure 43: A proportional symbol map showing percentage of GDP from agriculture per
country in 2010 created with GTWS-2: the middleware. .......................................... 108
Figure 44: A choropleth map showing CO2 per capita per country in 2008 created with
GTWS-2: the middleware. ......................................................................................... 108
Figure 45: Implementation of spatial database extension to LOD cloud (spatial2LOD). .... 110
Figure 46: Implementation of GTWS-3: the extension. ....................................................... 111
Figure 47: Choropleth map (created with GTWS-3) showing human development index
(HDI) of various countries in the world using RDF triples from DBpedia. .............. 112

xv
List of Tables
Table 1: Overview of the number of triples and the amount of RDF links per domain as at
September 2011 (source: Bizer et al., 2011)................................................................ 34
Table 2: Aggregated LODStats results at various points in time (Source: Ermilov et al.,
2013) ............................................................................................................................ 35
Table 3: People and Address relational tables (Source: Arenas et al., 2012) ......................... 43
Table 4: EMP relational table (Source: Das et al., 2012 ). ..................................................... 44
45
Table 5: Mapping object-oriented structure to relational database structure (Bourret, 2009).
...................................................................................................................................... 46
Table 6: Examples of categories of open source geospatial software (source:
http://www.osgeo.org/) ................................................................................................ 48
Table 7: Representing RDF triples in a relational database .................................................... 56
Table 8: Table containing geometric objects in a spatial database. ........................................ 56
Table 9: Table created after joining the geometric object table to the relational table
containing the RDF triples. .......................................................................................... 57
Table 10: Mode of evaluation and justification for each criterion .......................................... 63
Table 11: Open source web map servers installed. ................................................................. 64
Table 12: Various versions of WMS supported. ..................................................................... 67
Table 13: Quality of WMS GetMap responses ....................................................................... 69
Table 14: Types of input data ................................................................................................. 73
Table 15: Documented support for SLD and SLD Extensions. .............................................. 75
Table 16: OGC WMS and SLD statistics of the current and previous versions of web map
servers (source of data: OGC, 2012c) .......................................................................... 76
Table 17: Summary of results ................................................................................................. 78
Table 18. Evaluation of the design options against the requirements. .................................. 114

xvi
Table 19. Evaluation of the implementations of GTWS-1, GTWS-2 and GTWS-3 against the
requirements. .............................................................................................................. 116

xvii
List of Acronyms
API – Application Programming Interface
CSV – comma separated values
CKAN – Comprehensive Knowledge Archiving Network
GIS – geographic information system
GISc – geographic information science
GTWS – Geospatial Thematic Web Service
HTTP – Hypertext Transfer Protocol
IRI–Internationalized Resource Identifiers
ISO – International Organisation for Standards
JSON – JavaScript Object Notation
LOD – Linked Open Data
NamSDI – Namibian spatial data infrastructure
OGC – Open Geospatial Consortium
OWS – Open Geospatial Consortium Web Service
OWL – Web Ontology Language
SKOS – Simple Knowledge Organisation System
RDF – Resource Description Framework
SASDI – South African spatial data infrastructure
SLD – Styled Layer Descriptor
SOA – service oriented architecture
SPARQL – SPARQL Query Language for RDF
SPARQL Fed – SPARQL Federated
spatial2LOD – spatial database server extension to Linked Open Data Cloud (LOD)
TSV– tab separated values (TSV)
UDDI – Universal Discovery Description and Integration

xviii
W3C – World Wide Web Consortium
WCS – Web Coverage Service
WFS – Web Feature Service
WMS – Web Map Service
WSDL – Web Services Description Language
XML – eXstensible Markup Language

1
Chapter 1: Introduction
Background Information and Motivation 1.1
Geospatial information can be presented as thematic maps, which typically feature a single
distribution or relationship over a spatial background to help locate the distribution being
mapped (Tyner, 2010). With the advent of the internet, thematic maps that visualise and
communicate information about geographic phenomena are now widely published on the
Web. A growing demand for thematic maps (Durbha, King, Shah and Youman, 2009) exists
since the increase in the collection and availability of thematic data. In Geographic
Information Science (GIScience), development of a theme-specific information system
requires spatially represented thematic maps (Sagar, 2010). The growth in data has required
an increase in the need to better understand the phenomena associated with the data, therefore
requiring, new sources of information, and vigorous ability to integrate data (Janowicz et al.,
2013). The increasing volumes of available open data and the need to integrate these into
cartographic products over the web motivated this research.
Geographic data is defined as ―data with implicit or explicit reference to a location
relative to the Earth.‖ (ISO 19109: 2005). Strictly speaking, spatial data refers to any spatial
data, not only to data referenced to a location relative to the Earth, i.e. a three-dimensional
representation of a teapot is also spatial data. However, in scientific literature ‗geographic
data‘, ‗geospatial data‘ and ‗spatial data‘ are typically used interchangeably and this approach
is also adopted in this thesis. A web service is described by Papazoglou (2008, p8) as a self-
describing, self-contained software unit available through a network (the internet) and
capable of completing tasks, solving a problem or to perform a transaction for a user or
application. A geospatial web service is a specialised web service that can process spatial
data into geospatial information over the web (Shanming and Jianjing, 2008; Breitman,

2
Casanova, and Truszkowski, 2010). A geospatial web service can take advantage of the
statistical data available in the linked open data (LOD) cloud to create thematic maps.
Visualising the vast amounts of data available in the LOD cloud as thematic maps, offers a
powerful spatial analysis tool for planning and decision-making. This could be done by using
geospatial web services to integrate linked open data with geometry in a spatial database
server. In this thesis, a thematic map that is created by a geospatial web service is referred to
as a web thematic map.
Open data refers to data or content free to use, reuse, and redistribute (subject, at most, to
requirements that preserve provenance and openness (Open Knowledge, 2014). Increasingly,
Government supports open data with the aim to leverage the potential of publicly funded data
(UK Government Open Data, 2013; US Government Open Data, 2014; European
Environment Agency, 2014). For instance, the principles of linked data (Berners-Lee, 2006)
have been adopted by an increasing number of data providers and application developers
leading to the creation of the Web of data (Bizer et al., 2009). The Web of data also called the
linked open data (LOD) cloud contains enormous data as billions of Resource Description
Framework (RDF) triples. The LOD cloud is an example of such a Web of data available as
open data over the Web (W3C 2013f; Bizer et al., 2011).
The linked open data cloud is built on standards published by the World Wide Web
Consortium (W3C). Relevant standards for this research are:
The Resource Description Framework (RDF), an encoding for linked data (W3C
2014a, 2014b)
SPARQL (W3C 2013b, 2013c), a query language for linked data
SPARQL-Federated Query (W3C 2013a)
SPARQL Query Results XML (extensible markup language) format (W3C 2013d)
SPARQL Query Results CSV (comma separated values) and
TSV (tab separated values) formats (W3C 2013e)

3
GeoSPARQL (OGC GeoSPARQL 2012), an emerging standard for querying geospatial data
encoded in RDF, was not used because according to the needs the geometry is stored in non-
RDF format in an object-relational spatial database server. The LOD cloud creates an
opportunity for data consumers (Fensel, 2011; Curry et al., 2013) and the potential for
representing geo-information in a new and accessible form. Third-party applications are using
linked data to enrich or complement its contents (Vidal, Lama, Otero-García and Bugarín,
2014). Methods to display these attribute data over the web are in high demand (Speckmann
and Verbeek, 2010).
ISO/TC2111 Geographic Information/Geomatics (International Standards Organisation
(ISO) technical committee) and Open Geospatial Consortium (OGC2) set standards in
―Geographic information/Geomatics‖ (Kresse and Fadaie 2010; Coetzee 2011; Fan, M., Fan,
H., Chen N., Chen, Z., and Du, 2013). OGC web services standards are created for web
applications (OGC, 2013). They (OGC web services) are well specified and their
implementations can be tested for conformity (Janowicz et al., 2010). OGC developed many
standards for geospatial data exchange, intending to promote interoperability, using web
services (Sun et al., 2012). OGC web services accomplished a notable degree of
interoperability (Goodchild et al., 2012) and are used in the geospatial community. Two of
these standards are used in the implementations of the three integration styles presented in
this thesis. ISO/TC 211 and OGC published ISO 19128:2005, Web Map Server Interface
(WMS), a specification for a web service that dynamically produces maps from spatially
referenced data (ISO19128:2005). It describes a standard interface for requesting maps over
the Internet. The OGC‘s Styled Layer Descriptor (SLD) defines an encoding that extends the
WMS standard to allow user-defined symbolization and coloring of geographic features and
coverages (OGC Styled Layer Descriptor 2007).
1 ISO/TC211 Geoinformation/Geomatics. Available at: http://www.isotc211.org/ Accessed: 2013/01/23
2 Open Geospatial Consortium. Available at: http://www.opengeospatial.org/ogc/vision Accessed:
2013/01/23

4
This research explores using standard geospatial web services to combine geometry in a
spatial database with attribute data in the LOD cloud to produce thematic maps. For this
research standard technologies were used, motivated by the widespread deployment of
standardised web map services in the geospatial community and the widespread publication
of alphanumeric data (by statistical agencies) in the LOD cloud.
Spatial databases are efficient and reliable in performing spatial analysis. On the spatial
database side, ISO 19125-1:2004, Geographic information – Simple Feature access, Part 1:
Common architecture, jointly published by ISO and the OGC, applies to this research. The
standard describes the geometry object model for spatial data representation in spatial
databases (ISO 19125-1:2004). Support for complex geometric data (points, lines and
polygons) is well established. Much of the spatial data now in use are stored in spatial
databases. Data integration approaches make it possible to combine data from heterogeneous
sources into a unified (global) view. For example, the statistical data (attribute data) from the
LOD cloud can be joined with geometry in a spatial database to create thematic maps. This
research evaluated the various ways of combining linked data from the LOD cloud with
geometry in a spatial database to create thematic maps.
Several free and open source geospatial software products are freely available and the
source code can be customised or extended. Some of the proved benefits of open source
software include cost savings, vendor independence, and open standards (Holmes, Doyle, and
Wilson (2005; Von Hagen, 2007; Steiniger and Hunter, 2012). Free and open source
geospatial software is now maturing (Steiniger and Hunter, 2013). Due to these benefits, this
research sought to use free and open source geospatial software to evaluate how open source
geospatial software technology can also benefit from the LOD cloud.
A spatial data infrastructure (SDI) is an enabling platform for facilitating the sharing of
data among stakeholders. SDIs are widely used to share, discover, visualise and retrieve
geospatial data through OGC web services. The use of OGC web services to integrate linked
data from the LOD cloud with geometry in a spatial database server would advance SDI
research and developments. This operation will bring to the fore the challenges, requirements

5
and approaches for integrating the LOD cloud as part of an SDI. A current growing interest
aims at leveraging linked data to allow global access to spatial data held in SDIs (Abbas and
Ojo, 2013, 2014; Janowicz et al., 2010; Granell, Schade and Hobona, 2010). The maturing
and benefits of free and open source geospatial software will assist SDI initiatives in
developing countries (such as those in Africa).
1.2 Research Description
1.2.1 Problem Statement
The LOD cloud is increasingly populated with volumes of linked data. Spatial data
maintained in spatial database management systems are progressively being integrated with
enterprise information systems. Spatial databases are efficient and reliable in performing
spatial analysis. This research explores the use case where geometry is stored in a spatial
database and attribute data needs to be retrieved from the LOD cloud to create thematic maps.
For example; sensors across a country may be measuring phenomena such as
temperature, visibility, precipitation, pressure, wind speed, humidity and seismic activities.
The data from these sensors may published as alphanumeric linked data, including the name
of the location of each sensor, into the LOD cloud. Other statistics such as population, HIV
prevalence and economic indicators of a country may also be available as alphanumeric
linked data in the LOD cloud. Spatial data such as sensor location (name, northings, eastings
and height), land use, all levels of administrative boundaries, environmental and geological
may be stored in a spatial database. To create maps showing rainfall patterns, number of
sensors for each lowest-level administrative unit, population per environmental zone, natural
disaster risk areas, HIV prevalence per administrative unit would require the combination of
alphanumeric linked data from the LOD cloud with spatial data in the spatial database.
In cases such as in the example, OGC web services can be used to create web thematic
maps by combining the alphanumeric linked statistical (attribute) data available in the LOD
cloud, with spatial data in a spatial database to create thematic maps. In its current form
though, OGC web services cannot use linked data from the LOD cloud. It is a challenge to

6
use OGC web service to access linked data from the LOD cloud and combine it with existing
geometry in a spatial database server to create web thematic maps. The difficulty lies in the
fact that the LOD cloud is built on linked data technology using World Wide Web
Consortium (W3C) standards while OGC web services are built on OGC standards. For
example, linked data is published into the LOD cloud as RDF and can be queried using
SPARQL. These standards and OGC web services are heterogeneous for data models. Access
and data integration are still obstacles to creating web thematic maps by combining linked
data from the LOD cloud with existing geometry in a spatial database. One of the integration
challenges stems from the difference in heterogeneous data models.
In this regard, this research explores ways of creating thematic maps by combining linked
data from the LOD cloud with geometry stored in a spatial database server in an open source
environment.
Recently, there has been a hive of research activity in geospatial linked data (see Chapter
2, Section 2.12) aimed at creating maps from linked data sources. Research efforts focus on
representing geographical phenomena as linked data and producing maps from such linked
data. The geometry and attributes of a geographical phenomenon is represented in a single
(linked data) model (Hartig, Mühleisen and Freytag 2009, Stadler, Lehmann, Höffner and
Auer 2012). The work by T. Zhao, Zhang, Wei and Peng (2008) attempt to combine linked
data with geospatial data but dissimilar to this research, the flow of data is from the
geospatial data sources to the LOD cloud. In the research described in this dissertation, the
flow of data is from the LOD cloud to the geometry. Reports of efforts creating maps by
combining linked data with data from a spatial database are limited. This research aims to
contribute to the latter.
1.2.2 Goal of this Research
The purpose of this research is to investigate and evaluate various ways of creating web
thematic maps by combining attributes in the form of linked data from the LOD cloud with
geometry in a spatial database server. The goal is to evaluate this in an open data and open
source environment.

7
1.2.3 Research Objectives
The research objectives:
Review relevant literature and latest technologies:
o Assess the current knowledge and related work in thematic cartography,
ubiquitous cartography, standards based geospatial web services, linked data
technology, data integration approaches, spatial data infrastructures and open
source geospatial software.
o Critically evaluate newest technologies, tools and standards in an open data
and open source environment.
o Drawing on the literature review, identify the evaluation criteria
(requirements) for integration approaches that combine linked data from the
LOD with geometric data in a spatial database to produce thematic maps.
Design and implement different options of creating web thematic maps by integrating
alphanumeric linked data from the LOD cloud with geometry in a spatial database
server.
This will provide empirical evidence that can be used to compare and evaluate
the designs.
Evaluate the implementations and make recommendations for future work.
o Critically evaluate the implementations against the evaluation criteria
(requirements).
o Make recommendations for future work.
1.2.4 Limitations of the Research
This research applied to creating choropleth and proportional symbols map. The research did
not test the approach for all thematic maps. The aim was to illustrate how an OGC
conformant geospatial web service can be enabled to create thematic maps from linked data
and spatial data and not to improve on thematic mapping.

8
GeoSPARQL, an emerging and now de facto standard for geospatial RDF is not applied.
This was deliberate because the research approach focussed on an OGC conformant web
service that consumed primarily attribute data (non-spatial RDF). The attribute data were
combined with geometry stored in a spatial database server.
This research aimed at bridging the gap among various technologies, namely OGC and
linked data. On the contrary, it was not intended to create technology such as a semantic
WMS. Where new programmes (software) were written it was intended to indicate methods
by which linked data could be accessed and integrated with a geospatial web service. The
research approach sought to benefit human users more than it did software agents. The
processes for creating web thematic maps were not fully automated. The method used to
integrate LOD as attribute data to geometric features is a join operation, the success of which
depends in an overwhelming measure of the normalisation of a unique identifier data in both
datasets.
The evaluation framework in this research focussed on how thematic maps can be created
by combining linked data with spatial data in a spatial database. This does not include the
creation of a service or an application, and benchmarking was not required.
One of the ideas of geospatial semantic web research is to make spatial data available as
linked data in the web of data. Unlike geospatial semantic web research, this research
combines linked data from the LOD cloud with spatial data in a spatial database to create
thematic maps.
1.2.5 Significance of the Research
The research shows several ways that open source OGC conformant geospatial web service
can be used to create thematic maps by combining linked data from the LOD cloud with
geometry in a spatial database. This research demonstrates how ubiquitous cartography can
benefit from the freely available linked data in the LOD cloud. The research highlights ways
by that spatial data in spatial databases can be enriched with linked data from the LOD cloud.

9
In this respect, there is no need to convert the spatial data into a linked data form - a process
prone to errors and it is time-consuming.
The availability of linked data in vast quantities in the LOD cloud presents an opportunity
for data consumers. One of the characteristics of an ‗ideal‘ SDI is that geospatial data can be
integrated with many other kinds or sets of data to produce information useful for decision
makers and the public, when appropriate (Nebert, 2004). From the perspective of SDI, this
research brings forward some choices for integrating heterogeneous sources of data to create
useful information. OGC web service in this research makes it easier to transfer the
knowledge gained into SDIs development, since OGC technology are widely used in SDIs for
discovery, exchange and portrayal of geospatial data and information.
1.3 Scientific Background
The study cuts across the following disciplines: Cartography, Computer Science and
Geographic Information Science. This section presents the facets of this research that relates
to each discipline.
Figure 1: Scientific background to the research described in this study
Scientific Background
Combining linked data
and geometric data to
create thematic maps.
Cartography: thematic mapping and ubiquitous
cartography.

10
This research combines aspects of these three disciplines as shown in Figure 1.
1.3.1 Cartography
The discipline of cartography, applies art (design), science and technology to map-making to
design and realise these products (Cartwright, Gartner and Lehn, 2009). In Cartwright (2009),
science and technology is to provide cartography with the means for providing accurate maps
in a prompt and efficient manner. Thematic cartography is a branch of cartography that deals
with the production of thematic maps. Slocum, McMaster, Kessler, and Howard (2010)
showed that thematic cartography transformed into a true academic discipline during the
twentieth century. Thematic cartography, from its beginning in the eighteenth and nineteenth
centuries (MacEachren, 1979; Crampton, 2010) has exercised a significant influence on the
development and spreading of knowledge (MacEachren, 1979).
Ormeling (2011) in discussing Cartography and Geoinformation in the 20th and 21st
Centuries indicated that the digital generations have brought ubiquitous cartography in the
sense that spatial data can be accessed anywhere at any time. Ubiquitous cartography thrives
on the backbone of the internet, the World Wide Web and satellite systems. These
technologies are what makes it possible for spatial data to be accessed anywhere at any time.
This study falls into thematic cartography and ubiquitous cartography. Thematic cartography
is a key of the study in that the research sought to create web thematic, maps from linked
data.
Chapter 2 presented thematic cartography in Section 2.2 where thematic mapping
principles and techniques are discussed. In the same chapter, ubiquitous cartography is
highlighted (Section 2.3), about cartography and technological trends on the web. Ubiquitous
cartography has been presented in this research on the technological discourse in the
cartographic community from the late 1990s up to the 21st century and beyond. The
significant highlights of the discourse appear in topical issues like Internet cartography,
cybercartography and online cartography. In Chapter 3, thematic cartography performed a
key part in selecting tools suitable for setting up a geospatial web service dedicated to

11
producing thematic maps. In Chapter 4, the map communication model was used to derive
the requirements of a specialised geospatial web service that combines alphanumeric linked
data with geometry in a spatial database to create thematic maps. Choropleth and proportional
symbol maps are examples of thematic maps created with the implementations of the
specialised geospatial web service in Chapter 5.
1.3.2 Geographic Information Science
Geographic Information Science (GIScience) deals with the science underlying the computer
system for capturing, storing, querying, analysing and displaying geographically referenced
(geospatial) data. In the foreseeable future, GIScience will likely continue to play critical
roles in many fields (ecology, emergency management, environmental engineering and
sciences, geography and spatial sciences, geosciences, and social sciences) for solving
scientific problems and improving decision-making practices (Wang et al., 2013). Web
mapping, data integration, SDI and open source geospatial technology are areas of research in
GIScience relating to this study.
According to Alam, Khan and Thuraisingham (2011), the integration of data in a
geographic domain is useful in many areas such as business, academic, homeland security
and public awareness. This research relates to the integration of data in the geographic
domain and shows how linked data can be combined with geometric data to create new
geographic information. Data integration of is made possible after data from diverse sources
are integrated with a common platform. In this respect, this research throws light on
integrating linked data into a spatial database environment before it is combined with
geometric data. Section 2.7 and Section 2.8 of Chapter 2 presents current knowledge and
gaps on integrating linked data into (spatial) databases. The conceptualisation, requirements
formulation and design options, of a specialised geospatial web service that combines linked
data with geospatial data to create thematic maps is presented in Chapter 4. It has the topic of
integration embedded in them. Each design choice presented in Chapter 5 has its own
integrator implemented, showing the various approaches for integrating linked data from the
LOD cloud into a spatial database server.

12
In producing thematic maps over the Web, T. Auer, MacEachren, McCabe, Pezanowski
and Stryker (2011) hints that the next generation of web mapping tools will need unique
solutions to navigating, querying, displaying, and interpreting millions of data points in time
and space. The importance is stressed that, web mapping tools be adapted to produce thematic
maps associated with these large volumes of data. In this research, aspects of GIScience
relating to web mapping are presented in Section 2.5 of Chapter 2 where standards based
geospatial web services are covered. Generic architecture of geospatial web services are
discussed with open source web mapping tools needed to create a web mapping component
of a specialised geospatial web service. This combines linked data with geometry in Chapter
4, Section 4.2. In Chapter 4, the geospatial web service is presented. This is because the
understanding of the concepts and models upon that geospatial web services are developed is
required in analysing, designing, implementing and evaluating the specialised geospatial web
service.
Geospatial data the core of GIScience research was explored in the conceptualisation,
evaluation of technology, design options and implementations of the specialised geospatial
web service as discussed in Chapters 3, 4 and 5. Each stage of the research was presented to
prove enhancing a geospatial web service to create thematic maps by combining linked data
from the LOD cloud with existing geometry stored in a spatial database server. GIScience
performed a critical part in finding answers and solutions to the research question and
problem posed in this research.
SDI is a key area of GIScience research. In recent times, from the technologies available,
increasing volumes of diverse data needs to be integrated with SDIs. Linked data from the
LOD cloud is among those diverse data that need to be integrated with SDIs. This research
sheds light in this respect, proving integrated linked data into SDIs through geospatial data in
a spatial database. The research described in this study shows the potential benefits of using
open source software in integrating linked data with geospatial data. SDI has been presented
in Chapter 2, Section 2.10. In the same chapter, open source geospatial technology has been
presented in Section 2.9 and Section 2.10. The entire Chapter 3 has been dedicated to
evaluation of open source geospatial technology suitable for creating the specialised

13
geospatial web service. The various implementations of the web mapping part of the
specialised geospatial web service presented in Chapter 5 used open source geospatial
software.
1.3.3 Computer Science
The following aspects of this study fall under the discipline of Computer Science: linked data
technology, database and web services. Breitman et al., (2010), published as part of the
NASA Monographs in Systems and Software Engineering series indicates that as the volume
of web resources increases rapidly, researchers from industry, government and academia
were exploring the possibility of creating a semantic web in that meaning, is made explicit.
The authors call the Semantic Web, the Web of the future. The Semantic Web is one of the
current research areas in computer science.
Hendler (2011) described the ―linked data‖ and ontology communities as two
communities involved in Semantic Web research. The former focuses more on the scaling
and web application used semantic technologies while the latter is interested in expressive
ontologies. This study categorise into the “linked data” community since it focusses on the
retrieval of linked data (RDF) from the LOD cloud and has much less to do with ontology.
Many open, distributed, and structured semantic data available on the web has no precedent
in the history of computer science (Lopez, Ungerb, Cimiano and Motta, 2013).
The web will continue to be a predominant area for semantic and interoperability, but a
linked data movement will need further research on integrating existing data sources
(Halshofer and Neuhold, 2011). This study contributes in furthering the research on how non-
semantic web applications can integrate linked data from the LOD cloud with (non-linked)
geometric data. In this research, linked data from the LOD cloud is considered a by-product
of the semantic web (Keivanloo and Rilling, 2014).
In this study, the linked data are presented in Chapter 2 with discussions on the LOD
cloud and how linked data are represented, accessed, queried and integrated with an (object-)
relational database. Chapter 4 introduces the specialised geospatial web service with the view

14
of showing an approach by that geospatial web services can be enhanced to use the LOD
cloud to create web thematic maps from linked data. Chapter 5, Chapter 6 and Chapter 7
further discuss several aspects of linked data on the specialised geospatial web service.
This research relates to other Computer Science (research areas) such as web services,
service oriented architecture (SOA) and data integration. Web services and SOA upon that
geospatial web services, which are presented in Chapter 2. Data integration concepts are
applied in linked data integration into (spatial) database and (object-) relational database to
RDF mapping as presented in Sections 2.7 and 2.8. Web services, service oriented
architecture (SOA) and data integration are applied throughout the conceptualisation, design
and implementations as presented in Chapters 3,4,5,6 and 7.
This study has a significant part of its foundation in Computer Science in linked data
technology, databases, web services and SOA.
1.4 Research Approach
This section presented the research approach used in this study.
The research approach starts with describing the conceptualisation of a geospatial web
service dedicated to producing web thematic maps from alphanumeric linked data and
geometry. The remaining sub-sections present the other stages in the research approach used
in finding answers to the research question, in achieving the research objectives and in
finding solution to the research problem.
1.4.1 Conceptualising Geospatial Thematic Web Service
After reviewing the state-of-the-art concepts and technologies in the topics of this research, a
specialisation of an OGC WMS that creates web thematic maps by integrating alphanumeric
linked data from the LOD cloud with geometry in a spatial database server is conceptualised.
In this ‗research the term ‗geospatial thematic web service‘ (GTWS) is used for a specialized
web service (an OGC WMS) that creates web thematic maps by combining linked data with
geospatial data to create thematic maps. The LOD cloud is regarded as ‗just another‘ attribute

15
data source. GTWS is used as a model to display methods that an open source geospatial web
service could create web thematic maps from heterogeneous sources such as data (attribute
data) from the LOD cloud together with geometry stored in a spatial database server. The
idea indicated that a geospatial web service (an OGC conformant web service) could create
and visualise geoinformation from linked data in the LOD cloud and geometry in a spatial
database. The conceptualisation is proven on the principle that: linked data technology can be
integrated with negligible interference to existing information infrastructure, as a
complementary technology for data sharing, and was not considered as a replacement for
current Information Technology (IT) infrastructure (O‘Donnell, Corry, Hasan, Keane and
Curry, 2013). The conceptualisation is discussed further in section 4.2 of Chapter 4.
1.4.2 Critical Evaluation of Technology, Tools and Standards
In this sub-section, the second procedure in the research approach is discussed. This
procedure involved the design and implementation of an experiment used to evaluate three
state-of-the-art open source web map servers for its suitability in setting up a GTWS. The
three web map servers were evaluated against nine different criteria. The web map server that
showed superiority in most criteria was chosen for implementing the prototype. Besides the
experiments, literature was reviewed to choose other state-of-the-art tools required in setting
up a web mapping component of a GTWS. The entire evaluation procedure and the results
are presented in Chapter 3.
1.4.3 Identify Requirements and Design Options
In this section, the third procedure in the research approach is presented. This procedure
involved the identifying requirements and creating of three, various design options of
integrating alphanumeric linked data with geometry in a spatial database server. The
requirements were identified from the literature review. Established on the evaluation
discussed in sub-section 1.5.2, requirements identified and business process flow modelling,
an OGC WMS based geospatial web service was designed consisting primarily of a client, a
web map server and a spatial database server. Each design option integrates linked data from

16
the LOD cloud into the geospatial web service environment differently. The designs enabled
non-spatial linked data to be accessed from the LOD cloud and integrated with geometry in a
spatial database server. An integration mechanism loaded the non-spatial linked data into the
web mapping component which creates the thematic map. Styling was applied using OGC
SLD. Based on a client's request; thematic maps were created and presented by the WMS to
the client. Chapter 4 discusses three design options for integrating linked data with geometry
in a spatial database server.
1.4.4 Implementations
In this section, the fourth procedure in the research approach is presented. This procedure
involved implementing the three design options options for integrating linked data with
geometry in a spatial database server. The tools used in the implementation were established
on the evaluation procedure in sub-section 1.5.2. These implementations are presented in
Chapter 5. The results are discussed in Chapter 6.
1.4.5 Results and Evaluations
In this section, the fifth procedure in the research approach is presented. With this procedure
the design options were analysed and the three implementations evaluated against the
requirements and other work. The analysis and evaluations are discussed in Chapters 6 and 7.
1.5 Brief Overview of Chapters and its Contributions
This section describes the remaining chapters in this thesis.
Chapter 2-This chapter gives an overview of the state-of-the-art in scientific background and
related work and illustrate how they relate to the research from the disciplines of
Cartography, GIScience and Computer Science respectively. The following topics are
presented:
Thematic cartography
Ubiquitous cartography

17
Standards based geospatial web services
Linked data technology, spatial data infrastructure
Open source geospatial software
The objective of this chapter is to assess the current knowledge and related work in the
following:
Thematic cartography
Ubiquitous cartography
Standards based geospatial web services
Linked data technology, spatial data infrastructures
Open source geospatial software
This chapter evaluates the challenges in creating web thematic maps from linked data. In
addition to the challenges, this chapter highlights the gap between linked data and the
following topics: geospatial web services, web based thematic mapping, open source
geospatial software and SDIs.
Chapter 3- This chapter comprises the results of an experiment published as a refereed paper
in the proceedings of Geoinformation Society of South Africa (GISSA) Ukubuzana
Conference 2012 (Owusu-Banahene and Coetzee, 2012). The objective of this chapter
critically evaluated state-of-the-art technologies, tools and standards that will be suitable for
developing a GTWS in an open source environment. The qualitative comparison of
MapServer, GeoServer and QGIS Server under default settings to ascertain its suitability for
creating web based thematic maps using OGC web standards is presented. This chapter
shows a procedure used in selecting one of the state-of-the art open source web map servers,
needed to set up a GTWS. The procedure led to the choice of an open source spatial database
server. This chapter advances the course of selecting open source geospatial software and
further shows its use in setting up a geospatial web service.

18
Chapter 4- Chapter 4 presents the design choices of GTWS. Parts of this chapter consist of
papers published as conference proceedings from the 26th International Cartographic
Conference, 2013 (Owusu-Banahene and Coetzee, 2013) and one submitted to a journal
(Owusu-Banahene and Coetzee, 2014). Here the objectives are 1) to identify the requirements
established on literature; and 2) explore various options for geospatial web services to access
linked data from the LOD cloud, integrate it with geometry stored in a spatial database
server, and produce web thematic maps. Four different options each of that can integrate
linked data from the LOD cloud with existing geospatial data to create web thematic maps.
Unique identifiers were introduced to simplify the discussion on the various design choices
and its implementations, namely: GTWS-1, GTWS-2, and GTWS-3.
Chapter 5- In this chapter, implementations of GTWS-1, GTWS-2 and GTWS-3 are
presented. Parts of this chapter comprise a papers submitted to the 26th International
Cartographic Conference, 2013 (Owusu-Banahene and Coetzee, 2013) and one submitted to a
journal (Owusu-Banahene and Coetzee, 2014). This chapter aims to offer solid experiences of
implementation with each design.
Chapter 6- Established on the implementations of Chapter 5, this chapter discusss the results
and a critical assessment of GTWS about the results and contributions to scientific research.
Analysis of the implementations of design options is discussed. The design options and
implementations are evaluated against the requirements. A critical assessment of the GTWS
approach is discussed compared with other related work.
Chapter 7- This chapter explores the research described in this research to confirm that the
objectives were accomplished. This chapter represents findings and contributions to scientific
research and recommendations for future research.
Appendices – This appendices B presents the list of publications resulting from this research.
Appendix C shows other publications resulting from other related research projects embarked
upon during this PhD study.

19
Chapter 2: State-of-The-Art
Introduction 2.1
This chapter gives an overview of current knowledge in the application area and in the
various technologies used in the research described in this study. The overview constitutes a
literature survey of the scientific background and related work relevant to this research. The
following are presented: thematic cartography, ubiquitous cartography, standards based
geospatial web services, linked data, spatial data infrastructures, data integration and open
source geospatial software. These areas constitute the aspects of this research from the
scientific disciplines of Cartography, GIScience and Computer Science.
The context of this research of work by others in the various topics of this research is
presented in this chapter. This chapter highlights the knowledge gaps between existing
models (standard based services, open source geospatial software, cartography and spatial
data infrastructure) and linked data that support the need for the research presented in this
study. This chapter forms the basis of identifying the evaluation criteria (requirements) for
integration approaches that combine linked data from the LOD with geometric data in a
spatial database to produce thematic maps. Requirements are presented in Section 4.3 of
Chapter 4.
2.2 Cartography
2.2.1 Thematic Cartography
Cartography is the art and science concerned with the design, production and the using of
maps (Cartwright et al., 2009). The design and production of thematic maps fall under the
branch of cartography known as thematic cartography. Thematic maps typically feature a

20
single distribution or relationship over a spatial background to help locate the distribution
being mapped (Tyner, 2010). Slocum et al. (2010) distinguish between general-purpose maps
among maps used to specify the location of spatial phenomena and thematic maps that
emphasise one or more geographic attributes.
Figure 2 is an example of a thematic map showing dominant source of water being used
by households in a district municipality in South Africa in 2001. The attribute in this case is
dominant source of water. Thematic maps constitute a map overlaid with some thematic
information. Tyner (2010) summarises the fundamental purposes of thematic maps as:
To provide specific information about what and how much of something is present in a
particular location
Map information about spatial patterns and to compare the spatial order and organisation
To present findings to an audience.
Figure 2: A thematic map showing the dominant source of water being used by
households in a district municipality, 2001 (Source: Statistics South Africa3).
3 http://mapserver2.statssa.gov.za/geographywebsite/index.html

21
The design and production of thematic maps require understanding map communication
(using map communication models), visualisation techniques, statistical data analysis, graphs,
cartographic principles (rules) and some mapping techniques. This section highlights the
cartographic principles and techniques required to produce thematic maps.
The following represents a summary of principles of cartography incorporated into the
design and production of thematic maps as selected from Slocum et al (2010).
Data classification involves combining raw data into groups or classes. A unique symbol
depicts each class or group. Some methods used in classifying data are quantiles, equal
intervals, mean-standard deviation, maximum breaks, natural breaks and optimal.
Cartographers use the optimal.
Normalisation involves adjusting raw data for differing sizes of enumeration units. This
mapping technique is appropriate when values of a phenomenon changes rapidly at
boundaries of enumeration unit.
Symbolisation deals with selecting an appropriate thematic mapping technique. This
section discusses the common thematic mapping techniques. The principles used in
selecting a particular technique include (but not limited to) considering the nature of
geographic phenomena (for example; points, lines, areas and volumes) the levels at which
the geographic phenomena can be measured (nominal, ordinal, interval and ratio) and the
types of symbols that can be used to represent the spatial data (for example; visual
variables).
Scale and generalisation-scale specifies the representative fraction map units to Earth
unit. The process of generalisation involves reducing the amount of information displayed
on a map. Factors that affect generalisation include scale change, map purpose, intended
audience and technical constraints.
Map projections are used to project the earth (spherical) onto a flat surface (map).
Knowledge of the earth‘s coordinate system is fundamental to appreciating map
projections. Classes of projections include cylindrical, conic and planar. Though a class
of projection is constructed, distortion is unavoidable. Some projections minimise

22
distortion in areal, angular, distance and direction and are called equivalent, conformal,
equidistant and azimuthal projections. In the past projection transformation was a
challenging task, but with computers this task has been trivialised.
Proper use of colour involves understanding how to specify appropriate colours relevant
to the map to be produced. Graphic display and choice of colour models (RGB, CMYK,
Munsell, HVC and CIE) are also considered under the principle of colour.
Cartographic design-This is a process used by a cartographer to conceptualise and create
maps according to the needs of intended map user. The principles of map elements and
typography are considered a part of the design principles.
Besides these cartographic principles, there are techniques for displaying thematic maps.
Some mapping techniques are choropleth, proportional symbol, dot, isarithmic, dasymetric,
multivariate, cartograms and flow maps. The research presented in this research incorporates
the principles in the analysis of requirements, the designs and implementations of the various
GTWS in creating web thematic maps from linked data. The results of the implementations
of all the GTWS applied choropleth mapping and proportional symbol mapping techniques.
Here is an overview of choropleth and proportional symbol mapping techniques.
i. Choropleth mapping a technique by that the density or degree of a feature is mapped
in enumeration units such as census blocks, census tracts, counties, states, or
countries (Crampton, 2010). Data for enumeration units are grouped into classes and
either a colour or a gray tone is assigned to each class. In constructing choropleth
maps, normalisation is important. A choropleth map showing agricultural
production (1999-2001) is shown in Figure 3.
ii. Proportional symbol mapping is used to create proportional symbol maps with
symbols scaled in proportion to the magnitude of data arising from a particular point
(true or conceptual) location. The magnitude values can be categorized into a
number of classes, each represented by a symbol at a different scale. This technique
uses raw data. Figure 4 is a proportional symbol map showing transport sector
gasoline fuel consumption of countries.

23
Figure 3: A choropleth map showing agricultural production (1999-2001) of countries
(created with Indiemapper4).
Figure 4: A proportional symbol map showing transport sector gasoline fuel consumption of
countries (created with Indiemapper).
4 Indiemapper: http://indiemapper.com

24
2.2.2 Ubiquitous Cartography
Ormeling (2011) in discussing Cartography and Geoinformation in the twentieth and 21st
Centuries showed that the digital generations have brought ubiquitous cartography in the
sense that spatial data can be accessed anywhere at any time. Ubiquitous cartography thrives
on the backbone of the web and satellite systems since these technologies are what makes it
possible for spatial data to be accessed anywhere at any time. Around the late twentieth
century and beginning of the twenty first century, technological improvements in internet and
web technologies introduced new discourse and concepts in cartography.
Cybercartography was introduced in 1997 in a keynote address presented at the
International Cartographic Conference in Sweden (Taylor, 2005). Kraak (2001a), defined
Web cartography as the design, production and using maps restricted to the medium of
WWW and further stated in Kraak (2001b) that Web cartography is a trend in cartography.
Designing maps for the internet and the web, required adjustment among cartographers, even
the experienced ones.
In 2003, Richmond et al. (2003) also comments about Internet cartography and further
explores Internet maps and its use in web-based tourism destination marketing. Krygier
(2003) also explores map education in a world of WWW and reveals that most students
involved in the literacy education found thematic mapping (choropleth maps of census data)
to be much interesting. Herzog (2003) observed that thematic cartography could use the
potential of the web to communicate spatial information to a larger audience and concluded
that there are many areas where thematic mapping could be applied on the Web. I. Zaslavsky
(2003) also introduces Online Cartography and comments that internet cartography has much
to do with advances in distributed computing and that with cartographic ontology pages
added to the web, one could address many problems of online map creation such as
intelligent styling of map elements.
In 2003, Herzog observed that thematic cartography could use the potential of the web to
communicate spatial information to a larger audience and concluded that there are many
possible applications of thematic mapping to the context of Web. In 2005, Taylor viewed

25
cybercartography as cartography‘s contribution to the knowledge-based economy (Taylor,
2005). Eddy et al. (2005) concluded that the aim of cybercartography is to provide better
information about the real world and is enhanced and challenged by emerging cyber
technologies. Peterson (2005), in looking at the web and computers and the role they play in
the interactivity and distribution of maps, remarked that depending on the complexity, spatial
patterns on thematic maps can be comprehended in an even shorter time.
Web-based services generate a large quantity of maps and this is expected to increase is
expected (Stigmar and Harrie, 2011). An increasing number of map users, experts and non-
experts rely on the internet to access cartographic products (de Mendonça and Delazari
(2012). Web maps are becoming the de facto medium for distributing information because a
wide audience takes part through a website (Field, 2012).
To conclude this section it is important to look at another concern Ormeling raised in his
conversation (Ormeling, 2011). He predicted that one of the vital concerns for the next 20
years has to do with designing cartographic products for new platforms. Statistical data
associated with geographic regions is nowadays globally available in large amounts and thus
methods to display these data visually are in high demand (Speckmann and Verbeek, 2010).
The research described in this thesis takes advantage of statistical data for geographic
regions (countries) freely available in the linked open data cloud. Studying recent trends of
technology such as web services and linked data, this brings to the fore the theoretical and
implementation concerns of cartography and thematic cartography as far as web services and
the semantic web or Web of data is concerned. This study aimed at contributing to new
knowledge around creating cartographic models (thematic maps) from linked data models.

26
2.3 Standard Based Geospatial Web Services
2.3.1 Web Services
The World Wide Web Consortium (W3C5) is an international community where Web
standards are developed. W3C introduces Web of services as referring to message-based
design established on technologies such as HTTP (Hypertext Transfer Protocol), XML
(extensible Markup Language), (Universal Discovery Description and Integration) (OASIS,
2004), WSDL (Web Services Description Language) (W3C, 2007a), and SOAP (Simple
Object Access Protocol) (W3C, 2007b). Booth et al. (2004) define a web service:
―as a software system designed to support interoperable machine-to-machine interaction
over a network. It has an interface described in a machine-process able format
(specifically WSDL). Other systems interact with the Web service in a manner prescribed
by its description using SOAP messages, typically conveyed using HTTP with an XML
serialization in conjunction with other Web-related standards”.
Banerjee et al. (2004) describes three basic parts to a Web services interaction as
discovery and configuration, the request and the optional response as shown in Figure 5.
UDDI defines a set of services supporting the description and discovery of Web services
providers, the Web services they make available, and the technical interfaces which may be
used to access those services (OASIS, 2004). WSDL provides a model and an XML format
for describing Web services. With the help of WSDL the description of an abstract
functionality offered by a service are separated from concrete details of a service description
(W3C, 2007a). SOAP is an XML based lightweight protocol aimed at exchanging structured
information in a decentralized, distributed environment (W3C, 2007b).
Discovery of Web services can be done for example; through WSDL files or through an
UDDI registry or other automated mechanism. The request is formulated by SOAP using the
WSDL to create and populate the message body. This is channelled through HTTP, (but not
5 W3C: http://www.w3.org/standards/

27
always) to the URL in the WSDL. The response is formulated as SOAP message by the
provider agent. The requester agent receives the response and decodes it.
Figure 5: Anatomy of a web service interaction. Purple arrows are the discovery, the blue
arrows are the request, and the red arrows are the response. (Banerjee et al., 2004)
The key to web services is Service-Oriented Architecture (SOA) (Papazoglou, 2008,
p22). SOA is built on the notion of three operations-publish (publication of service
descriptions), find-(finding the service descriptions) and bind (binding or invocation of
services) (Papazoglou, 2008, p23). SOA is realised through web services (Lund, Eggen,
Hadzic, Hafsoe, and Johnsen, 2007; Akıncı, Sesli, and Doğan, 2012). SOA has matured in
recent years and provides an interoperable computing infrastructure for conducting advanced
distributed geoprocessing tasks (P. Zhao, Foerster and Yue, 2012). The increasing adoption
of the (SOA) paradigm enables a scalable Web (C. Yang, Di and Chen, 2012).

28
2.3.2 Geospatial Web Services
Geospatial web services are web services that process geospatial data (Breitman et al., 2010).
(Crampton, 2009; Fritz et al., 2012; Schmidt and Weiser, 2012; Caquard, 2013). A web map
server is the imperative part of a geospatial web service that fulfils spatial queries, conducts
spatial analysis and creates and delivers maps to a client grounded on a user‘s request (Peng
and Tsou, 2003). A web map server provides support for web services (Steiniger and Hunter,
2012).
Standards allow thousands of applications, vendor solutions, and technologies to be
interoperable (OGC, 2011). Standardisation of interfaces to access geographic web services is
the door opened to share information among several systems by various producers in an
interoperable way (Scianna, 2013). Geospatial web services comply with well-established
standards to provide seamless integration with geospatial applications (Maué, Michels and
Roth, 2012). Walker Johnson et al. (2011), highlight that interoperability is exploited through
adopting best practices, using open standards and the use of spatial data infrastructure (SDI).
The standardisation of web services interfaces enable easy distribution, integration and
interoperable access to a wealth of geospatial resources (Granell, Fernández and Díaz , 2014).
A need existed to identify specific standards to set up GTWS, that can create web-based
thematic maps.
2.3.3 Geospatial Web Services Standards
The ISO/TC211 Geographic Information/Geomatics, develops standards for information
about objects or phenomena directly or indirectly associated with a location relative to the
earth (Kresse and Fadaie 2010; Coetzee 2011) and develops the ISO 19100 series of
geographic information standards. OGC is a consortium comprising about 474 members as
part of its mission develops international standards for geospatial interoperability.
OGC has published several standards that promote syntactic interoperability through
using web services (OGC, 2011; Díaz, Bröring, McInerney, Libertá and Foerster, 2013).
OGC standards are technical documents that detail interfaces or encodings and OGC Web

29
Services (OWSs) are those OGC standards created purposely for World Wide Web
applications (OGC, 2014a). OWSs follow the publish-find-bind paradigm in the SOA and
defines discovery, description, and binding layers (Yue, Di, Wei and Han, 2013)
corresponding to the W3C architecture. OGC has published some OWS including WMS,
Web Feature Service (WFS) and Web Coverage Service (WCS). These standards provide
means to query, access, communicate, deliver, portray and process geospatial data over the
Web in an interoperable manner (Han, Z. Yang, Di and Mueller, 2012; Tian and Huang,
2012; Castronova, Goodall and Elag, 2013). Among the OGC standards, WMS, WFS and
WCS are most popular and being used globally (Tian and Huang, 2012). Review of WMS,
WFS and WCS follows.
WMS: WMS is a service that produces maps of spatially referenced data dynamically
from geographic information (de la Beaujardierre, 2006). The maps generated by WMS are
mostly rendered as Portable Network Graphics (PNG), Graphics Interchange Format (GIF),
Joint Photographics Expert Group (JPEG) and sometimes as Scalable Vector Graphics (SVG)
or Web Computer Graphics Metafile (WebCGM) formats. A WMS defines three operations
GetCapabilities, GetMap and an optional GetFeatureInfo (Peng and Tsou, 2003; de la
Beaujardierre, 2006). GetCapabilities operations returns service-level metadata; GetMap
returns a map whose geographic and dimensional parameters are well-defined; and
GetFeatureInfo operation that returns information about particular features shown on a map.
WMS is jointly published by ISO and OGC as ISO 19128:2005, Web Map Server interface
and OpenGIS Web Map Service (WMS) Implementation Specification (ISO, 2005).
WFS: Vretanos, (2010) defines the WFS specification as specifying the behaviour of a
service that provides transactions on and access to geographic features: independent of the
underlying data store. It specifies discovery operations, query operations, locking operations,
transaction operations and operations to manage stored parameterised query expressions.
WCS: Baumann, (2010), defines WCS as a standard interface and operations that enables
interoperable access to geospatial "coverages". It supports electronic retrieval of geospatial

30
data as "coverages" – that is, digital geospatial information representing space or time-
varying phenomena.
Lopez-Pellicer, Renterı´a-Agualimpia, Be´jar, Muro-Medrano and Zarazaga-Soria (2011)
developed a focused crawler to find available OGC Web services in March 2011. The results
showed that most (4305(46.1%) out of 9329) OGC web services found were WMS from
Figure 6. OGC implementation statistics (OGC, 2014b) now shows that WMS is the most
widely implemented standard among geospatial software products.
Figure 6: OGC Web service instances classified by specification (Source: Lopez-Pellicer et
al., 2011).
To support styling of data sets for display OGC further the Symbology Encoding (SE)
Implementation Specification. This specification can portray the output of Web Map Servers,
Web Feature Servers and Web Coverage Servers (Müller et al., 2006). SE defines an
eXtensible Markup Language (XML) encoding that can be used for styling feature and
coverage data. There is an OGC standard called Style Layer Descriptor profile of WMS that
defines the operation, called DescribeLayer that fulfils the need to style features of data
differently depending on some attribute (Lupp, 2007). This operation returns the feature the
several levels specified in the request, and the attributes can be discovered with the

31
DescribeFeatureType operation of a WFS interface or the DescribeCoverageType of a WCS
interface. SLD defines how Symbology Encoding can be used together with WMS by
describing styling using a user-defined XML encoding of a map‘s appearance (Lupp, 2007).
OGC OWS were developed to integrate geospatial data and services with web-based
distributed applications (Evangelidis, Ntouros, Makridis and Papatheodorou, 2014). OGC
services cannot be directly connected to the Linked Data cloud (Janowicz, 2012). The
research described in this research uses OGC WMS and SLD compliant services. WMS was
used atop a web map server to create and visualise the maps. SLD files generated the required
style depending on the attributes of the data to form thematic maps.
2.4 Linked Data
2.4.3 Principles of Linked Data
Berners-Lee (2006) outlines the four architectural principles of linked data as:
1. Use URIs as names for things.
2. Use HTTP URIs so that people can look up those names.
3. When someone looks up a URI, provide useful information, using the standards (RDF,
SPARQL).
4. Include links to other URIs, so that they can discover more things.
The principles of linked data (Berners-Lee, 2006) refer to some recommended guidelines
and best practices examples Adida, Birbeck, McCarron and Herman (2013); Archer, Smith
and Perego (2009); Berruetta and Phipps (2008) and Connolly (2007) for exposing, sharing,
and connecting RDF data by dereferenceable URIs in the Semantic Web (Bizer, Heath,
Idehen and Berners-Lee, 2008). Linked data are further empowered by technologies such as
RDF (Manola and Miller, 2004), SPARQL (Steve and Seaborne, 2013), OWL Web Ontology
Language (OWL) (McGuinness and van Harmelen, 2004), OWL2 (W3C OWL Working
Group, 2012), and Simple Knowledge Organisation System (SKOS) (Miles and Bechhofer,

32
2009). OWL is used to build vocabularies or ―ontologies‖ and SKOS is used for designing
knowledge organisation systems. This makes it possible to enrich data with additional
meaning, which allows more people (and more machines) to do more with the data.
Linked data technologies use these standards established by the W3C aiming at
information integration (König, Dirnbeket and Stankovski, 2013). The primary objective of
linked data is on publishing structured data as RDF using URIs to focus on ontological
representations or implication (Keivanloo and Rilling, 2014). The motivation to implement
linked data spaces is the RDF technology (Galiotou and Fragkou, 2013). Third-party
applications are just starting to use linked data to enrich or complement its own contents
(Vidal, Lama, Otero-García and Bugarín, 2014).
In this study, RDF and SPARQL are used for the designs and implementations of
GTWSs. The GTWSs in its current forms do not use OWL and SKOS. GTWSs use neither
ontologies nor designing of knowledge organisation systems. GTWSs are consumers of
linked data.
2.4.4 Linked Open Data (LOD) Cloud
These best practices have been adopted by an increasing number of data providers, thus
significantly increasing the amount of linked data published (Colomo-Palacios, Stantchev and
Rodríguez-González, 2014). After the first discussions of the linked data approach, the
amount of linked data published has been increasing rapidly (Bechhofer et al., 2013) leading
to create a global data space containing billions of assertions - the Web of Data (Bizer, Heath
and Berners-Lee, 2009). The emerging Web of Data means easier access to data for
consumers (Curry et al., 2013).
Efforts by the Linking Open Data community project aimed at making open interlinked
datasets available on the web have resulted creating the LOD cloud. The most visible
application of the linked data principles is the LOD project (Pohorec, Zorman and Kokol,
2013; Dobbins, Merabti, Fergus, Llewellyn-Jones and Bouhafs, 2013). The LOD cloud
diagram by Schmachtenberg, Bizer, and Paulheim (2014) is shown in Figure 7. The nodes are

33
the linked datasets and the arrows show interlinks to other datasets in the cloud. One of the
main challenging issues is developing applications established on the Web of Data (Heath,
2008; Heath and Bizer, 2011; Hausenblas, 2009, 2011).
Figure 7: LOD Cloud diagram (Source: Schmachtenberg, Bizer, and Paulheim, 2014)
The Web of data also known as the LOD cloud (H. Chen, Yu and J. Chen, 2013;
Ballatore, Bertolotto and Wilson, 2013), enhances available attributes as open interlinked
datasets. With the LOD cloud, new applications arise, attempting to use information from
various data sources (Apanovich and Marchuk, 2013). Linked data (geospatial and non-
geospatial) has become one of the new research trends in recent years (Wiegand, Kolas and
Berg-Cross, 2010; Janowicz, 2012).

34
2.4.5 Statistics on the Linked Open Data Cloud
Data sets in the LOD cloud are classified into the following topical domains: geographic,
government, media, libraries, life science, retail and commerce, user-generated content, and
cross-domain data sets (Heath and Bizer, 2011). Table 1 summarises the number of triples
and the amount of RDF links per domain. In September 2011, the LOD cloud contained more
than 31 billion RDF triples and around 504 million cross-data set RDF links (Bizer et al.,
2011) in Table 1.
Table 1: Overview of the number of triples and the amount of RDF links per domain as at
September 2011 (Source: Bizer et al., 2011)
Comprehensive Knowledge Archiving Network (CKAN, ―The Data Hub6‖) is an open
source data management system, used by government and organisations around the world, to
provide tools for publishing, distributing, finding and using data (Open Knowledge
Foundation, 2014). This is written and maintained by Open Knowledge7, a worldwide non-
profit network of people passionate about openness.
LODStats (see http://stats.lod2.eu/) is a statement-stream-based approach for gathering
comprehensive statistics about RDF datasets (S. Auer, Demter, Martin and Lehmann, 2012).
One rationale fordeveloping LODStats is the computation of statistics for resources from the
CKAN (―Data Hub"). Ermilov, Martin, Lehmann, and Auer, (2013) presented a web
6 http://datahub.io/about
7 http://okfn.org/about/

35
application proven on LODStats for collection and exploration of the Linked Open Data
statistics. Ermilov et al. (2013) evaluated every dataset available by CKAN in one format
LODStats can handle (i.e. N-Triples, RDF/XML, Turtle, N-Quads, N3). The results of its
results in Table 2 show that in May 2013 the Web of Data contained 2289 linked datasets and
11 Billion triples. In February 2014, the LODStats website8 shows that the Web of Data
contains more than 61 Billion triples.
Table 2: Aggregated LODStats results at various points in time (Source: Ermilov et al., 2013)
The LOD cloud presents an opportunity for data consumers. The design options and their
implementation choices presented in this thesis make it possible for free and open source
geospatial software to connect to the LOD cloud to consume linked data.
2.4.6 Representing Linked Data
Information about resources on the Web is represented in RDF (Breitman et al., 2010, Fensel,
2011). RDF makes it possible to write statements about resources with each statement
comprising a triple. The parts of a triple are the subject, represented by an URI or a blank
node; the predicate or property, represented by an URI; and the object, represented by an
8 http://stats.lod2.eu/

36
URI, a blank node, or a literal. Several triples form a graph. RDF is a language for
representing information about resources in the WWW (Manola and Miller 2004). It provides
a flexible data model (Breitman et al., 2010), allowing RDF data to be serialised in various
formats for publication on the Web. Formats include RDF/XML, RDFa, Turtle, N-Triples,
RDF JSON (Heath and Bizer, 2011). RDF, is simple to implement, and allows
straightforward integration of data from heterogeneous sources (Nečaský et al., 2014).
W3C Geospatial Incubator Group (GeoXG)9 published: Geospatial Vocabulary defines a
basic ontology and OWL vocabulary for representing geospatial properties for Web resources
(Lieberman, Singh and Goad, 2007a). This report presents a model for basic feature
properties of Web resources and a realisation of these feature property elements as XML and
OWL/RDF vocabularies. Geospatial Ontologies, another report by Lieberman, Singh and
Goad (2007b), describe geospatial foundation ontologies that can represent geospatial
concepts and properties on the worldwide web. GeoRDF10
is an RDF compatible profile for
geospatial information. It defines profiles for points, lines and polygons. The GTWS
presented in Chapter 5 consumes non-spatial linked data (attribute data) from the LOD cloud.
2.4.7 Querying Linked Data
Prud‘hommeaux and Seaborne (2008) define SPARQL as the query language for RDF. Some
linked data providers provide RDF dump or SPARQL endpoint for its linked datasets (Heath
and Bizer, 2011). An RDF dump, a large RDF document, contains the RDF graph that makes
up the entire linked dataset but a SPARQL endpoint is an HTTP-based query service that
executes SPARQL queries over the linked dataset (Hartig and Langegger, 2010). The
geospatial thematic web services presented in this research consume non-spatial linked data
in RDF through a SPARQL endpoint.
SPARQL is the query language for RDF and can express queries across data stored as
RDF or viewed as RDF over middleware (Steve and Seaborne, 2013). SPARQL provides a
9 www.w3.org/2005/Incubator/geo/
10 www.w3.org/wiki/GeoRDF#Implementation

37
flexible and extensive way to query RDF data (Aditya and Kraak, 2007). SPARQL query
results can be serialised into other formats, such as Extensible Markup Language (XML)
(Beckett and Broekstra, 2013), JavaScript Object Notation (JSON), CSV or tab separated
values (TSV) (Seaborne, 2013a, 2013b). The SPARQL federated query is an extension for
executing SPARQL queries distributed over various SPARQL endpoints (Prud‘hommeaux
and Buil-Aranda, 2013). GTWS-2 and GTWS-3 use SPARQL federated queries to retrieve
attributes (RDF) from the LOD cloud, while GTWS-1 uses SPARQL queries.
OGC published a standard, OGC GeoSPARQL that supports representing and querying
geospatial data on the Semantic Web (Perry and Herring, 2012). GeoSPARQL defines a
vocabulary for representing geospatial data in RDF. It also defines an extension to the
SPARQL query language for processing geospatial data. No need existed to use
GeoSPARQL for GTWS in its current implementation because GTWS consumes only non-
spatial attributes from the LOD cloud. The non-spatial attributes and point geometric data can
be represented as RDF.
2.4.8 Accessing Linked Data
Prud‘hommeaux and Seaborne (2008) define SPARQL as the query language for RDF. Some
linked data providers provide RDF dump or SPARQL endpoint for its linked datasets (Heath
and Bizer, 2011). An RDF dump, a large RDF document, contains the RDF graph that
constructs the entire linked dataset but a SPARQL endpoint is an HTTP-based query service
that executes SPARQL queries over the linked dataset (Hartig and Langegger, 2010; Jupp et
al., 2014; J. Zhao, Miles, Klyne and Shotton, 2009; Villata, Costabello, Delaforge and
Gandon, 2013). The geospatial thematic web services consume non-spatial linked data in
RDF by a SPARQL endpoint.
2.5 Data Integration
Data integration deals with the problem of combining data from various sources, and
providing the user with a unified view of these data (Lenzerini, 2002). Database integration is
the process that takes as input a set of databases, and produces as output a single unified

38
description of the input schemas (the integrated schema) and the associated mapping
information (Castano and De Antonellis, 1998) as shown in Figure 8.
Lenzerini (2002) formalise a data integration system as follows: I = <G; S;M> where
I is the data integration system.
G is the global schema, expressed in a language LG over an alphabet AG. The alphabet
comprises a symbol for each element of G (for example; relation if G is relational, class if
G is object-oriented).
S is the source schema, expressed in a language LS over an alphabet AS. The alphabet AS
includes a symbol for each element of the sources.
M is the mapping between G and S.
Figure 8: Data integration system (Source: Lenzerini, 2002)

39
2.5.1 Approaches to Data Integration
The main approaches to data integration are Local-as-View (LAV) and Global-as-View
(GAV) (Castano and De Antonellis, 1998; Halevy, Rajaraman and Ordille, 2006). GAV
requires that the global schema is expressed in the data sources whilst LAV requires the
global schema to be specified in-dependently from the sources (Lenzerini, 2002). In LAV the
relationships among the global schema and the sources are established by defining every
source as a view over the global schema.
Lenzerini, 2002 distinguishes the LAV and GAV from the modelling perspective as:
The LAV approach is based on the idea that the content of each source should be
characterised with a view over the global scheme. LAV approach favours the
extensibility of the system: adding a new source means enriching the mapping
with a new assertion, without other changes.
The idea proves that the content of each element of the global schema should be
characterised with a view over the sources The GAV approach is . GAV approach
favours the system in carrying out query processing because it tells the system
how to use the sources to retrieve data. Extending the system with a new source is
now a problem. The new source may influence defining various elements of the
global schema, whose associated views need to be redefined.
In processing queries in GAV and LAV, Calì, Calvanese, De Giacomo, and Lenzerini
(2013) highlights the following:
Processing queries in LAV is similar to query answering with incomplete
information and is a complex task.
Query processing is much easier in GAV approach where answering a query,
means unfolding its atoms according to its definitions about the sources.
There is a mixed approach that combines the advantages of LAV and GAV in a mediation
language called Global-And-Local-As-View (GLAV) (Halevy et al., 2006; Kwakye, 2011).

40
Modelling the Web of data requires using the GLAV approach since GAV and LAV are
restricted to modelling relations (Friedman, Levy and Millstein,1999).
The Open Data Platform (Mildorf et. al (2014) and the HUMBOLDT project11
are
examples of data integration where spatial data is integrated. The Open Data Platform
enables users to integrate, harmonise and visualise spatial planning and other data (Mildorf
et. al (2014). The HUMBOLDT project provides tools and services aimed at enabling the
implementation of a framework for harmonising spatial data and services, under the
Infrastructure for Spatial Information in Europe (INSPIRE12
) Directive (Villa, Molina,
Gomarasca and Roccatagliata , 2012).
In this research, the focus is on investigating and evaluating several ways of creating web
thematic maps by combining alphanumeric linked data from the LOD cloud with geometry in
a spatial database server.
2.5.2 Integrating Linked Data into (Spatial) Databases
Traditional data management applications operate in well-structured information
environments and benefit from full-fledged strategies (SQL) that provide the needed
functionality to represent, manage and query well-structured data (Yu and Spaccapietra,
2010). Geonames.org13
(and Gazetteers) does not provide geometries for the location names
other than a single representative point (Brisaboa, Luaces, Places and Seco, 2010). A
Gazetteer is a geographical dictionary that contains, besides location names, alternative
names, populations, location of places, and other information related to the location (Brisaboa
et al., 2010).
Many storage mechanisms are available for storing linked data. The first persistent RDF
storage mechanisms were built using backing relational databases, with a layer added to
translate data back and forth into a relational schema. While this approach provides a solid,
11
http://www.esdi-humboldt.eu/home.html 12
http://inspire.ec.europa.eu/ 13
http://www.geonames.org/

41
reliable base upon which to build, performance can be lacking (Kolas, 2008). With the
increasing amount of RDF data on the Web, researchers developed specialized architectures
for RDF data management named triple stores (Abadi, Marcus, Madden and Hollenbach,
2007; Carroll et al., 2004; Chong, Das, Eadon and Srinivasan, 2005; Neumann and Weikum,
2010; Weiss, Karras and Bernstein, 2008). These store the data in a native form more like
RDF, and as a result, provide better performance (Rohloff, Dean, Emmons, Ryder and
Sumner, 2007).
Some Semantic Web triple stores are adding spatial indexing, such as
Spatially-Augmented Knowledgebase (SPAUK) (Kolas, 2008). Meanwhile, in the Semantic
Web, the support for geometric data has also increased significantly (Kolas and Self 2007),
with the following triple stores supporting this kind of data: OWLIM Standard Edition14
(OWLIM-SE, previously known as BigOWLIM), Open Sahara15
, Parliament16
,
AllegroGraph17
and Virtuoso18
. Both types are viable storage solutions but this strictly
Semantic Web types of system cannot process spatial data efficiently (Kolas and Self 2007).
In the relational database realm, support for complex geometric data (points, lines, and
polygons) is already well established. Examples are MySQL19
, PostgreSQL20
, and Oracle21
.
Much of the spatial data now in use is stored in a relational database with additional spatial
indices. This technique is efficient and reliable. While a relational database with spatial
extensions is useful, it fails to provide the benefits of the Semantic Web as described above
(Kolas, 2008).
Since neither a Semantic Web triple store nor a relational database with spatial extensions
provides all the functionality that is desired, a new system has come into existence. These
systems combine efficient storage of Semantic Web data with efficient storage of spatial data
14
http://www.ontotext.com/owlim/geo-spatial 15
https://dev.opensahara.com/ 16
http://parliament.semwebcentral.org/ 17
http://www.franz.com/agraph/allegrograph/ 18
http://virtuoso.openlinksw.com/ 19
http://www.mysql.com/ 20
http://www.postgresql.org/ 21
http://www.oracle.com/index.html

42
(Kolas, 2008). These systems are now being created working in both directions; some spatial
data systems are now adding RDF support, such as Oracle. Oracle is discussed further under
the section on Related Work.
2.5.3 Relational Database to RDF Mapping Approaches
Converting relational databases to RDF is a significant area of research with several
approaches published and many tools available (Stadler, Lehmann, Höffner and Auer, 2012).
There is the W3C RDB2RDF working group22
, that aims to standardise a database to RDF
mapping language (Das, Sundara and Cyganiak, 2012). There are various tools available
implementing the surveyed approaches such as D2R23
, Triplify24
, DartGrid25
, DataMaster26
,
MapOnto27
, METAmorphoses28
, ODEMapster29
, RDBToOnto30
, RDOTE (Vavliakis, Grollios
and Mitkas, 2013), Virtuoso RDF Views31
and VisAVis32
. The reader is refered to surveys
(Sahoo et al., 2009; Spanos, Stavrou and Mitrou, 2012) and overviews33
on this topic for
further information.
In sub-section 2.9.1 and 2.9.2, the mapping approaches published by the W3C RDB2RDF
working group is briefly presented. Sub-section 2.9.3 highlights the mapping of object
schemas to relational database schemas. These approaches were explored to find a suitable
approach for integrating RDF directly into a spatial database as for GTWS-3.
A Direct Mapping of Relational Data to RDF
22
http://www.w3.org/2001/sw/rdb2rdf/ 23
http://d2rq.org/d2r-server 24
http://triplify.org/Overview 25
http://www.w3.org/wiki/DartGrid 26
http://protegewiki.stanford.edu/wiki/DataMaster 27
http://www.cs.toronto.edu/semanticweb/maponto/ 28
http://metamorphoses.sourceforge.net/ 29
http://neon-toolkit.org/wiki/ODEMapster 30
http://www.tao-project.eu/researchanddevelopment/demosanddownloads/RDBToOnto.html 31
http://docs.openlinksw.com/virtuoso/rdfviewsrdbms.html 32
https://code.google.com/p/visavis/ 33
http://esw.w3.org/topic/Rdb2RdfXG/StateOfTheArt

43
In this sub-section the mapping approach published by the W3C RDB2RDF Working Group
in (Arenas, Alexandre, Prud'hommeaux and Sequeda, 2012) is highlighted. The direct
mapping defines an RDF graph representation of data in a relational database (Arenas et al.,
2012). The direct mapping takes as input a relational database (data and schema) and
generates an RDF graph called the direct graph. The algorithms compose a graph of relative
Internationalized Resource Identifiers (IRIs) that must be resolved against a base IRI to form
an RDF graph. Foreign keys in relational databases establish a reference from any row in a
table to exactly one row in a (potentially different) table. The direct graph conveys these
references, and each value in the row.
For example; the results of applying a direct mapping to relational tables People and
Addresses (see Table 3) are shown in Figure 9.
Table 3: People and Address relational tables (Source: Arenas et al., 2012)
Figure 9: Direct mapping of People and Address relational tables to RDF (Source: Das et al.,
2012).

44
The subject: an IRI formed from the concatenation of the base IRI, table name (People),
primary key column name (ID) and primary key value (7). The predicate for each column: an
IRI formed from the concatenation of the base IRI, table name and the column name. The
values: RDF literals formed from the lexical form of the column value. Each foreign key
produces a triple with a predicate composed from the foreign key column names, the cited
table and the cited column names. The object of these triples is the row identifier
(<Addresses/ID=18>) for the cited triple.
R2RML: RDB to RDF Mapping Language
This specification (also published by the W3C RDB2RDF working group) describes R2RML,
a language for expressing customized mappings from relational databases to RDF datasets
(Das et al., 2012). In the direct mapping of a database, the structure of the resulting RDF
graph reflects the structure of the database, the target RDF vocabulary reflects the names of
database schema elements, and neither structure nor target vocabulary can be changed. Figure
10 is an example of an output resulting from R2RML mapping of EMP relational table (Table
4).
Table 4: EMP relational table (Source: Das et al., 2012 ).

45
Figure 10: R2RML mapping of EMP table and example output (Source: Das et al., 2012 ).
With R2RML conversely, a mapping author can define highly customised views over the
relational data. The input to a R2RML mapping is a relational database that conforms to that
schema. The output is an RDF dataset [SPARQL] as defined in SPARQL that uses predicates
and types from the target vocabulary.
Mapping Object Schemas to Relational Database Schema
How to map object schemas to relational database schemas has been dealt with
extensively by (Bourret, 2009). Table 5 is an extract from (Bourret, 2009) of how object-
oriented structure could be mapped to relational database structure. In the instance of GTWS,
(object-) relational mapping is required when integrating RDF triples directly into a spatial
database as is the situation for GTWS-3. GTWS-1 and GTWS-2 use RDF in a serialised
format compatible with a spatial database or a web map server.

46
Table 5: Mapping object-oriented structure to relational database structure (Bourret, 2009).
Object-
oriented
Structure
Mapping to relational database structure
Abstract
class
Abstract classes are not mapped unless mapping inheritance. See
Inheritance.
Class Table. This is known as a class table.
An object is represented by a row in a class table.
Inheritance (i) The superclass and subclass are mapped to separate tables with a
unique key / foreign key joining them. The unique key is in the
superclass table.
An object is represented by a row in each table.
(ii) The superclass properties are stored in the subclass table.
An object is represented by a row in this table.
Single-
valued property
with scalar data
type
(i). Column in class table. This is known as a property column. The
data type determines the set of possible data types of the column. (A data
type of pointer to void or Object is mapped to BLOB.)
A property is represented by a value in a property column.
2.6 Open source Geospatial Software
Several free and open source geospatial software products are freely available and the source
code can be customised or extended. Some proved benefits of open source software include
cost savings, vendor independence, and open standards (Holmes, Doyle, and Wilson (2005;
Von Hagen, 2007; Steiniger and Hunter, 2012). Free and open source geospatial software is
now maturing (Steiniger and Hunter, 2013). Due to these benefits, this research sought to use
free and open source geospatial software in the implementation of GTWS to evaluate how
open source geospatial software technology can also benefit from the LOD cloud.

47
Several free and open source geospatial software products are freely available and the
source code can be customised or extended. Most can be downloaded freely from the internet,
for example; from the sourceforge (http://sourceforge.net/) website. It allows selected open
source geospatial software to be freely distributed, duplicated and passed around. Ramsey
(2006, 2007) and also Steiniger and Hunter (2013) presented general reviews of (major)
geographical information system (GIS) software projects that develop free and open source
software .
The Open Source Geospatial Foundation (OSGeo) is a not-for-profit organisation with a
mission to support the development and promote using free and open source geospatial
software (see http://www.osgeo.org/). Table 6 illustrates examples of open source geospatial
software to those listed on the OSGeo website under the category of web mapping, desktop
applications and geospatial libraries. The conceptualisation, design options and
implementations of this research has incorporated free and open source geospatial software to
connect to the LOD cloud to consume and visualise linked data as web thematic maps.
Chapter 3 proves the choice of open source software discussed on critical evaluation of
technology.
Open source web mapping technology has proved popular among organisations and
groups who can access spatial data and have some programming expertise, but who lack
either the desire or the means to pay proprietary software purchase and licensing fees (Hall,
Chipeniuk, Feick, Leahy and Deparday, 2010).

48
Table 6: Examples of categories of open source geospatial software (Source:
http://www.osgeo.org/)
Web Mapping Desktop Applications Geospatial Libraries
deegree GRASS GIS FDO
Geomajas Quantum GIS GDAL/OGR
GeoMoose gvSIG GEOS
GeoServer Opticks GeoTools
Mapbender OSSIM
MapFish PostGIS
MapServer
Quantum GIS Server
OpenLayers
52° North
ZOO
2.7 Spatial Data Infrastructures in this Research
A spatial data infrastructure (SDI) is an enabling platform for data sharing- based on a
dynamic, hierarchic and multi-disciplinary concept that includes, people, data, access
networks, institutional, policy, technical standards and human resources dimensions that aims
to facilitate and coordinate the exchange and sharing of spatial data among stakeholders in
the spatial data community (Rajabifard, Binns, Masser and Williamson, 2006). An SDI is an
evolving concept about facilitating and coordinating the exchange and sharing of spatial data
and services among stakeholders from several levels in the spatial data community
(Hjelmager et al., 2008, Cooper et al, 2011, 2014).
Geoportals are World Wide Web gateways that organise content and services such as
directories, search tools, community information, support resources, data and applications

49
(Maguire and Longley, 2005) to discover and access geographic Web services (Tait, 2005).
They are the most visible part of SDIs (de Longueville, 2010). Today‘s geoportals are
focusing on interoperability through implementing standards for discovery and use of
geographic data and services (de Longueville, 2010). SDIs are widely used to share, discover,
visualise and retrieve geospatial data through OGC web services (Giuliani, Ray and
Lehmann, 2011). OGC web services can be combined to provide a technical infrastructure for
an SDI with SOA (Coetzee, 2009).
One characteristic of an ‗ideal‘ SDI is that geospatial data can be integrated with many
other kinds or sets of data to produce information useful for decision makers and the public,
when appropriate (Nebert, 2004). As a result of current technologies, there are ever
increasing volumes of diverse data that need to be integrated with SDIs (Harvey, Iwaniak,
Coetzee and Cooper, 2012). Users expect SDI data to be available through new technologies
(Coetzee, Harvey, Iwaniak and Cooper, 2013).
Holmes, Doyle, and Wilson (2005) emphasise the potential benefits of using open source
software in developing SDIs - money spent on tailoring the software can go towards
developing local skills and capacity, no need to pay license fees that tie users to a single
vendor. This allows more culturally sensitive solutions instead of an universal answer
imposed from the outside (Holmes, Doyle, and Wilson (2005). Von Hagen (2007) attempted
to use open source components; based on OGC and ISO standards to help build a Somalia
SDI- using the Food and Agricultural Organisation-Somalia Water and Land Information
Management (FAO-SWALIM) project. An analysis by Steiniger and Hunter (2012) reveals
that for all categories of software used in SDIs a free software product is available. This
enables an SDI to be implemented on a limited financial budget, and allows distribution of a
proved SDI architecture without legal constraints (Steiniger and Hunter, 2012).
In developing countries, frequently in Africa, the various SDI initiatives such as the
Namibian Spatial Data Infrastructure (NamSDI) (Sinvula and Coetzee 2012; Sinvula et al.,
2014), the South African SDI (SASDI) (Rautenbach and Coetzee, 2013) and the SDI in
Ghana (Owusu-Banahene et al., 2013) will benefit from the technological advances in open

50
source software and integrating linked data into geospatial data sources to create visualisation
such as thematic maps. Overall this research seeks to contribute to the technical facet (Cooper
et al., 2013) of SDI research.
2.8 Related Work
2.8.1 Creating Thematic Maps
Thematic mapping is not a default functionality of creating maps over the Web (web
mapping) but offers further functionalities, such as data exploration and spatial analysis, to
the user (Rautenbach, Coetzee and Iwaniak, 2013). In the circumstance of creating thematic
maps from linked data over the web, even though utilising linked data to non-tech web users
is evident, consumption of linked data is restricted mostly to the semantic web community
(Dadzie and Rowe, 2011). There are large volumes of interlinked geospatial data on the Web
of Data; Loading all these data sets simultaneously is hard for many systems (Van Hage,
Wielemaker and Schreiber, 2010).
OGC WMS and SLD have partly set a stage for an open framework for web mapping
services (Iosifescu-Enescu, Hugentobler and Hurni, 2010). WMS standardises the way maps
are requested over the Internet and how servers describe its data holdings (Kresse and Fadaie,
2010). The SLD specifies how a WMS can be extended to allow user-defined styling (Lupp,
2007). With the current specification of SLD, it is more or less possible to describe thematic
maps (Sae-Tang, and Ertz, 2007). OGC technology is widely used in the geospatial
community (Farnaghi and Mansourian, 2013) for standards-based interoperability and sharing
technology of the Cyberinfrastructure for GIScience (Yue, Gong, Di, He and Wei, 2011). In
its current form OGC technology cannot be connected to the LOD cloud.
(Rautenbach et al., 2013) describes the present, thematic cartography over the web as one
requiring complex processes with the current implementations of existing OGC web services.
GTWS uses WMS and SLD to create thematic maps from linked data in the LOD cloud. It
offers mechanism for connecting WMS to a web map server to the LOD cloud. GTWS

51
further shows how linked data can be combined with geometry to create thematic maps over
the Web.
2.8.2Linked Data Web Mapping Applications
In this section map4rdf34
, Researchers Map35
, DBpedia Mobile36
, Spatial@LinkedScience
Interactive Tool37
and LinkedGeoData Browser38
linked data web mapping applications
related to GTWS are described. The reader is shown how GTWS differs from these
applications. Related work is subsequently described in this section.
map4rdf is a mapping and faceted browsing tool that can be configured with a SPARQL
endpoint to provide exploration and visualisation of RDF resources enhanced with linked
data based geometric information (see Figure 11). It provides geospatial and geometrical
visualisation using Google Maps39
and OpenStreetMap40
.
Researchers Map is a linked data mash-up application that provides a map of the work
place of professors of the German database community (Hartig et al., 2009).
The DBpedia41
datasets have been extracted from Wikipedia and comprise of 1.89 billion
pieces of RDF triples. DBpedia Mobile, of that a web page is shown in Figure 12, is a
location-centric client for the Semantic Web. Based on the current GPS position of a mobile
device, DBpedia Mobile renders a map containing information about nearby locations from
the DBpedia dataset. Geographic locations are now available for 300,000 of DBpedia's 2.18
million ―things‖.
34
http://oegdev.dia.fi.upm.es/projects/map4rdf/ 35
http://researchersmap.informatik.hu-berlin.de/ 36
http://wiki.dbpedia.org/DBpediaMobile 37
http://spatial.linkedscience.org/) 38
http://linkedgeodata.org/LGDBrowser 39
http://maps.google.com 40
www.openstreetmap.org 41
http://wiki.dbpedia.org/Datasets

52
Figure 11: Homepage of map4rdf (Source: http://oeg-dev.dia.fi.upm.es/map4rdf/)
Figure 12: DBpedia Mobile's web page (Source : http://wiki.dbpedia.org/DBpediaMobile)
Spatial@LinkedScience Interactive Tool (see Figure 13) is a linked data based interactive
web mapping tool developed by Carsten Keßler, Krzysztof Janowicz and Tomi Kauppinen to
access all papers ever published in significant Geographic Information conferences:

53
GIScience42
(international conference on geographic information science), COSIT43
(Conference on spatial information technology), ACM SIGSpatial44
(Association for
Computing Machinery international conference on advances in geographic information
systems), and AGILE45
(Association for Geographic Information Laboratories for Europe
conference). Spatial@linkedscience is a community-driven effort to create methods,
vocabularies, tools and data for showing how and why spatial information can efficiently be
used in scientific settings. The application was developed as part of the
Spatial@linkedscience initiative46
.
Figure 13: Spatial@linkedscience interactive tool
Another example of a linked data based application is the LinkedGeoData browser that
can display data from LinkedGeoData. The LinkedGeoData browser (shown in Figure 14) is
a facet based browser and editor for LinkedGeoData that allows browsing of the world by
42
http://www.giscience.org/ 43
http://www.cosit.info/ 44
http://www.sigspatial.org/sigspatial-conferences 45
http://www.agile-online.org/ 46
http://linkedscience.org/spatial/

54
using a ‗slippy map‘ (Stadler et al., 2012). Once a facet or a particular facet value has been
selected, matching elements are displayed as markers on the map and in a list.
Figure 14: LinkedGeoData browser (Source: http://browser.linkedgeodata.org/)
map4rdf provides visualisation tools for a single source of geospatial RDF data and
Researchers Map is constructed solely based on queries executed against the Web of data
(Hartig and Langegger, 2010), while GTWS combines non-spatial linked data (attributes)
from the LOD cloud (first source) with geospatial data in an SDS (second source) to produce
thematic maps. DBpedia Mobile, Spatial@linkedscience and LinkedGeoData browser
provide visualisation and editing tools for geospatial linked data, GTWS sought to create
visualisations as thematic maps by combining linked data models with object relational
models (spatial data) in a geospatial web service environment. GTWS creates visualisations
for heterogeneous data - linked and non-linked alike.
All the related work described above uses only Semantic Web technology, whilst GTWS
combines semantic web (linked data) and OGC compliant technologies. In another work, T.
Zhao et al. (2008) integrate spatial data available through OGC WFS and in databases into
the Semantic Web: ontological queries are converted to WFS queries and executed against
the spatial data. This work also combines Semantic Web (linked data) and OGC models, but
the flow of data is from OGC models to Semantic Web. In contrast, his research shows how

55
existing WMS can retrieve attributes from the LOD cloud and integrate them with spatial
data to create thematic maps.
A Similar work by Jones, Kuhn, Keßler, and Scheider (2014) implements an OGC WFS
compliant service as an adapter that listens to WFS requests and converts these requests into
SPARQL queries. This adapter requires current GIS to have access to geographic LOD
datasets, using its implementation of WFS. Unlike the adapter, this research integrates
alphanumeric linked data from the LOD cloud with spatial data in a spatial database to create
thematic maps. The current design options use OGC WMS for visualisation of the thematic
maps.
2.8.3 Integrating Linked Data into (Spatial-) Databases
The RDF store in Oracle is built on top of the Oracle Spatial Network Data Model (NDM), in
that a network or graph captures relationships among objects using connectivity (Alexander
and Ravada, 2006). RDF graphs are modelled as a directed logical network in NDM. In this
network, the subjects and objects of triples are mapped to nodes, and predicates are mapped
to links that have subject start nodes and object end-nodes. A link represents a complete RDF
triple. A key feature of RDF storage in Oracle is that nodes are stored once – regardless of the
number of times, they participate in triples. A new link is always created whenever a new
triple is inserted. Figure 15 illustrates how an RDF graph of three RDF triples: <S1, P1, O1>;
<S1, P2, O2>; <S2, P2, O2> is modelled.
Figure 15: RDF graph in Oracle (Source: Alexander and Ravada, 2006)
Atlas (Kaoudi and Koubarakis, 2013) is a system built on top of the Bamboo distributed
hash table (DHT) (Rhea, Geels, Roscoe and Kubiatowicz, 2004) for the distributed storage,

56
update and querying of RDF data and RDFS ontologies. When a node wants to store RDF(S)
data, it submits it as an RDF(S) document. The document can be in either RDF/XML or
RDF/N3 format. This document is decomposed into a collection of RDF triples. Each triple
of form (subject; predicate; object) is stored in Atlas three times, once for its subject, once for
its predicate and once for its object. As URIs and literals may comprise of long strings, a
mapping dictionary similarly to centralised RDF stores has been implemented (Chong et al.,
2005; Neumann and Weikum, 2010). URIs and literals are mapped to integer identifiers and
triple storage and query evaluation is performed using these identifiers. Each node stores the
triples it receives in its local database
Converting relational databases to RDF is a significant area of research with several
approaches published and many tools available. Instead of focussing on
converting/representing RDF in RDB, the research presented in this research shows the
efficiency of spatial databases in handling spatial analysis can be combined with available
linked datasets in the LOD cloud to create thematic web maps. Integrating RDF triples
directly into a spatial database as in the instance of GTWS-3, follows a simple relational
database approach of storing RDF. The RDF triples (Subject (S), Predicate (P), Object (O))
are stored in relations as tuples comprising of <S, P1, O1, P2, O2, P3, O3 …PK, OK> as shown
in Table 7. S is the unique ID of the resource later used to join the existing table containing
the geometric objects in a spatial database as shown in Table 8. Table 9 is created after
joining the geometric object table to the relational table containing the RDF triples.
Table 7: Representing RDF triples in a relational database
S P1 O1 P2 O2 P3 O3 … PK OK
Table 8: Table containing geometric objects in a spatial database.
OID UID geometry

57
Table 9: Table created after joining the geometric object table to the relational table containing
the RDF triples.
OID geometry S(=UID) P1 O1 P2 O2 P3 O3 … PK OK
The reliance on relational representations of RDF means that GTWS can take advantage
of 35+ years of research on efficient storage and querying, industrial-strength transaction
support, locking and security (Bornea et al., 2013).
GTWS-3 is an example of a linked data based web cartographic concept of creating
thematic maps by accessing alphanumeric linked data from the LOD cloud through a direct
connection of a spatial database server extension.
With the approach described in this research, the spatial database server and the WMS
used to visualise the thematic maps are not modified. The LOD cloud is treated as if it is just
a new external data source (a big database with new data representation) required for creating
thematic web maps in the era of ubiquitous cartography.
2.9 Conclusion
The following topics are presented: thematic cartography, ubiquitous cartography, standards
based geospatial web services, linked data, spatial data infrastructures, data integration and
open source geospatial software. These areas constitute the aspects of this research from the
scientific disciplines of Cartography, GIScience and Computer Science. This chapter reveals
the gap among existing models (standard based services, open source geospatial software,
cartography and spatial data infrastructure) and linked data. The combination of the vast
quantities linked data available in the LOD cloud and the efficient spatial analysis capabilities
of spatial database is beneficial to data consumers such as including GTWS. This chapter
provides a basis for identifying the evaluation criteria (requirements) for integration
approaches that combine linked data from the LOD with geometric data in a spatial database
to produce thematic maps. Each design choice of GTWS adopts a different integration
approach in creating a global view of the autonomous data sources: linked data from the LOD
cloud and geometric data from a spatial database.

58
In its current form OGC web cannot be directly connected to the LOD cloud. Apart from
the work by T. Zhao et al. (2008) and Jones et al. (2014), related work focuses on Semantic
Web models. The research described in this research focus on creating thematic maps by
integrating linked data from the LOD cloud with geospatial data held in a spatial database.
This research uses OGC models to visualise the thematic maps created from the resulting
integrated data. This research may benefit workers who use standards from the Open
Geospatial Consortium (OGC) and the World Wide Web Consortium (W3C). From the
perspective of SDI, this research contributes to how open diverse sources of data, such as
linked data can be integrated with existing spatial data managed in national and regional
SDIs. This research also shows the potential of using open source software in SDIs.

59
Chapter 3: Evaluation of Technologies,
Tools and Standards Related to Open
Source Geospatial Web Services
This chapter is an extended version of a refereed conference paper published as: Owusu-Banahene, W., and
Coetzee, S. (2012, October). An evaluation of the suitability of open source web map servers for setting up a
geospatial thematic web map service. GISSA Ukubuzana 2012, Ekurhuleni, South Africa.
3.1 Introduction
The objective of this chapter is to (critically) evaluate state-of-the-art technologies, tools and
standards that will be suitable for developing a GTWS in an open data and open source
environment. An experiment was set up to evaluate the ease of setting up a geospatial
thematic web service in three open source web map servers, namely: MapServer, GeoServer
and QGIS Server. Literature was further reviewed to evaluate open source spatial database
servers. The work described in this chapter evaluates the ease of setting up a geospatial
thematic web service in three open source web map servers, namely: MapServer, GeoServer
and QGIS Server. In our current research, this chapter shows the procedure used in selecting
one of the contemporary open source web map server, that meets the requirements of this
research.
This section attempts to provide a method to answer this suitability question with
comparison of three open source web, namely: MapServer, GeoServer and QGIS Server. This
section is placed in the research objective to identify and select a state-of-the-art web map
server suitable for GTWS. Open source web map servers were used for this research since
this source code is open and allows modification when the need arises.

60
There have been ongoing attempts to test the performance of open source web map
servers. This evaluation was not intended to test the performance of these web map servers,
nor to run compliance tests. It was aimed at doing a qualitative assessment of each web map
server, using the same client under the default set up, according to the following criteria: ease
of installation, ease of cartographic workflow, level of support for displaying web maps,
types of output formats supported, level of quality of web maps, types of input data that can
be used, level of support for styling, adherence to OGC standards and quality of the user
documentation. Results proven on the criteria are presented. The evaluation criteria of the
three WMS servers focus primarily on their suitability to produce web maps, since the web
map servers were not required to support linked data.
3.2 Overview of Three Open Source Web Map Servers
In this section, an overview of the ages and approaches of the three open source web map
servers-namely: GeoServer47
, MapServer48
and QGIS Server49
, used in this evaluation are
presented.
GeoServer is written in Java that and runs in an integrated Jetty or Apache Tomcat web
server environment (Steiniger and Hunter, 2013).
MapServer, originally developed in the mid-1990 at the University of Minnesota, written
in C (UMN, 2013), runs as a Common Gateway Interface (CGI) application in the Apache
web server environment (Steiniger and Hunter, 2013). QGIS Server is a fast CGI/CGI written
in C++ (ETH, 2009; QGIS, 2013).
QGIS Server started as QGIS mapserver, initially developed as QGIS mapserver by the
Institute of Cartography, ETH, Zurich. QGIS mapserver's code was included in the QGIS
SVN repository as of August 2010 (ETH, 2009) and has been part of QGIS, open source
Geographic Information System (GIS) software.
47
http://geoserver.org/display/GEOS/Welcome 48
http://www.mapserver.org/index.html 49
http://www.qgis.org/en/site/

61
MapServer is the oldest followed by GeoServer with QGIS Server been recent (Anselin,
2012; Steiniger and Hunter, 2012).
3.3 Related Work
P. Yang, Cao and Evans (2007) tested the performance of various WMS servers and analysed
the test to find performance patterns. In another study (Birgoren and Gumusay, 2010),
performance tests of ArcGIS Server, Geoserver and Mapserver software have been made
with Internet Explorer where they were set up on the same computer and same geographic
data introduced to software. Similar performance tests have been conducted to compare the
performance of GeoServer and MapServer (Aime and Deoliveria, 2008; Aime andMcKena,
2009). In (Aime and McKena, 2010) the performance of MapServer, Geoserver, and Mapnik
were compared, and various back-end data sources, such as PostGIS and Shapefiles. In this
research, the aim was to run neither performance test nor compliance test but to do a
qualitative comparison of MapServer, GeoServer and QGIS Server under default settings to
find out its suitability for creating web-based thematic maps using OGC web standards. At
the time of writing the study, to the knowledge of the author, comparable tests for suitability
of web map servers in creating thematic maps have not been done for these map servers.
3.4 Evaluation Procedure and Results
Approach for comparing the three web map servers are presented in this section. First criteria
to assess the suitability of a map server for creating thematic web maps are set. Secondly, a
procedure for evaluating each criterion was designed and implemented. Finally, the latest
releases (at the time of performing the tests) of MapServer, GeoServer and QGIS Server were
compared against the criteria. The input data comprised a shapefile obtained from the South
African 2001 Census data and a raster image obtained from (ETH, 2009). The shape file
contained data on the provinces in South Africa. Figure 16 is a snap shot of the spatial data as
visualised with QGIS Desktop. In this section, the criteria, the procedure for evaluating each
criterion and the results are discussed in the subsequent sub-sections.

62
Figure 16: Input data for the evaluation of web map servers
Criteria for evaluation
The following criteria to compare the web map servers were set: ease of installation, ease of
cartographic workflow, level of support for displaying web maps, types of output formats
supported, level of quality of web maps, types of input data that can be used, level of support
for styling, adherence to OGC standards and quality of the user documentation. Table 10
shows the mode of evaluation and justification for each criterion.

63
Table 10: Mode of evaluation and justification for each criterion
Criterion Mode of evaluation Justification
Ease of installation Follow documentation to set up
WMS on same computer using
default settings
To assess ease of deployment
by a novice user
Ease of cartographic workflow i)Load same data to each WMS,
ii) Run GetCapabilities requests
and iii) Run GetMap requests
from same Web browser
iv) Qualitative analysis of i) to
iii)
To assess the ease of carrying
out cartographic design
Level of support for displaying
web maps
Analyse level of support for
various versions of WMS
The GTWS will use WMS to
display web maps
Level of quality of web maps Analyse the quality of WMS
output
To assess the quality of web
maps
Types of output formats
supported
Analyse number of output
formats supported by WMS
To assess level of support for
cartographic reproduction
Types of input data that can be
used
Analyse documented support for
input data
To assess the range of input
data that can be supported.
Level of support for styling Analyse documented support for
SLD and SLD extensions
To assess the level of support
for creating thematic
information.
Quality of user documentation Analyse information pertaining
to the web map server from
official websites, links on the
official website to other sources
of information and user manuals
To assess how accessible,
how helpful and how usable
the documentation were.
Adherence to OGC standards Analyse OGC statistics The GTWS is OGC
standards based service and
therefore adherence to OGC
standards is a requirement.
3.4.1 Ease of Installation
In addition to Google Chrome (19.0.1.1084.56m) web browser, Table 11 shows the web map
servers installed on a workstation with Windows 7 Ultimate operating system. It was just
enough to follow the documentation for GeoServer, MapServer and QGIS Server respectively
to install the map servers. For GeoServer, no further configuration was required to set up
WMS. The map server used for windows (ms4w) to install MapServer required no
configuration as well to set up WMS. In the case of QGIS Server after installing with
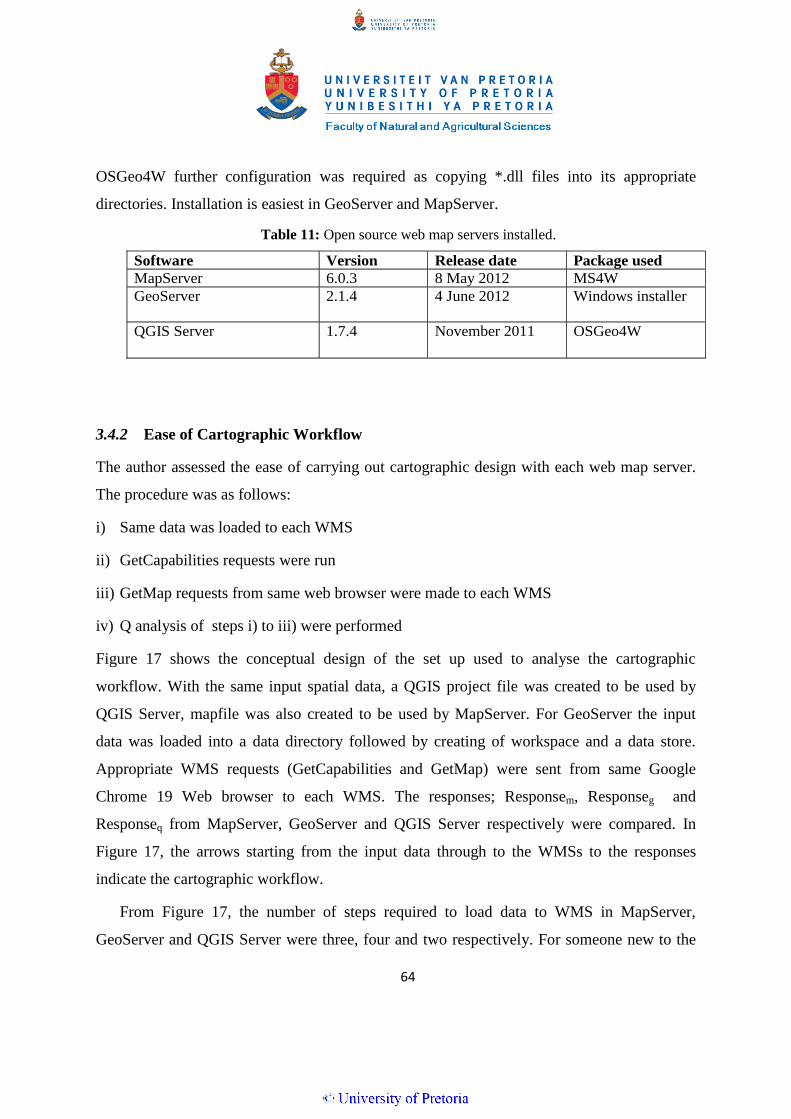
64
OSGeo4W further configuration was required as copying *.dll files into its appropriate
directories. Installation is easiest in GeoServer and MapServer.
Table 11: Open source web map servers installed.
Software Version Release date Package used
MapServer 6.0.3 8 May 2012 MS4W
GeoServer 2.1.4 4 June 2012 Windows installer
QGIS Server 1.7.4 November 2011 OSGeo4W
3.4.2 Ease of Cartographic Workflow
The author assessed the ease of carrying out cartographic design with each web map server.
The procedure was as follows:
i) Same data was loaded to each WMS
ii) GetCapabilities requests were run
iii) GetMap requests from same web browser were made to each WMS
iv) Q analysis of steps i) to iii) were performed
Figure 17 shows the conceptual design of the set up used to analyse the cartographic
workflow. With the same input spatial data, a QGIS project file was created to be used by
QGIS Server, mapfile was also created to be used by MapServer. For GeoServer the input
data was loaded into a data directory followed by creating of workspace and a data store.
Appropriate WMS requests (GetCapabilities and GetMap) were sent from same Google
Chrome 19 Web browser to each WMS. The responses; Responsem, Responseg and
Responseq from MapServer, GeoServer and QGIS Server respectively were compared. In
Figure 17, the arrows starting from the input data through to the WMSs to the responses
indicate the cartographic workflow.
From Figure 17, the number of steps required to load data to WMS in MapServer,
GeoServer and QGIS Server were three, four and two respectively. For someone new to the

65
three map servers, the steps in GeoServer could be completed quicker than in MapServer and
QGIS Server. The reason is that a mapfile has to be edited in the occasion of MapServer and
QGIS project file has to be created for QGIS Server. GeoServer provides a graphical user
interface that makes it easier and quicker to load data into WMS and also run GetCapabilities
and GetMap requests. Cartographic workflow is the easiest in GeoServer.
Figure 17: Conceptual design of the set up for analysing the ease of cartographic workflow
3.4.3 Level of Support for Displaying Web Maps
Since the GTWS will use WMS to display maps, it was important to find out which versions
of WMS were supported by each web map server. If WMS is set up correctly, the service will
respond to a WMS GetCapabilities request with an XML document (de la Beaujardierre,
Web Map Services
WMS requests from same Web browser
Responseg Responseq Responsem
GeoServer QGIS Server MapServer
Published data QGS File Map File
Work space
QGIS Desktop
Input Data
Data Store
Data directory
QGIS Desktop

66
2006). The WMS 1.3.0 standard (de la Beaujardierre, 2006) indicates the following in
response to GetCapabilities request:
a) If VERSION parameter is not specified, the server shall respond with the highest
version it supports.
b) If VERSION parameter is specified that the server implements, the server shall
send that version.
c) If VERSION parameter is specified that the server does not support, the server
shall respond with output that conforms to a version it does support, as determined by the
following rules: i) If a version unknown to the server and higher than the lowest supported
version is requested, the server shall send the highest version it supports that is less than the
requested version. ii) If a version lower than any of this known to the server is requested, the
server shall send the lowest version it supports. iii) If the client does not support the version
sent by the server, it may either cease communicating with the server or send a new request
with a different version number that the client does support.
In lieu of this, the following GetCapabilities requests were run for Geoserver:
―http://localhost:9090/geoserver/wms?request=getCapabilities―,MapServer:―http://localhost
/cgi-bin/mapserv.exe?MAP=C:/ms4w/apps/trial.map&SERVICE=WMS& VERSION=1.3.0&
REQUEST=GetCapabilities‖andQGISServer:―http://localhost/cgi-bin/qgis_map_server/
qgis_map_serv.cgi?SERVICE=WMS &REQUEST=GetCapabilities‖. Similar requests with
different version numbers were made. Table 12 shows the number of versions of WMS
supported. Analysis from Table 12 shows that all three map servers supported WMS 1.3.0,
but MapServer supports more versions.

67
Table 12: Various versions of WMS supported.
GeoServer MapServer QGIS Server
WMS version 1.3.0 1.1.1 1.0.0 1.1 1.3.0 1.1.1 1.0.0 1.1 1.3.0 1.1.1 1.0.0 1.1
Supported?
Yes Yes No No Yes Yes Yes Yes Yes No No No
Versions
supported 2 4 1
3.4.4 Level of Quality of Web Maps
The level of quality of web maps was evaluated by assessing the quality of WMS output
formats for each web map server. A single GetMap request aimed at retrieving two layers
(shapefile and tiff) from one WMS in a particular output format was sent to each WMS map
server at a time. Six GetMap requests were run for each WMS representing six (6) various
output formats. These six output formats are those specified by the WMS 1.3.0 standard (de
la Beaujardiere, 2006) namely: Graphics Interchange Format (GIF), Portable Network
Graphics (PNG), Joint Photographics Expert Group (JPEG), Tagged Image File Format
(TIFF), Scalable Vector Graphics (SVG) and Web Computer Graphics Metafile (WebCGM).
In all 18 GetMap requests were run. The response of each request was compared with the
input data as visualised in QGIS Desktop. The idea was to explore whether all two layers will
appear in the web browser and if they did was the quality of the response same as input? The
results were tabulated for each format as shown in Table 13. During the cause of making the
request, utmost care was given to ensure that the requests were correct according to the WMS
standard.
The following GetMap request, will retrieve a png formatted map from MapServer-
http://localhost/cgi-bin/mapserv.exe?service=wms&version=1.3.0&request=GetMap
&layers=earth,PR_SA &styles =default&crs=EPSG:4326&bbox=14.091,-39.0758,34.1167,-
21.854 &width=600&height=600&format=image/png&transparent=TRUE&map= C:\ms4w

68
\apps\saprovinces.map&. A similar GetMap request to retrieve same png map from QGIS
Server looks like this http://localhost/cgi-bin/qgis_map_server/qgis_map_serv.cgi? service
=WMS&version=1.3.0&request=GetMap&layers=earth20120225173140855,PR_SA20120
225173128727&styles=default,SingleSymbol&crs=EPSG:4326&bbox=16.4549,-34.833,
32.8913,-22.126&width=600&height=600&format=image/png& transparent=TRUE . For
GeoServer, this GetMap request will also retrieve a png formatted map,
http://localhost:9090/geoserver/saprovince/wms?service=WMS&version=1.3.0&request=Get
Map&layers= saprovince: earth, saprovince:PR_SA &styles=raster,polygon&bbox=-34.8330,
16.4549,-22.1260,32.8913&width=600&height=600&srs=EPSG:4326&format=image/png&
transparent=TRUE.
Table 13 shows the GetMap responses. Analysis of GetMap responses from Table 13
reveal that GeoServer and MapServer supported all six formats with QGIS Server supporting
two. Geoserver had all four output formats (PNG, JPEG, GIF and TIFF) having the same
quality as the input. In the case of MapServer, two output formats (PNG and TIFF) had the
same quality as the input. GeoServer shows superiority in the number of output formats that
had the same quality as the input data. All three map servers supported PNG format. The
output map in PNG format had same quality as the input data. Figure 18, Figure 19 and
Figure 20 show the output map in PNG from MapServer, QGIS Server and GeoServer
respectively.

69
Table 13: Quality of WMS GetMap responses
Formats
Tested
GeoServer MapServer QGIS Server
Supported Same
quality
as input
Supported Same
quality
as input
Supported Same
quality
as input
png Yes Yes Yes Yes Yes Yes
jpeg Yes Yes Yes No Yes No
gif Yes Yes Yes No No No
tiff Yes Yes Yes Yes No No
Svg+xml Yes No Yes No No No
WebCGM Yes No Yes No No No
Total Yes 6 4 6 2 2 1
Total No 0 2 0 4 4 5
Figure 18: Map in PNG from MapServer

70
Figure 19: Map in PNG from QGIS Server.
Figure 20: Map in PNG from GeoServer.

71
3.4.5 Types of Output Formats Supported
The response to a WMS GetCapabilities request is an XML file. The XML file contains
information about the output formats supported by the WMS' GetMap request. For example; ,
the following extract from a GetCapabilities response from MapServer shows that nine (9)
various output formats (indicated as bold) are advertised as supported:
<GetMap>
<Format>image/png</Format>
<Format>image/jpeg</Format>
<Format>image/gif</Format>
<Format>image/png; mode=8bit</Format>
<Format>application/x-pdf</Format>
<Format>image/svg+xml</Format>
<Format>image/tiff</Format>
<Format>application/vnd.google-earth.kml+xml</Format>
<Format>application/vnd.google-earth.kmz</Format>
<DCPType>
<HTTP>
<Get><OnlineResource xmlns:xlink="http://www.w3.org
/1999/xlink" xlink:href="http://localhost/cgi-
bin/mapserv.exe?map=C:/ms4w/apps/saprovinces.map&"/>
</Get>
<Post>
<OnlineResource xmlns:xlink="http://www.w3.org/1
999/xlink" xlink:href="http://localhost/cgi-
bin/mapserv.exe?map=C:/ms4w/apps/saprovinces.map&"/>
</Post></HTTP>
</DCPType>
</GetMap>
The output formats supported by WMS 1.3.0 were analysed. The Venn diagram in Figure
21 is the result of the comparison of output formats supported by GetMap requests. It could
be seen from Figure 21 that GeoServer advertised 14 output data formats followed by
MapServer with nine and QGIS Server with two. Two data formats were common to all three
map servers. GeoServer ranks highest in the number of output formats supported by GetMap.

72
U= 14
7
gif,tiff
png;mode=8bit,
pdf, svg+xml,
kml+xml,
kmz
MapServer(9) GeoServer(14)
QGIS Server (2)
5
kml+xml;mode=networklink,
atom+xml,
geotiff,
geotiff8,
tiff8
0
2
jpeg
png 0
0
0
Figure 21: Venn diagram showing number of output formats supported by GetMap requests.
3.4.6 Types of Input Data Supported
Documented input data was extracted from the following urls
http://mapserver.org/input/index.html#input,http://docs.geoserver.org/stable/en/user/data/inde
x.html and http://www.qgis.org/ en/about-qgis/features.html for MapServer, GeoServer and
QGIS Server respectively. Documented input data from these sources were compared with
documented data in the respective user manuals. Table 14 shows the input data supported by
the three web map servers.

73
Table 14: Types of input data
Item MapServer GeoServer QGIS Server
1 ArcInfo Application Schema Support PostGIS
2 ArcSDE ArcGrid SpatiaLite
3 DGN ArcSDE OGR
4 Erdas .LAN/.GIS DB2 ESRI shapefiles
5 ESRI File Geodatabase External Web Feature Server MapInfo
6 ESRI Personal Geodatabase External Web Map Server SDTS
7 ESRI Shapefiles (SHP) GDAL Image Formats GML
8 GDAL GeoTIFF GDAL
9 GIF GML GRASS
10 GML GTOPO30 WMS
11 GPS Exchange Format (GPX) H2 WFS
12 Inline Image Mosaic WMS-C
13 JPEG Image Mosaic JDBC WFS-T
14 KML ImagePyramid
15 MapInfo Java Properties
16 MSSQL Microsoft SQL Server and SQL Azure
17 MySQL MySQL
18 NTF Oracle
19 OGR Oracle Georaster
20 Oracle Spatial PostGIS
21 PNG Pregeneralized Features
22 PostGIS Shapefile
23 S57 Teradata
24 SDTS VPF
25 SpatiaLite WorldImage
26 TIFF/GeoTiff Directory of spatial files
27 USGS TIGER
28 Virtual Spatial Data
29 WFS
Figure 22 shows the number of input data formats. It can be seen from Figure 22 that
MapServer support twenty various data formats followed by GeoServer with twenty six and
QGIS Server with thirteen. On the basis of these documented data MapServer shows
superiority for types of input data supported.

74
Figure 22: Number of input data supported.
3.4.7 Levels of Support for Styling
The level of support for styling was assessed as an indication of each web map server's the
level of support for overlaying thematic information over web maps. This was our measure of
the potential of each web map server to create thematic maps. Documented information
regarding SLD and SLD extensions supported by each map server were obtained from these
urls and checked with user manuals. The urls and manuals used are as follows; Mapserver:
http://mapserver.org/ogc/sld.html and The MapServer Team (2012), GeoServer:
http://docs.geoserver.org/stable/en/user/styling/index.html,http://docs.geoserver.org/stable/en/
29
26
13
Comparison of documented input data formats
MapServer
GeoServer
QGIS Server

75
user/styling/sld-extensions/index.html and (GeoServer, 2012); and for QGIS Server:
http://www.qgis.org/about-qgis/features.html#server.
Table 15 shows that all three map servers support SLD but MapServer has no SLD
extensions whilst GeoServer and QGIS Server have SLD extensions. Figure 23 indicates that
GeoServer has four extensions to SLD and QGIS has two extensions. GeoServer supports
more SLD extensions.
Table 15: Documented support for SLD and SLD Extensions.
MapServer GeoServer QGIS Server
Support for
SLD?
Yes Yes Yes
SLD
Extensions None
Geometry transformations in SLD Cartographic extensions to SLD
Point symbology in GeoServer Exchange of cartographic
rules with the GetStyle operation
Parameter substitution in SLD
Specifying symbolizers
sizes in ground units
Figure 23: Number of SLD extensions supported.

76
3.4.8 Adherence to Standards
OGC statistics (OGC, 2012a; OGC, 2012b) were analysed to evaluate the adherence to
standards of different WMS and SLD implementations. OGC classifies implementations as
one of the following:
I: The version of the software implement that particular version of WMS or SLD.
C: The version of the software complies with that particular version of WMS or SLD.
Nil: No information was found for the version of the software on OGC‘s website
(OGC, 2012b).
At the time of the analysis, there were no implemetations of type ‗C‘. Table 16 shows that
QGIS Server 1.7.4, released in 2010, implements WMS 1.3.0 and WMS 1.1.1 but does not
implement SLD. GeoServer 2.1.3, released in December 2011, implements WMS 1.0, WMS
1.1.1, WMS 1.3.0, SLD 1.1.0 and SLD 1.0. MapServer 6.0.0, released in May 2011,
implements WMS 1.0, WMS 1.1.1, WMS 1.3.0, SLD 1.1.0 and SLD 1.0. Since GeoServer
2.1.3 and MapServer 6.0.0 implement more standards (WMS and SLD) than QGIS Server
1.7.4, GeoServer and MapServer show greater adherence to OGC WMS and SLD standards.
Table 16: OGC WMS and SLD statistics of the current and previous versions of web map servers
(Source of data: OGC, 2012c)
Product Release date Type
OGC Specifications OGC
Implementated
Date
WMS
1.1.1
WMS
1.0
WMS
1.1
WMS
1.3.0
SLD
1.1.0
SLD
1.1
SLD
1.0
GeoServer
2.1.4 2012-June Server Nil Nil Nil Nil Nil Nil Nil Nil
MapServer
6.0.3 2012-May Server Nil Nil Nil Nil Nil Nil Nil Nil
QGIS
Server
1.7.4 2011-Nov. Server I Nil Nil I Nil Nil Nil 2012-04-12
GeoServer
2.1.3 2011-Dec. Server I I Nil I I Nil I 2012-02-08
MapServer
6.0.0 2011-May Server I I Nil I I Nil I 2011-05-12

77
3.4.9 User Documentation
With the quality of user documentation was the focus was on how much, how accessible,
how helpful and how usable the documentation were. Information about documentation was
gathered from official websites, links on the official website to other sources of information
and user manuals. There is documentation available for all map servers and are all-accessible.
User manuals of MapServer and GeoServer have much helpful and useful information. QGIS
Server has inadequate information in the user manual with other sources of information being
fragmented and takes time to coordinate the information. MapServer and GeoServer rank
highest in terms quality of documentation.
3.5 Summary and Analysis of Results
A summary of the results of our comparison of MapServer, GeoServer and QGIS Server are
presented in Table 17. For any criterion, the web map server that ranks highest based on our
evaluation of that criterion is shown with a tick ―√‖ .
MapServer and GeoServer are easier to install compared with QGIS Server. Cartographic
workflow in QGIS presents fewer steps but GeoServer appears attractive because of the ease
with that one can complete the loading of data and of running WMS GetMap requests. Tests
for WMS versions supported shows that MapServer supports three previous WMS versions
followed by GeoServer with one and QGIS Server with none. Mapserver supports more
WMS versions (current and previous put together). MapServer indicates superiority in the
total number of requests capabilities advertised and all its requests supported POST and GET
methods.

78
Table 17: Summary of results
Criterion MapServer GeoServer QGIS Server
Ease of installation
Ease of cartographic workflow
Level of support for displaying web maps
Types of output formats supported
Level of quality of web maps
Types of input data that can be used
Level of support for styling
Adherence to standards
User documentation
All the three map servers support SLD but MapServer has no SLD extensions whilst
GeoServer and QGIS Server have SLD extensions GeoServer supports more SLD extensions.
GeoServer advertised fourteen various output data formats that can be supported by its
GetMap, this is followed by Mapserver with nine and QGIS mapserver with two. Seven
formats were common to GeoServer and MapServer. Yet, there were no formats common to
GeoServer and QGIS Server. There were also no formats common to MapServer and QGIS
Server. GeoServer ranks highest in the number of output formats supported by its GetMap.
QGIS Server and GeoServer ranks highest regarding output formats supported by
GetFeatureInfo. Overall GeoServer shows superiority in output formats supported by WMS
requests.
Overall analysis of the output shows that GeoServer shows superiority in the number of
output formats that had same quality as input data. For all the three map servers, PNG output

79
format was supported; it displayed all the layers and had the same output quality as the input.
The results of comparing the documented input data formats indicated that MapServer
documented support for twenty-nine various data formats followed by GeoServer with
twenty-six and QGIS Server with thirteen. Based on these documented data MapServer
supports more input data.
Results of documented SLD and SLD extensions showed that all three map servers
support SLD but MapServer has no SLD extensions whilst GeoServer and QGIS Server have
SLD extensions. GeoServer support four various extensions to SLD. QGIS also has two SLD
extensions and GeoServer documents support for more SLD extensions. WMS and SLD
statistics and show that for WMS total implementation for WMS is higher than SLD but
compliance to WMS and SLD are very low. In the particular occasion of the current versions
of GeoServer, MapServer and QGIS Server used in this experiment, none of them was
acknowledged compliant with either OGC WMS or SLD. GeoServer showed greater
adherence to OGC WMS and SLD standards. MapServer and GeoServer ranks highest in
documentation. Overall, GeoServer showed superiority for most criteria.
3.6 Choice of Spatial Database Management System
GeoServer was selected as WFS connector between SMILEX (Spatial Mobile Information
and Location based Experience) software and PostgreSQL database with PostGIS spatial
database enabled (Rafoss, Sælid, Sletten, Fredrik, and Engravslia, 2010). In developing a task
controller (TC) prototype uses multiple external services such as WFS during a spraying
operation, Kaivosoja, Jackenkroll, Linkolehto, Weis and Gerhards (2014) implemented high
performance data storage for multidimensional data, PostgreSQL database with a PostGIS
extension. Kaivosoja et al. (2014) used Geoserver as one application to publish and view data
(and metadata) according to ISO- and OGC-standards. Bastin, Buchanan, Beresford, Pekel,
and Dubois (2013) presented an example of a Web-based solution proven on free and open
source software (PostGIS and GeoServer) and standards (including Web Map Services, Web
Feature Services and ) to support assessments of land-cover change. An existing PostGIS
database was coupled with GeoServer gives access to Landsat GLS data by WMS (Bastin et

80
al., 2013). For the development of a geospatial web service application for emissions
inventory spatial allocation (Gkatzoflias, Mellios and Samaras, 2013), all the required
geospatial and emission data were stored in a PostgreSQL object-relational database by using
the PostGIS.
Based on the literature reviewed in this section 3.6, PostgreSQL with PostGIS spatial
database extension was chosen for the design and implementation of GTWS. The literature
reviewed showed that PostgreSQL with PostGIS have been used with GeoServer to power
OGC based web services.
3.7 Conclusion
This chapter shows a critical evaluation of state-of-the-art technologies, tools and standards
that will be suitable for developing a GTWS in an open data and open source environment.
Three open source web map servers were assessed according to the following criteria: ease
of installation, ease of cartographic workflow, level of support for displaying web maps,
types of output formats supported, level of quality of web maps, types of input data that can
be used, level of support for styling, adherence to OGC standards and quality of the user
documentation. The following have been presented: a short literature review, definition of
cartographic workflow and design and implementation of a procedure for evaluating each
criterion has been presented. The various approaches and ages of each piece of web map
server in this evaluation were acknowledged.
The results show that installation is easiest in MapServer and GeoServer. Cartographic
workflow is easiest in GeoServer. MapServer shows superiority in the level of support for
displaying web maps. GeoServer supports the most output formats. The quality of output of
web maps in GeoServer is higher. MapServer supports the most input data forms. GeoServer
documents more support for styling. MapServer and GeoServer rank highest in the quality of
user documentation. In choosing a state-of-the-art web map server for geospatial thematic
web services, GeoServer is preferred since it showed superiority for most criteria. The criteria
can be further enriched with criteria that evaluate level of support for cartographic principles

81
such as scale, normalisation, classification and map projection. The level of support for
thematic mapping techniques can also be evaluated.
Based on the literature reviewed under section 3.6, PostgreSQL with PostGIS have been
used with GeoServer to power OGC based web services in several geospatial applications.
PostgreSQL with PostGIS spatial database extension was chosen for the design and
implementation of GTWS.

82
Chapter 4: Design Options for Geospatial
Thematic Web Service
The GTWS-1 and GTWS-2 design options are part of refereed papers published as: Owusu-Banahene, W., and
Coetzee, S. (2013). Integrating linked open data into open source web mapping. 26th
International Cartographic
Conference (ICC). Dresden. International Cartographic Association (ICA) and Owusu-Banahene, W., and
Coetzee, S. (2014). Three integration styles for combining attributes from the linked open data cloud with
geospatial data for web thematic mapping. Submitted.
4.1 Introduction
Chapter 4 provides information about various designs of a GTWS. This chapter draws on the
literature review (described in Chapter 3) to: i) conceptualise GTWS (section 4.2) and ii)
identify the evaluation criteria (requirements) for integration approaches that combine linked
data from the LOD with geometric data in a spatial database to produce thematic maps
(section 4.3). The objective of this chapter is to present the designs for the various design
options of creating web thematic maps by integrating alphanumeric linked data from the
LOD cloud with geometry in a spatial database server. Unique identifiers have been
introduced to simplify the discussion on the various design choices and its implementations,
in this chapter and the rest of the research: GTWS-1, GTWS-2 and GTWS-3. The various
design choices are described in section 4.4 in this chapter.
4.2 Conceptualisation of GTWS
The GTWS was conceptualised as having three components namely: The web mapping
(geospatial web service), integrator and linked data as shown in Figure 24. The web mapping
component is an OGC model (web service on top of a web map server) connected to an
object-relational model (spatial database) and can create cartographic models (web thematic
maps). The linked data component conversely, comprised linked data model namely, the
LOD cloud acting as linked data (RDF) source, queries (SPARQL, SPARQL Federated),

83
linked data based software (linked data servers, linked data stores), tools (linked data based
middleware) and services such as, SPARQL endpoint (or SPARQL service). The integrator
is a programme (or script) that provides the mechanism for integrating linked data into the
spatial database aiding flow of linked data from the linked data component to the web-
mapping component.
Figure 24. Diagram showing the conceptualisation of a GTWS.
The notion was to demonstrate that existing technology (web mapping, spatial database
and implementations of OGC standards) could create and visualise new information by
combining geometry with attributes from linked data in the LOD cloud. The GTWS treats the
LOD cloud as if it is just a data source (with new representation) that can be integrated with
existing web mapping services. By design, GTWS combines geometric data in a spatial
database server with non-spatial linked data from the LOD cloud and styling (SLD) to
produce thematic web maps as shown in Figure 25.
GTWS is needed in occupances where: 1) An existing WMS has to be migrated to using
linked data, 2) Statistical agencies publish statistical data as linked data to the LOD cloud and
OGC web service
(WMS+SLD)
connected to an
SDS
Web mapping
Web thematic map
Integrator
Linked Open Data Cloud
Linked data

84
3) Geospatial data is too big to be accessed over the web and or it is already available locally.
It is pleasant to create thematic maps from all the attribute data available on the Web.
Figure 25: Spatial, non- spatial (attributes) and styling components of GTWS (Source:
Owusu-Banahene and Coetzee, 2013).
4.2.1 Utilising Open source Geospatial Software to Access and Integrate Linked Data from
the LOD Cloud
In this sub-section the current relationship between open source geospatial software and the
LOD cloud and the proposed approach to improving the relationship are presented. As
indicated previously, the main challenge to consuming linked open data is the difficulty with
that open source geospatial software accesses and integrate linked data from the LOD cloud.
From Figure 26, open source geospatial software cannot integrate linked data. The
relationship can be described as disjoint. Four approaches are proposed, shown as bold in
Figure 27, by that, open source geospatial software can access and integrate linked data from
the LOD cloud. From Figure 27, the first approach considers using existing linked data
models (data, queries, services and software). The second approach considers developing
extensions to existing open source geospatial software (web mapping, desktop and geospatial
Geographic
(SQL, Spatial Queries)
Attributes
(SPARQL Queries)
Styling
(SLD)
Geospatial Thematic Web Service
Spatial database server Linked data
(RDF)
Files
spatial component non-spatial styling

85
libraries), such that they can connect to the LOD cloud. The third approach uses the
development of new open source geospatial software. With the fourth approach, entirely new
open source software has to be developed from scratch. The four approaches are not mutually
exclusive though.
Figure 26: The current relationship between free and open source geospatial software and the
LOD cloud.
Figure 27: Approach to developing free and open source geospatial software to use the LOD
cloud.
The research described in this thesis, used the existing linked data models. The
development of extensions were incorporated into the designs and implementations of
Free and Open Source Geospatial Software LOD Cloud
Web Mapping
Desktop
Geospatial Libraries
Free and Open source Software LOD Cloud
Desktop
Geospatial Libraries
Web Mapping
Extensions
Exis
tin
g lin
ked
dat
a
mo
del
s
Modification
New software

86
GTWS. GTWS-1 and GTWS-2 used existing linked data models to access the LOD cloud.
GTWS-3 used extension to existing open source geospatial software.
4.3 Identifying Requirements
4.3.1 Map Communication Model in the Linked Data Context
A map communication model conceptualises basic steps in communicating cartographic
information to a user (Dodge, Kitchin and Perkins, 2009). A map communication model was
adapted from Slocum et al. (2010) for linked data from the LOD cloud with separate
geometry in a spatial database server as shown in Figure 28.
Slocum et al. (2010) presents the following map communication model (shown as
boxes and arrows depicted with light gray in Figure 28).
1. Consider how the real world phenomenon might look like.
2. Determine the purpose of the map.
3. Collect data appropriate for the map’s purpose
4. Design and construct the map
5. Determine whether users find the map useful and informative
For this research, the map communication model by Slocum et al. (2010) was adapted
to illustrate the steps required to combine attributes from the linked open data cloud with
geospatial data in a spatial database server to create web thematic maps. The steps were
adapted as follows. The steps in the adapted model are shown as dark gray boxes and black
arrows.
1. Consider how the real world phenomenon might look like. This is done by a
cartographer so it was not included in our adapted model.
2. Determine the purpose of the map. This is presented in our adapted model as Step 1.
Select a theme. A user selects a theme for the thematic map to be created. For

87
example; , population density of all countries in the world.
3. Collect data appropriate for the map’s purpose. This became Step2 adapted model
and was expanded to include the three sub-steps required for data collection:
Step 2.a) Collect appropriate linked data (attributes) from the linked open data
cloud, for example; the population sizes of countries
Step 2.b). Identify relevant geometry in a spatial database server, for example;
country boundaries.
Step 2.c) Combine the attributes with the geometry, for example; by linking
country boundaries with corresponding population sizes through a unique identifier
such as the country name.
4. Design and construct the map was taken as Step3 expanded into five sub-steps
described below. Note the feedback loop to step 3, that allows refinement of the
thematic map, if required.
Step 3.a) Choose a thematic mapping technique, for example; the choropleth
mapping technique can be selected to show differences in population density.
Step 3.b) If required, normalise the data, for example; by calculating the
population densities of countries as a ratio of population to area.
Step 3.c) Depending on the choice of the user, the data may be presented as
classified or unclassified. For classified data, classes are created according to an
appropriate data classification method, for example; population densities could be
classified into two classes where one class includes population densities below a
certain value and the other class population densities greater than or equal to that
value.

88
3. Collect data appropriate for the map’s purpose
4. Design and construct the map
2. Determine the purpose of the map
Step 3.b) If necessary, normalise the data
Step 2.a) Collect appropriate linked data
(attributes) from the LOD cloud.
Step 2.b) Identify relevant geometry in an SDS
Step 2.c) Link the attributes with geometry
Step 1. Select a theme
Step 3.d) Apply appropriate symbology
according to thematic mapping technique
Step 3.e) Create thematic map and present it to
user through web interface
Step 3.c) Depending on user’s choice data
may be presented as classified or unclassified
Step 3.a) Choose a thematic mapping technique
1. Consider how the real world phenomenon might look
like
5. Determine whether users find the map useful and
informative
Figure 28: A map communication model in the context of linked data, adapted from Slocum
et al. (2010).

89
Step 3.d) Appropriate symbolisation applies to the data according to the choice
of thematic mapping technique, for example; for a choropleth map a different
colour is assigned to each class.
Step 3.e) Finally, the thematic map is created and presented to the user through
a web interface.
5. Determine whether users find the map useful and informative. This was included in
the adapted model as a feedback loop from Step 3.e to Step 1. The feedback loop
allows refinement of the thematic map if he does not find the map useful and
informative.
4.3.2 Requirements
The requirements describe a web service that combines attributes from the LOD cloud with
geometry in a spatial database server to produce thematic maps. The modified model with
the review of literature (see Chapter 2) and critical evaluation of technology in Chapter 3
formed the basis for identifying requirements for GTWS described in this section. GTWS-1,
GTWS-2 and GTWS-3 described in Section 4.4 met these requirements. Eight requirements
for a web service that combines attributes from the linked open data cloud with geometry in a
spatial database server to produce thematic maps are described below. The requirements
were identified with reference to the adapted map communication model.
Requirement 1. A client shall request a thematic map from a web map server (the client sends
a map request to the service).
Requirement 2. A client shall specify a theme and a thematic mapping technique in a map
request (see steps 1 and 3.a).
Requirement 3. The service shall identify the attributes to be used for the theme in the linked
open data cloud (see step 2.a).

90
Requirement 4. The service shall identify the geometry to be used for the theme in a spatial
database server (see step 2.b).
Requirement 5. The service shall combine the attributes with the geometry (see step 2.c).
Requirement 6. The service shall normalise and classify data as required (see steps 3.a and
3.b).
Requirement 7. The service shall apply symbology appropriate for the specified thematic
mapping technique (see step 3.d).
Requirement 8. The service shall create a thematic map image and return it to the client (see
step 3.e).
In addition, to the requirements above, for this research standard technology for web
mapping, linked data and spatial databases were to be used. This requirement is motivated by
the widespread deployment of standardised web map services in the geospatial community
and the widespread publication of alphanumeric data (by statistical agencies) in the LOD
cloud.
The process flow for GTWS based on these requirements and the interactions (request
and response) in the geospatial web service needed to create thematic maps are further
described in sub section 4.4.3. Requirements 3-5 distinguish GTWS from any other web
service that creates maps.
4.3.3 Process Flow Modelling
Figure 29 shows the process flow model of GTWS based on Requirements 1-8. The client
sends a request for a thematic map to the service (requirement 1). The client specifies the
theme and thematic mapping technique as part of the request for a thematic map (requirement
2). The service identifies the attributes to be used for the theme in the linked open data cloud
(requirement 3). After this, the geometry to be used for the theme is identified in a spatial
database server (requirement 4). Based on requirement 5, the service combines the attribute
with the geometry.
GTWS receives a request for a thematic map. The service checks if there is a need for
normalisation and normalises the data if required. If there is no need to normalise the data,

91
the service checks if the data has to be classified (requirement 6). If the data has to be
classified (requirement 6). Subsequently the service creates appropriate classes (requirement
6) else, it applies symbolisation to the data (requirement 7). Finally, the service creates the
thematic map and sends it back to the client in a web browser (requirement 8).
Client
Geospatial Thematic Web Service
Identify attributes
in the LOD cloud
(3)
Identify geometry
in to be used in an
SDS
(4)
Combine
attributes with
geometry
(5)
Normalisation?
(6)
Restart
Get request for
thematic map
(including theme
and technique
(1) and (2)
Create and
Visualise
Thematic map
(8)
Classification
required?
(6)
Apply
symbology to
create style
(7)
OK
No
Classify data
(6)
Normalise the
data
(6)
Yes
No
Yes
OK
No
No
Figure 29: Process flow model for GTWS.
4.4 Design Options
In this section, a geospatial thematic web service (GTWS) is introduced. Three different ways
of creating web thematic maps by combining alphanumeric linked data from the LOD cloud
with geometry in a spatial database server are presented, namely: GTWS-1, GTWS-2 and
GTWS-3. Each option integrates attributes from the LOD cloud in a different way: GTWS-1
integrates attributes from the LOD cloud by storing results of SPARQL queries
intermediately and importing them into a spatial database server; GTWS-2 does so through a
spatial database server connected to a linked data server by middleware; and GTWS-3
connects directly to the LOD cloud by an extension to the spatial database server.

92
The three different design options illustrate how an OGC model (WMS-SLD) hosted by a
web map server can produce cartographic models (web thematic maps) by combining linked
data models (attributes from the LOD cloud) with geo-relational models (geometry in a
spatial database server). The web mapping component of GTWS (shown in Figure 30) is a
typical generic architecture of a geospatial web service comprising a client as a web browser,
a web map server and a spatial database server. The web map server provides support for
WMS and SLD. SLD offers support for styling, to meet requirements 6 and 7. The spatial
database server stores geometry and provides data manipulation functionality to meet
requirements 3 and 5. The data in the spatial database server is published to the web map
server.
Figure 30: Generic architecture of the web mapping component.
A request for a thematic map is made from the client to the web map server that applies
styles, and sends a thematic map to the user by WMS, thereby satisfying requirements 1, 6
and 8. In the subsequent subsections, the three design choices for retrieving attributes from
the LOD cloud to meet requirements 4 and 5 are presented. The various design options are
described in detail in this section. Unique identifiers: GTWS-1, GTWS-2 and GTWS-3 have
been introduced to simplify the discussion on various design options.
OGC web service(s) + styling
Web map server
Spatial database server
Client (web browser)

93
4.4.1 GTWS-1: The Importer
The GTWS-1 design option follows an importer approach, as shown in Figure 31. Linked
data from the LOD cloud is retrieved by executing SPARQL queries directly against a
SPARQL endpoint (query editor) of a linked dataset. The responses to the queries (the
attributes) are stored temporarily as files in an appropriate format such as CSV that can be
integrated with a spatial database without requiring an RDF to relational mapping. A script,
the sql importer, loads the files containing the attributes into a spatial database so that the
attributes can be linked to stored geometry and used by the web mapping component. The sql
importer creates a table in the spatial database server; copies the data in the CSV file into the
table; and then creates a JOIN between the said table and the table containing the geometry
previously stored in the spatial database server.
Figure 31. GTWS-1: Importer

94
4.4.2 GTWS-2: The Middleware
In the GTWS-2 design option, referred to as the middleware, attributes from the LOD cloud
are accessed by generic SPARQL service and integrated with geometry through a linked data
server connected to a spatial database server through middleware. The middleware acts as the
integrator and can be a database connectivity driver, such as ODBC, JDBC or a wrapper. The
middleware has the capability of allowing linked data from the linked data server to be
migrated into a spatial database server. The migration of the data from the linked data server
into the spatial database server ensures that the linked data is accessed in a form that can be
integrated with the geometry in the spatial database server. Figure 32 shows this design
option.
The linked data server is an RDF store (including RDF-mapped relational database) with
or without a SPARQL endpoint. Figure 32 shows this design option. The linked data server is
an RDF store (including RDF-mapped relational database) with or without a SPARQL
endpoint.
Linked data server
(RDF store/ RDF-mapped
relational database)
Client (web browser)
OGC web service
Thematic map
Spatial database server
Web map server
LOD cloud
RDF
WMS request
Middle-
ware
Generic SPARQL endpoint
Figure 32: GTWS-2: The middleware

95
GTWS-2 retrieves attributes from the LOD cloud by SPARQL federated queries against a
generic SPARQL endpoint. The SPARQL query results (in an RDF serialised format) are
stored on the linked data server and integrated with a spatial database server by the
middleware. The web mapping component can create thematic maps by combining the
attributes with geometry stored in the spatial database.
4.4.3 GTWS-3: The Extension
In the GTWS-3 design option, the spatial database server connects directly to the LOD cloud
through a query enabled extension, as shown in Figure 33. RDF triples (attribute data) are
accessed directly from a remote SPARQL service and integrated with geometry in a spatial
database. The extension to a spatial database server is called in this research a spatial
database server extension to LOD cloud (spatial2LOD). A spatial2LOD retrieves RDF triples
(attribute data) from a remote SPARQL service and integrates them with existing geometry in
a spatial database. In its simplest form the spatial2LOD is a linked data query interface that
enables an application to process SPARQL and SPARQL-FED queries to a remote SPARQL
service. spatial2LOD utilises application programming interfaces or frameworks for building
semantic web applications that provide a programmatic environment for querying linked data
from the LOD cloud.

96
Web mapping
CLIENT (Web browser)
OGC WEB SERVICE
WEB MAP SERVER
Thematic map
LINKED OPEN DATA CLOUD
(Remote SPARQL service)
Linked data
WMS request
spatial2LOD
Integrator
SPATIAL
DATABASE
SERVER
Figure 33: GTWS-3: extension
Figure 34 shows the architecture of the spatial2LOD. spatial2LODconsists of a
lightweight application implementing an RDF query interface and a loader. Non-semantic
geometric objects are stored in the spatial database along with a unique identifier (UI). The
RDF query interface enables the application code to process SPARQL and SPARQL-FED
queries to retrieve RDF triples from a remote SPARQL service. The loader provides
connectivity to the spatial database allowing RDF triples to be integrated with the spatial
database. Integrating RDF triples into a spatial database requires the mapping of RDF to
(object-) relational database. Any of the mapping approaches discussed in section 2.3 could
be used to represent RDF triples in the spatial database. GTWS-3 uses the direct mapping of
RDF to relational database approach to integrate RDF triples into the spatial database.

97
SPATIAL DATABASE SERVER
Stored geometry
spatial2LOD
LINKED OPEN DATA CLOUD
Attribute data: RDF
Application code
RDF query interface Loader
Figure 34: Architecture of spatial database extension to LOD cloud (spatial2LOD)
GTWS-3 in its generic form uses spatial2LOD to query attributes (RDF) data from the
LOD cloud and integrates it (RDF data) into a spatial database. Similar to GTWS-1 and
GTWS-2, a client makes a request for thematic map to a web map server that hosts an OGC
web service and styling. The web map server makes a request for geometry and attributes
data from a spatial database. Style is added to the geometry and attributes data to create a
thematic map, portrayed back to the client by the OGC web service.

98
Chapter 5: Implementations
The implementations of GTWS-1 and GTWS-2 are part of refereed papers published as: Owusu-Banahene, W.,
and Coetzee, S. (2013). Integrating linked open data into open source web mapping. 26th
International
Cartographic Conference (ICC). Dresden. International Cartographic Association (ICA); and Owusu-Banahene,
W., and Coetzee, S. (2014). Three integration styles for combining attributes from the linked open data cloud
with geospatial data for web thematic mapping . Submitted.
5.1 Introduction
This chapter offers the implementation of the various options of creating web thematic maps
by integrating alphanumeric linked data from the LOD cloud with geometry in a spatial
database server. The implementations of GTWS-1, GTWS-2 and GTWS-3 are presented.
This provides empirical evidence that can be used to compare and evaluate the designs. The
implementations are integrated with existing open source geospatial software. The results
from these implementations are case studies with actual data input, processing and output
showing thematic maps with two different thematic mapping techniques - choropleth and
proportional symbols. The maps were prepared with data retrieved directly from the LOD
cloud, without any evaluation of the quality of the data. In some cases the data quality is
severely lacking, e.g. not all landlocked countries are included in the data. The focus in this
research is not on the quality of data for integration, therefore the maps were prepared with
this data, even if the quality was poor. In future work, evaluation of the data quality will have
to be addressed before integration into an SDI (see also 7.4.5).
The following software packages were selected based on the critical evaluation of
technology and review of literature in Chapter 3: GeoServer 2.1.4, PostgreSQL 9.1.4 and
PostGIS 2.0. GeoServer was required to set up a WMS, that provided support for styling
through SLD and SLD extensions, and to establish a direct connection to the PostGIS
database. PostGIS is a spatial extension to the open source PostgreSQL object-relational
database management system. The packages were chosen after a critical evaluation of
available technologies and a review of literature. The summary of findings from the review

99
showed that GeoServer and PostgreSQL/PostGIS were the most suitable free and open source
geospatial software for web mapping. The implementations and results of GTWS-1, GTWS-2
and GTWS-3 discussed in sections 5.2, 5.3 and 5.4 illustrate how linked data is accessed
from the LOD cloud and integrated with geospatial data to create thematic maps. This chapter
contributes to bridging the gap between linked data and web thematic maps.
5.2 Implementation of GTWS-1
Figure 35 is a high-level architecture showing the main components of GTWS-1: the
importer. The linked open data access-and- integration mechanism is shown in red. The
query editor was DBpedia‘s SPARQL endpoint. Linked open data in RDF were requested
from DBpedia’s Virtuoso Query Editor50
. The query response (RDF) was serialised and
stored temporarily as CSV files. The integrator was implemented as SQL scripts (importer).
These SQL scripts provided the mechanism through that linked data were fed into the web
service environment. In this section, results of thematic maps created with GTWS-1 are
presented using linked data from DBPedia since DBpedia51
is part of the LOD cloud.
50
DBpedia Virtuoso Query Editor: http://dbpedia.org/sparql 51
DBpedia: http://wiki.dbpedia.org/Interlinking

100
Web mapping
OGC web service +styling:
OGC WMS+SLD
Linked data
Client (web browser)
Temporary
storage
(Store attributes
as RDF or
suitable format)
sql importer: a script
Load data
Integrator
Thematic map
Spatial database server:
PostgreSQL/PostGIS
Web map server: GeoServer
Query editor
(Local SPARQL endpoint:
DBpedia)
LOD cloud
WMS request
SPARQL
queries
Figure 35: Implementation of GTWS-1: The importer.
5.2.1 Assessing RDF from the LOD Cloud
SPARQL queries were executed against the DBpedia OpenLink Virtuoso SPARQL end point
to retrieve all names population and population density per square kilometre of all landlocked
countries in the world (see Appendix A.1 for the SPARQL query). The result of the SPARQL
query in RDF/XML is shown in Appendix A.2. The same SPARQL query results were
serialised and stored in a CSV file (see Appendix A.3) to allow for integration into the spatial
database by SQL script. The first row with the headings was deleted to allow for consistency
in data type when the data in the file is later copied into a PostgreSQL table. A section of the
CSV file is shown below. The first, second and third values represent country name,
population and population density, respectively:
Ethiopia,82101998,74
Afghanistan,29835392,44
Uzbekistan,29559100,61
Nepal,29331000,199

101
Kazakhstan,16600000,6
Burkina Faso,15730977,57
Niger,15730754,12
Malawi,14901000,129
Zambia,12935000,17
Zimbabwe,12521000,26
Rwanda,11689696,420
5.2.2 Loading Results of SPARQL Query into Spatial Database
A spatial database in PostGIS called LOD with a table (World_Countries) containing the
names of countries and its geometric data was created. The integrator was implemented using
SQL script (importer, see Appendix A.4) to pursue the following:
1. Create a table called LandLocked in LOD.
2. Copy the data in the CSV file into the relation created in PostgreSQL;
3. Create another table WorldCountries_LandLocked by a JOIN between the two tables
World_Countries and LandLocked.
Figure 36 is a screen shot of the table WorldCountries_LandLocked in the PostGIS database.

102
Figure 36: WorldCountries_LandLocked table created in a PostGIS spatial database.
5.2.3 Connecting the PostGIS Database to GeoServer and Publishing the Data
The PostGIS spatial database (LOD) was connected to GeoServer. After a successful
connection all the tables contained in the spatial database were available to GeoServer to
allow the data in the tables to be published GeoServer‘s WMS 1.3.0. The table
WorldCountries_LandLocked was published as a new layer in WMS 1.3.0. The WMS 1.3.0
parameters; BoundingBox (BBOX) that specifies the area on Earth been mapped and
Coordinate Reference System (CRS) for the layer were specified. GeoServer computed the
BBOX as from the data as -180, -90, 180 and approximately 83.604 and extracted a Spatial
Reference System (SRS) code EPSG:4326 for the CRS. The layer can be visualised by
sending a valid GetMap request to the WMS 1.3.0. Figure 37 is a section of GeoServer‘s Edit

103
Layer user interface showing WMS 1.3.0 parameters; BBOX and CRS as specified for the
layer WorldCountries_LandLocked.
Figure 37: GeoServer‘s Edit Layer user interface for the layer WorldCountries_LandLocked.
5.2.4 Creating Styling for Choropleth Maps
Figure 38 shows the results of a GetMap request to the WMS 1.3.0 to retrieve the
WorldCountries_LandLocked layer. At this stage, GeoServer applies a default style to the
layer. A new style (XML) was created based on OGC‘s SLD to create choropleth map
showing landlocked and non-landlocked countries. The styling was based on assigning

104
different colours to polygons based on attribute data classification. See Appendix A.5 for the
content of the SLD file.
Figure 38: The results of a GetMap request to the WMS 1.3.0. (Source: Owusu-Banahene
and Coetzee, 2013).
Figure 39 is the resulting choropleth map showing landlocked and non-landlocked
countries after applying the style to the WorldCountries_LandLocked layer. Another SLD file
was created and added as a new style. When this was applied to the same
WorldCountries_LandLocked layer a new choropleth map showing the population density
(per square kilometre) of landlocked countries resulted. Figure 40 shows the choropleth map.

105
Figure 39: Choropleth map showing landlocked and non-landlocked countries in the world. (Source: Owusu-Banahene and Coetzee, 2013).
Figure 40: Choropleth map showing population density (per square kilometre) of landlocked
countries in the world. (Source: Owusu-Banahene and Coetzee, 2013).

106
5.2.5 Creating a Proportional Symbol Map
This sub-section presents a proportional symbol map showing nominal gross domestic
product (GDP) per capita of countries in the world was created. A similar procedure like the
one discussed in sub-section 5.2.4. The differences in the approach for creating proportional
symbol maps are that a new SPARQL query to DBpedia for the intended nominal GDP per
capita of countries are made. The SQL script was also modified. Different sizes of point-
based symbol (circle) were applied to distinguish between GDP per capita based classes. The
size of a circle for a particular class is proportional to the size of another circle representing
another class. The classification was proven on the GDP per capita range. The style (SLD
file) created for the proportional symbol map is shown appendix A.6. Figure 41 is the
proportional symbols map showing nominal GDP per capita of countries in the world.
Figure 41: Proportional symbols map showing nominal GDP per capita of countries in the
world (Source: Owusu-Banahene and Coetzee, 2013).
5.3 Implementation of GTWS-2: The Middleware
Figure 42 shows the implementation of GTWS-2. The OpenLink Virtuoso Universal Server
was used as a linked data server. The geometry was stored in a PostGIS. The PostGIS
database was connected to a Virtuoso database by a Virtuoso ODBC driver. Tables in the
Virtuoso database were migrated by an ODBC data source name (DSN) to PostgreSQL tables

107
with the help of the ESF database migration toolkit52
. The PostgreSQL tables were linked to
geometry in the PostGIS database by unique identifiers and published to GeoServer.
GeoServer provided the web map server functionality and support for WMS and SLD.
Client (web browser)
Linked data server:
OpenLink Virtuoso
Universal Server
OGC web service + styling:
WMS+ SLD
Thematic map:
Choropleth or
Proportional
symbol
Spatial database server:
PostgreSQL/PostGIS
Web map server: GeoServer
LOD cloud
RDF
Middleware:
Virtuoso
ODBC
driver/ESF
toolkit
Relational
Database
(Store
attributes)
WMS request:
GetMap
Generic SPARQL endpoint:
SPARQLer
Figure 42: Implementation of GTWS-2: middleware.
The proportional symbol and choropleth maps created with the GTWS-2 implementation
are shown in Figure 43 and Figure 44. The proportional symbol map in Figure 43 shows the
percentage of gross domestic product (GDP) from agriculture per country in 2010, and the
choropleth map in Figure 44 shows World Bank statistics of CO2 emissions per capita per
country in 2008. Geometric data of countries in the world was stored in a PostGIS database
while attributes (GDP from agriculture per country in 2010) were retrieved from the LOD
cloud by executing SPARQL federated queries to the World Bank Linked Data53
SPARQL
service (SPARQLer) at http://worldbank.270a.info/sparql. The responses to the queries
(attributes) were serialised as CSV and stored as tables in the Virtuoso database.
52
http://www.easyfrom.net/ 53
World Bank Linked Data: http://worldbank.270a.info/about.html

108
Figure 43: A proportional symbol map showing percentage of GDP from agriculture per
country in 2010 created with GTWS-2: the middleware.
Figure 44: A choropleth map showing CO2 per capita per country in 2008 created with
GTWS-2: the middleware.

109
The tables were migrated into PostgreSQL and linked to the geometry in the PostGIS
database by the unique country name. The PostGIS database was published to GeoServer.
SLD files styled (normalise, classify and symbolise) the data (global view of the geometry
and attribute) in the spatial database server. SLD files were applied as styles to the layers to
create the choropleth and proportional symbol maps. Map requests were sent from the
browser to the WMS to retrieve the thematic maps.
5.4 Implementation of GTWS-3
The implementation of GTWS-3 requires the creation of spatial2LOD. spatial2LOD is an
RDF query interface that enables the application code to process SPARQL and SPARQL-
FED queries to a remote SPARQL service. Apache Jena54 (simply Jena) is a Java framework
for building Semantic web applications that provides a programmatic environment for RDF
and SPARQL among others (Yue et al., 2011). The Java framework comprises several
application programme interfaces (APIs) for processing RDF (Apache Software Foundation,
2013(a)). The RDF query interfaces for GTWS-3 was created using ARQ. ARQ is a query
engine application programme interface (API) for Jena that supports the SPARQL (Apache
Software Foundation, 2013(b)) and SPARQL-FED for querying remote SPARQL service
(Apache Software Foundation, 2013(c)). Since Jena is a Java framework the application and
other components of spatial2LOD was implemented in Java.
Figure 45 shows the implementation of spatial2LOD comprises a lightweight Java
application code, an RDF query interface and a loader. The Java application code queries a
remote SPARQL query service in the LOD cloud by an RDF query interface. The loader
provided a Java Database Connectivity (JDBC) to a PostGIS spatial database allowing RDF
triples to be integrated with the spatial database. SQL and Spatial SQL queries are executed
by the application code to the PostGIS spatial database. GTWS-3 that used spatial2LOD to
query RDF data from the LOD cloud and integrating it into geometry stored in a PostGIS
spatial database as illustrated in Figure 46 is presented.
54
http://jena.apache.org/

110
For this implementation of spatial2LOD the direct mapping of RDF to relational database
approach (see section 2.3) was employed to integrate RDF triples into the PostGIS spatial
database. Geometric objects representing countries were first stored in a PostGIS along with
country names. A SPARQL query was executed programmatically by the RDF query
interface to retrieve country names and number of ethnic groups of countries from DBpedia.
The results set (all the query solution) was formatted as eXtensible Markup Language (XML)
based on the SPARQL query result XML format (Hawke, 2013) and cached locally on the
server machine.
SPATIAL DATABASE SERVER
Stored geometry:
PostgreSQL/PostGIS
spatial2LOD
LINKED OPEN DATA CLOUD
Attribute data: RDF
Application code: Java classes with SQL, Spatial and SPARQL-FED
queries
RDF query interface: Jena
ARQ API
Loader: JDBC, Read XML/Write
to PostGIS
Figure 45: Implementation of spatial database extension to LOD cloud (spatial2LOD).
The loader creates a table in PostgreSQL and reads the content of the XML into it (table).
Each row in this table is a triple. The unique id of the table, in this case the name of the
country is the subject of the triple. The column headers represent the predicates and the
column values represent the objects (values). After populating the table, the loader creates a
new table in PostGIS by joining the table containing the geometry of countries with the table

111
containing the triples. The tables are joined by the unique identifiers (country name). Tables
in the PostGIS spatial database are published to GeoServer, a web map server.
A client makes a request for a thematic map to GeoServer, that hosts an OCG WMS and
SLD. GeoServer adds style to the geometry and attributes data to create a thematic map
portrayed to the client by the WMS. SLD files styled (normalise, classify and symbolise) the
data in the spatial database server. Figure 47 is a choropleth map (created with GTWS-3)
showing human development index (HDI) of various countries in the world using RDF triples
from DBpedia.
Web mapping
Client (Web browser)
OGC web service + styling:
OGC WMS+SLD
Web map server: GeoServer
Thematic map
LOD cloud
Linked data
WMS request
spatial2LOD
Integrator
Spatial database server:
PostgreSQL/PostGIS
Figure 46: Implementation of GTWS-3: the extension.

112
Figure 47: Choropleth map (created with GTWS-3) showing human development index
(HDI) of various countries in the world using RDF triples from DBpedia.

113
Chapter 6: Results and Discussion
6.1 Introduction
The objectives of this chapter are to compare the design options and to critically evaluate the
designs and implementations against the evaluation criteria (requirements presented in
Chapter 4). Each design options GTWS-1, GTWS-2 and GTWS-3 is evaluated against the
requirements in Section 6.2. The evaluation of the implementations of the design options
compared to the requirements is presented in section 6.3. The evaluation highlights how the
requirements are met by the designs and implementations. In Sections 6.4 and 6.5, the design
options and implementations are discussed respectively. The discussions highlights the
various ways of creating web thematic maps by combining alphanumeric linked data from the
LOD cloud with geometry in a spatial database server. Comparative issues of the GTWS
approaches: GTWS-1, GTWS-2 and GTWS-3 are discussed in section 6.5. The comparative
issues are the research findings. Analysis and evaluation of the research findings are
presented in Section 6.6.
6.2 Evaluation of the Design Options against the Requirements
This section gives an overview of how the requirements are met by each design option as
shown in Table 18. In GTWS-1, GTWS-2 and GTWS-3, a client can make a map request
from the web map server hosting the service. The first requirement, a client shall request a
thematic map from a web map service (the client sends a map request to the service), is met
by all three design options. A client sends a map request to retrieve a thematic map. The
client specifies the theme and thematic mapping technique through style in the map request.
The client can request maps and styles that the service advertises. The requirement: a
client shall specify a theme and a thematic mapping technique in a map request is met by the
design options. The requirement that the service shall identify the geometry to be used for the
theme in a spatial database server is satisfied by all three design options. In each design

114
option the geometry from the spatial database server are published as layers to the web map
server that is hosting the service as pertains generally in web mapping.
Table 18. Evaluation of the design options against the requirements.
Requirement GTWS-1 GTWS-2 GTWS-3
1. A client shall request a thematic
map from a web map service
(i.e. the client sends a map
request to the service).
map request map request map request
2. A client shall specify a theme
and a thematic mapping
technique in a map request (see
steps 2 and 4.1).
Specified as
style in a map
request
Specified as style in a
map request
Specified as style in a
map request
3. The service shall identify the
geometry to be used for the
theme in a spatial database
server (see step 3.1).
Geometry is
published to
service
Geometry is published
to service
Geometry is published to
service
4. The service shall identify the
attributes to be used for the
theme in the linked open data
cloud (see step 3.2).
Service has no
direct access to
LOD cloud.
Service has oblique
access to LOD cloud
through linked data
server.
Service has translucent
access through extension
of the spatial database
server.
5. The service shall combine the
attributes with the geometry
(see step 3.3).
Done by
importer.
Done by middleware Done by spatial database
server extension
6. The service shall normalise and
classify data as required (see
steps 4.1 and 4.2).
Done by styling Done by styling Done by styling
7. The service shall apply
symbology appropriate for the
specified thematic mapping
technique (see step 4.4).
Done by styling Done by styling Done by styling
8. The service shall create a
thematic map image and return
it to the client (see step 4.5).
Done by web
map server
hosting a service
Done by web map
server hosting a service
Done by web map server
hosting a service
Each design option accesses attributes from the LOD cloud differently. In GTWS-1, the
service has no access to LOD cloud. A human agent is required to interact with the LOD
cloud. Service has oblique access to LOD cloud through linked data server in GTWS-2. With
GTWS-3, the service has translucent access through extension of the spatial database server.
The requirement; the service shall identify the attributes to be used for the theme in the linked
open data cloud, is now met by the design option though not transparent.

115
Similarly, the requirement that states that the service shall combine the attributes with the
geometry is met in each design options differently. Attributes are combined with geometry by
importer, linked data server and extension to spatial database server in GTWS-1, GTWS-2
and GTWS-3 respectively. In all three design options, the attributes are combined with the
geometry during the process of integration in the spatial database.
In all three design options, the web map server creates the thematic maps according to the
map requests from the client. The normalisation, classification and symbology are specified
as styles and used by the web map server (hosting the service) to present thematic maps to the
client. The following requirements are satisfied: the service shall normalise and classify data,
as required; the service shall apply symbology appropriate for the specified thematic
mapping technique; and the service shall create a thematic map image and return it to the
client. These three requirements are met but the normalisation, classification and symbology
are done with the help of the developer who manually creates the styles.
6.3 Evaluation of the Implementations against the requirements
Table 19 gives an overview of how the requirements are met during implementing each
design option. In GTWS-1, GTWS-2 and GTWS-3, a client can request for a thematic map
from the web map server (GeoServer) hosting a WMS. The first requirement, a client shall
request a thematic map from a web map service (the client sends a map request to the
service), is met by all three design options. A client sends WMS requests to retrieve a
thematic map. The client specifies the theme and thematic mapping technique a style in the
WMS request.
The client can request maps and styles that the WMS advertises. The requirement: a
client shall specify a theme and a thematic mapping technique in a map request is met by all
the design options. The requirement that the service shall identify the geometry to be used for
the theme in a spatial database server is satisfied by all three design options. During
implementing each design option the PostGIS tables are published as layers to the web map
server (GeoServer) hosting the WMS.

116
Table 19. Evaluation of the implementations of GTWS-1, GTWS-2 and GTWS-3 against the
requirements.
Requirement GTWS-1 GTWS-2 GTWS-3
1. A client shall request a
thematic map from a web
map service (i.e. the client
sends a map request to the
service).
Specified as WMS request. Specified as WMS
request.
Specified as WMS
request.
2. A client shall specify a
theme and a thematic
mapping technique in a
map request (see steps 2
and 4.1).
Specified as style in a
WMS request.
Specified as style in a
WMS request.
Specified as style in a
WMS request.
3. The service shall identify
the geometry to be used for
the theme in a spatial
database server (see step
3.1).
PostGIS tables are
published to GeoServer
(hosting WMS).
PostGIS tables are
published GeoServer
(hosting WMS)
PostGIS tables are
published to
GeoServer (hosting
WMS)
4. The service shall identify
the attributes to be used for
the theme in the linked
open data cloud (see step
3.2).
OGC WMS has no access
to LOD cloud. A human
agent is required to interact
with the SPARQL end
point.
OGC WMS has
access to LOD cloud
through Virtuoso
Universal server.
Service has access
through extension
(spatial2LOD).
5. The service shall combine
the attributes with the
geometry (see step 3.3).
Done by SQL script. Done by Virtuoso
ODBC driver/ESF
toolkit
Done by spatial
database server
extension
(spatial2LOD)
6. The service shall normalise
and classify data, as
required (see steps 4.1 and
4.2).
Done by OGC SLD files Done by OGC SLD
files
Done by styling OGC
SLD files
7. The service shall apply
symbology appropriate for
the specified thematic
mapping technique (see
step 4.4).
Done by OGC SLD files Done by OGC SLD Done by OGC SLD
files
8. The service shall create a
thematic map image and
return it to the client (see
step 4.5).
Done by GeoServer
hosting a WMS
Done by GeoServer
hosting a WMS
Done by GeoServer
hosting a WMS
In GTWS-1, the service has no access to LOD cloud. A human agent is required to
interact with the SPARQL endpoint. The WMS has oblique access to LOD cloud through
Virtuoso Universal Server in GTWS-2. With GTWS-3, the WMS has transluscent access

117
through extension of the spatial database server (SDSE2LOD). The requirement; the service
shall identify the attributes to be used for the theme in the linked open data cloud, is met by
the design option though not transparent.
The requirement that states that the service shall combine the attributes with the geometry
is met differently in each design options. In all three design options, the attributes are
combined with the geometry during the process of integration in the spatial database. The
web map server (GeoServer) hosting WMS only accesses the global view of the
heterogeneous data (geometry and attributes) from the spatial database server (PostGIS).
Attributes are linked to geometry by a unique identifier; the country name in the research
described in this thesis. If the country names stored with the geometry do not exactly match
the names used in the LOD cloud, the corresponding attributes are not included in the table
join. This problem can be overcome for country names by using standardised codes for
country names as published in ISO 3166-1, Codes representing names of countries and the
subdivisions – Part 1: Country codes. For other geographic features (rivers, water bodies,
roads, addresses). Standardised codes or names are not essentially published, that could cause
a join with a low percentage of matching identifiers. Intervention would subsequently be
required to improve the join. For example; , semantic technologies could be used to match the
features in the two datasets.
In all three design options, the web map server (GeoServer) hosting WMS creates the
thematic maps according to the WMS requests from the client. The normalisation,
classification and symbology are specified as OGC SLD files and used by the web map
server (hosting the WMS) to present thematic maps to the client. The following requirements
are satisfied: the service shall normalise and classify data, as required; the service shall
apply symbology appropriate for the specified thematic mapping technique; and the service
shall create a thematic map image and return it to the client. These three requirements are
met but the normalisation, classification and symbology are done with the help of the
developer who manually creates the SLD files.

118
6.4 Discussion of the Design Options
The design options GTWS-1, GTWS-2 and GTWS-3 presented in Chapter 4 represent a
model in that the spatial object is the starting point, and from there retrieving attributes as
linked data, and linking these attributes to corresponding spatial objects by unique identifiers.
In this manner, the design options represent a model by that - linked data from the LOD cloud
is integrated with geospatial data in a spatial database for thematic mapping through a
geospatial web service environment. The linked data from the LOD cloud is treated as if it
were ‗just another‘ data source in a geospatial web service environment. The three design
options follow various approaches to closing the gap between (object-relational) spatial
databases and the LOD cloud.
6.4.1 Discussion of GTWS-1: the Importer
The GTWS-1 design option is suitable when linked data is retrieved once-off from a single
linked data source in the LOD cloud. Specialised software, such as a linked data server, is not
required, but an importer has to be developed to integrate the attributes into the spatial
database server. The importer is an sql script that creates a table in a spatial database server;
copy data in a CSV file into the table; and then joins the table and another table containing
the geometry previously stored in the spatial database server. The mapping between the
linked data model and the object-relational spatial data model is done by the developer from
the SPARQL service. From the web mapping perspective, the linked data model is accessed
transparently from the LOD cloud. The conversion from linked model to object-relational
spatial model is oblique to the web map server (service). This is similar to converting a
shapefile into a spatial database: a practice still prevalent in the geospatial community.

119
6.4.2 Discussion of GTWS-2: the Middleware
GTWS-2: the middleware, the linked data were retrieved from the LOD cloud by a linked
data server connected to a spatial database server. GTWS-2 uses an intermediate linked data
server. The middleware allows linked data from the linked data server to be migrated into a
spatial database server. Migration of data from the linked data server into the spatial database
server is performed by the middleware. The middleware facilitates that linked data is
accessed in a form that can be integrated with the geometry in the spatial database server.
The conversion from linked data to relational data is done by a migration toolkit on the
server. From the geospatial web environment point of view, only object-relational data is
accessed. Access once again, to linked data and the mapping between linked data model and
the object–relational spatial model are oblique to the web map server (service). The linked
data was stored on the linked data server and integrated with a spatial database server by the
middleware. This is also a familiar approach where attribute data in one database
management system is migrated into a spatial database by middleware such as database
connectivity. GTWS-1 and GTWS-2 use an approach familiar to the geospatial community to
integrate linked data from the LOD cloud without requiring the development of new
software. Linked data is accessed and integrated by non-programmatic models.
6.4.3 Discussion of GTWS-3: the Extension
GTWS-3: the extension is a spatial database server extension connecting directly to the LOD
cloud referred to as spatial2LOD. spatial2LOD is a linked data query interface that enables
an application code to process SPARQL and SPARQL-FED queries to a remote SPARQL
service. The spatial2LOD utilises application programming interfaces or frameworks for
building Semantic web applications that provide a programmatic environment for querying
linked data from the LOD cloud.
The extension therefore retrieves RDF triples (attribute data) from a remote SPARQL
service and integrates them with existing geometry in a spatial database. In this way the LOD

120
cloud itself was treated as another database with attribute data that can be integrated with a
spatial database. The uniqueness of GTWS-3 is using an extension to enhance a spatial
database server to exploit data in a format ‗traditionally‘ unknown to the spatial database
server. From the geospatial web environment perspective, object-relational data and linked
data (attributes) are accessed. Access to linked data and the mapping between linked data
model and the object–relational spatial model are translucent to the web map server (service)
but transparent to the spatial database server. This approach is also similar to the geodatabase
model. GTWS-3 uses an approach that requires the development of new extensions
(software).
The design options treat linked data from the LOD cloud as if it were one of those data
sources in a geospatial web service environment. The opportunities and main hindrances to
implementing LOD enabled open source geospatial web services are presented. These
designs presented opportunities for developing further research in integrating the LOD cloud
with existing geospatial web services.
6.5 Discussion of the Implementations
The implementations use existing web services when they integrate RDF data with a spatial
database. The implementations of the GTWS-1, GTWS-2 and GTWS-3 show various options
of creating web thematic maps by integrating alphanumeric linked data from the LOD cloud
with geometry in a spatial database server. These implementations provide empirical
evidence used to compare and evaluate the designs.
6.5.1 Discussion of the Implementation of GTWS 1: the Importer
GTWS-1: the importer presented in section 4.4.1, retrieves linked data from the LOD cloud
by executing SPARQL queries directly against a SPARQL endpoint. An sql script, loads the
files containing the attributes into a spatial database so that the attributes can be linked to
stored geometry and used by the web mapping component. The importer was implemented
using SQL script (importer, see Appendix A.4) to accomplish the following: 1. Create a table
called LandLocked in LOD. 2. Copy the data in the CSV file into the relation created in

121
PostgreSQL; 3. Create another table WorldCountries_LandLocked by a JOIN between the
two tables World_Countries and LandLocked.
This design option is suitable when the linked data has to be retrieved from a single
linked data source in the LOD cloud. Specialised software, such as a linked data server
(Virtuoso Universal server), is not required. One limitation of this design option is that the
integrator has to be written for each instance of imports of linked data from the temporary
storage to the spatial database server.
6.5.2 Discussion of the Implementation of GTWS 2: the Middleware
GTWS-2: the middleware retrieves attributes from the LOD cloud by SPARQL federated
queries against a generic SPARQL endpoint. Tables in a linked dataserver (the Virtuoso
database) were migrated by an ODBC data source name (DSN) to PostgreSQL tables with the
help of the ESF database migration toolkit. The ODBC DSN utilised through the ESF
migration toolkit acted as the middleware. The SPARQL query results (attributes) are stored
in one of the RDF serialised formats on the linked data server and integrated with a spatial
database server by the middleware. The geometry in the PostGIS spatial database were linked
to PostgreSQL tables by unique identifiers and published to GeoServer. Web thematic maps
were created by combining the attributes with geometry stored in the spatial database server.
6.5.3 Discussion of the Implementation of GTWS 3: the Extension
GTWS-3: the extension is presented in section 4.4.3. GTWS-3 enables a spatial database
server to integrate linked data directly from the LOD cloud as RDF triples into non-linked
geometric data. The extension is an RDF query interface that enables the application code to
process SPARQL and SPARQL-FED queries to a remote SPARQL service using Apache
Jena application programme interfaces (APIs) for processing RDF and SPARQL-FED for
querying remote SPARQL service. The extension consisted of a lightweight Java application
code, an RDF query interface and a loader. The application code queries a remote SPARQL
query service in the LOD cloud by an RDF query interface. The loader provided a Java
Database Connectivity (JDBC) to a PostGIS spatial database allowing RDF triples to be

122
integrated with the spatial database. SQL and Spatial SQL queries are executed by the
application code to a spatial database. GTWS-3 shows how a data tier of a geospatial web
service can be enabled to consume linked data directly from the LOD cloud. Unlike GTWS-1
and GTWS-2 that use CSV, GTWS-3 integrates RDF triples thereby keeping the triples
intact. GTWS-3 enables a spatial database server to integrate linked data directly from the
LOD cloud.
6.6 Discussion of Comparative Issues
The gap between the LOD cloud and web mapping: Linked open data can be accessed
through a SPARQL endpoint or RDF dumps. These sources are now outside the open source
web mapping environment. Access, data conversion and data integration are some main
challenges in creating thematic maps with linked data on-the-fly since SPARQL end point
cannot be accessed directly from the web mapping environment. Open source web mapping
software and tools have to be modified to use linked open data directly and be able to process
SPARQL queries against data in the LOD cloud to overcome these challenges.
Missing data: All three implementations integrate attribute with geometry in a spatial
database server. Attributes were linked to geometry by a unique identifier such as a unique
country name. There is missing data in cases where the values of identifiers do not match.
With GTWS-2 it is challenging if attributes have to be retrieved from multiple sources since
those sources may have various representations for country names.
Time: The time it takes to retrieve the attributes from the LOD cloud and convert the linked
data model into object-relational spatial model differs. Even though no benchmarks were
done, we observed that it took less time to retrieve attributes from a local SPARQL endpoint
(GTWS-1), then to retrieve the attributes with SPARQL federated queries from a generic
SPARQL service (GTWS-2). GTWS-3 retrieves the attributes and integrates them directly
into the spatial database. Future work could do automation and benchmarking for each design
option.

123
Linked data access and integration compared to existing geospatial models: Unlike
GTWS-1 and GTWS-2 that use CSV, GTWS-3 integrates RDF triples thereby keeping the
link elements intact. In GTWS-1 linked (attribute) data is imported into a spatial database.
This can be compared to importing (any) attributes in a CSV file into a spatial database. In
GTWS-2 a connection is set up to the linked data server to link attributes from the server to
geometry in the spatial database. This is comparable to the geo-relational model where
attribute data in a database management system is linked to geometry in another database (or
file). GTWS-3 is in some ways comparable to the geodatabase model where attributes and
geometry are stored in a single spatial database. The difference is that the attributes are not
strictly in object-relational form, but stored as triples in a relational table. The
implementations of GTWS-1, GTWS-2 and GTWS-3 show that web mapping and OGC
models have to be improved to visualise linked data as thematic maps over the Internet on-
the-fly.
Creating thematic maps in real time: Firstly, on-the-fly creation of web thematic maps
with GTWS-1, GTWS-2 and GTWS-3 is challenging in the sense that SPARQL queries are
now not an integral part of a WMS request. WMS can be improved to handle linked data by
making the linked data model and processing an integral part of it. A WMS will be able to
advertise a linked data source as one of its data holdings. A client can request a map from a
WMS using the advertised linked data source. The WMS is expected to be able to create the
map using the linked data.
Secondly, linking the attributes to geometry, normalising, classifying and symbolising the
data in real time are challenging. For GTWS-1, an SQL script was written to import the
attributes stored in a file into a spatial database server. GTWS-2 implemented its own linked
data server that stores attributes retrieved from the LOD cloud. The linked data server was
connected to the PostGIS database by a user open database connectivity (ODBC) data source
name (DSN). A toolkit has to be run to migrate the attributes from the linked data server to
the PostGIS database. In each approach, the normalisation, classification and symbolisation
are done with the help of the developer who manually creates the SLD files.

124
Suitable use case: Each of the three design options can be suitable under a different use case.
GTWS-1 is suitable under use case where investment in linked data server technology does
not require the prerequisite. GTWS-2 implemented a linked data server that stores attributes
retrieved from the LOD cloud. GTWS-3 requires extending a spatial database server. In an
incident where attributes have to be retrieved from multiple sources in the LOD cloud,
GTWS-2 and GTWS-3 are more suitable because SPARQL federated queries (GTWS-2) can
be executed by the generic SPARQL endpoint to remote SPARQL services compared to a
local SPARQL endpoint that has been designed for a particular data source. GTWS-3 is even
more suitable since the linked data can be retrieved from the LOD cloud and integrated
directly into a spatial database.
Unlike the spatial data systems adding RDF support (sub-section 2.8.3), the research
described in this research shows how existing geospatial web services can incorporate new
data sources without the need to re-develop new data processing and visualisation models
from scratch. GTWS-3 requires investment into the development of extension to a spatial
data base server but GTWS-1 and GTWS-2 do not. GTWS-3 will be easier to automate
compared to GTWS-1 and GTWS-2 since the extension offered support for processing
SPARQL federated queries.
In GTWS-1, GTWS-2 and GTWS-3 linked data from the LOD cloud is integrated with
geospatial data for thematic mapping in a geospatial web service environment. The spatial
object is at the centre and attributes from RDF repositories or SPARQL endpoints are linked
to it by a unique identifier. The linked data from the LOD cloud is treated as if it were ‗just
another‘ data source in a geospatial web service environment. The three design options
follow various approaches to closing the gap between (object-relational) spatial databases and
the LOD cloud.
Linked data integration and open source geospatial paradigm: An open source geospatial
environment for the implementations proved to be suitable for the following reasons:
1. Open source geospatial software is customizable since its source code is open.
Extensions is easier to be developed (as in GTWS-3) by anyone interested.

125
2. Most open source geospatial software already implements open standards such as
OGC web services standards. OGC web services standards are internet/web-based
similar to those implemented by the semantic web (LOD cloud) notably, Uniform
Resource Identifier/Locator (URI/L), HyperText Transfer Protocol (HTTP), eXs
tensible Markup Language (XML) and Multipurpose Internet Mail Extensions (MIME).
3. The same programming languages, software development environment and tools used
in developing open source geospatial software are used in developing semantic web
technology such as the LOD cloud.
It must be highlighted that the technical knowledge and understanding the intricacies of
the linked data technology may limit the development of these LOD enabled open source
geospatial applications to apply the Web of Data – a view shared by Dadzie and Rowe
(2011).
Main challenges to creating thematic maps from linked data on-the-fly: Data access,
conversion and integration are the main challenges using WMS to create thematic maps with
linked data on-the-fly. Firstly, a SPARQL endpoint cannot be accessed directly from the
geospatial web mapping environment; and second, web map servers cannot consume RDF
data directly, and it has to be converted and integrated with a spatial database. A web map
server cannot use the linked data model and cannot process queries proven on the linked data
model. Simultaneously, web map servers in its current form cannot process the mapping of
linked data to object-relational spatial data model. It is possible though, that a web map
server is modified to be able to retrieve linked data directly from the LOD cloud. A standard
WMS enumerates a finite number of styles in that images can be generated from Layers.
These cannot be configured by the end user (Blower et al., 2013).
It is expected that geometry will be available in spatial databases into the foreseeable
future and that there is a need to integrate semantic web with existing technologies, such as
those described in this chapter. The design and implementations show that harnessing linked
data to spatial objects will be beneficial. The work by T. Zhao et al. (2008) confirms this
need. The purpose of the work is to illustrate how spatial data can be integrated with (new)

126
attributes from the LOD cloud to produce thematic maps. The attributes are retrieved from
the LOD cloud through (potentially complicated and intricate) semantic queries – only the
result of the semantic query is used on the thematic map. In this way, the benefits of semantic
queries are exploited in the Semantic Web itself and the OGC WMS is used to visualise the
semantic query results by integrating these with existing geospatial data.

127
Chapter 7: Conclusion
7.1 Introduction
Summary of results and contributions are presented in this chapter with a view on how the
objectives set out were accomplished, the research question answered and solution to the
problem found. Recommendations for future research are also discussed in this chapter.
7.2 Summary of Findings
In Chapter 2 the relevant literature and state-of-the-art technologies are reviewed. The review
assesses the current knowledge and related work relevant to this research. The following are
presented: thematic cartography, ubiquitous cartography, standards based geospatial web
services, linked data, spatial data infrastructures, data integration and open source geospatial
software. These areas constitute the features of this research from the scientific disciplines of
Cartography, GIScience and Computer Science. The chapter reveals the gap between web
thematic mapping, standards based geospatial web services, spatial data infrastructures, open
source geospatial software and linked data. Additional research is required to show how this
gap can be closed. Chapter 2 further provides a basis for identifying the evaluation criteria
(requirements) for integration approaches that combine linked data from the LOD with
geometric data in a spatial database to produce thematic maps.
Apart from the work by T. Zhao et al. (2008) and Jones et al. (2014), related work
described in Chapter 2 uses only semantic web technology. The research described in this
thesis aims to create thematic maps by integrating linked data from the LOD cloud with
geospatial data held in a spatial database. This research may benefit Cartography, GIScience
and Computer Science especially in using existing geospatial models and linked data models
for thematic web mapping. From the perspective SDI, this research will contribute to how
open diverse sources of data, such as linked data can be integrated with existing spatial data

128
managed in national and regional SDIs. This research also shows the potential of using open
source software in SDIs.
Chapter 3 shows a critical evaluation of state-of-the-art technologies, tools and standards
that will be suitable for developing a GTWS in an open data and open source environment. In
choosing the state-of-the-art webweb map server suitable for this research, GeoServer is
preferred since it showed superiority for most criteria. The criteria can be further enriched
with criteria that evaluate level of support for cartographic principles such as scale,
normalisation, classification and map projection. The level of support for thematic mapping
techniques can also be evaluated.
Chapter 4 concludes on the literature review (described in Chapter 3) to identify the
evaluation criteria (requirements) for integration approaches that combine linked data from
the LOD with geometric data in a spatial database to produce thematic maps. The chapter
presented the designs for the various options of creating web thematic maps by integrating
alphanumeric linked data from the LOD cloud with geometry in a spatial database server.
This chapter exploit existing cartographic models (see section 2.2 and sub-section 4.3.1.) and
geospatial models (see sections 2.3, 2.6, 2.7, 4.2, 4.4 and Chapter 3) in the design of a
geospatial web service that creates and visualises thematic maps from linked data models (see
sections 2.4, 2.5, 4.2, 4.4). Using the models in designing GTWS-1, GTWS-2 and GTWS-3
could benefit Cartography, GIScience and Computer by showing various choices of
integrating linked data models (Computer Science) into existing geospatial models
(GIScience) for thematic mapping (Cartography).
In Chapter 5, the implementations of GTWS-1, GTWS-2 and GTWS-3 are presented.
The GTWS-1 design option is suitable when linked data is retrieved once-off from a single
linked data source in the LOD cloud. The mapping between the linked data model and the
object-relational spatial data model is done by the developer from the SPARQL service.
From the web mapping perspective, the linked data model is accessed transparently from the
LOD cloud. The conversion from linked model to object-relational spatial model is oblique to
the web map server (service). GTWS-2 uses an intermediate linked data server. The

129
conversion from linked data to relational data is done by a migration toolkit on the server.
From the geospatial web environment point of view, only object-relational data is accessed.
Once more, access to linked data and the mapping between linked data model and the object–
relational spatial model are oblique to the web map server (service). GTWS-3 enables a
spatial database server to integrate linked data directly from the LOD cloud as RDF triples in
the spatial database. While the LOD data is presented as triples, from the geospatial web
environment point of view, the data is accessed as if it were object-relational data (translucent
access). The mapping between linked data model and the object–relational spatial model is
translucent to the web map server (service).
Chapters 4 and 5 provided the empirical evidence used to compare and evaluate the
designs and the implementations. The implementations are developed with existing open
source geospatial software. The results from these implementations are case studies with
actual data input, processing and output showing thematic maps with two different thematic
mapping techniques - choropleth and proportional symbols. The implementations and results
of GTWS-1, GTWS-2 and GTWS-3 show that the gap between current standards based
geospatial web services, SDIs, open source geospatial software, and the linked data. Some
improvements to current geospatial web services are required in the design of geospatial web
service to visualise linked data as thematic maps over the internet on-the-fly. These
improvements are required in the design of geospatial web services (such a semantic based
WMS) and in the implementation level (GeoServer‘s WMS). For instance, the current WMS
can be re-designed to respond to linked data based queries. Similarly, web map server such as
GeoServer can be modified to publish data based on linked data models as layers to WMS.
Chapter 5 further highlights that there are various approaches to extending current GIS
functionality to incorporate linked data from the LOD cloud. This research has shown that
there are situations in that existing non- semantic web technology based applications need to
consume linked data. For instance, increasingly, governments are supporting open data as a
means to leverage the potential of publicly funded data, such as the UK Government Open
Data; US Government Open Data; and European Environment Agency open data initiatives.
Visualizing the vast amounts of data available in the LOD cloud as thematic maps would

130
provide a powerful spatial analysis tool for planning and decision-making. One could do this
by using geospatial web services to integrate linked open data with geometry in a spatial
database server.
Chapter 6 critically evaluate the designs and implementations against the evaluation
criteria (requirements). In the same Chapter 6, it was indicated that geometry will be
available in spatial databases into the near future and that there is a need to integrate semantic
web with geospatial web services technologies, such as those described in this research. The
design and implementations show that harnessing linked data to spatial objects will be
beneficial. The attributes are retrieved from the LOD cloud through (potentially complicated
and intricate) semantic queries – only the result of the semantic query is used on the thematic
map. In this way, the benefits of semantic queries are exploited in the Semantic Web itself
and the OGC WMS is used to visualise the semantic query results by integrating these with
existing geospatial data.
All the eight requirements were met differently by each design option. In all three design
options, the web map server (WMS) creates the thematic maps according to the WMS
requests from the client. The normalisation, classification and symbology are specified as
OGC SLD files and used by the web map server (hosting the WMS) to present thematic maps
to the client the normalisation, classification and symbology are done with the help of the
developer who manually creates the SLD files. A standard WMS enumerates a finite number
of styles in that images can be generated from layers. The end user cannot configure this.
There is the need to improve existing web mapping and OGC technologies that make them
query, store and process linked data from the LOD cloud.
It was shown in Chapter 6 that future work could do automation and benchmarking for
each design option. Linked data access and integration in this research were compared to
existing geospatial models such the geo-relational and geo-database. It was discussed that an
open source geospatial environment for the implementations proved to be suitable. Data
access, conversion and integration are the main challenges using WMS to create thematic
maps with linked data on-the-fly. The generalised use case for each design option was

131
presented in Chapter 6 as follows. Case 1: no investment in linked data server technology
(GTWS-1), Case 2: investment in linked data technology (GTWS-2 and GTWS-3), Case 3:
attributes have to be retrieved from multiple sources in the LOD cloud (GTWS-2 and GTWS-
3), case 4: linked data has to be retrieved from the LOD cloud and integrated directly into a
spatial database (GTWS-3).
The research described in this thesis contributes to the future of Cartography, GIScience
and Computer Science by way of enabling existing geospatial data processing and
visualisation models to accommodate new data sources without developing entirely new
models. Use cases will benefit where efficient storage and processing of spatial data and less
efficiency is required for storing RDF triples. There are cases where geospatial data has to be
combined with a less bulky amount of linked data to create new geoinformation. In such a
situation there is no need to store numerous triples and there is no need to add RDF support to
existing spatial databases. For example; creating web thematic maps from linked data with
GTWS requires only statistical data to be retrieved from the LOD cloud.
This research contributes to bridging the gap between linked data and web thematic maps.
The research shows how existing geospatial web services can benefit from the Semantic Web
without transforming geospatial web services geospatial data into the semantic form. The
research presented in this thesis shows that there are various approaches to extending existing
geospatial data processing and visualisation models to incorporate linked data from the LOD
cloud.
7.3 Summary of Contributions
The main results from this research and contribution to scientific research in the disciplines of
Computer Science, GIScience and Cartography are presented in this sub-section.

132
7.3.1 Further Research Questions
This research has led to other questions that can be investigated through further research.
These questions are explained under Section 7.4. These questions include:
1. How can the client (web browser) be enhanced to create web thematic maps from
linked data?
2. What are the novel ways of creating dynamic visualisations with linked data from the
LOD cloud using GTWS? How can this process of creating dynamic visualisation
from the LOD cloud be automated?
3. What are the modifications required to make OGC web services interoperate with
linked data technology?
4. What are the new requirements for GTWS to integrate linked data from the LOD2
Cloud?
5. Can the LOD/LOD2 cloud be a part of SDIs of the future?
6. Is there a need to develop entirely new open source geospatial software that can
process both linked and non-linked data?
7. How can GTWS create thematic maps with data from the Internet of Things?
7.3.2 Design Options
The three designs were implemented in this research. Each design contributes to
understanding a particular use case of combining geospatial web services geospatial data with
other data unknown existing geospatial web services. The designs show the options for
existing geospatial web services to integrate linked data from the LOD cloud.
7.3.3 Utilising Linked Data from the LOD Cloud in the Same Way as Other Geospatial
Data
Geospatial web services now consume ‗traditional geospatial data‘ represented in data
formats such as has been shown in Table 14. This research has indicated that linked data

133
represented as RDF could be used in geospatial web services geospatial systems just like the
other data represented in Table 194. GTWS-1, GTWS-2 and GTWS-3 are showing various
ways by that data from the LOD cloud can be combined with geometry in a spatial database
server.
7.3.4 Benefits and Drawbacks of Existing Geospatial Models
The research applied existing geospatial models such as OGC web service styling, spatial
database systems and web map servers in the designs and implementations of all the GTWS
options. In doing so this research brings to the fore the drawbacks of these existing models in
the uptake of linked data. For example; this research highlights some improvements that can
be made to make these models linked data consumers. Simultaneously, these technologies
have benefitted from several years of research and development and are robust. Using these
geospatial models in the research described in this thesis stands to benefit from all these years
of research and development.
This research brings to the fore some challenges involved in creating thematic maps by
combining heterogeneous data – linked data and geospatial data. Existing geospatial models
(OGC web services, open source geospatial software, spatial data infrastructure) have to be
modified to overcome these challenges, to consume linked open data directly and be able to
process SPARQL queries against data in the LOD cloud.
7.3.5 Setting the Stage for Dynamic Visualisation of Linked Data as Web Thematic Maps
The GTWS prototypes investigated in this research set up the stage for dynamically
visualising linked data as web thematic maps. This research highlights the requirements and
challenges for creating dynamic visualisations of linked data from the LOD cloud as web
thematic maps. The LOD cloud keeps growing with data each day and geospatial web
services geospatial data will stay with us in the foreseeable future. Use cases will benefit
where up-to-date geographical information has to be harnessed from combining data from
heterogeneous sources (linked and non-linked).

134
7.3.6 Potential of Open Source Geospatial Software in the Uptake of Linked Data
The gap between open source geospatial software and the LOD cloud has been presented in
section 4.2.1. Open source geospatial software is neither able to use linked data nor connect
to the LOD cloud. The relationship can be described as disjoint. This research advances the
course of developing open source software and shows its use in consuming linked data from
the LOD cloud.
7.3.7 Extending the Current Architecture of Geospatial web service to Integrate Linked
Data from the LOD Cloud
This research contributes to the development of the future of internet GIS or Cartography by
designing a geospatial web service to create web thematic maps by combining alphanumeric
linked data with geometry in a spatial database. The designs illustrate how existing
architectures in the internet GIS can be turned into linked data consumers. The designs
implemented in the research described in this thesis, bring to the fore, the various approaches
to extending existing web mapping architecture to incorporate the LOD cloud.
Considering a client-web map server (web service)-spatial database architecture of a
geospatial web service (as discussed in section 4.4), this research highlights the approaches to
extending this architecture to integrate linked data from the LOD cloud. GTWS-1 presented
in sections 4.4.1 and 5.3 operates by an integrator to extend the geospatial web service
architecture. In the same light, GTWS-2 discussed in sections 4.4.2 and 5.4 functions through
a middleware to integrate linked data from the LOD cloud. As presented in sections 4.4.3,
4.4.4 and section 5.5 GTWS-3 extend the geospatial web service architecture through the
spatial database server and web map server extensions respectively. The possibility to extend
the client component of geospatial web service architecture will be explored in future work.
7.3.8 Bridging the Gap between Linked Open Data and Web Thematic Mapping
The literature review in Chapter 2 presented a detailed background introduction to the web-
based thematic cartography and the gap between linked data and the web thematic maps, that
strongly supports the topic of this research. With the conceptualisation, requirements

135
formulation, design options (all in Chapter 4) and the implementations of GTWS, this
research has contributed in bridging the gap between web thematic mapping and the LOD
cloud.
7.3.9 Integrating Linked Data into Spatial Data Infrastructure
From the SDI perspective, this research contributes to i) understanding open source
geospatial software and ii) the integration of linked data into geospatial data sources to create
visualisation such as thematic maps. Overall this research seeks to contribute to the technical
facet of SDI research. The various SDI initiatives in developing countries, especially in
Africa, such as the Namibian Spatial Data Infrastructure (NamSDI), the South African SDI
(SASDI) and the SDI in Ghana will benefit from this research.
7.3.10 Ubiquitous Cartography in the Context of LOD Cloud
The concept, development and trends of ubiquitous cartography-‗cartography everywhere at
any time‘ have been presented in Chapter 2 (section 2.4). This research contributes to the
discourse of ubiquitous cartography from the context of integrating the LOD cloud into
cartographic based geospatial web services such as GTWS. GTWS also adds to tackling one
of the crucial issues in cartography for the next 20 years-designing cartographic products for
new platforms (as predicted by Ormeling).
7.4 Future Work
7.4.1 Extending the Client to Integrate Linked Data
The various options for creating web thematic maps by combining linked data from the LOD
cloud with geometry in a spatial database has been presented in Section 7.3. Additional work
is required in extending the client (of a Geospatial web service) such as web browsers,
geospatial web clients (Open Layers55
, GeoExt56
, GeoExplorer57
) to create web thematic
55
http://openlayers.org/

136
maps from the combination of geospatial web services geospatial data and linked data from
the LOD cloud.
7.4.2 Dynamic Visualisation and Automation
As discussed in section 7.3, this research has set the stage for dynamic visualisation of linked
data as web thematic maps. More research is required to create the needed automations for
GTWS such that web thematic maps from the LOD cloud directly and on-the-fly in real or
near real time. How can this process of creating dynamic visualisation from the LOD cloud
be automated?
7.4.3 Modifying OGC Web Services for Linked Data Consumption
The research described in this thesis applied OGC WMS and SLD to serve and portray
thematic maps to a client. The role of OGC technology in creating dynamic visualisations
with heterogeneous data-from existing geospatial data and linked data from the LOD cloud
cannot be over emphasised. For example; WFS and WCS can be modified in a way that they
can be connected directly to the LOD cloud. Additional research into modifying existing
OGC web services to accommodate linked data technology will be required. For example; , a
WMS request can embed SPARQL (and SPARQL federated) queries to retrieve linked data
directly from the LOD cloud and create thematic maps on- the-fly. Added work on GTWS
will be required to use GEOSPARQL (Chapter 2, Sub-Section 2.6.5), one of the OGC
standards. This research will lead to creating interoperability between OGC technology (web
services) and W3C linked data technology such as SPARQL and RDF.
56
http://geoext.org/ 57
http://suite.opengeo.org/docs/latest/geoexplorer/
137
7.4.4 Integrating Linked Data from the LOD2 Cloud
GTWS now consumes linked data from the LOD cloud. The GTWS research can be extended
to consume linked data from the LOD258
- a large-scale integrating project co-funded by the
European Commission and other linked data sources such as this will be desirable.
7.4.5 Making the LOD Cloud a Part of SDIs
The LOD cloud is a potential source of geospatial data that can be used in an SDI. The LOD
cloud contains data from government (and other official sources) and non-official sources.
Integrating the LOD cloud as part of SDIs will require more research in data quality, data
security, policies and standards. Specifically, it is important to evaluate the quality of the
LOD before using it to prepare thematic maps.
7.4.6 Developing Entirely New Open Source Geospatial Software
Two approaches were proposed, shown in Figure 21, by that open source geospatial software
can connect to the LOD cloud to use linked open data. These approaches are: 1. creating
extensions to existing open source geospatial software and 2. developing entirely new
software that can use linked and non-linked data. This research used the first approach in the
implementation of GTWS-3 (Chapter 5, Section 5.5). Future work on GTWS can use the
second proposed approach of creating entirely new open source geospatial software (web
map server, desktop, spatial database servers and geospatial libraries) that can consume
linked and non-linked data.
7.4.7 Enabling Geospatial Web Services to Accommodate Internet of Things
The Internet of Things (IoT) (Ashton, 2009), represents a vision in that the Internet extends
into the real world embracing everyday objects (Mattern and Floerkemeier, 2010). Internet of
Things (IoT) will comprise billions of devices that can sense, communicate, compute and
potentially actuate (A. Zaslavsky, Perera and Georgakopoulos, 2013). Data streams coming
58
http://lod2.eu/Welcome.html

138
from these devices will challenge the traditional approaches to data management and
contribute to the emerging paradigm of big data (A. Zaslavsky et al., 2013). The question is
will it be relevant for GTWS to create web thematic maps from the data resulting from the
Internet of Things?

139
References
Abadi, D. J., Marcus, A., Madden, S. R., and Hollenbach, K. (2007, September). Scalable
semantic web data management using vertical partitioning. In Proceedings of the 33rd
international conference on Very large data bases (pp. 411-422). VLDB Endowment.
Abbas, S., and Ojo, A. (2013). Towards a Linked Geospatial Data Infrastructure. In
Technology-Enabled Innovation for Democracy, Government and Governance (pp.
196-210). Springer Berlin Heidelberg.
Abbas, S., and Ojo, A. (2014, January). Applying Design Patterns in URI Strategies--Naming
in Linked Geospatial Data Infrastructure. In System Sciences (HICSS), 2014 47th
Hawaii International Conference on (pp. 2094-2103). IEEE.
Adida, B., Birbeck, M., McCarron, S., and Herman, I. (Eds.). (2013). RDFa Core (1.1)
Syntax and processing rules for embedding RDF through attributes. Second Edition.
W3C Recommendation 22 August 2013. W3C. Retrieved from:
http://www.w3.org/TR/rdfa-syntax/
Aditya, T., and Kraak, M.-J. (2007). A search interface for an SDI: implementation and
evaluation of metadata visualization strategies. Transactions in GIS, 11(3), pp. 413-
435.
Aime, A., and Deoliveria, J. (2008). Comparing the Performance of Open source Web Map
Servers. Retrieved from: http://presentations.opengeo.org/2008_FOSS4G/
Aime, A. andMcKena, J. (2009, October). WMS Performance Shoot Out. A presentation at
Free and Open source Software for Geospatial (FOSS4G 2009). Sydney. 20-23
October. Retrieved from: http://2009.foss4g.org/presentations/
Aime, A., and McKena. J. (2010, September). Web Mapping Performance Shoot Out. A
presentation at Free and Open source Software for Geospatial (FOSS4G 2010).
Barcelona. Retrieved from: http://2010.foss4g.org/presentations_show.php?id=3374
Akıncı H., Sesli, F.A., and Doğan, S. (2012). Implementation of a web services-based SDI to
control and manage private ownership rights on coastal areas. Ocean and Coastal
Management 67 (2012), pp. 54-62.
Alam, A., Khan, L., Thuraisingham, B.(2011). Geospatial Resource Description Framework
(GRDF) and security constructs. Computer Standards and Interfaces, 33 (2011), pp.
35–41. doi:10.1016/j.csi.2010.01.002

140
Alexander, N., and Ravada, S. (2006, April). RDF object type and reification in the database.
In Data Engineering, 2006. ICDE'06. Proceedings of the 22nd International
Conference on (pp. 93-93). IEEE.
Apache Software Foundation (2013a). Getting started with Apache Jena. Retrieved from:
http://jena.apache.org/getting_started/index.html.
Apache Software Foundation (2013b). ARQ-A SPARQL Processor for Jena. Retrieved from:
http://jena.apache.org/documentation/query/index.html
Apache Software Foundation (2013c). ARQ-Querying Remote SPARQL Service. Retrieved
from: http://jena.apache.org/documentation/query/sparql-remote.html
Apanovich, Z., and Marchuk, A. (2013). Experiments on Using LOD Cloud Datasets to
Enrich the Content of a Scientific Knowledge Base. In Knowledge Engineering and
the Semantic Web (pp. 1-14). Berlin Heidelberg: Springer.
Archer, P., Smith, K., and Perego, A. (Eds.). (2009). Protocol for Web Description Resources
(POWDER): Description Resources. W3C Recommendation 1September 2009. W3C.
Retrieved from: http://www.w3.org/TR/powder-dr/
Arenas, M., Alexandre, B., Prud'hommeaux, E., Sequeda, J. (2012). A Direct Mapping of
Relational Data to RDF. W3C Recommendation 27 September 2012. W3C. Retrieved
from: http://www.w3.org/TR/rdb-direct-mapping/
Ashton, K. (2009). That ‗internet of things‘ thing. RFiD Journal, 22, pp. 97-114.
Anselin, L. (2012). From SpaceStat to CyberGIS twenty years of spatial data analysis
software. International Regional Science Review, 35(2), pp. 131-157.
Auer, S., Demter, J., Martin, M., and Lehmann, J. (2012). LODStats–an extensible
framework for high-performance dataset analytics. In Knowledge Engineering and
Knowledge Management (pp. 353-362). Berlin Heidelberg: Springer.
Auer,T., MacEachren, A.M., McCabe, C., Pezanowski, S., and Stryker, M. (2011).
HerbariaViz: A web-based client–server interface for mapping and exploring flora
observationdata. Ecological Informatics 6(2), pp.93-110.
Ballatore, A., Bertolotto, M., and Wilson, D. C. (2013). Grounding linked open data in
WordNet: The case of the OSM semantic network. In Web and Wireless
Geographical Information Systems (pp. 1-15). Berlin Heidelberg: Springer.

141
Banerjee, D., Dürst, M.J., McKenna, M., Addison, P., XenCraft, T.T., Trumble, M.,… Noji,
K. (Eds.). (2004). Web services internationalization usage scenarios. W3C Working
Group Note 30 July 2004. W3C. Retrieved from: http://www.w3.org/TR/ws-i18n-
scenarios/
Bastin, L., Buchanan, G., Beresford, A., Pekel, J. F., and Dubois, G. (2013). Open source
mapping and services for Web-based land-cover validation. Ecological Informatics,
14 (2013), pp. 9-16.
Baumann, P. (2010). OGC® WCS 2.0 Interface Standard – Core (OGC 09-110r3),Version
2.0.0. OpenGIS® Interface Standard. Open Geospatial Consortium (OGC) Inc.
Bechhofer, S., et al. (2013). Why linked data is not enough for scientists. Future Generation
Computer Systems, 29(2), pp. 599-611.
Beckett, D., and Broekstra, J. (Eds.). (2013). SPARQL Query Results XML Format. Second
Edition. W3C Recommendation Recommendation 21 March 2013. W3C. Retrieved
from: http://www.w3.org/TR/rdf-sparql-XMLres
Berners-Lee, T. (2006). Linked data. Design issues (Personal View). W3C. Retrieved from:
http://www.w3.org/DesignIssues/LinkedData.html
Berruetta, D., and Phipps, J. (Eds.) (2008). Best practice recipe for publishing RDF
vocabularies. W3C Working Group Note 28 August 2008. W3C. Retrieved from:
http://www.w3.org/TR/swbp-vocab-pub/
Birgoren, M. and Gumusay, U. (2010). Serving map with OGC standards by network. In
A.M.Brovelli., S. Dragicevic .,S. Li ., and B.Veenendaal (Eds). ISPRS archives,
XXXVIII 4/W13, 2010. International Society for Photogrammetry and Remote
Sensing.
Bizer, C., Heath, T., and Berners-Lee, T. (2009). Linked data: The story so far. International
Journal on Semantic Web and Information Systems, 5(2009), pp.1-22.
Bizer, C., Heath, T., Idehen, K., and Berners-Lee, T. (2008). Linked data on the Web
(LDOW2008). 17th international conference on World Wide Web, International
World Wide Web Conference Committee, pp. 1265-1266.
Bizer, C., Jentzsch, A., and Cyganiak, R. (2011). State of the LOD cloud, 2011. Retrieved
from: http://wifo5-03.informatik.uni-mannheim.de/lodcloud/state/
Blower, J.D., Gemmell, A.L., Griffiths, G.H., Haines, K., Santokhee, A., and Yang, X.
(2013). A Web Map Service implementation for the visualization of multidimensional

142
gridded environmental data. Environmental Modelling and Software, 47 (2013), 218-
224
Booth, D., Haas, H., McCabe F., Newcomer, E., Champion, M., Ferris, C., and Orchard, D.,
(Eds.). (2004). Web Services Architecture. W3C Working Group Note 11 February
2004. W3C. Retrieved from: http://www.w3.org/TR/ws-arch/
Bornea, M. A., Dolby, J., Kementsietsidis, A., Srinivas, K., Dantressangle, P., Udrea, O., and
Bhattacharjee, B. (2013, June). Building an efficient RDF store over a relational
database. In Proceedings of the 2013 international conference on Management of
data (pp. 121-132). ACM.
Breitman, K.K., Casanova, A.M., and Truszkowski, W. (2010). Semantic Web: Concepts,
Technologies and Applications. NASA Monographs in Systems and Software
Engineering. London: Springer.
Brisaboa, N.R., Luaces, M.R., Places, Á. R., and Seco, D. (2010). Exploiting geographic
references of documents in a geographical information retrieval system using an
ontology-based index. Geoinformatica, 14(3), pp. 307–331.
Calì, A., Calvanese, D., De Giacomo, G., and Lenzerini, M. (2013). Data integration under
integrity constraints. In Seminal Contributions to Information Systems Engineering
(pp. 335-352). Berlin Heidelberg: Springer.
Caquard, S. (2013). Cartography I Mapping narrative cartography. Progress in Human
Geography, 37(1), pp. 135-144. Doi: 10.1177/0309132511423796
Carroll, J. J., Dickinson, I., Dollin, C., Reynolds, D., Seaborne, A., and Wilkinson, K. (2004,
May). Jena: implementing the semantic web recommendations. In Proceedings of the
13th international World Wide Web conference on Alternate track papers and
posters (pp. 74-83). ACM.
Cartwright, W. (2009). Cartography and Cartographic Communication. In W. Cartwright, G.
Gartner, L. Meng and P. M. Peterson (Eds.), Cartography and Art. Lecture Notes in
Geoinformation and Cartography. Berlin Heidelberg: Springer.
Cartwright, W., Gartner, G., and Lehn, A. (2009). Maps and mapping in the eyes of artists
and cartographers – experiences from the international symposium on cartography
and art. In W. Cartwright, G. Gartner, L. Meng and P. M. Peterson (Eds.),
Cartography and Art. Lecture Notes in Geoinformation and Cartography (p. 66).
Berlin, Heidelberg: Springer.
143
Castano, S., and De Antonellis, V. (1998). A framework for expressing semantic
relationships between multiple information systems for cooperation. Information
Systems, 23(3), pp. 253-277.
Castronova, A. M., Goodall, J.L., and Elag, M.M. (2013). Models as web services using the
Open Geospatial Consortium (OGC) Web Processing Service (WPS) standard.
Environmental Modelling and Software, 41(0), pp. 72-83.
Chen, H., Yu, T., and Chen, J. Y. (2013). Semantic web meets integrative biology: a survey.
Briefings in Bioinformatics, 14(1), pp. 109-125.
Chong, E. I., Das, S., Eadon, G., and Srinivasan, J. (2005, August). An efficient SQL-based
RDF querying scheme. In Proceedings of the 31st international conference on Very
large data bases (pp. 1216-1227). VLDB Endowment.
Coetzee, S. (2009). An analysis of a data grid approach for spatial data infrastructures. PhD
research, University of Pretoria, Pretoria, South Africa.
Coetzee, S., Harvey, F., Iwaniak, A., and Cooper, A. (2013, August). Sharing and
coordinating SDIs in the age of crowdsourcing and mobile technologies. In 26th
International Cartographic Conference, Dresden, Germany. International Cartographic
Association.
Colomo-Palacios, R., Stantchev, V., and Rodríguez-González, A. (2014). Special issue on
exploiting semantic technologies with particularization on linked data over grid and
cloud architectures. Future Generation Computer Systems, 32(2014), pp.260-262.
Connolly, D. (Ed.) (2007). Gleaning Resource Descriptions from Dialects of Languages
(GRDDL). W3C Recommendation 11 September 2007. W3C. Retrieved from:
http://www.w3.org/TR/grddl/
Cooper, A. K., Rapant, P., Hjelmager, J., Laurent, D., Iwaniak, A., Coetzee, S., ... and Düren,
U. (2011,July). Extending the formal model of a spatial data infrastructure to include
volunteered geographical information. In 25th International Cartographic Conference
(ICC), Paris, France: International Cartographic Association (ICA). Retrieved from
http://researchspace.csir.co.za/dspace/handle/10204/5212
Cooper, A. K., Moellering, H., Hjelmager, J., Rapant, P., Delgado, T., Laurent, D., ... and
Rajabifard, A. (2013). A spatial data infrastructure model from the computational
viewpoint. International Journal of Geographical Information Science, 27(6), pp.
1133-1151.

144
Cooper, A. K., Coetzee, S., Rapant, P., Laurent, D., Danko, D. M., Iwaniak, A., ... and Düren,
U. (2014). Exploring the impact of a spatial data infrastructure on value-added
resellers and vice versa. In M. Buchroithner, N. Prechtel, and D. Burghardt
(Eds.).Cartography from Pole to Pole (pp. 395-404). Berlin Heidelberg: Springer.
Crampton, J.W. (2009). Cartography: maps 2.0. Progress in Human Geography, 33(1), pp.
91–100.
Crampton, J. W. (2010). Mapping: a Critical Introduction to Cartography and GIS. West
Sussex: Wiley-Blackwell.
Curry, E., O‘Donnell J., Edward Corry, E., Hasan, S., Keane, M., O‘Riain, S. (2013). Linking
building data in the cloud: Integrating cross-domain building data using linked data.
Advanced Engineering Informatics, 27(2), pp. 206-219.
Cyganiak, R. and Jentzsch, A. (2011). The Linking Open Cloud Diagram. Retrieved from:
http://lod-cloud.net/state/#domains
Dadzie, A. S., and Rowe, M. (2011). Approaches to visualising linked data: A
survey. Semantic Web, 2(2), pp. 89-124.
Das, S., Sundara, S., and Cyganiak, R. (2012). R2RML: RDB to RDF mapping language.
W3C Recommendation September 2012. W3C. Retrieved from:
http://www.w3.org/TR/r2rml/
de la Beaujardiere, J. (2006). OpenGIS® Web Map Service Implementation Specification
(OGC® 06-042), Version 1.3.0. OpenGIS® Implementation Specification. Open
Geospatial Consortium Inc.
de Longueville, B. (2010). Community-based geoportals: The next generation? Concepts and
methods for the geospatial Web 2.0. Computers, Environment and Urban Systems,
34(4), pp. 299-308,
de Mendonça, A. L. and Delazari, L. S. (2012). Remote evaluation of the execution of spatial
analysis tasks with interactive web maps: A functional and quantitative approach. The
Cartographic Journal, 72, pp. 7-20.
Díaz, L., Bröring, A., McInerney, D., Libertá, G., and Foerster, T. (2013). Publishing sensor
observations into Geospatial Information Infrastructures: A use case in fire danger
assessment. Environmental Modelling and Software, 48(2013), pp. 65-80.
145
Dobbins, C., Merabti, M., Fergus, P., Llewellyn-Jones, D., and Bouhafs, F. (2013).
Exploiting linked data to create rich human digital memories. Computer
Communications,36(15–16), pp. 1639-1656.
Dodge, M., Kitchin, R., and Perkins, C. (2009). Thinking about maps. In M. Dodge, R.
Kitchin, and C. Perkins, (Eds.). Rethinking Maps (pp 1-25). London and New York:
Routledge.
Durbha, S.S., King, R.L., Shah, V.P., and Youman, N.H. (2009). A framework for semantic
reconciliation of disparate earth observation thematic data. Computers and
Geosciences, 35 (2009), pp. 761–773.
Eddy, B. G., and Taylor, D. R. F. (2005). Exploring the concept of cybercartography using
the holonic tenets of integral theory. Modern Cartography Series,4, pp. 35-60.
Eidgenössische Technische Hochschule Zürich (ETH), Institute of Cartography (2009). QGIS
mapserver. Retrieved from: http://karlinapp.ethz.ch/qgis_wms/index.html
Ermilov, I., Martin, M., Lehmann, J., and Auer, S. (2013). Linked Open Data Statistics:
Collection and Exploitation. In Knowledge Engineering and the Semantic Web (pp.
242-249). Berlin Heidelberg: Springer.
European Environment Agency (EEA), 2014. Semantic data service. Available from:
http://semantic.eea.europa.eu/
Evangelidis, K., Ntouros, K., Makridis,S., Papatheodorou, C. (2014). Geospatial services in
the Cloud. Computers and Geosciences 63(0), pp. 116-122.
Fan, M., Fan, H., Chen N., Chen, Z., and Du, W. (2013). Active on-demand service method
proven on event-driven architecture for geospatial data retrieval. Computers and
Geosciences, 56(0), pp. 1-11.
Farnaghi, M., and Mansourian, A. (2013). Disaster planning using automated composition of
semantic OGC web services: A case study in sheltering. Computers, Environment and
Urban Systems 41 (2013), pp. 204–218.
Fensel, D. (Ed). (2011). Foundations for the Web of Information and Services. Berlin
Heidelberg: Springer.
Field K. (2012). ‗Mapping the London 2012 Olympics‘, The Cartographic Journal,49, pp.
281- 296.
Friedman, M., Levy, A. Y., and Millstein, T. D. (1999). Navigational plans for data
integration.
146
AAAI/IAAI, 1999, 67-73.
Fritz, S., McCallum, I., Schill, C., Perger, C., See, L., Schepaschenko, D., ... and Obersteiner,
M. (2012). Geo-Wiki: An online platform for improving global land cover.
Environmental Modelling and Software, 31(2012), pp.110-123.
Galiotou, E. and Fragkou, P. (2013). Applying Linked Data Technologies to Greek Open
Government Data: A Case Study. Procedia - Social and Behavioral Sciences,
73(2013), pp. 479-486.
GeoServer (2012). GeoServer User Manual (Release 2.1.4). Retrieved from:
http://docs.GeoServer.org/stable/en/user/
Gkatzoflias, D., Mellios, G., and Samaras, Z. (2013). Development of a geospatial web
service application for emissions inventory spatial allocation proven on open source
software tools. Computers and Geosciences, 52, 21-33.
Goodchild, M. F., Guo, H., Annoni, A., Bian, L., de Bie, K., Campbell, F., ... and Woodgate,
P. (2012). Next-generation digital earth. Proceedings of the National Academy of
Sciences, 109(28), pp.11088-11094.
Granell, C., Fernández, O.B., and Díaz, L. (2014). Geospatial information infrastructures to
address spatial needs in health: Collaboration, challenges and opportunities. Future
Generation Computer Systems, 31(2014), pp. 213-222.
Granell, C., Schade, S., and Hobona, G. (2010). Linked Data: Connecting Spatial Data
Infrastructures. Geospatial Web Services: Advances in Information Interoperability,
189.
Giuliani, G., Ray, N., and Lehmann, A. (2011). Grid-enabled Spatial Data Infrastructure for
environmental sciences: Challenges and opportunities. Future generation computer
systems, 27(3), pp. 292-303.
Halevy, A., Rajaraman, A., and Ordille, J. (2006, September). Data integration: the teenage
years. In Proceedings of the 32nd international conference on Very large data bases
(pp. 9-16). VLDB Endowment.
Hall, G. B., Chipeniuk, R., Feick, R. D., Leahy, M. G., and Deparday, V. (2010).
Community-based production of geographic information using open source software
and Web 2.0. International Journal of Geographical Information Science, 24(5), pp.
761-781.

147
Han, W., Yang, Z., Di, L., and Mueller, R. (2012). CropScape: A Web service based
application for exploring and disseminating US conterminous geospatial cropland
data products for decision support. Computers and Electronics in Agriculture,
84(2012), pp. 111-123.
Hartig, O., and Langegger, A. (2010). Database perspective on consuming linked data on the
Web. Datenbank Spektrum, 10(2), pp. 57–66.
Hartig, O., Mühleisen, H., and Freytag, J-C. (2009, June). Linked data for building a map of
researchers. In Proceedings of 5th
Workshop on Scripting and Development for the
Semantic Web (SFSW) at the 6th
European Semantic Web Conference, Heraklion,
Greece.
Harvey, F., Iwaniak, A., Coetzee, S., and Cooper, A. K. (2012). SDI past, present and future:
a review and status assessment. In A. Rajabifard, J. Crompvoets, M. Kalantari and B.
Kok (Eds.). Spatially Enabling Government, Industry and Citizens: Research and
Development Perspectives (pp.23-38). GSDI Association.
Hausenblas, M. (2009). Exploiting Linked Data to Build Web Applications. IEEE Internet
Computing, 13(4), pp.68-73.
Hausenblas, M. (2011). Utilising Linked Open Data in Applications. In Proceedings of Web
Intelligence Mining and Semantics, WIMS 2011, ACM 2011, May 25–27, Sogndal,
Norway.
Heath, T. (2008). How Will We Interact with the Web of Data? IEEE Internet Computing,
12(5), pp. 88-91.
Heath, T., and Bizer, C. (2011). Linked data: Evolving the web into a global data space.
Synresearch lectures on the semantic web: theory and technology, 1(1), pp.1-136.
Herzog, A. (2003). Developing cartographic applets for the Internet. In Peterson, M. P. (Ed.)
Maps and the Internet (pp. 117-130). Oxford: Elsevier.
Hjelmager, J., Moellering, H., Delgado, T., Cooper, A.K., Rajabifard, A., Rapant, P., …and
Martynenko, A. (2008). An initial formal model for spatial data infrastructures.
International Journal of Geographical Information Science, 22(11), pp. 1295–1309.
Holmes, C., Doyle, A., and Wilson, M. (2005). Towards a Free and Open source Spatial Data
Infrastructure. Proceedings of the Faraohs to Geoinformatics FIG Working Week
2005 and GSDI, 8.

148
Iosifescu-Enescu, I., Hugentobler, M., and Hurni L. (2010).Web cartography with open
standards – a solution to cartographic challenges of environmental management.
Environmental Modelling and Software, 25 (9), pp. 988–999.
ISO 3166-1, Codes for the representation of names of countries and their subdivisions – Part
1: Country codes. International Organisation for Standardisation (ISO), Geneva,
Switzerland
ISO 19109:2005, Geographic information - Rules for application schema. International
Organization for Standardization (ISO), Geneva, Switzerland
ISO 19125-1:2004, Geographic information – Simple Feature access, Part 1: Common
architecture. International Organisation for Standardisation (ISO), Geneva, Switzerland
ISO 19128:2005 Geographic information --Web Map Server Interface. International
Organisation for Standardisation (ISO), Geneva, Switzerland
Janowicz, K. (2012). Observation-Driven Geo-Ontology Engineering. Transactions in GIS
16(3), pp. 351–374.
Janowicz, K., Bröring, A. Stasch, C., Schade,S.,Everding T. and Llaves, A. (2013). A
RESTful proxy and data model for linked sensor data, International Journal of Digital
Earth, (6):3, 233-254, DOI: 10.1080/17538947.2011.614698
Janowicz, K., Schade, S., Bröring, A., Keßler, C., Maué, P., and Stasch, C. (2010). Semantic
enablement for spatial data infrastructures. Transactions in GIS, 14(2), pp.111-129.
Jones, J., Kuhn, W., Keßler, C., and Scheider, S. (2014). Making the web of data available by
web feature services. In Connecting a Digital Europe Through Location and
Place (pp. 341-361). Springer International Publishing.
Jupp, S., Malone, J., Bolleman, J., Brandizi, M., Davies, M., Garcia, L., ... and Jenkinson, A.
M. (2014). The EBI RDF platform: linked open data for the life
sciences. Bioinformatics, btt765.
Kaivosoja, J., Jackenkroll, M., Linkolehto, R., Weis, M., and Gerhards, R. (2014). Automatic
control of farming operations proven on spatial web services. Computers and
Electronics in Agriculture 100 (2014), pp. 110–115.
Kaoudi, Z., and Koubarakis, M. (2013). Distributed RDFS Reasoning Over Structured
Overlay Networks. Journal on Data Semantics, 2(4), pp. 189-227.
Kolas, D. (2008). A Benchmark for Spatial Semantic Web Systems. In International
Workshop on Scalable Semantic Web Knowledge Base Systems.

149
Kolas, D., and Self, T. (2007). Spatially-augmented knowledgebase. In The Semantic Web
(pp. 792-801). Berlin Heidelberg: Springer.
König, M., Dirnbeket, J. and Stankovski, V. (2013). Architecture of an open knowledge base
for sustainable buildings proven on Linked Data technologies. Automation in
Construction, 35(0), pp. 542-550.
Keivanloo, I. and Rilling J. (2014). Software trustworthiness 2.0—A semantic web enabled
global source code analysis approach. Journal of Systems and Software, 89(0), pp. 33-
50.
Kraak, M. J. (2001a). Settings and needs for Web cartography. In Kraak, M. J. and Brown, A.
(Eds.). Web cartography. Developments and prospects (pp. 2-7). London and New
York: Taylor and Francis.
Kraak, M. J. (2001b). Trends in cartography, In Kraak, M. J. and Brown, A. (Eds.). Web
cartography. Developments and prospects (pp. 9-19). London, New York: Taylor
andFrancis.
Krygier, J. (2003). Geographic information literacy and the WWW, In Peterson, M. P. (Ed.).
Maps and the Internet (pp. 17-33). Oxford: Elsevier.
Kwakye, M. M. (2011). A Practical Approach to Merging Multidimensional Data Models
(Master dissertation). University of Ottawa.
Lenzerini, M. (2002, June). Data integration: A theoretical perspective. In Proceedings of the
twenty-first ACM SIGMOD-SIGACT-SIGART symposium on Principles of database
systems (pp. 233-246). ACM.
Lieberman, J., Singh, R., and Goad, C. (2007a). W3C Geospatial Vocabulary. W3C Incubator
Group Report 23October 2007. Retrieved from:
http://www.w3.org/2005/Incubator/geo/XGR-geo
Lieberman, J., Singh, R., and Goad, C. (2007b). W3C Geospatial Ontologies. W3C Incubator
Group Report 23 October 2007. W3C. Retrieved from:
http://www.w3.org/2005/Incubator/geo/XGR-geo-ont
Lopez-Pellicer, F.J, Renterı´a-Agualimpia, W., Be´jar, R., Muro-Medrano, P.R., and
Zarazaga-Soria, F.J. (2011). Availability of the OGC geoprocessing standard: March
2011 reality check. Computersand Geosciences (2011),
doi:10.1016/j.cageo.2011.10.023

150
Lopez, V., Ungerb, C., Cimiano, P., and Motta, E. (2013). Evaluating question answering
over linked data. Web Semantics: Science, Services and Agents on the World Wide
Web, 21(0), pp. 3-13.
Lund, K., Eggen, A., Hadzic, D., Hafsoe, T., and Johnsen, F.T. (2007). Using web services to
realize service oriented architecture in military communication networks. IEEE
Communications Magazine 45 (10), pp. 47-53.
Lupp, M. (2007). Styled Layer Descriptor Profile of the Web Map Service Implementation
Specification(OGC® 05-078r4). Version1.1.0. OGC Implementation Specification.
Open Geospatial Consortium Inc.
MacEachren A. M. (1979). The evolution of thematic cartography/a research methodology
and historical review. The Canadian Cartographer (16)1,pp. 17-33.
Maguire, D. J., and Longley, P.A. (2005). The emergence of geoportals and its role in spatial
data infrastructures. Computers, Environment and Urban Systems, 29(1), pp. 3-14.
Manola, F., and Miller, E. (Eds.). (2004). RDF Primer. W3C Recommendation 10 February
2004. W3C. Retrieved from: http://www.w3c.org/TR/rdf-primer/
Mattern, F., and Floerkemeier, C. (2010). From the Internet of Computers to the Internet of
Things. In From active data management to event-based systems and more (pp. 242-
259). Springer Berlin Heidelberg.
Maué P., Michels, H., and Roth, M. (2012). Injecting semantic annotations into (geospatial)
web service descriptions. Semantic Web (3),pp. 385-395.
McGuinness, D. L., and van Harmelen, F. (Eds.). (2004). OWL Web Ontology Language
Overview. W3C Recommendation 10 February 2004. W3C. Retrieved from:
http://www.w3.org/TR/2004/REC-owl-features-20040210/
Mildorf, T. et. al (2014). Open Data Platform for Data Integration,Visualisation and Map
Design Bandrova, T. et al. (eds.), Thematic Cartography for the Society, Lecture
Notes in Geoinformation and Cartography. Switzerland: Springer. DOI: 10.1007/978-
3-319-08180-9_1,
Miles, A. and Bechhofer S. (Eds.). (2009). SKOS Simple Knowledge Organisation System
Reference. W3C Recommendation 18 August 2009. W3C. Retrieved from:
http://www.w3.org/TR/skos-reference/

151
Müller, M. (2006). Symbology Encoding Implementation Specification (OGC 05-077r4).
Version: 1.1.0 (revision 4). OpenGIS® Implementation Specification. Open
Geospatial Consortium Inc.
Nečaský, M., Klímek, J., Mynarz, J., Knap, T., Svátek,V., and Stárka, J. (2014). Linked data
support for filing public contracts. Computers in Industry (2014).
Nebert, D. (2004). Developing spatial data infrastructures: The SDI Cookbook. Retrieved
from: http://www.gsdi.org/docs2004/Cookbook/cookbookV2.0.pdf
Neumann, T., and Weikum, G. (2010). The RDF-3X engine for scalable management of RDF
data. The VLDB Journal, 19(1), pp. 91-113.
O‘Donnell, J., Corry, E., Hasan S., Keane, M., and Curry, E. (2013). Building performance
optimization using cross-domain scenario modeling, linked data, and complex event
processing. Building and Environment, 62(0), pp. 102-111.
Organisation for the Advancement of Structured Information Standards (OASIS) (2004). The
UDDI Technical White Paper. Retrieved from: https://www.oasis-
open.org/committees/uddi-spec/doc/spec/v3/uddi-v3.0.2-20041019.htm.
Open Geospatial Consortium (OGC) (2011). OGC Reference Model (OGC 08-062r7),
version 2.1. OpenGIS Educational/Informative document. Retrieved from:
http://www.opengis.net/doc/orm/2.1 .
Open Geospatial Consortium (OGC) (2012a). Implementation statistics. Retrieved from:
http://www.opengeospatial.org/resource/products/stats
Open Geospatial Consortium (OGC) (2012b). All registered products. Retrieved from:
http://www.opengeospatial.org/resource/products
Open Geospatial Consortium (OGC) (2012c). Implementations by specifications. Retrieved
from: http://www.opengeospatial.org/resource/products/byspecs
Open Geospatial Consortium (OGC) (2014a). OGC standards and supporting documents.
Retrieved from: http://www.opengeospatial.org/standards
Open Geospatial Consortium (OGC) (2014b). Implementation statistics. Retrieved from:
http://www.opengeospatial.org/resource/products/stats
Open Knowledge Foundation (2014). CKAN, the world’s leading open source data portal
platform. Retrieved from: http://ckan.org/

152
Ormeling, F. (2011). Cartography and geoinformation in the 20th and 21st centuries. Meta–
Carto–Semiotics, Journal for Theoretical Cartography, 4 (2011).
Owusu-Banahene, W., and Coetzee, S. (2012, October). An evaluation of the suitability of
open source web map servers for setting up a geospatial thematic web map service.
GISSA Ukubuzana 2012, Ekurhuleni, South Africa.
Owusu-Banahene, W., and Coetzee, S. (2013). Integrating linked open data into open source
web mapping. 26th
International Cartographic Conference (ICC). Dresden.
International Cartographic Associat. (ICA). Retrieved from:
http://icaci.org/files/documents/ICC_proceedings/ICC2013/_extendedAbstract/37_pro
ceeding.pdf
Owusu-Banahene, W., and Coetzee, S. (2014). Challenges to Exploiting Linked Data in
Cartographic Web Services. Submitted.
Owusu-Banahene, W., Mensah, F., Coetzee, S., Cooper, A. K., Rautenbach, V., Sinvula, K.
M., ... and Hippondoka, M. (2013). A Description of Spatial Data Infrastructure
Stakeholders in Ghana Using the ICA Model. In H. Onsrud and A. Rajabifard (Eds.).
Spatial Enablement in Support of Economic Development and Poverty Reduction:
Research, Development and Education Perspectives, (pp. 63 – 84). GSDI
Association.
Papazoglou, M.P. (2008). Web Services: Principles and Technology (pp.8, pp. 22-23). Essex:
Pearson.
Peng, Z-R., and Tsou (2003). Internet GIS: distributed geographic information services for
the internet and wireless networks (pp. 196-197). New Jersey: John Wiley and Sons.
Perry, M., and Herring, J. (Eds.). (2012). OGC GeoSPARQL - A Geographic Query
Language for RDF Data (OGC 11-052r4, 1.0.). OGC® Candidate Implementation
Standard, 2. Open Geospatial Consortium Inc.
Peterson, M.P. (2005). Pervasive public map displays. In Taylor D.R.F.(Ed.).
Cybercartography: Theory and practice (pp 349-371). Amsterdam, San Diego,
Oxford, London: Elsevier.
Pohorec, S., Zorman, M., and Kokol, P. (2013). Analysis of approaches to structured data on
the web. Computer Standards and Interfaces, 36(1), pp. 256-262.
Prud‘hommeaux, E., and Buil-Aranda, C. (2013). SPARQL 1.1 Federated Query. W3C
Recommendation20130321. W3C. Retrieved from :
http://www.w3.org/TR/sparql11-federated-query/

153
Prud‘hommeaux, E, and Seaborne, A. (2008). SPARQL Query Language for RDF. W3C
Recommendation 20080115. W3C. Retrieved from:
http://www.w3.org/TR/rdf-sparql-query/20080115
QGIS. (2013). QGIS API documentation. Retrieved from: http://qgis.org/api/2.0/index.html
Rafoss T., Sælid K., Sletten A., Fredrik G. L., and Engravslia L. (2010). Open geospatial
technology standards and their potential in plant pest risk management—GPS-enabled
mobile phones utilising open geospatial technology standards Web Feature Service
Transactions support the fighting of fire blight in Norway. Computers and Electronics
in Agriculture 74(2), pp. 336-340.
Rajabifard, A., Binns, A., Masser, I., and Williamson, I. (2006). The role of sub‐national
government and the private sector in future spatial data infrastructures.International
Journal of Geographical Information Science, 20(7), 727-741.
Ramsey, P. (2006). uDig desktop application framework. In Presentation at FOSS4G2006
conference, Lausanne, Switzerland. Retrieved from:
http://2006.foss4g.org/contributionDisplay74db.html?contribId=132andsessionId=44a
ndconfId=1
Ramsey, P. (2007). The state of open source GIS. In Presentation at FOSS4G 2007
conference,Vancouver, BC, Canada. Retrieved from:
http://refractions.net/expertise/whitepapers/
Rautenbach, V. and Coetzee, S. (2013, August). Books for SDI Education and Training in
South Africa. In 26th International Cartographic Conference, Dresden, Germany.
International Cartographic Association (ICA).
Rautenbach, V., Coetzee, S., and Iwaniak, A. (2013). Orchestrating OGC web services to
produce thematic maps in a spatial information infrastructure. Computers,
Environment and Urban Systems, 37 (2013), pp.107-120.
Rhea, S., Geels, D., Roscoe, T., and Kubiatowicz, J. (2004, June). Handling churn in a DHT.
In Proceedings of the USENIX Annual Technical Conference(pp. 127-140).
Richmond, E. R., and Keller, P. (2003). Internet cartography and official tourism destination
Web sites. In Peterson, M. P.(Ed.). Maps and the Internet (pp.77-96). Oxford:
Elsevier.
Rohloff, K., Dean, M., Emmons, I., Ryder, D., and Sumner, J. (2007, January). An evaluation
of triple-store technologies for large data stores. In On the Move to Meaningful

154
Internet Systems 2007: OTM 2007 Workshops (pp. 1105-1114). Berlin Heidelberg:
Springer.
Sae-Tang, A., and Ertz, O. (2007). Towards web services dedicated to thematic
mapping. OSGeo Journal, 3(1).
Sagar, B.D. (2010). Visualization of Spatiotemporal Behavior of Discrete Maps by
Generation of Recursive Median Elements. IEEE Transactions on Pattern Analysis
and Machine Intelligence, 32(2), pp.378-384. IEEE Computer Society.
Sahoo, S. S., Halb, W., Hellmann, S., Idehen, K., Thibodeau Jr, T., Auer, S., ... and Ezzat, A.
(2009). A survey of current approaches for mapping of relational databases to
rdf. W3C RDB2RDF Incubator Group Report.
Schmachtenberg, M., Bizer C.,, and Paulheim H. (2014, October). Adoption of the Linked
Data Best Practices in Different Topical Domains. In 13th
International Semantic
Web Conference, Trentino, Italy.
Schmachtenberg, M., Bizer C., Bizer, C., Jentzsch, A. and Cyganiak,R. (2014). Linking Open
Data cloud diagram. Retrieved from:
Schmidt, M., and Weiser, P. (2012). Web Mapping Services: Development and Trends. In M.
P. Peterson (Ed). Online maps with APIs and web services (pp. 13-21). Lecture Notes
in Geoinformation and Cartography. Berlin Heidelberg: Springer.
Scianna, A. (2013). Experimental studies for the definition of 3D geospatial web services.
Applied Geomatics, 5(1), pp. 59-71.
Seaborne, A. (Ed.). (2013a) SPARQL 1.1 Query Results JSON Format. W3C
Recommendation 21 March 2013. W3C. Retrieved from:
http://www.w3.org/TR/sparql/11-results-json.
Seaborne, A. (Ed.). (2013b). SPARQL 1.1 Query Results CSV and TSV Formats. W3C
Recommendation 21 March 2013. Retrieved from: http://www.w3.org/TR/sparql/11-
results-json.
Shanming, W., and Jianjing, S. (2008, December). Ontology-based framework for geospatial
web services. In Information Science and Engineering, 2008. ISISE'08. International
Symposium on (Vol. 2, pp. 107-110). IEEE.
Sinvula, K. M., and Coetzee, S. (2012). Exploring the potential suitability of an SDI model in
context of the National Spatial Data Infrastructure (NSDI) of Namibia.

155
Sinvula, K. M., Coetzee, S., Cooper, A. K., Nangolo, E., Owusu-Banahene, W., Rautenbach,
V., and Hipondoka, M. (2014). A Contextual ICA Stakeholder Model Approach for
the Namibian Spatial Data Infrastructure (NamSDI). In M. Buchroithner, N. Prechtel,
and D. Burghardt (Eds.). Cartography from Pole to Pole (pp. 381-394). Berlin
Heidelberg: Springer.
Slocum, T. A., McMaster, R. B., Kessler, F. C., and Howard, H. H. (2010). Thematic
Cartography and Geovisualisation. Upper Saddle, NJ : Pearson Prentice Hall.
Spanos, D. E., Stavrou, P., and Mitrou, N. (2012). Bringing relational databases into the
semantic web: A survey. Semantic Web, 3(2), pp. 169-209.
Speckmann, B., and Verbeek, K. (2010). Necklace Maps. IEEE Transactions on
Visualization and Computer Graphics, 16(6), pp.881-889. doi:
10.1109/TVCG.2010.180
Stadler, C., Lehmann, J., Höffner, K., and Auer, S. (2012). Linkedgeodata: A core for a web
of spatial open data. Semantic Web, 3(4), pp. 333-354.
Steiniger, S., and Hunter, A. J. (2012). Free and open source GIS software for building a
spatial data infrastructure. In Geospatial free and open source software in the 21st
century (pp. 247-261). Berlin Heidelberg: Springer.
Steiniger, S., and Hunter, A. J. (2013). The 2012 free and open source GIS software map–A
guide to facilitate research, development, and adoption. Computers, Environment and
Urban Systems, 39(2013), pp. 136-150.
Steve, H., and Seaborne, A. (2013). SPARQL 1.1 Query Language. W3C Recommendation
21 March 2013. W3C. Retrieved from: http://www.w3.org/TR/sparql11-query/
Stevens, J. (2015). Bivariate Choropleth Maps: A How-to Guide. Retrieved from:
http://www.joshuastevens.net/cartography/make-a-bivariate-choropleth-map/
Stigmar, H., and Harrie, L. (2011). Evaluation of analytical measures of map legibility, The
Cartographic Journal, 48, pp. 41-53.
Sun, X., Shen, S., Leptoukh, G. G., Wang, P., Di, L., and Lu, M. (2012). Development of a
web-based visualization platform for climate research using google earth. Computers
and Geosciences, 47(2012), pp.160-168.
Tait, G. M. (2005). Implementing geoportals: applications of distributed GIS. Computers,
Environment and Urban Systems, 29(1), pp. 33-47.

156
Taylor, D. R. F. (2005). The theory and practice of cybercartography: An introduction. In
Taylor, D. R. F. (Ed.), Cybercartography: Theory and practice (1-13). Amsterdam,
San Diego, Oxford, London: Elsevier.
The MapServer Team (2012). MapServer, open source web mapping platform (Release
6.0.3). Retrieved from: http://mapserver.org/about.html
Tian, Y., and Huang, M. (2012). Enhance discovery and retrieval of geospatial data using
SOA and Semantic Web technologies. Expert Systems with Applications 39(16), pp.
12522-12535.
Tyner, J. A. (2010). Principles of map design. New York : The Guilford Press.
United Kingdom (UK) Government Open Data (2014). Available from: http://data.gov.uk/
United States (US) Government Open Data (2014). Available from: https://www.data.gov/
University of Minnesota (UMN). (2013). Welcome to MapServer. Retrieved from:
http://mapserver.org/about.html
Villa, P., Molina,R., Gomarasca,M. A. and Roccatagliata E., (2012). Harmonisation
requirements and capabilities towards a European spatial data infrastructure (ESDI):
the HUMBOLDT protected areas scenario. International Journal of Digital
Earth,5(5),pp 417-438
W3C (World Wide Web Consortium) (2007a). Web Services Description Language (WSDL)
2.0. Retrieved from: http://www.w3.org/TR/2007/REC-wsdl20-adjuncts-
20070626/#_http_binding_default_rule_method .
W3C (World Wide Web Consortium) (2007b). Simple Object Access Protocol (SOAP)
Specifications. Retrieved from: http://www.w3.org/TR/soap/.
W3C (World Wide Web Consortium) OWL Working Group (2012). OWL 2 Web Ontology
Language . Second Edition. W3C Recommendation 11 December 2012. W3C.
Retrieved from: http://www.w3.org/TR/owl-overview/
W3C (World Wide Web Consortium) 2013a. SPARQL 1.1 Federated Query. W3C
Recommendation 21 March 2013. Available from: http://www.w3.org/TR/2013/REC-
sparql11-federated-query-20130321/
W3C (World Wide Web Consortium) 2013b. SPARQL 1.1 Overview. W3C
Recommendation 21 March 2013. Available from: http://www.w3.org/TR/2013/REC-
sparql11-overview-20130321/

157
W3C (World Wide Web Consortium) 2013c. SPARQL 1.1 Query Language.W3C
Recommendation 21 March 2013. Available from: http://www.w3.org/TR/2013/REC-
sparql11-query-20130321/
W3C (World Wide Web Consortium) 2013d. SPARQL Query Results XML Format (Second
Edition). W3C Recommendation 21 March 2013. Available from:
http://www.w3.org/TR/2013/REC-rdf-sparql-XMLres-20130321/
W3C (World Wide Web Consortium) 2013e. SPARQL 1.1 Query Results CSV and TSV
Formats. W3C Recommendation 21 March 2013. Available from:
http://www.w3.org/TR/2013/REC-sparql11-results-csv-tsv-20130321/.
W3C (World Wide Web Consortium) 2013f. W3C SWEO Linking Open Data community
project. Available from:
http://www.w3.org/wiki/SweoIG/TaskForces/CommunityProjects/LinkingOpenData
W3C (World Wide Web Consortium) 2014a. RDF 1.1 Concepts and Abstract Syntax. W3C
Recommendation 25 February 2014. Available from: http://www.w3.org/TR/rdf11-
concepts/
W3C (World Wide Web Consortium) 2014b. Resource Description Framework (RDF):
Concepts and Abstract Syntax. W3C Recommendation 10 February 2004. Available
from: http://www.w3.org/TR/2004/REC-rdf-concepts-20040210/#section-data-model
Villata, S., Costabello, L., Delaforge, N., and Gandon, F. (2013). A Social Semantic Web
Access Control Model. Journal on Data Semantics, 2(1), pp.21-36.
Van Hage, W. R., Wielemaker, J., and Schreiber, G. (2010). The space package: Tight
integration between space and semantics. Transactions in GIS, 14(2), pp. 131-146.
Vavliakis, K. N., Grollios, T. K., and Mitkas, P. A. (2013). RDOTE–Publishing Relational
Databases into the Semantic Web. Journal of Systems and Software, 86(1), pp. 89-99.
Vidal, J. C., Lama, M., Otero-García, E., and Bugarín, A. (2014). Graph-based semantic
annotation for enriching educational content with linked data. Knowledge-Based
Systems, 55(2014), pp. 29-42.
Von Hagen, C. (2007). Towards a spatial data infrastructure for Somalia using open source
standards, Journal of Spatial Science, 52(1), pp. 157-169.

158
Vretanos P.A. (2010). OpenGIS Web Feature Service 2.0 Interface Standard (OGC 09-025r1
and ISO/DIS 19142), Version 2.0.0. OpenGIS Implementation Standard. Open
Geospatial Consortium Inc.
Wang, S., Anselin, L., Bhaduri, B., Crosby, C., Goodchild, M. F., Liu, Y., and Nyerges, T. L.
(2013). CyberGIS software: a synthetic review and integration roadmap. International
Journal of Geographical Information Science, 27(11), pp.2122-2145.
Walker Johnson, G., Gaylord, A. G., Franco, J. C., Cody, R. P., Brady, J. J., Manley, W., ...
and Tweedie, C. E. (2011). Development of the Arctic Research Mapping Application
(ARMAP): interoperability challenges and solutions. Computers and
Geosciences, 37(11), pp. 1735-1742.
Weiss, C., Karras, P., and Bernstein, A. (2008). Hexastore: sextuple indexing for semantic
web data management. Proceedings of the VLDB Endowment, 1(1), pp. 1008-1019.
Wiegand, N., Kolas, D., and Berg-Cross, G. (2010). Intersecting semantic web and geospatial
technologies, Transactions in GIS, 14, pp. 93–95.
Yang, C., Chen, N., and Di, L. (2012). RESTFul based heterogeneous Geoprocessing
workflow interoperation for Sensor Web Service. Computers and Geosciences,
47(2012), pp. 102-110.
Yang, P., Cao, Y. and Evans, J. (2007). WMS Performance and Client Design Principles.
Journal of GIScience and Remote Sensing, 44(4), pp. 320-333.
Yu, S., and Spaccapietra, S. (2010). A knowledge infrastructure for intelligent query
answering in location-based services. Geoinformatica, 14(3), pp. 14:379–404.
Yue, P., Di, L., Wei, Y., and Han, W. (2013). Intelligent services for discovery of complex
geospatial features from remote sensing imagery. ISPRS Journal of Photogrammetry
and Remote Sensing 83(2013), pp. 151-164.
Yue, P., Gong, J., Di, L., He, L., and Wei, Y. (2011). Integrating semantic web technologies
and geospatial catalog services for geospatial information discovery and processing in
cyberinfrastructure. Geoinformatica, 15(2), 273-303.
Zaslavsky, A., Perera, C., and Georgakopoulos, D. (2013). Sensing as a service and big
data. arXiv preprint arXiv:1301.0159.
Zaslavsky, I. (2003). Online cartography with XML. In Peterson, M. P. (Ed.). Maps and the
Internet (pp. 171-196). Oxford: Elsevier.

159
Zhao, P., Foerster, T., and Yue, P. (2012). The geoprocessing web. Computers and
Geosciences 47 (10), pp. 3–12.
Zhao, J., Miles, A., Klyne, G., and Shotton, D. (2009). Linked data and provenance in
biological data webs. Briefings in bioinformatics, 10(2), pp. 139-152.
Zhao, T., Zhang, C., Wei, M., and Peng, Z. R. (2008). Ontology-based geospatial data query
and integration. In Geographic Information Science (pp. 370-392). Berlin Heidelberg
: Springer.

160
Appendix A. Implementation of GTWS-1
A.1 SPARQL Query 1
SPARQL query to retrieve all names population and population density per square kilometer
of all landlocked countries in the world.
PREFIX type: <http://dbpedia.org/class/yago/>
PREFIX prop: <http://dbpedia.org/property/>
SELECT ?country_name ?population ?populationDensity
WHERE {
?country a type:LandlockedCountries; rdfs:label?country_name ;
prop:populationEstimate?population;prop:populationDensityKm
?populationDensity.
FILTER (langMatches(lang(?country_name), "EN")).
}
A.2 Response to SPARQL Query 1 in RDF/XML
<rdf:RDF xmlns:res="http://www.w3.org/2005/sparql-results#"
xmlns:rdf="http://www.w3.org/1999/02/22-rdf-syntax-ns#">
<rdf:Description rdf:nodeID="rset">
<rdf:type rdf:resource="http://www.w3.org/2005/sparql-
results#ResultSet" />
<res:resultVariable>country_name</res:resultVariable>
<res:resultVariable>population</res:resultVariable>
<res:resultVariable>populationDensity</res:resultVariable>
<res:solution rdf:nodeID="r0">
<res:binding
rdf:nodeID="r0c0"><res:variable>country_name</res:variable><res:valu
e xml:lang="en">Luxembourg</res:value></res:binding>
<res:binding
rdf:nodeID="r0c1"><res:variable>population</res:variable><res:value
datatype="http://www.w3.org/2001/XMLSchema#int">509074</res:value></
res:binding>
<res:binding
rdf:nodeID="r0c2"><res:variable>populationDensity</res:variable><res
:value
datatype="http://www.w3.org/2001/XMLSchema#int">194</res:value></res
:binding>
</res:solution>
<res:solution rdf:nodeID="r1">

161
<res:binding
rdf:nodeID="r1c0"><res:variable>country_name</res:variable><res:valu
e xml:lang="en">Switzerland</res:value></res:binding>
<res:binding
rdf:nodeID="r1c1"><res:variable>population</res:variable><res:value
datatype="http://www.w3.org/2001/XMLSchema#int">7952600</res:value><
/res:binding>
<res:binding
rdf:nodeID="r1c2"><res:variable>populationDensity</res:variable><res
:value
datatype="http://www.w3.org/2001/XMLSchema#int">188</res:value></res
:binding>
</res:solution>
<res:solution rdf:nodeID="r2">
<res:binding
rdf:nodeID="r2c0"><res:variable>country_name</res:variable><res:valu
e xml:lang="en">Tajikistan</res:value></res:binding>
<res:binding
rdf:nodeID="r2c1"><res:variable>population</res:variable><res:value
datatype="http://www.w3.org/2001/XMLSchema#int">7616000</res:value><
/res:binding>
<res:binding
rdf:nodeID="r2c2"><res:variable>populationDensity</res:variable><res
:value
datatype="http://www.w3.org/2001/XMLSchema#int">49</res:value></res:
binding>
</res:solution>
<res:solution rdf:nodeID="r3">
<res:binding
rdf:nodeID="r3c0"><res:variable>country_name</res:variable><res:valu
e xml:lang="en">Swaziland</res:value></res:binding>
<res:binding
rdf:nodeID="r3c1"><res:variable>population</res:variable><res:value
datatype="http://www.w3.org/2001/XMLSchema#int">1185000</res:value><
/res:binding>
<res:binding
rdf:nodeID="r3c2"><res:variable>populationDensity</res:variable><res
:value
datatype="http://www.w3.org/2001/XMLSchema#int">68</res:value></res:
binding>
</res:solution>
<res:solution rdf:nodeID="r4">
<res:binding
rdf:nodeID="r4c0"><res:variable>country_name</res:variable><res:valu
e xml:lang="en">Azerbaijan</res:value></res:binding>
<res:binding
rdf:nodeID="r4c1"><res:variable>population</res:variable><res:value

162
datatype="http://www.w3.org/2001/XMLSchema#int">9165000</res:value><
/res:binding>
<res:binding
rdf:nodeID="r4c2"><res:variable>populationDensity</res:variable><res
:value
datatype="http://www.w3.org/2001/XMLSchema#int">106</res:value></res
:binding>
</res:solution>
<res:solution rdf:nodeID="r5">
<res:binding
rdf:nodeID="r5c0"><res:variable>country_name</res:variable><res:valu
e xml:lang="en">San Marino</res:value></res:binding>
<res:binding
rdf:nodeID="r5c1"><res:variable>population</res:variable><res:value
datatype="http://www.w3.org/2001/XMLSchema#int">31887</res:value></r
es:binding>
<res:binding
rdf:nodeID="r5c2"><res:variable>populationDensity</res:variable><res
:value
datatype="http://www.w3.org/2001/XMLSchema#int">501</res:value></res
:binding>
</res:solution>
<res:solution rdf:nodeID="r6">
<res:binding
rdf:nodeID="r6c0"><res:variable>country_name</res:variable><res:valu
e xml:lang="en">Kazakhstan</res:value></res:binding>
<res:binding
rdf:nodeID="r6c1"><res:variable>population</res:variable><res:value
datatype="http://www.w3.org/2001/XMLSchema#int">16600000</res:value>
</res:binding>
<res:binding
rdf:nodeID="r6c2"><res:variable>populationDensity</res:variable><res
:value
datatype="http://www.w3.org/2001/XMLSchema#int">6</res:value></res:b
inding>
</res:solution>
<res:solution rdf:nodeID="r7">
<res:binding
rdf:nodeID="r7c0"><res:variable>country_name</res:variable><res:valu
e xml:lang="en">Uzbekistan</res:value></res:binding>
<res:binding
rdf:nodeID="r7c1"><res:variable>population</res:variable><res:value
datatype="http://www.w3.org/2001/XMLSchema#int">29559100</res:value>
</res:binding>
<res:binding
rdf:nodeID="r7c2"><res:variable>populationDensity</res:variable><res
:value

163
datatype="http://www.w3.org/2001/XMLSchema#int">61</res:value></res:
binding>
</res:solution>
<res:solution rdf:nodeID="r8">
<res:binding
rdf:nodeID="r8c0"><res:variable>country_name</res:variable><res:valu
e xml:lang="en">Kyrgyzstan</res:value></res:binding>
<res:binding
rdf:nodeID="r8c1"><res:variable>population</res:variable><res:value
datatype="http://www.w3.org/2001/XMLSchema#int">5550239</res:value><
/res:binding>
<res:binding
rdf:nodeID="r8c2"><res:variable>populationDensity</res:variable><res
:value
datatype="http://www.w3.org/2001/XMLSchema#int">27</res:value></res:
binding>
</res:solution>
<res:solution rdf:nodeID="r9">
<res:binding
rdf:nodeID="r9c0"><res:variable>country_name</res:variable><res:valu
e xml:lang="en">Slovakia</res:value></res:binding>
<res:binding
rdf:nodeID="r9c1"><res:variable>population</res:variable><res:value
datatype="http://www.w3.org/2001/XMLSchema#int">5445324</res:value><
/res:binding>
<res:binding
rdf:nodeID="r9c2"><res:variable>populationDensity</res:variable><res
:value
datatype="http://www.w3.org/2001/XMLSchema#int">111</res:value></res
:binding>
</res:solution>
<res:solution rdf:nodeID="r10">
<res:binding
rdf:nodeID="r10c0"><res:variable>country_name</res:variable><res:val
ue xml:lang="en">Hungary</res:value></res:binding>
<res:binding
rdf:nodeID="r10c1"><res:variable>population</res:variable><res:value
datatype="http://www.w3.org/2001/XMLSchema#int">10014324</res:value>
</res:binding>
<res:binding
rdf:nodeID="r10c2"><res:variable>populationDensity</res:variable><re
s:value
datatype="http://www.w3.org/2001/XMLSchema#int">107</res:value></res
:binding>
</res:solution>
<res:solution rdf:nodeID="r11">

164
<res:binding
rdf:nodeID="r11c0"><res:variable>country_name</res:variable><res:val
ue xml:lang="en">Austria</res:value></res:binding>
<res:binding
rdf:nodeID="r11c1"><res:variable>population</res:variable><res:value
datatype="http://www.w3.org/2001/XMLSchema#int">8414638</res:value><
/res:binding>
<res:binding
rdf:nodeID="r11c2"><res:variable>populationDensity</res:variable><re
s:value
datatype="http://www.w3.org/2001/XMLSchema#int">1003</res:value></re
s:binding>
</res:solution>
<res:solution rdf:nodeID="r12">
<res:binding
rdf:nodeID="r12c0"><res:variable>country_name</res:variable><res:val
ue xml:lang="en">Armenia</res:value></res:binding>
<res:binding
rdf:nodeID="r12c1"><res:variable>population</res:variable><res:value
datatype="http://www.w3.org/2001/XMLSchema#int">3262200</res:value><
/res:binding>
<res:binding
rdf:nodeID="r12c2"><res:variable>populationDensity</res:variable><re
s:value
datatype="http://www.w3.org/2001/XMLSchema#int">108</res:value></res
:binding>
</res:solution>
<res:solution rdf:nodeID="r13">
<res:binding
rdf:nodeID="r13c0"><res:variable>country_name</res:variable><res:val
ue xml:lang="en">Afghanistan</res:value></res:binding>
<res:binding
rdf:nodeID="r13c1"><res:variable>population</res:variable><res:value
datatype="http://www.w3.org/2001/XMLSchema#int">29835392</res:value>
</res:binding>
<res:binding
rdf:nodeID="r13c2"><res:variable>populationDensity</res:variable><re
s:value
datatype="http://www.w3.org/2001/XMLSchema#int">44</res:value></res:
binding>
</res:solution>
<res:solution rdf:nodeID="r14">
<res:binding
rdf:nodeID="r14c0"><res:variable>country_name</res:variable><res:val
ue xml:lang="en">Botswana</res:value></res:binding>
<res:binding
rdf:nodeID="r14c1"><res:variable>population</res:variable><res:value

165
datatype="http://www.w3.org/2001/XMLSchema#int">2029307</res:value><
/res:binding>
<res:binding
rdf:nodeID="r14c2"><res:variable>populationDensity</res:variable><re
s:value
datatype="http://www.w3.org/2001/XMLSchema#int">3</res:value></res:b
inding>
</res:solution>
<res:solution rdf:nodeID="r15">
<res:binding
rdf:nodeID="r15c0"><res:variable>country_name</res:variable><res:val
ue xml:lang="en">Burundi</res:value></res:binding>
<res:binding
rdf:nodeID="r15c1"><res:variable>population</res:variable><res:value
datatype="http://www.w3.org/2001/XMLSchema#int">10216190</res:value>
</res:binding>
<res:binding
rdf:nodeID="r15c2"><res:variable>populationDensity</res:variable><re
s:value
datatype="http://www.w3.org/2001/XMLSchema#int">367</res:value></res
:binding>
</res:solution>
<res:solution rdf:nodeID="r16">
<res:binding
rdf:nodeID="r16c0"><res:variable>country_name</res:variable><res:val
ue xml:lang="en">Ethiopia</res:value></res:binding>
<res:binding
rdf:nodeID="r16c1"><res:variable>population</res:variable><res:value
datatype="http://www.w3.org/2001/XMLSchema#int">82101998</res:value>
</res:binding>
<res:binding
rdf:nodeID="r16c2"><res:variable>populationDensity</res:variable><re
s:value
datatype="http://www.w3.org/2001/XMLSchema#int">74</res:value></res:
binding>
</res:solution>
<res:solution rdf:nodeID="r17">
<res:binding
rdf:nodeID="r17c0"><res:variable>country_name</res:variable><res:val
ue xml:lang="en">Moldova</res:value></res:binding>
<res:binding
rdf:nodeID="r17c1"><res:variable>population</res:variable><res:value
datatype="http://www.w3.org/2001/XMLSchema#int">3559500</res:value><
/res:binding>
<res:binding
rdf:nodeID="r17c2"><res:variable>populationDensity</res:variable><re
s:value

166
datatype="http://www.w3.org/2001/XMLSchema#int">122</res:value></res
:binding>
</res:solution>
<res:solution rdf:nodeID="r18">
<res:binding
rdf:nodeID="r18c0"><res:variable>country_name</res:variable><res:val
ue xml:lang="en">Zimbabwe</res:value></res:binding>
<res:binding
rdf:nodeID="r18c1"><res:variable>population</res:variable><res:value
datatype="http://www.w3.org/2001/XMLSchema#int">12521000</res:value>
</res:binding>
<res:binding
rdf:nodeID="r18c2"><res:variable>populationDensity</res:variable><re
s:value
datatype="http://www.w3.org/2001/XMLSchema#int">26</res:value></res:
binding>
</res:solution>
<res:solution rdf:nodeID="r19">
<res:binding
rdf:nodeID="r19c0"><res:variable>country_name</res:variable><res:val
ue xml:lang="en">Lesotho</res:value></res:binding>
<res:binding
rdf:nodeID="r19c1"><res:variable>population</res:variable><res:value
datatype="http://www.w3.org/2001/XMLSchema#int">2067000</res:value><
/res:binding>
<res:binding
rdf:nodeID="r19c2"><res:variable>populationDensity</res:variable><re
s:value
datatype="http://www.w3.org/2001/XMLSchema#int">68</res:value></res:
binding>
</res:solution>
<res:solution rdf:nodeID="r20">
<res:binding
rdf:nodeID="r20c0"><res:variable>country_name</res:variable><res:val
ue xml:lang="en">Andorra</res:value></res:binding>
<res:binding
rdf:nodeID="r20c1"><res:variable>population</res:variable><res:value
datatype="http://www.w3.org/2001/XMLSchema#int">84082</res:value></r
es:binding>
<res:binding
rdf:nodeID="r20c2"><res:variable>populationDensity</res:variable><re
s:value
datatype="http://www.w3.org/2001/XMLSchema#int">180</res:value></res
:binding>
</res:solution>
<res:solution rdf:nodeID="r21">

167
<res:binding
rdf:nodeID="r21c0"><res:variable>country_name</res:variable><res:val
ue xml:lang="en">Liechtenstein</res:value></res:binding>
<res:binding
rdf:nodeID="r21c1"><res:variable>population</res:variable><res:value
datatype="http://www.w3.org/2001/XMLSchema#int">36010</res:value></r
es:binding>
<res:binding
rdf:nodeID="r21c2"><res:variable>populationDensity</res:variable><re
s:value
datatype="http://www.w3.org/2001/XMLSchema#int">224</res:value></res
:binding>
</res:solution>
<res:solution rdf:nodeID="r22">
<res:binding
rdf:nodeID="r22c0"><res:variable>country_name</res:variable><res:val
ue xml:lang="en">Vatican City</res:value></res:binding>
<res:binding
rdf:nodeID="r22c1"><res:variable>population</res:variable><res:value
datatype="http://www.w3.org/2001/XMLSchema#int">832</res:value></res
:binding>
<res:binding
rdf:nodeID="r22c2"><res:variable>populationDensity</res:variable><re
s:value
datatype="http://www.w3.org/2001/XMLSchema#int">1877</res:value></re
s:binding>
</res:solution>
<res:solution rdf:nodeID="r23">
<res:binding
rdf:nodeID="r23c0"><res:variable>country_name</res:variable><res:val
ue xml:lang="en">Burkina Faso</res:value></res:binding>
<res:binding
rdf:nodeID="r23c1"><res:variable>population</res:variable><res:value
datatype="http://www.w3.org/2001/XMLSchema#int">15730977</res:value>
</res:binding>
<res:binding
rdf:nodeID="r23c2"><res:variable>populationDensity</res:variable><re
s:value
datatype="http://www.w3.org/2001/XMLSchema#int">57</res:value></res:
binding>
</res:solution>
<res:solution rdf:nodeID="r24">
<res:binding
rdf:nodeID="r24c0"><res:variable>country_name</res:variable><res:val
ue xml:lang="en">Nepal</res:value></res:binding>
<res:binding
rdf:nodeID="r24c1"><res:variable>population</res:variable><res:value

168
datatype="http://www.w3.org/2001/XMLSchema#int">29331000</res:value>
</res:binding>
<res:binding
rdf:nodeID="r24c2"><res:variable>populationDensity</res:variable><re
s:value
datatype="http://www.w3.org/2001/XMLSchema#int">199</res:value></res
:binding>
</res:solution>
<res:solution rdf:nodeID="r25">
<res:binding
rdf:nodeID="r25c0"><res:variable>country_name</res:variable><res:val
ue xml:lang="en">Laos</res:value></res:binding>
<res:binding
rdf:nodeID="r25c1"><res:variable>population</res:variable><res:value
datatype="http://www.w3.org/2001/XMLSchema#int">6500000</res:value><
/res:binding>
<res:binding
rdf:nodeID="r25c2"><res:variable>populationDensity</res:variable><re
s:value
datatype="http://www.w3.org/2001/XMLSchema#int">27</res:value></res:
binding>
</res:solution>
<res:solution rdf:nodeID="r26">
<res:binding
rdf:nodeID="r26c0"><res:variable>country_name</res:variable><res:val
ue xml:lang="en">Niger</res:value></res:binding>
<res:binding
rdf:nodeID="r26c1"><res:variable>population</res:variable><res:value
datatype="http://www.w3.org/2001/XMLSchema#int">15730754</res:value>
</res:binding>
<res:binding
rdf:nodeID="r26c2"><res:variable>populationDensity</res:variable><re
s:value
datatype="http://www.w3.org/2001/XMLSchema#int">12</res:value></res:
binding>
</res:solution>
<res:solution rdf:nodeID="r27">
<res:binding
rdf:nodeID="r27c0"><res:variable>country_name</res:variable><res:val
ue xml:lang="en">Turkmenistan</res:value></res:binding>
<res:binding
rdf:nodeID="r27c1"><res:variable>population</res:variable><res:value
datatype="http://www.w3.org/2001/XMLSchema#int">5110000</res:value><
/res:binding>
<res:binding
rdf:nodeID="r27c2"><res:variable>populationDensity</res:variable><re
s:value

169
datatype="http://www.w3.org/2001/XMLSchema#int">11</res:value></res:
binding>
</res:solution>
<res:solution rdf:nodeID="r28">
<res:binding
rdf:nodeID="r28c0"><res:variable>country_name</res:variable><res:val
ue xml:lang="en">Bhutan</res:value></res:binding>
<res:binding
rdf:nodeID="r28c1"><res:variable>population</res:variable><res:value
datatype="http://www.w3.org/2001/XMLSchema#int">708427</res:value></
res:binding>
<res:binding
rdf:nodeID="r28c2"><res:variable>populationDensity</res:variable><re
s:value
datatype="http://www.w3.org/2001/XMLSchema#int">18</res:value></res:
binding>
</res:solution>
<res:solution rdf:nodeID="r29">
<res:binding
rdf:nodeID="r29c0"><res:variable>country_name</res:variable><res:val
ue xml:lang="en">Rwanda</res:value></res:binding>
<res:binding
rdf:nodeID="r29c1"><res:variable>population</res:variable><res:value
datatype="http://www.w3.org/2001/XMLSchema#int">11689696</res:value>
</res:binding>
<res:binding
rdf:nodeID="r29c2"><res:variable>populationDensity</res:variable><re
s:value
datatype="http://www.w3.org/2001/XMLSchema#int">420</res:value></res
:binding>
</res:solution>
<res:solution rdf:nodeID="r30">
<res:binding
rdf:nodeID="r30c0"><res:variable>country_name</res:variable><res:val
ue xml:lang="en">Zambia</res:value></res:binding>
<res:binding
rdf:nodeID="r30c1"><res:variable>population</res:variable><res:value
datatype="http://www.w3.org/2001/XMLSchema#int">12935000</res:value>
</res:binding>
<res:binding
rdf:nodeID="r30c2"><res:variable>populationDensity</res:variable><re
s:value
datatype="http://www.w3.org/2001/XMLSchema#int">17</res:value></res:
binding>
</res:solution>
<res:solution rdf:nodeID="r31">

170
<res:binding
rdf:nodeID="r31c0"><res:variable>country_name</res:variable><res:val
ue xml:lang="en">Malawi</res:value></res:binding>
<res:binding
rdf:nodeID="r31c1"><res:variable>population</res:variable><res:value
datatype="http://www.w3.org/2001/XMLSchema#int">14901000</res:value>
</res:binding>
<res:binding
rdf:nodeID="r31c2"><res:variable>populationDensity</res:variable><re
s:value
datatype="http://www.w3.org/2001/XMLSchema#int">129</res:value></res
:binding>
</res:solution>
<res:solution rdf:nodeID="r32">
<res:binding
rdf:nodeID="r32c0"><res:variable>country_name</res:variable><res:val
ue xml:lang="en">Serbia</res:value></res:binding>
<res:binding
rdf:nodeID="r32c1"><res:variable>population</res:variable><res:value
datatype="http://www.w3.org/2001/XMLSchema#int">7120666</res:value><
/res:binding>
<res:binding
rdf:nodeID="r32c2"><res:variable>populationDensity</res:variable><re
s:value
datatype="http://www.w3.org/2001/XMLSchema#int">919</res:value></res
:binding>
</res:solution>
</rdf:Description>
</rdf:RDF>
A.3 Response to SPARQL Query 1 in CSV Format
Country_name,population,populationDensity
Ethiopia,82101998,74
Afghanistan,29835392,44
Uzbekistan,29559100,61
Nepal,29331000,199
Kazakhstan,16600000,6
Burkina Faso,15730977,57
Niger,15730754,12
Malawi,14901000,129
Zambia,12935000,17
Zimbabwe,12521000,26
Rwanda,11689696,420
Burundi,10216190,367
Hungary,10014324,107
Azerbaijan,9165000,106
Austria,8414638,1003

171
Switzerland,7952600,188
Tajikistan,7616000,49
Serbia,7120666,919
Laos,6500000,27
Kyrgyzstan,5550239,27
Slovakia,5445324,111
Turkmenistan,5110000,11
Moldova,3559500,122
Armenia,3262200,108
Lesotho,2067000,68
Botswana,2029307,3
Swaziland,1185000,68
Bhutan,708427,18
Luxembourg,509074,194
Andorra,84082,180
Liechtenstein,36010,224
San Marino,31887,501
Vatican City,832,1877
A.4 SQL Script for Implementing the Integrator in GTWS-1
-- Creating Table: "LandLocked"
CREATE TABLE "LandLocked"
(
country_rdfslabel character varying(40),
"prop_populationEstimate" bigint,
"prop_populationDensityKm" integer
)
WITH (
OIDS=FALSE
);
ALTER TABLE "LandLocked"
OWNER TO postgres;
--Loading SPARQL query results (saved as csv file) into PostgreSQL -
--table
copy "LandLocked" from 'D:\\lod.csv'
WITH DELIMITER ',' ENCODING 'Latin1';
--Creating a new relation from the join of existing tables DROP
TABLE public."WorldCountries_LandLocked" ;
CREATE TABLE public."WorldCountries_LandLocked" AS
SELECT
"World_Countries".gid,
"World_Countries".country_name,
"World_Countries".geom,
"LandLocked".country_rdfslabel,
"LandLocked"."prop_populationEstimate",
"LandLocked"."prop_populationDensityKm"
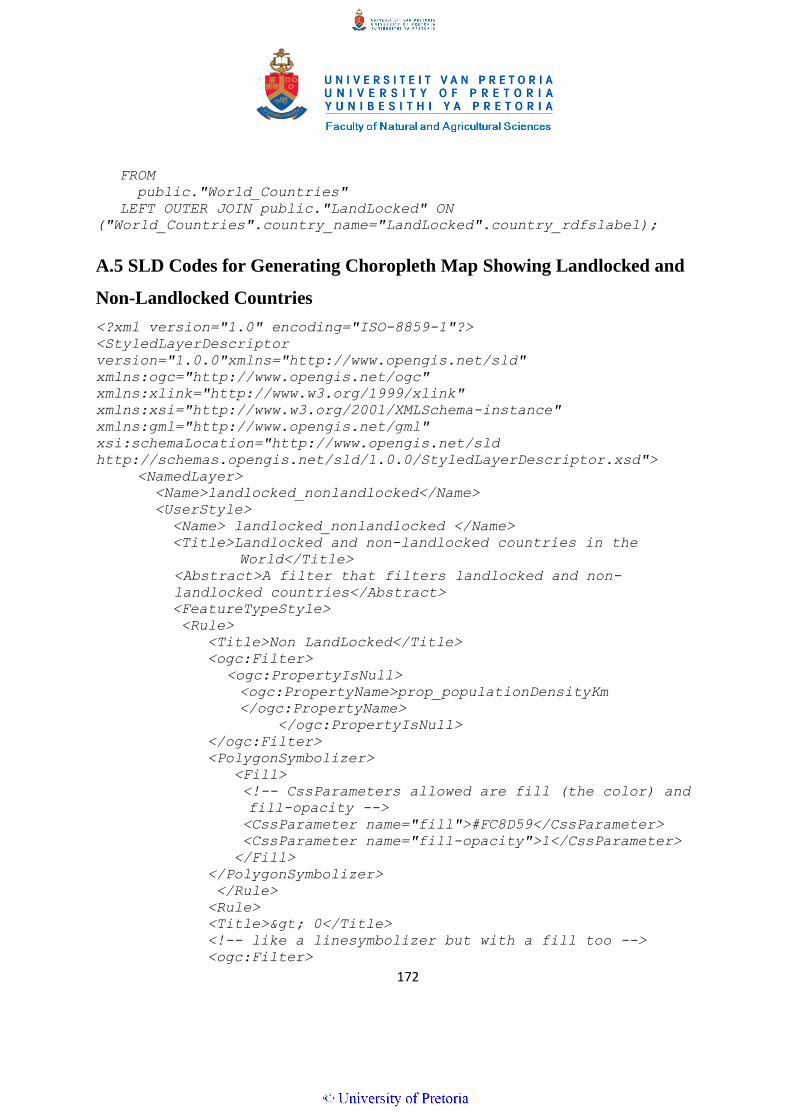
172
FROM
public."World_Countries"
LEFT OUTER JOIN public."LandLocked" ON
("World_Countries".country_name="LandLocked".country_rdfslabel);
A.5 SLD Codes for Generating Choropleth Map Showing Landlocked and
Non-Landlocked Countries
<?xml version="1.0" encoding="ISO-8859-1"?>
<StyledLayerDescriptor
version="1.0.0"xmlns="http://www.opengis.net/sld"
xmlns:ogc="http://www.opengis.net/ogc"
xmlns:xlink="http://www.w3.org/1999/xlink"
xmlns:xsi="http://www.w3.org/2001/XMLSchema-instance"
xmlns:gml="http://www.opengis.net/gml"
xsi:schemaLocation="http://www.opengis.net/sld
http://schemas.opengis.net/sld/1.0.0/StyledLayerDescriptor.xsd">
<NamedLayer>
<Name>landlocked_nonlandlocked</Name>
<UserStyle>
<Name> landlocked_nonlandlocked </Name>
<Title>Landlocked and non-landlocked countries in the
World</Title>
<Abstract>A filter that filters landlocked and non-
landlocked countries</Abstract>
<FeatureTypeStyle>
<Rule>
<Title>Non LandLocked</Title>
<ogc:Filter>
<ogc:PropertyIsNull>
<ogc:PropertyName>prop_populationDensityKm
</ogc:PropertyName>
</ogc:PropertyIsNull>
</ogc:Filter>
<PolygonSymbolizer>
<Fill>
<!-- CssParameters allowed are fill (the color) and
fill-opacity -->
<CssParameter name="fill">#FC8D59</CssParameter>
<CssParameter name="fill-opacity">1</CssParameter>
</Fill>
</PolygonSymbolizer>
</Rule>
<Rule>
<Title>> 0</Title>
<!-- like a linesymbolizer but with a fill too -->
<ogc:Filter>

173
<ogc:PropertyIsGreaterThan>
<ogc:PropertyName>prop_populationDensityKm
</ogc:PropertyName>
<ogc:Literal>0</ogc:Literal>
</ogc:PropertyIsGreaterThan>
</ogc:Filter>
<PolygonSymbolizer>
<Fill>
<!-- CssParameters allowed are fill (the color)
and fill-opacity -->
<CssParameter name="fill">#91CF60</CssParameter>
<CssParameter name="fill-
opacity">0.7</CssParameter>
</Fill>
</PolygonSymbolizer>
</Rule>
</FeatureTypeStyle>
</UserStyle>
</NamedLayer>
</StyledLayerDescriptor>
A.6 SLD Codes for Generating the Proportional Symbols Map Showing
Nominal GDP Per Capita of Countries
<?xml version="1.0" encoding="ISO-8859-1"?>
<StyledLayerDescriptor version="1.0.0"
xsi:schemaLocation="http://www.opengis.net/sld
StyledLayerDescriptor.xsd"
xmlns="http://www.opengis.net/sld"
xmlns:ogc="http://www.opengis.net/ogc"
xmlns:xlink="http://www.w3.org/1999/xlink"
xmlns:xsi="http://www.w3.org/2001/XMLSchema-instance">
<NamedLayer>
<Name>World Countries Nominal GDPPerCapita</Name>
<UserStyle>
<Title>World Countries Nominal GDPPerCapita</Title>
<FeatureTypeStyle>
<Rule>
<Name>Less Than 5000</Name>
<Title>1 to 5000</Title>
<ogc:Filter>
<ogc:And>
<ogc:PropertyIsGreaterThanOrEqualTo>
<ogc:PropertyName>GDPPerCapita_Nominal
</ogc:PropertyName>
<ogc:Literal>1</ogc:Literal>

174
</ogc:PropertyIsGreaterThanOrEqualTo>
<ogc:PropertyIsLessThan>
<ogc:PropertyName>GDPPerCapita_Nominal
</ogc:PropertyName>
<ogc:Literal>5000</ogc:Literal>
</ogc:PropertyIsLessThan>
</ogc:And>
</ogc:Filter>
<PointSymbolizer>
<Graphic>
<Mark>
<WellKnownName>circle</WellKnownName>
<Fill>
<CssParameter name="fill">#0033CC</CssParameter>
</Fill>
</Mark>
<Size>1</Size>
</Graphic>
</PointSymbolizer>
</Rule>
<Rule>
<Name>5000 to 25000</Name>
<Title>5000 to 25000</Title>
<ogc:Filter>
<ogc:And>
<ogc:PropertyIsGreaterThanOrEqualTo>
<ogc:PropertyName>GDPPerCapita_Nominal
</ogc:PropertyName>
<ogc:Literal>5000</ogc:Literal>
</ogc:PropertyIsGreaterThanOrEqualTo>
<ogc:PropertyIsLessThan>
<ogc:PropertyName>GDPPerCapita_Nominal
</ogc:PropertyName>
<ogc:Literal>25000</ogc:Literal>
</ogc:PropertyIsLessThan>
</ogc:And>
</ogc:Filter>
<PointSymbolizer>
<Graphic>
<Mark>
<WellKnownName>circle</WellKnownName>
<Fill>
<CssParameter name="fill">#0033CC</CssParameter>
</Fill>
</Mark>
<Size>5</Size>
</Graphic>
</PointSymbolizer>

175
</Rule>
<Rule>
<Name>25000 to 50000</Name>
<Title>25000 to 50000</Title>
<ogc:Filter>
<ogc:And>
<ogc:PropertyIsGreaterThanOrEqualTo>
<ogc:PropertyName>GDPPerCapita_Nominal
</ogc:PropertyName>
<ogc:Literal>25000</ogc:Literal>
</ogc:PropertyIsGreaterThanOrEqualTo>
<ogc:PropertyIsLessThan>
<ogc:PropertyName>GDPPerCapita_Nominal
</ogc:PropertyName>
<ogc:Literal>50000</ogc:Literal>
</ogc:PropertyIsLessThan>
</ogc:And>
</ogc:Filter>
<PointSymbolizer>
<Graphic>
<Mark>
<WellKnownName>circle</WellKnownName>
<Fill>
<CssParameter name="fill">#0033CC</CssParameter>
</Fill>
</Mark>
<Size>10</Size>
</Graphic>
</PointSymbolizer>
</Rule>
<Rule>
<Name>50000 to 100000</Name>
<Title>50000 to 10000</Title>
<ogc:Filter>
<ogc:And>
<ogc:PropertyIsGreaterThanOrEqualTo>
<ogc:PropertyName>GDPPerCapita_Nominal
</ogc:PropertyName>
<ogc:Literal>50000</ogc:Literal>
</ogc:PropertyIsGreaterThanOrEqualTo>
<ogc:PropertyIsLessThan>
<ogc:PropertyName>GDPPerCapita_Nominal
</ogc:PropertyName>
<ogc:Literal>100000</ogc:Literal>
</ogc:PropertyIsLessThan>
</ogc:And>
</ogc:Filter>
<PointSymbolizer>

176
<Graphic>
<Mark>
<WellKnownName>circle</WellKnownName>
<Fill>
<CssParameter name="fill">#0033CC</CssParameter>
</Fill>
</Mark>
<Size>20</Size>
</Graphic>
</PointSymbolizer>
</Rule>
<Rule>
<Name>Above 100000</Name>
<Title>Greater than 100000</Title>
<ogc:Filter>
<ogc:PropertyIsGreaterThanOrEqualTo>
<ogc:PropertyName>GDPPerCapita_Nominal
</ogc:PropertyName>
<ogc:Literal>100000</ogc:Literal>
</ogc:PropertyIsGreaterThanOrEqualTo>
</ogc:Filter>
<PointSymbolizer>
<Graphic>
<Mark>
<WellKnownName>circle</WellKnownName>
<Fill>
<CssParameter name="fill">#0033CC</CssParameter>
</Fill>
</Mark>
<Size>25</Size>
</Graphic>
</PointSymbolizer>
</Rule>
</FeatureTypeStyle>
</UserStyle>
</NamedLayer>
</StyledLayerDescriptor>

177
Appendix B. Publications from this
Research
B.1 Refereed Journal Publications
Owusu-Banahene, W., and Coetzee, S. (2014). Three integration styles for combining
attributes from the linked open data cloud with geospatial data for web thematic
mapping . Submitted.
B.2 Refereed Conference Proceedings
Owusu-Banahene, W., and Coetzee, S. (2012, October). An evaluation of the suitability of
open source web map servers for setting up a geospatial thematic web map service.
GISSA Ukubuzana 2012, Ekurhuleni, South Africa.
Owusu-Banahene, W., and Coetzee, S. (2013). Integrating linked open data into open source
web mapping. 26th
International Cartographic Conference (ICC). Dresden.
International Cartographic Associat. (ICA). Retrieved from:
http://icaci.org/files/documents/ICC_proceedings/ICC2013/_extendedAbstract/37_pro
ceeding.pdf
B.3 Book Chapters
Owusu-Banahene, W., Mensah, F., Coetzee, S., Cooper, A. K., Rautenbach, V., Sinvula, K.
M., ... and Hippondoka, M. (2013). A Description of Spatial Data Infrastructure
Stakeholders in Ghana Using the ICA Model. In H. Onsrud and A. Rajabifard (Eds.).
Spatial Enablement in Support of Economic Development and Poverty Reduction:
Research, Development and Education Perspectives, (pp. 63 – 84). GSDI
Association.
Sinvula, K. M., Coetzee, S., Cooper, A. K., Nangolo, E., Owusu-Banahene, W.,
Rautenbach, V., and Hipondoka, M. (2014). A Contextual ICA Stakeholder Model
Approach for the Namibian Spatial Data Infrastructure (NamSDI). In M.
Buchroithner, N. Prechtel, and D. Burghardt (Eds.). Cartography from Pole to
Pole (pp. 381-394). Berlin Heidelberg: Springer.

178

179