EVALUATING AND ALLOCATING OUTBOUND LOGISTICS COST …
82
EVALUATING AND ALLOCATING OUTBOUND LOGISTICS COST IN THE FAST-MOVING CONSUMER GOODS (FMCG) INDUSTRY by H.J. van Niekerk Submitted in fulfilment of the requirements for the degree Masters of Industrial and Systems Engineering in the FACULTY OF ENGINEERING, BUILT ENVIRONMENT AND INFORMATION TECHNOLOGY at the UNIVERSITY OF PRETORIA Study leader: Mrs Wilna Bean Date of submission March 2018
Transcript of EVALUATING AND ALLOCATING OUTBOUND LOGISTICS COST …

EVALUATING AND ALLOCATING OUTBOUND LOGISTICS COST IN THE
FAST-MOVING CONSUMER GOODS (FMCG) INDUSTRY
by
H.J. van Niekerk
Submitted in fulfilment of the requirements for the degree
Masters of Industrial and Systems Engineering
in the
FACULTY OF ENGINEERING, BUILT ENVIRONMENT AND INFORMATION TECHNOLOGY
at the
UNIVERSITY OF PRETORIA
Study leader:
Mrs Wilna Bean
Date of submission
March 2018
- i -
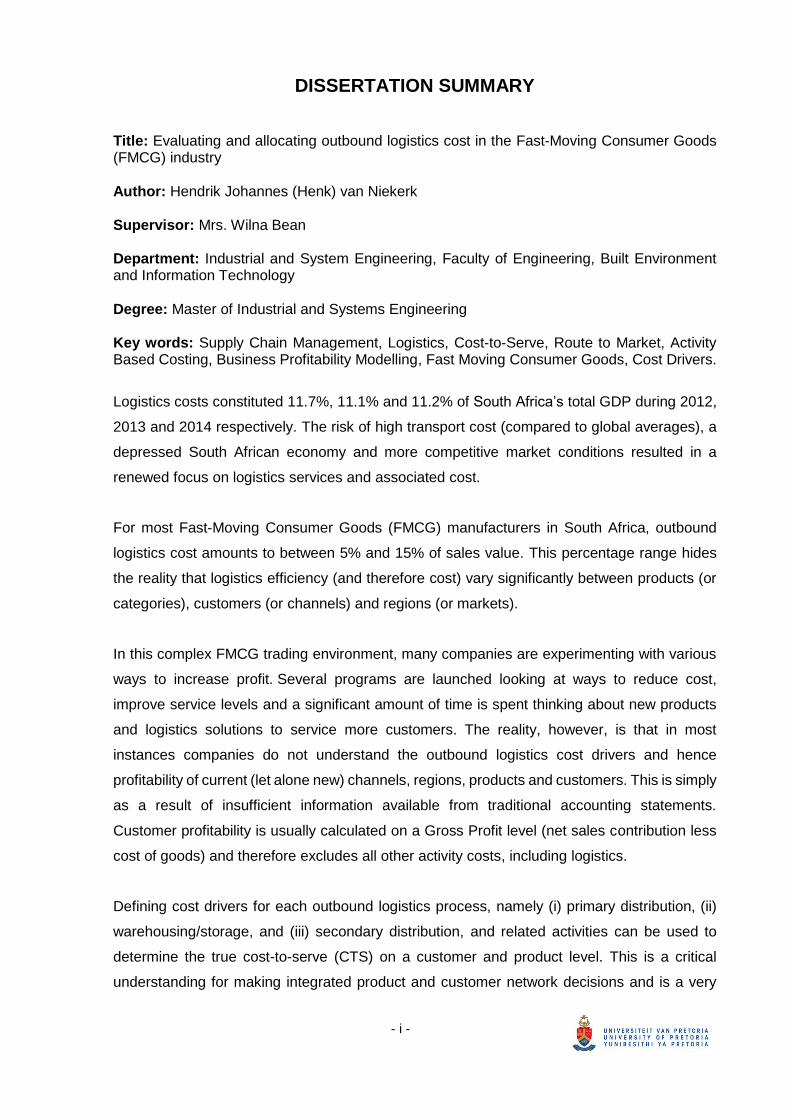
DISSERTATION SUMMARY
Title: Evaluating and allocating outbound logistics cost in the Fast-Moving Consumer Goods (FMCG) industry Author: Hendrik Johannes (Henk) van Niekerk
Supervisor: Mrs. Wilna Bean
Department: Industrial and System Engineering, Faculty of Engineering, Built Environment and Information Technology Degree: Master of Industrial and Systems Engineering
Key words: Supply Chain Management, Logistics, Cost-to-Serve, Route to Market, Activity Based Costing, Business Profitability Modelling, Fast Moving Consumer Goods, Cost Drivers.
Logistics costs constituted 11.7%, 11.1% and 11.2% of South Africa’s total GDP during 2012,
2013 and 2014 respectively. The risk of high transport cost (compared to global averages), a
depressed South African economy and more competitive market conditions resulted in a
renewed focus on logistics services and associated cost.
For most Fast-Moving Consumer Goods (FMCG) manufacturers in South Africa, outbound
logistics cost amounts to between 5% and 15% of sales value. This percentage range hides
the reality that logistics efficiency (and therefore cost) vary significantly between products (or
categories), customers (or channels) and regions (or markets).
In this complex FMCG trading environment, many companies are experimenting with various
ways to increase profit. Several programs are launched looking at ways to reduce cost,
improve service levels and a significant amount of time is spent thinking about new products
and logistics solutions to service more customers. The reality, however, is that in most
instances companies do not understand the outbound logistics cost drivers and hence
profitability of current (let alone new) channels, regions, products and customers. This is simply
as a result of insufficient information available from traditional accounting statements.
Customer profitability is usually calculated on a Gross Profit level (net sales contribution less
cost of goods) and therefore excludes all other activity costs, including logistics.
Defining cost drivers for each outbound logistics process, namely (i) primary distribution, (ii)
warehousing/storage, and (iii) secondary distribution, and related activities can be used to
determine the true cost-to-serve (CTS) on a customer and product level. This is a critical
understanding for making integrated product and customer network decisions and is a very

- ii -
necessary building block for achieving optimised supply chains. It can also support what-if
scenarios of the logistics network and the resultant impact on cost, service levels and resultant
profit, assisting businesses to focus on the true cost drivers before they become costs.
The research posed three conjectures:
1. Current accounting systems provide insufficient insight into the outbound logistics cost-
to-serve (CTS) on a product and customer level. The development of an alternative
CTS allocation framework, underpinned by cost drivers, is required to translate and
assign cost logically to customer transactions to determine the true CTS.
2. The cost drivers of outbound logistics in the South African FMCG industry are not well
defined or understood. This is a key component to develop cost allocation logic for each
cost driver on a customer transactional level.
3. An outbound logistics CTS allocation framework is a critical component of supply chain
optimisation as (i) cost is linked to actual activity, (ii) it leads to business understanding
of costs and cost drivers, (iii) it acts as a tool to identify customer servicing strategies
to improve service and profit.
The research led to the following conclusions:
• Conjecture 1: Current accounting systems are lacking the insights to understand the
outbound logistics CTS on a product and customer level. Being able to evaluate the
CTS on a more detailed level is a key requirement to ensure that informed and
appropriate business decisions are taken. The market interviews within the FMCG
industry supported the notion that a CTS allocation framework, based on defined cost
drivers, could be a critical input to supply chain optimisation and overall business
profitability.
• Conjecture 2: The market interviews indicated that cost drivers for outbound logistics
in the FMCG industry are not well defined. However, the literature study and structured
interview questions evinced that standard cost driver(s) for each outbound logistics
process and related activities can indeed be defined, albeit slight variations might exist
due to different supply chain intricacies. However, the principle of using the cost
driver(s) to develop a CTS allocation framework on a customer and product level holds
true.
• Conjecture 3: The study established that it’s probable that costs can be ringfenced for
the respective outbound logistics processes. Evaluating the cost drivers for the
activities associated to the processes will lead to a better understanding of the logistics
costs and the drivers thereof. The suggested CTS allocation framework determines the
true CTS on customer and product level and is therefore a valuable decision-support

- iii -
tool to identify improvement initiatives and optimisation. Applying the tool to shape
customer servicing strategies whilst reducing the outbound logistics CTS (and hence
increase profit) is a significant competitive advantage.
– This report should preferably be read and printed in full colour –

- iv -
ACKNOWLEDGEMENTS
The author would like to take this opportunity to thank the following:
1. My family (especially Janus Prinsloo, daughter Zané and my mom) for their patience
and unconditional support during the completion of my studies.
2. Resolve, my employer, for supporting me to complete my studies and affording me the
opportunity to be involved in world-class supply chain projects.
3. All the interviewees that took part in the market interviews for their time and valuable
inputs.
4. My study leader, Mrs. Wilna Bean, for her guidance and support.
5. My Heavenly Farther, as He made this possible.
- v -
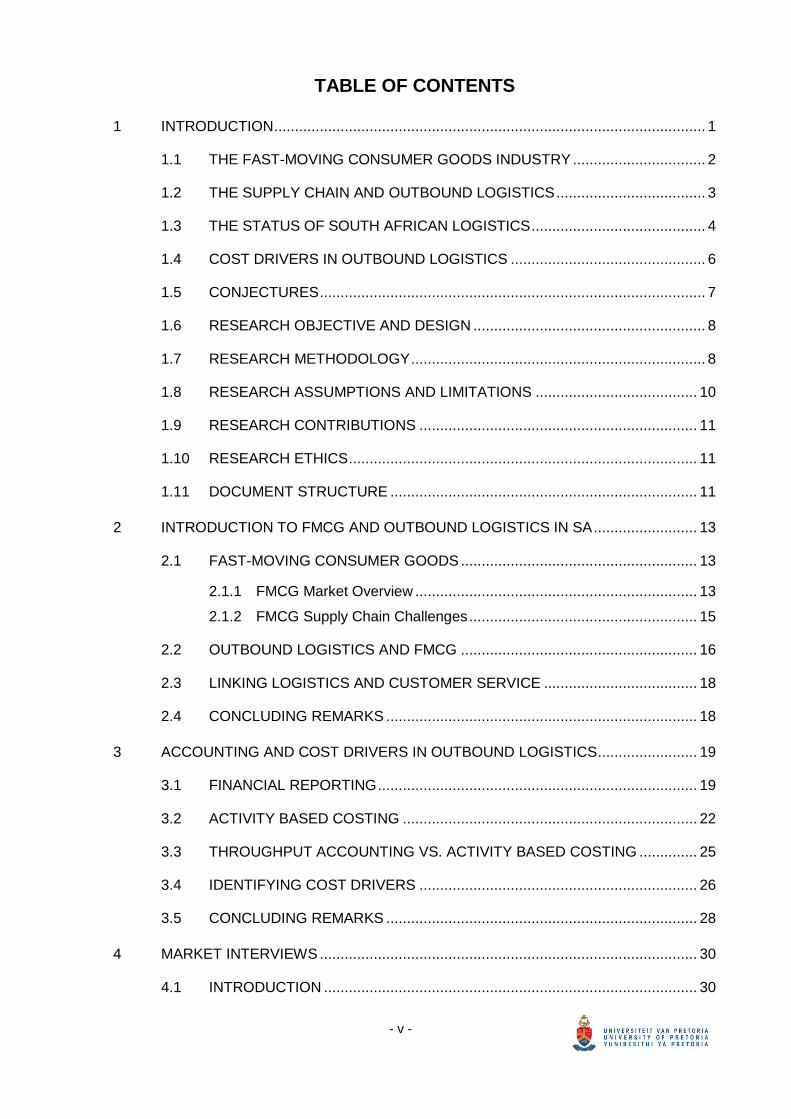
TABLE OF CONTENTS
1 INTRODUCTION ........................................................................................................ 1
1.1 THE FAST-MOVING CONSUMER GOODS INDUSTRY ................................ 2
1.2 THE SUPPLY CHAIN AND OUTBOUND LOGISTICS .................................... 3
1.3 THE STATUS OF SOUTH AFRICAN LOGISTICS .......................................... 4
1.4 COST DRIVERS IN OUTBOUND LOGISTICS ............................................... 6
1.5 CONJECTURES ............................................................................................. 7
1.6 RESEARCH OBJECTIVE AND DESIGN ........................................................ 8
1.7 RESEARCH METHODOLOGY ....................................................................... 8
1.8 RESEARCH ASSUMPTIONS AND LIMITATIONS ....................................... 10
1.9 RESEARCH CONTRIBUTIONS ................................................................... 11
1.10 RESEARCH ETHICS .................................................................................... 11
1.11 DOCUMENT STRUCTURE .......................................................................... 11
2 INTRODUCTION TO FMCG AND OUTBOUND LOGISTICS IN SA ......................... 13
2.1 FAST-MOVING CONSUMER GOODS ......................................................... 13
2.1.1 FMCG Market Overview .................................................................... 13
2.1.2 FMCG Supply Chain Challenges ....................................................... 15
2.2 OUTBOUND LOGISTICS AND FMCG ......................................................... 16
2.3 LINKING LOGISTICS AND CUSTOMER SERVICE ..................................... 18
2.4 CONCLUDING REMARKS ........................................................................... 18
3 ACCOUNTING AND COST DRIVERS IN OUTBOUND LOGISTICS ........................ 19
3.1 FINANCIAL REPORTING ............................................................................. 19
3.2 ACTIVITY BASED COSTING ....................................................................... 22
3.3 THROUGHPUT ACCOUNTING VS. ACTIVITY BASED COSTING .............. 25
3.4 IDENTIFYING COST DRIVERS ................................................................... 26
3.5 CONCLUDING REMARKS ........................................................................... 28
4 MARKET INTERVIEWS ........................................................................................... 30
4.1 INTRODUCTION .......................................................................................... 30
- vi -
4.2 INTERVIEW RESULTS ................................................................................ 31
4.2.1 Respondents ..................................................................................... 31
4.2.2 Company Overview – Supply Chain Focused .................................... 31
4.2.3 Accounting Procedures ..................................................................... 32
4.2.4 Outbound Logistics Cost-to-Serve and Cost Drivers .......................... 35
4.2.5 Primary Distribution ........................................................................... 35
4.2.6 Warehousing / Storage ...................................................................... 36
4.2.7 Secondary Distribution ...................................................................... 37
4.2.8 Closing .............................................................................................. 39
4.3 CONCLUDING REMARKS ........................................................................... 39
5 COST DRIVER FRAMEWORK DEVELOPMENT ..................................................... 41
5.1 INTRODUCTION .......................................................................................... 41
5.2 IDENTIFICATION OF THE COST DRIVERS ................................................ 41
5.2.1 Primary Distribution ........................................................................... 41
5.2.2 Warehousing ..................................................................................... 42
5.2.3 Secondary Distribution ...................................................................... 43
5.3 CTS FRAMEWORK: COST DRIVERS AND ALLOCATION .......................... 44
5.3.1 Primary Distribution ........................................................................... 44
5.3.2 Warehousing ..................................................................................... 45
5.3.3 Secondary Distribution ...................................................................... 45
5.3.4 Consolidated View ............................................................................. 46
5.4 DATA COLLECTION .................................................................................... 48
5.5 CONCLUDING REMARKS ........................................................................... 49
6 CTS FRAMEWORK VALIDATION (A CASE STUDY) .............................................. 52
6.1 INTRODUCTION .......................................................................................... 52
6.2 COMPANY’S SUPPLY CHAIN OVERVIEW ................................................. 53
6.3 APPLYING THE FRAMEWORK: COST DRIVERS AND ALLOCATION ....... 54
6.4 COST DRIVER ALLOCATION EXAMPLE .................................................... 55
6.4.1 Example inputs .................................................................................. 55
6.4.2 Example calculation .......................................................................... 57
6.5 DASHBOARD ............................................................................................... 60

- vii -
6.6 CONCLUDING REMARKS ........................................................................... 63
7 CONCLUSION ......................................................................................................... 64
8 REFERENCES ......................................................................................................... 67

- viii -
LIST OF FIGURES
Figure 1: Simplistic View of a Supply Chain ........................................................................... 3
Figure 2: South Africa Logistics Cost Trend ........................................................................... 5
Figure 3: Trends in South Africa’s Logistics Costs Stack Elements ........................................ 5
Figure 4: Research methodology ......................................................................................... 10
Figure 5: The Du Pont Model ............................................................................................... 20
Figure 6: Customer Profitability Analysis .............................................................................. 21
Figure 7: Data Collection ..................................................................................................... 48
Figure 8: High-level Case Study Approach .......................................................................... 52
Figure 9: Case Study’s Supply Chain Definition ................................................................... 53
Figure 10: Case Study’s Supply Chain Example .................................................................. 55
Figure 11: Cast Study Dashboard (CTS Summary).............................................................. 61
Figure 12: Case Study Customer Classification ................................................................... 61
Figure 13: Case Study Business Unit Comparison ............................................................... 62

- ix -
LIST OF TABLES
Table 1: Advantages of ABC ............................................................................................... 23
Table 2: Disadvantages of ABC .......................................................................................... 24
Table 3: Theoretical Outbound Logistics Cost Drivers ......................................................... 27
Table 4: Market Interview: Respondents ............................................................................. 31
Table 5: Market Interview: Company Overview ................................................................... 32
Table 6: Market Interview: Accounting Procedures ............................................................. 33
Table 7: Market Interview: Outbound Logistics CTS............................................................ 35
Table 8: Market Interview: Primary Distribution ................................................................... 36
Table 9: Market Interview: Warehousing ............................................................................. 37
Table 10: Market Interview: Secondary Distribution ............................................................ 38
Table 11: Market Interview: Closing .................................................................................... 39
Table 12: Primary Distribution Cost Drivers ........................................................................ 42
Table 13: Warehousing Cost Drivers .................................................................................. 42
Table 14: Secondary Distribution Cost Drivers .................................................................... 43
Table 15: Primary Distribution Cost Allocation Framework .................................................. 44
Table 16: Warehousing Cost Allocation Framework ............................................................ 45
Table 17: Secondary Distribution Cost Allocation Framework ............................................. 46
Table 18: Consolidated Cost Allocation Outcome ............................................................... 47
Table 19: Case Study: Outbound Logistics Activities .......................................................... 53
Table 20: Case Study: Company’s Outbound Logistics Cost Drivers .................................. 54
Table 21: Case Study: Data & Assumptions ....................................................................... 55
Table 22: Case Study: Cost Allocation Calculations ............................................................ 57
Table 23: Case Study: Output ............................................................................................. 59
- x -
LIST OF ABBREVIATIONS
Abbreviation Description
ABC Activity Based Costing
ABM Activity Based Management
BU Business Unit
CDC Central Distribution Centre
CPG Consumer Packaged Goods
CPI Consumer Price Index
CTS Cost-to-Serve
DC Distribution Centre
EBIT Faculty of Engineering, Built Environment & Information Technology
EVA Economic Value Add
FMCG Fast-Moving Consumer Goods
FTL Full Truck Load
GDP Gross Domestic Product
KPI Key Performance Indicator
LSP Logistics Service Provider
MHE Material Handling Equipment
MOQ Minimum Order Quantity
NIV Net Invoiced Value
POD Proof of Delivery
ROA Return on Assets
ROE Return on Equity
ROI Return on Investment
SCM Supply Chain Management
SKU Stock Keeping Unit
SOH Stock on Hand
TA Throughput Accounting
TAT Turn Around Time (relates to the total delivery time at a location)
TOC Theory of Constraints

- xi -
GLOSSARY
1. Fast-Moving Consumer Goods (FMCG): The FMCG industry operates with consumer
items that are usually produced in large quantities and turnover rates for these products
are relatively quick. FMCG companies provide these consumable products to the customer
through certain predetermined distribution channels/segments.
2. Cost Driver: An activity that consumes resource(s) with an associated cost.
3. Cost-to-Serve (CTS): Methodology used to determine what the true activity cost on a
customer and product level is.
4. Outbound Logistics: This entails the planning and execution of the storage and physical
flow of finished goods from the point of origin (i.e. manufacturing) to the point of delivery
(i.e. retailer). The processes are mainly (i) primary distribution, (ii) warehousing and (iii)
secondary distribution.
5. Primary Distribution: This defines the transport of finished goods from point of
manufacturing to point of storage, which is normally a regional distribution centre, or the
movement of product between storage locations. It could also be referred to as bulk haul.
The quantity moved are typically full vehicle loads and products are palletised.
6. Secondary Distribution: This refers to distribution from point of storage to the end customer.
In the FMCG environment this is typically a retail outlet where the consumer will purchase
goods.
7. Supply Chain: Is a network to deliver goods to customers that involves the planning and
physical flow of products, information and cash.
8. Warehousing/Storage: In the context of outbound logistics, warehousing is where finished
goods products are received and stored prior to distribution to customers.

- 1 -
1 INTRODUCTION
“South Africa’s logistics costs totalled R429 billion in 2014 and equated to 11.2% of gross
domestic product (GDP) or 51.5% of transportable GDP. Logistics costs increased by 9.2%
between 2013 and 2014.” (Havenga et al., 2016:3). The upward trend of logistics cost, as part
of operating cost, is identified as a major risk to consumer inflation and economic growth.
Besides the recent economic slowdown, with an average GDP growth for South Africa
equalling 2.1% between 2011 and 2015 (Havenga et al., 2016:4), the Fast-Moving Consumer
Goods (FMCG) industry has shown a modest annual volume growth (Pick ‘n Pay, 2014;
Shoprite Holdings, 2014 and Massmart, 2014). However, relatively low operating profit margins
in the FMCG industry necessitates the need to reduce logistics cost whilst maintaining
acceptable service standards to its customers (PWC, 2012).
Barloworld Logistics (2016:8) states that in line with previous surveys, it is clear that logistics
operating costs are still a big constraint of a business. It is therefore “more prudent to
understand the relationship of costs relative to the value they derive”. The true determination
of the sources of profit and/or profit erosion is clearly a growing need. It is therefore of high
importance to understand the real cost of service and the cost efficiency of activities
contributing to the logistics services, through enhancing the capabilities of management
accounting systems (Bokor and Markovits-Somogyi, 2014). This understanding provides
valuable insights into the sustainability of business and highlights where possible corrective
actions are required.
The enhancement of management accounting systems was recognised by Christopher
(1998:71) who stated that traditional cost accounting procedures often provided unreliable
insight into profitability. Activity based costing (ABC) is not a new concept and was introduced
to solve the distortion problems of traditional costing systems (Cooper and Kaplan, 1988). This
costing methodology started out predominantly focussing on manufacturing because of the
significant costs involved, but La Londe et al. (1994) pointed out ABC can be a useful tool in
logistics management as well. Using ABC to assign costs to determine the profitability of
customers and products is widely accepted (Foster et al., 1994).
However, Jooste and Van Niekerk (2009) state that the degree to which South African FMCG
companies truly understand the impact of outbound logistics cost on profitability of current (let
alone new) market channels, regions, products and customers is ambiguous. The contribution
of this study is to develop a customised cost-to-serve (CTS) framework for the South African
- 2 -
FMCG industry that includes the major outbound logistics cost components and its associated
cost drivers1 for each respective activity. Applying the framework to calculate the CTS of
customers and products can be a significant competitive advantage as it leads to an
understanding of the cost contribution and resultant profitability on a more granular level.
Appropriate business decisions can be taken based on this understanding to ensure the
sustainability of the overall business.
The scope of the CTS framework is contained to the South African FMCG industry and
outbound logistics operations, which are discussed in Section 1.1 and 1.2 respectively.
1.1 THE FAST-MOVING CONSUMER GOODS INDUSTRY
FMCG, also known as consumer-packaged goods (CPG), are characterised by a quick rate of
sale and do not require an extensive decision-making process or financial investment for
purchase (CSIR, 2006). Examples of products include a wide range of frequently purchased
products such as food, beverages, tobacco, household products, confectionery, toiletries, as
well as health and beauty products.
The Economist Intelligence Unit reported that the South African FMCG retail industry
surpassed a trillion rand in 2011, for the first time in history. In volume terms, the retail industry
grew by an average of 3.45% in nominal terms over the period 2012 – 2016 (PWC, 2012).
FMCG has many characteristics that distinguish it from other industries, and these include the
following (CSIR, 2006 and PWC 2012):
• Demand is seasonal and fluctuates with changes in consumer disposable income,
tastes and preferences. Sales cycles typically peak on weekends and month ends as
well as over the Easter and Christmas periods.
• Profit margins on FMCG products, especially at retail level, are usually low, but large
quantities are sold.
• Due to relative low customer loyalty, product branding and availability are extremely
important. “Disloyalty” occurs frequently when the product of choice is not available and
is substituted for an alternative brand. The industry therefore realised that it is difficult
to win in the market on price alone – supply chain speed, responsiveness and flexibility
are critical to maintain a competitive edge.
1 Cost driver can be defined as something that cause costs because they consume resources
(Christopher, 1998).
- 3 -
1.2 THE SUPPLY CHAIN AND OUTBOUND LOGISTICS
Although logistics activity is literally thousands of years old (dating back to the earliest forms
of organised trade), it only became a study field in the early 1900's (Stock et al., 2001). A
couple of decades later, and still today, logistics remains very relevant to businesses.
There are various views on the difference between logistics (or Logistics Management) and
supply chain (or Supply Chain Management). Christopher (1998:12-14) argues that the supply
chain involves “the network of organisations that are involved through upstream and
downstream linkages, in the different processes and activities that produce value in the form
of products and services in the hands of the ultimate consumer”.
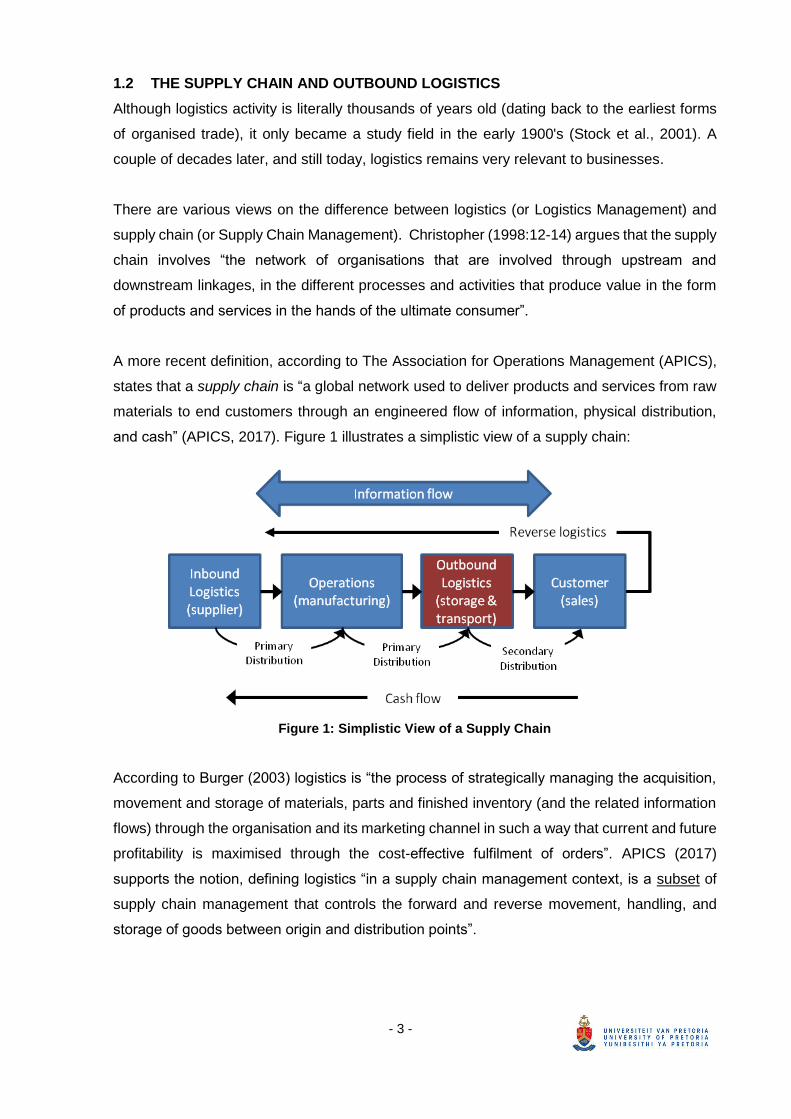
A more recent definition, according to The Association for Operations Management (APICS),
states that a supply chain is “a global network used to deliver products and services from raw
materials to end customers through an engineered flow of information, physical distribution,
and cash” (APICS, 2017). Figure 1 illustrates a simplistic view of a supply chain:
Figure 1: Simplistic View of a Supply Chain
According to Burger (2003) logistics is “the process of strategically managing the acquisition,
movement and storage of materials, parts and finished inventory (and the related information
flows) through the organisation and its marketing channel in such a way that current and future
profitability is maximised through the cost-effective fulfilment of orders”. APICS (2017)
supports the notion, defining logistics “in a supply chain management context, is a subset of
supply chain management that controls the forward and reverse movement, handling, and
storage of goods between origin and distribution points”.

- 4 -
For the purposes of this study, the outbound logistics scope definition is based on the latest
APICS dictionary that defines outbound logistics as “every process that is involved in the
shipping and holding of products after they are completed until they are received by the
customer” (APICS, 2017). Outbound logistics, within the simplistic view of a supply chain in
Figure 1, is indicated in burgundy.
Logistical characteristics and challenges could be unique to a specific region or country.
Section 1.3 elaborates on the status of logistics in a South African context.
1.3 THE STATUS OF SOUTH AFRICAN LOGISTICS
Razzaque and Sheng (1998) argue that a growing trend has emerged where the delivery
process is as much responsible for competitive advantage as the product itself. They continue
to say that logistics is ideally positioned to achieve this as it cuts across the traditional
functions. Also, the logistics function can be the key facilitator in the cross-functional effort
towards supply chain integration to meet future needs, which is now assumed to be of strategic
importance (Barloworld Logistics, 2016:67). This supports Lin, Collins and Su (2001:703)
viewpoint and familiar phrase that “customer service involves getting the right product, to the
right customer at the right place, in the right condition, at the right time at the lowest possible
cost”.
In 2007 the supplychainforesight stated the most important supply chain objectives for South
African companies are improving collaboration, improving service delivery to customers and
reducing logistics cost (Barloworld Logistics, 2007:12). In recent times, these previously stated
objectives are still relevant, however companies are now also required to adapt to changing
market conditions due to “the current economic and political climate”. Retaining and sustaining
financial returns is the supreme objective and “the real opportunity lies in a company’s ability
to ensure costs are managed in relation to creating value going forward” (Barloworld Logistics,
2016). Companies therefore place a strong focus on cost management and how this
contributes to overall value generation – a key underlying principle when considering the intent
of CTS analysis.
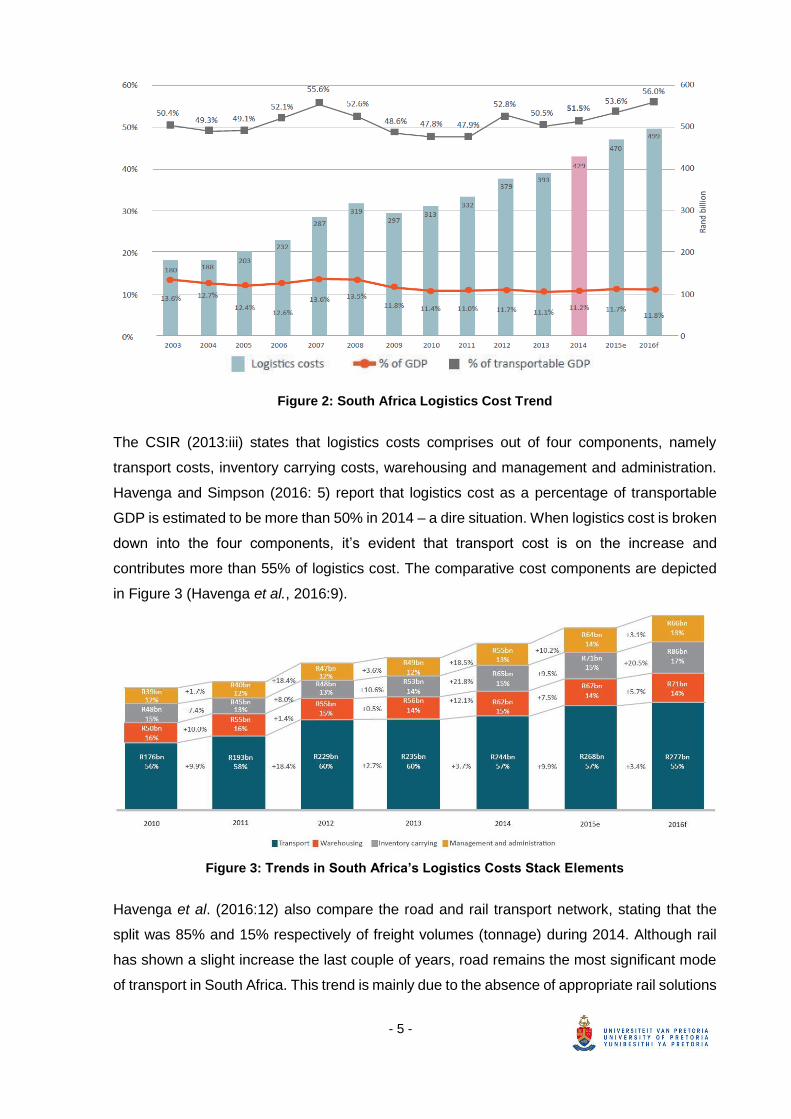
Figure 2 provides a trend view of South African logistics cost as a percentage of total GDP and
transportable GDP from 2003 to 2016 [red line]. It’s evident that the year-on-year actual
logistics costs since 2013, and estimations for 2015 and 2016, are on the increase [grey line]
(Havenga et al., 2016:5).
- 5 -
Figure 2: South Africa Logistics Cost Trend
The CSIR (2013:iii) states that logistics costs comprises out of four components, namely
transport costs, inventory carrying costs, warehousing and management and administration.
Havenga and Simpson (2016: 5) report that logistics cost as a percentage of transportable
GDP is estimated to be more than 50% in 2014 – a dire situation. When logistics cost is broken
down into the four components, it’s evident that transport cost is on the increase and
contributes more than 55% of logistics cost. The comparative cost components are depicted
in Figure 3 (Havenga et al., 2016:9).
Figure 3: Trends in South Africa’s Logistics Costs Stack Elements
Havenga et al. (2016:12) also compare the road and rail transport network, stating that the
split was 85% and 15% respectively of freight volumes (tonnage) during 2014. Although rail
has shown a slight increase the last couple of years, road remains the most significant mode
of transport in South Africa. This trend is mainly due to the absence of appropriate rail solutions

- 6 -
(that lead to a divergence between rail services and customer requirements) as well as the
lack of investment in rail infrastructure (Havenga et al., 2016).
Logistics remains a key focus area for companies’ due to the high costs involved. South
Africa’s vast geographic disposition is a further challenge for companies to minimise logistics
cost whilst maintaining or even improving reliable customer service. Expressing logistics cost
as a percentage of revenue or a Rand per unit are both over-simplified measures. Merely
breaking down logistics into high-level cost categories will provide insight and identify focus
areas. However, understanding the true CTS (and resulting profitability) on a more granular
customer and product level will produce a fitting logistics improvement agenda for different
supply chains within a company. To determine the true CTS, the cost drivers associated with
the outbound logistics processes and activities need to be evaluated. The significance of cost
drivers is discussed in Section 1.4.
1.4 COST DRIVERS IN OUTBOUND LOGISTICS
The FMCG industry is a complex, dynamic and low margin trading environment and many
companies are experimenting with various ways to increase profit. Several undertakings are
launched to consider ways to reduce cost and a significant amount of effort is spent to develop
new products and expand the customer footprint (Jooste and Van Niekerk, 2009).
The key problem is usually not the undertaking or the intent, but the integrated focus and
approach used to determine priorities as well as the ability of all affected parties to understand
the impact of the change on the overall company financials. This is often as a result of
insufficient information available from traditional accounting statements as discussed earlier.
Furthermore, logistics cost is often buried in overheads and are not well understood (Havenga
et al., 2016:3). This implies that customer and product profitability is usually calculated on a
Gross Profit level, and therefore excludes all other supply chain and logistics activity costs.
Norek & Pohlen (2001:38) state: “Not knowing the cost to perform specific functions will make
the development of optimal supply chain structures difficult if not impossible”. The end
customer is arguably the most important stakeholder in the supply chain. However, many
companies don’t understand the profit (or lack thereof) they make from each customer, let
alone up and cross selling opportunities. This lack of understanding might lead to suboptimal
supply chain development and business strategies (Jooste et al., 2009).
The challenge is to develop a framework for the FMCG industry to evaluate and define the cost
drivers for outbound logistics activities and to determine the CTS on a customer and product

- 7 -
level. The understanding of CTS, as part of a business strategy, is a critical component for
building future optimal, agile and sustainable logistics solutions.
1.5 CONJECTURES
From the literature review the following is evident:
1. The FMCG industry is a complex, dynamic and low margin trading environment and
many companies are experimenting with various ways to increase profit. Supply chain
optimisation, including outbound logistics, remains a key focus area.
2. Companies are focusing on cost management in order to understand how this
translates into business value. However, most companies calculate customer and
product profitability on a Gross Profit level (net sales contribution less cost of goods),
and therefore exclude all other activity costs, including outbound logistics, which is
usually hidden in overhead cost.
3. Supply chain costs, especially in view of outbound logistics, are substantial in order to
get the right product, in the right quantities, in the right time to the right customer,
profitably.
4. There is a need to develop a CTS framework that models and translates inter alia
outbound logistics activities into financial value in order to determine a customer and
product’s true CTS and resultant contribution to an organisation’s bottom line.
The research problem reads as follows: Evaluating and defining outbound logistics cost drivers
for FMCG companies is essential to create a CTS framework that will provide an understanding
of the true impact of outbound logistics cost on differentiated customers, products, channels
and/or geographical regions.
Based on the above, the following three inductive conjectures are formulated:
1. Current accounting systems provide insufficient insight into the outbound logistics cost-
to-serve (CTS) on a product and customer level. The development of an alternative
CTS allocation framework, underpinned by cost drivers, is required to translate and
assign cost logically to customer transactions to determine the true CTS.
2. The cost drivers of outbound logistics in the South African FMCG industry are not well
defined or understood. This is a key component to develop cost allocation logic for each
cost driver on a customer transactional level.
3. An outbound logistics CTS allocation framework is a critical component of supply chain
optimisation as (i) cost is linked to actual activity, (ii) it leads to business understanding
of costs and cost drivers, (iii) it acts as a tool to identify customer servicing strategies
to improve service and profit.

- 8 -
1.6 RESEARCH OBJECTIVE AND DESIGN
The primary research objective of this study aimed to evaluate the cost drivers for outbound
logistics to develop a cost allocation framework within a South African FMCG industry context.
To achieve this, the research design was structured to achieve the following secondary
objectives:
1. Identify the characteristics of outbound logistics in the South Africa FMCG industry.
2. Understand current cost allocation methodologies and its application to field of
outbound logistics.
3. Evaluate the cost components and cost drivers for each outbound logistics process
namely (i) primary distribution, (ii) warehousing/storage, and (iii) secondary distribution.
4. Develop a CTS framework that will guide FMCG companies to determine the outbound
logistics cost on a customer and product level.
5. Apply the CTS framework to a South African company’s supply chain, as a case study,
to validate the application of the framework and to showcase potential insights that can
be derived.
The research methodology, assumptions and limitations, contributions and ethics are
discussed in Sections 1.7 to 1.10 respectively.
1.7 RESEARCH METHODOLOGY
Mouton (2001) states that different types of studies and different design types exist to answer
specific kind of questions. Yin (2014) suggests that five types of strategies can be applied to
research studies, namely: experimental, survey, archival analysis, history and case study.
Furthermore, the appropriate study strategy (and consequent methodology) depends on the
research question, the control over events and the focus on historical or current events.
The chosen research methodology incorporates various techniques to address the research
problem and conclusively accept or reject the formulated conjectures. The researcher
considered non-empirical as well as empirical study strategies;
1. Non-empirical entails a literature review (as a source of historical evidence) and the
development of a CTS framework, both requiring minimal control over the behavioural
events.
2. Empirical entails market interviews (based on a questionnaire) and the validation of the
CTS framework through a case study application. The questionnaire, used during the
interviews, focussed on current events that includes direct interviewing and
observations to enrich non-empirical findings. The case study application is best for

- 9 -
understanding difficult problems and useful when analysing a problem in its natural
setting (Gulsecen et al., 2006 and Seuring, 2008).
The research methodology will therefore be conducted as follows:
1. Literature review that includes the following:
a. A thorough overview of FMCG in South Africa, its characteristics and trends;
b. Defining supply chain with specific focus on outbound logistics;
c. The status of South African logistics and associated costs;
d. Accounting methods or methodologies used to allocate costs to activities.
2. Qualitative methods of data collection will be used by means of conducting interviews
with selected FMCG companies. Due to the author’s association with Imperial Logistics
(the author’s employer, Resolve Solution Partners, is a division of Imperial Logistics
South Africa Propriety Limited) and the sensitivity of the information, only three FMCG
companies within Imperial Logistics client database will be interviewed. The aim and
focus of the interviews will be the following:
a. Evaluating the company’s outbound logistics activities and status (e.g. whether the
activities are insourced or outsourced to a logistics service provider (LSP));
b. Understanding the company’s current accounting systems and reports used to
determine the logistics CTS on a customer and product level;
c. Determining the insights and shortcomings of the current accounting system and
reports;
d. Specifying the key components, key performance indicators (KPIs) and cost
drivers for each outbound logistics process and activity;
e. Assessing the value-add of a CTS framework and reasons why it either can or
cannot work.
3. Development of a CTS framework, underpinned by cost drivers, based on the literature
study and interview outcomes.
4. Initial validation of the proposed CTS framework through a case study application. The
case study will allow for reliable data collection on a high level of granularity. The aim
will be to demonstrate the significance of the CTS framework with examples of possible
dashboards to inform logistics/business improvement initiatives based on the results.
5. The research will be concluded by a synthesis between the conjectures and the actual
findings, with conclusions and recommendations.

- 10 -
The research methodology discussed above is depicted visually in Figure 4.
Figure 4: Research methodology
1.8 RESEARCH ASSUMPTIONS AND LIMITATIONS
The research will be confined to finished goods in the South African FMCG industry. The study
will focus primarily on outbound logistics, a major supply chain cost contributor, and will be
viewed as an integrated concept within Supply Chain Management (SCM). It will therefore
include all activities associated with primary distribution2 from manufacturing to the storage
location (or directly to customer), warehousing, as well as secondary distribution3 from the
storage facility to the customer. Excluded from the study are return logistics and all trading
activities associated with sales and marketing, i.e. order capturing, invoicing, merchandising,
after-market service etc. The latter could be included in further studies.
Although the market interviews conducted with three FMCG companies are likely not a
representative sample of the FMCG industry, it is assumed that the responses obtained are
adequate to give sufficient guidance to this study. The study should therefore not be used to
derive generic industry trends. However, the author strongly believes that the responses will
be very similar should more FMCG companies have been engaged, based on the author’s
professional experience and informal discussions with interested parties.
2 Defines distribution from point of manufacturing to point of storage, which is normally a regional
distribution centre. This is also referred to as bulk haul (APICS, 2017)
3 Refers to distribution from point of storage to the end customer. In the FMCG environment this is
typically a retail outlet where the consumer will shop (APICS, 2017).

- 11 -
To ensure confidentiality, it should also be noted that the actual values of the company
information used in the case study were substituted in reporting the case study results.
However, the relationship between the values remains unchanged so that they reflect the true
insights that can be derived when applying the framework. The case study company audited
the actual values to establish the reliability and validity of the study. The case study results
should however not be generalised as would be company specific.
1.9 RESEARCH CONTRIBUTIONS
The outcomes of the study can assist FMCG companies to understand the cost components
and associated cost drivers for the activities related to outbound logistics. The author’s
contribution to the scientific knowledge base will be in the form of a cost allocation framework
that can enable FMCG companies to determine and evaluate the outbound logistics CTS on a
customer and product level. Appropriate business and continuous improvement decisions can
be taken based on the results obtained from the framework. The framework can also serve as
a foundation for future research that aims to incorporate additional supply chain processes or
expanding the framework to other industries.
1.10 RESEARCH ETHICS
A questionnaire, used during interviews with pre-selected companies, was approved by the
Faculty of Engineering, Built Environment & Information Technology (EBIT) Research Ethics
Committee at the University of Pretoria. All the interviewees were briefed on the objective of
the study and anonymity and confidentiality was ensured. The interviews were not recorded;
the author rather relied on notes taken during the interview and follow-up discussions. Neither
the company details or the interviewee’s personal details are therefore disclosed in this report.
1.11 DOCUMENT STRUCTURE
This document is structured as follows:
• Chapter 2: Introduction to FMCG and Logistics in South Africa. A literature study
is done to provide an overview of FMCG industry and outbound logistics in the South
African context. Key characteristics, challenges and opportunities are identified.
• Chapter 3: Existing Costing Models and Cost Drivers in Outbound Logistics. The
investigation of existing financial systems, reporting and alternative cost allocation
methodologies is discussed. The approach to identify cost drivers is deliberated in
order to evaluate the cost drivers in outbound logistics.

- 12 -
• Chapter 4: Market Interviews. Three market interviews were conducted, with the aim
to ascertain whether current accounting systems are lacking, to identify the cost drivers
for each outbound logistics process and activity, and to confirm whether a CTS
framework will be value adding as a reporting and decision-making tool.
• Chapter 5: Cost Driver Framework Development. Amalgamation of the literature
study and the outcomes of the market interviews to develop a framework of proposed
cost drivers, and the allocation thereof, for each outbound logistics process.
• Chapter 6: Framework Validation (A Case Study). The proposed cost drivers and
costing framework are validated through case study application. The section
demonstrates, through practical reporting examples, the value-add of defining cost
drivers to make informed business decisions relating to logistics improvement
initiatives.
• Chapter 7: Conclusions and Recommendations. The findings of chapter 2 – 6 will
be compared to the three conjectures defined in the introduction to the study to draw
the research conclusions.

- 13 -
2 INTRODUCTION TO FMCG AND OUTBOUND LOGISTICS IN SA
This chapter focuses on understanding the scope of the study, namely outbound logistics in
the South African Fast-Moving Consumer Goods (FMCG) industry. The chapter provides an
overview of the FMCG industry, and investigates the unique South African challenges and the
impact of these on outbound logistics.
2.1 FAST-MOVING CONSUMER GOODS
2.1.1 FMCG Market Overview
It’s important to note that the corresponding supply chain activities are not the same for all
supply chain industries with different products or services. In the FMCG industry the supply
chain activities may change for example for services, perishable and non-perishable goods,
since certain products must be sold in a specific time window that could be relatively short.
The FMCG supply chain is unique in the following ways:
• Stable/Pure process: Automated equipment, medium labour content, finite forward
scheduling of production and machine limited.
• Functional products: Products that are relatively low-cost and produced in high
volumes such as liquids (beer, soda) and canned goods. Innovative and new products
occur regularly.
The South African FMCG industry has a number of key characteristics which distinguish it not
only from other industries, but also from FMCG industries in other countries (inputs from CSIR,
2006:20 – 21; PWC, 2012; and Steyn, 2013):
1. Historically the industry experienced good growth with healthy profit margins. However,
recently the industry has come under pressure due to a slower GDP growth, overall
reduction in disposable income and a higher consumer price index (CPI) inflation.
2. The FMCG landscape is maturing and changing with new platforms being introduced,
including increasing numbers of convenience stores, more discount retailers and online
shopping (e-commerce). This generates fierce competition between FMCG companies.
3. South Africa has a unique combination of organised and informal trade. The organised
grocery trade sector found mainly in the urban areas has grown significantly over the
past decade, and although currently constituting a mere 5% of the stores, it accounts
for 70% of the country’s grocery turnover. Although the contribution of smaller counter-
and self-service or traditional stores is small in comparison to the organised trade, it
remains an important delivery channel.

- 14 -
4. The route to market is unique. In developed countries like Europe and in the United
States of America a product is sold largely through the formal trade with product
delivered to retail DC’s which in turn is responsible for distribution and merchandising
in retail outlets. In South Africa retail DC’s are only partly utilised as some
manufacturers still deliver directly to stores and manufacturers remain responsible for
their own merchandising.
5. South Africa’s consumer profile is very dynamic and is characterised by consumers
who are exceptionally price sensitive, prioritising value for money as a driver of choice.
As a result, the industry frequently has “special price sales” to attract consumers in the
hope of higher purchase volumes of products at lower prices. It is, however,
questionable if these special price deals realise better profit (and especially better
economic value add (EVA)) across the supply chain once all the costs are included.
6. The industry is characterised by oligopolistic relationships between major producers
and major retailers. As such the six major store groups in this industry are Pick ‘n Pay,
Shoprite Checkers, Spar, Massmart, Woolworths and Clicks with the first four
accounting for about 80% of South Africa’s retail sales. The major FMCG
manufacturers include Tiger Brands, National Brands, Pioneer Foods, Unilever SA and
SABMiller (recently acquired by AB InBev).
The introduction of a democracy in South Africa has created significant changes throughout
the country and the FMCG industry was not left untouched. The impact of these changes
includes (CSIR, 2006: 21; Kunc, 2005: 55; and PWC, 2012):
1. The potential local consumer base has grown significantly over the past decade and
is continuing to grow. In the first decade of South Africa’s democracy the population
grew by 16%, while households increased by 26%. This has resulted in a wide
consumer base and increased spending on household consumables.
2. There has been change in the consumer profile as well as an expansion of the middle
class. South Africa is characterised by a high Gini-coefficient as illustrated by a recent
survey by Statistics SA which has shown that the richest 20% of the country’s
households accounted for nearly two-thirds of total consumer spending. The income
redistribution strategies have led to an increased number of households entering the
middle and middle-lower income groups.
3. The change in consumer configuration has fuelled the need for more products, but
also for different products and different distribution locations.
4. Although South Africa’s diverse population is spread over a large geographic region,
the large retail outlets are concentrated predominantly in the Western Cape and

- 15 -
Gauteng since more than 60% of South African retail sales occur in these two
provinces.
5. Although formal trade has historically focussed on developed urban areas whilst
informal trade had to service the urban and township areas, retailers have realised the
tremendous opportunities in these previously poorer areas. This has resulted in the
creation of numerous shopping centres and new retail outlets in disadvantaged areas
in an attempt to adapt to the nation’s changing consumer face.
6. The introduction of new varieties has been cemented on a more positive consumer
attitude towards premium products over cheaper alternatives, as well as demographic
and life-style changes. This situation played a vital role in determining the ability of
suppliers to ‘trade up’ from lower-priced towards premium products. Trading up has
also been fuelled by new product developments offering value-added benefits aimed
at different lifestyles. The affordability of premium products and life-style changes is
however directly linked to personal disposable income.
7. In the era of internet and social media, it’s easier for consumers to compare products,
prices and customer experiences online and in real-time. This bring unprecedented
power to the consumer that will further intensify competition in the South African
market.
2.1.2 FMCG Supply Chain Challenges
In recent times the impact of higher levels of consumer price index (CPI) inflation (Kelly, 2016
and StatsSA, 2017) leads to reduced consumer spend, makes it even more difficult for FMCG
companies to be competitive. In addition, the change of retail/customer demographics, product
mix and the need for agile, yet reliable supply chains add to the complexity.
Supply chain costs, especially outbound logistics, are substantial in order to get the right
product, in the right quantities, in the right time to the right customer, profitably. Some
challenges exposing outbound logistics cost includes the following (CSIR, 2006 and KPMG,
2015 and PWC, 2012).
1. South African organisations not placing emphasis on designing agility into their supply
chains, which is required to respond effectively to changing consumer demands.
2. High levels of inventory (working capital) is kept to guard against the uncertainty of
demand, especially in the case of seasonal products.
3. Distribution capacity to replenish product remains a challenge, as the need to distribute
product to customers mimicking actual demand signals becomes more critical.

- 16 -
4. Since FMCG product margins are relatively low, logistics is constantly under pressure
to reduce costs without compromising customer service.
5. The unique South African retail trade offers logistical challenges, both geographically
and demographically. The vast retail outlet footprint results in a smaller delivery size
per store (if demand increases at a lower rate than that of retail outlets).
6. Increased traffic volumes and back-door inefficiencies at retailers are still a concern,
and seen as the key constraint rather than vehicle capacity (weight or volume).
The above discussion clearly highlights that the South African FMCG supply chain and logistics
is severely pressured to increase customer service constantly, whilst reducing cost. This
should be achieved despite significant growth in consumer outlets and the increased number
of stock keeping units (SKU’s) to service the unique and changing consumer market. (CSIR,
2006: 22). The unique challenges of outbound logistics within the South African context are
discussed in Section 2.2.
2.2 OUTBOUND LOGISTICS AND FMCG
According to the Havenga et al. (2016: 5), the absolute cost of South African logistics in 2012
was R379 billion, increasing by 3.5% in 2013 to R393 billion and increased further with 9.3%
to R429 billion in 2014. It is estimated to have grown by 9.5% during 2015 and 6.3% in 2016
(the final growth percentages are not published yet).
In 2007 the supplychainforesight stated the most important supply chain objectives for South
African companies are improving collaboration, improving service delivery to customers and
reducing logistics cost (Barloworld Logistics, 2007:12). The CSIR (2013:ii) further states that
the demand for logistics and the performance of the logistics industry (specifically the cost of
logistics) has a severe impact on the global competitiveness of South African industries. This
is affirmed by the 2014 supplychainforesight, stating that “businesses that successfully
combine value-creating customisation with cost-effective delivery outperform industry peers
two-to-one in revenue growth and generate profit margins 5 – 10% above their competitors.’’
(Barloworld Logistics, 2014:2). Retaining and sustaining financial returns is the supreme
objective and “the real opportunity lies in a company’s ability to ensure costs are managed in
relation to creating value going forward” (Barloworld Logistics, 2016).
South Africa’s road network is the longest of any African country and about 89% of the
country’s freight relies on this mode of transport (CSIR, 2012). Logistics outsourcing is still a
prevalent trend in today’s business environment, with no exception to the FMCG industry.
There is a large number of reasons why outsourcing is an attractive option, including cost

- 17 -
savings, flexibility, need for better skills and management, focus on strategy and core functions
as well as optimal flow of goods, finances and information in the FMCG supply chain.
Respondents to the research conducted by the 2014 supplychainforesight again ranked the
cost of transport as the top supply chain constraint. This is not a surprise, since transportation
costs typically constitutes more than 50% of supply chain cost for South African businesses
(Barloworld Logistics, 2014:15).
As mentioned previously, the high logistics cost as a percentage of transportable GDP in 2014
could either mean that:
i. Logistics are becoming less efficient, or
ii. That the cost drivers to deliver the same amount of volume are growing faster than the
value of the goods transported.
FMCG industries are primarily make-to-stock4 environments with some exceptions of make-
to-order5. The strategy of each FMCG industry organisation can change, but the most common
is a productivity or revenue growth strategy and to ensure quality products at the lowest price.
To maximise profit, the logistics function should be geared to get the product to the customer
on time, in the right quantities and in the fashion required at the lowest possible cost.
This vast logistics cost spent by companies is the result of the ultimate goal of supply chain
and logistics: to satisfy end-customer value. The term end-customer can be defined as the last
point in the supply chain where an FMCG manufacturer delivers a product for consumption
(APICS, 2017). An example of end-customer could be a retailer DC, a retailer store, caterer,
convenience store, or in the world of on-line shopping even a consumers’ home. Companies
still view supply chain and logistics optimisation as a key focus area to outperform its
competition, especially in the FMCG industry where client centricity and superior customer
service becomes more-and-more prevalent.
4 A production environment where products can be and usually are finished before receipt of a customer
order. Customer orders are typically filled from existing stocks, and production orders are used to
replenish those stocks (APICS, 2017).
5 A production environment where a good or service can be made after receipt of a customer order. The
final product is usually a combination of standard items and items custom-designed to meet the special
needs of the customer (APICS, 2017).

- 18 -
2.3 LINKING LOGISTICS AND CUSTOMER SERVICE
As stated in Section 2.2, companies believe that the delivery process is as much responsible
for a competitive advantage as the product itself. FMCG companies are under pressure to
reduce logistics cost to maintain or improve profits, without compromising customer service
levels. Measuring the performance and underlying cost of the entire delivery process, also
termed outbound logistics cost-to-serve (CTS), will bring about a mindset change in companies
to benefit/profit from improved customer service. This notion is supported by Christopher et al
(2005) confirming the important link between logistic-base activity costs and customer
satisfaction.
“For a long time, we have accepted the convention that as service levels rise, so also does the
cost-to-serve, exponentially” (Christopher et al., 2005). The comparison between the CTS and
customer service levels is an important measure to determine both over- and under servicing
of customers that leads directly to cost-effectiveness and hence profit potential. It is therefore
essential, through CTS modelling, to realistically compare the true CTS with the service profile
on a customer and product level. This would enable a company to design a cost-effective
logistics solution to “find the optimal or appropriate level of service” (Christopher et al., 2005).
2.4 CONCLUDING REMARKS
Logistics remains of strategic importance to companies due to the high costs involved and the
direct link to customer service. Although the absolute logistics costs and the logistics costs as
a percentage of transportable GDP is rising, it is not a question of logistics efficiency, but rather
of the increase in the underlying cost drivers. The latter needs to be understood in detail in for
companies to react appropriately, which will assist management to focus on the true cost
drivers before they become costs.
In a consumer centric FMCG industry, companies realise that an effective and efficient supply
chain and logistics could unquestionably be a competitive advantage. By purely focussing on
reducing logistics costs could be detrimental to service levels; therefore, the industry’s
challenge remains to optimally balance the logistics CTS with good and reliable customer
service. Without sufficient insight into the logistics cost drivers the trade-off becomes
problematic.
Evaluating the cost drivers of outbound logistics shouldn’t only retrospectively measure
efficiency and costs, but can also be used to ascertain the impact of future what-if scenarios.
The what-if scenarios, for example, could entail understanding the sensitivity of the cost drivers
or quantifying the impact of changes in the logistics network.
- 19 -
3 ACCOUNTING AND COST DRIVERS IN OUTBOUND LOGISTICS
Chapter 2 introduced the Fast-Moving Consumer Goods (FMCG) industry and provided an
overview of logistics as part of supply chain management (SCM). The link between the logistics
cost-to-serve (CTS) and customer service levels is essential to improve profits through the
design of an appropriate and cost-effective outbound logistics solution. Measuring and
understanding the true logistics CTS on customer and product level is a key enabler to achieve
potential cost reductions and increased profits, required by the FMCG industry.
This chapter will firstly provide an overview of current financial reporting in view of logistics
management, focussing on its importance and potential shortfalls. Secondly, it examines how
cost allocation methodologies, specifically activity based costing (ABC), can be used to
improve the accuracy and understanding of logistics costs to overcome the shortfalls of
traditional accounting practices. Lastly, the method of identifying cost drivers will be discussed
which are essential to measuring a company’s logistics cost performance on a more granular
level.
3.1 FINANCIAL REPORTING
Profitability measurement is a key FMCG business objective: to improve return on equity
(ROE) for the company shareholders (Bansal 2014). In simple terms ROE equals net profit
divided by equity. It is therefore clear that this involves both the maximisation of income
statement value (net profit) as well as the optimisation of the balance sheet (equity) items.
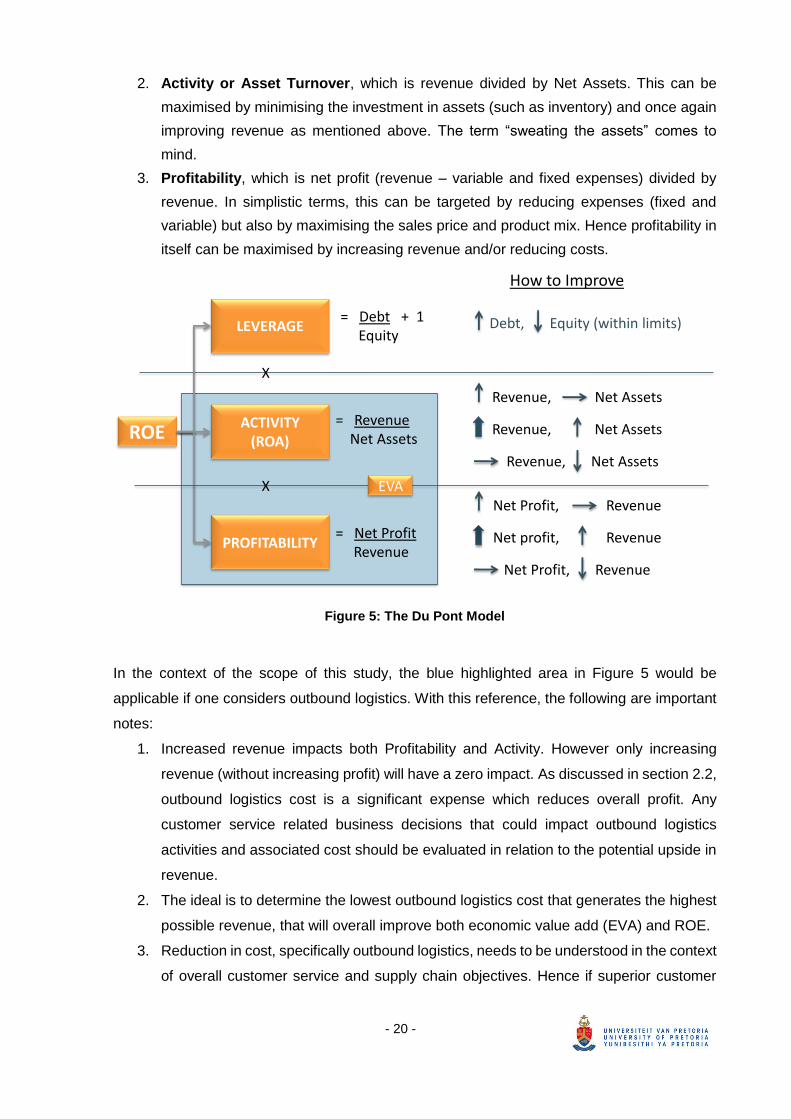
The DuPont model (Correria et al., 2003) is a financial management technique with the
objective to maximise wealth and measures how effectively this objective is achieved. The
DuPont equation focusses on ROE as the overall indicator of success, considering three key
levers namely Leverage, Activity and Profitability. The ROE formula is shown in the following
formula:
𝑅𝑂𝐸 = 𝐿 × 𝐴 × 𝑃
= (𝑑
𝑒+ 1) ×
𝑟
𝑎 × 𝑝
𝑟
Where:
L = Leverage; with variables debt (d) and equity (e)
A = Activity; with variables revenue (r) and net assets (a)
P = Profitability; with variables net profit (p) and revenue (r)
Figure 5 is a graphical representation of the model, which can be explained as follows:
1. Leverage, which is the relationship between Debt and Equity in the organisation.
Hence the financing of the organisation directly impacts the return of equity holders.
- 20 -
2. Activity or Asset Turnover, which is revenue divided by Net Assets. This can be
maximised by minimising the investment in assets (such as inventory) and once again
improving revenue as mentioned above. The term “sweating the assets” comes to
mind.
3. Profitability, which is net profit (revenue – variable and fixed expenses) divided by
revenue. In simplistic terms, this can be targeted by reducing expenses (fixed and
variable) but also by maximising the sales price and product mix. Hence profitability in
itself can be maximised by increasing revenue and/or reducing costs.
Figure 5: The Du Pont Model
In the context of the scope of this study, the blue highlighted area in Figure 5 would be
applicable if one considers outbound logistics. With this reference, the following are important
notes:
1. Increased revenue impacts both Profitability and Activity. However only increasing
revenue (without increasing profit) will have a zero impact. As discussed in section 2.2,
outbound logistics cost is a significant expense which reduces overall profit. Any
customer service related business decisions that could impact outbound logistics
activities and associated cost should be evaluated in relation to the potential upside in
revenue.
2. The ideal is to determine the lowest outbound logistics cost that generates the highest
possible revenue, that will overall improve both economic value add (EVA) and ROE.
3. Reduction in cost, specifically outbound logistics, needs to be understood in the context
of overall customer service and supply chain objectives. Hence if superior customer
Debt, Equity (within limits)
ROE
LEVERAGE
ACTIVITY(ROA)
PROFITABILITY
= Debt + 1Equity
= RevenueNet Assets
= Net ProfitRevenue
Revenue, Net Assets
Revenue, Net Assets
Revenue, Net Assets
Net Profit, Revenue
Net profit, Revenue
Net Profit, Revenue
How to Improve
EVAX
X

- 21 -
service is an order winner in a specific segment of the market and the cost reduction
objective will imply a reduction thereof, then it is obviously not advisable to consider
both. The CTS results should therefore be considered in the context of the overall
business strategy.
Outbound logistics cost reduces overall profitability, which as discussed, is a key financial
measure. However, Hill (2013) argues that businesses still don’t have the financial controls to
understand the true cost of the product or service they sell, which is required to accurately
calculate customer or product profitability. Ryals (2008) mentions that income statements or
management accounts are traditionally setup where logistics or distribution cost is reported on
an aggregated level in the income statement (also known as the profit and loss account) as an
overhead, and not at individual customer level.
Figure 6 depicts an approach to determine customer profitability after allocating all company
costs (Christopher 1998, and Ryals 2008), which follows a similar income statement format
still relevant today. The “Distribution Service costs” component in the diagram, except for trade
credit and order processing, is the key focus area of this study.
Figure 6: Customer Profitability Analysis

- 22 -
Gross Contribution after Production is generally easy to obtain at company level. To convert
from this to customer profitability does however require fair allocation of sales, marketing and
logistics costs to customer transactions. As mentioned before the value is not just the overall
answer of customer profitability, but also the understanding of what drives the cost. Therefore,
alignment between key stakeholders regarding the different cost drivers is vital.
The 80:20 rule is often cited, which is that 80% of sales often come from 20% of customers
(Ryals, 2008), therefore implying that it’s very likely that FMCG companies are servicing
unprofitable customers. All customer service related expenses should be allocated to fully
understand the true profitability of individual customers and products. Outbound logistics is a
significant customer service expense, and its associated cost drivers should therefore be
evaluated and defined as input to the CTS allocation framework.
Pohlen and Coleman (2005) considered a framework in which activity based costing (ABC) is
used to quantify the considerations of an economic value added (EVA) analysis in terms of
costs. Determining customer profitability considering the activity based costing (ABC)
methodology (Schulze et al., 2012; Cooper and Kaplan, 1991; Foster and Gupta, 1994) and
the impact on ROE (DuPont analysis) are widely applied in companies (Ye, 2001; Krajnc et al.,
2012). ABC can be a useful cost allocation methodology, since it provides a structured
approach to measure how products and customers consume logistics resources (Bokor, 2015).
3.2 ACTIVITY BASED COSTING
'Activity Based Costing is a methodology that measures the cost and performance of
activities, resources and cost objects, assigns resources to activities and activities to cost
objects based on their use, and recognises the causal relationships of cost drivers to
activities'
(Thermido, Arantes, Fernandes, and Guedes, 2000:1149)
The ABC methodology has been around since the early 1980s and was first advocated by
Harvard Business School Professor Robert S. Kaplan. The concept of activity based costing
was designed to solve the distortion problems of traditional costing systems (Cooper et al.,
1988). Stapleton et al. (2001:585) illustrated that ABC identifies cost pools and assigns it to
products or services based on the number of events associated in the process to provide such
products or services.
- 23 -
ABC methodologies improved cost accounting for many companies, since it could offer more
accurate product cost than traditional accounting systems. Using ABC to assign costs to
determine the profitability of customers and products is widely accepted (Foster et al., 1994).
Although this costing methodology started out predominantly focussing on manufacturing
because of the significant costs involved, La Londe et al. (1994), Pirttila and Petri (1995:327)
point out that the methodology can be applied to other fields, including logistics. Since logistics
cost is a significant company expense, and usually buried in overheads, ABC is applied more
often in logistics to unlock the understanding of these costs (Stapleton et al., 2001:590).
The following is important to understand about ABC (adopted from Thermido et al.,
2000:1150):
1. Activities are tasks that consume resources and result in the completion of the product
or service. It is therefore important to distinguish between value-adding and non-value
adding activities.
2. The cost objective is the final product or service created as a result of the activities
mentioned in the previous point.
3. Resources are in essence the “ingredients” necessary to “produce” the goods or
service.
4. A cost driver is a variable, with a rational cause and effect relationship between the
utilisation of the resource, the performance of activities and final cost objectives.
5. Operational cost drivers, or cause of cost, are those variables that determine the
workload and hence explain why activities are performed.
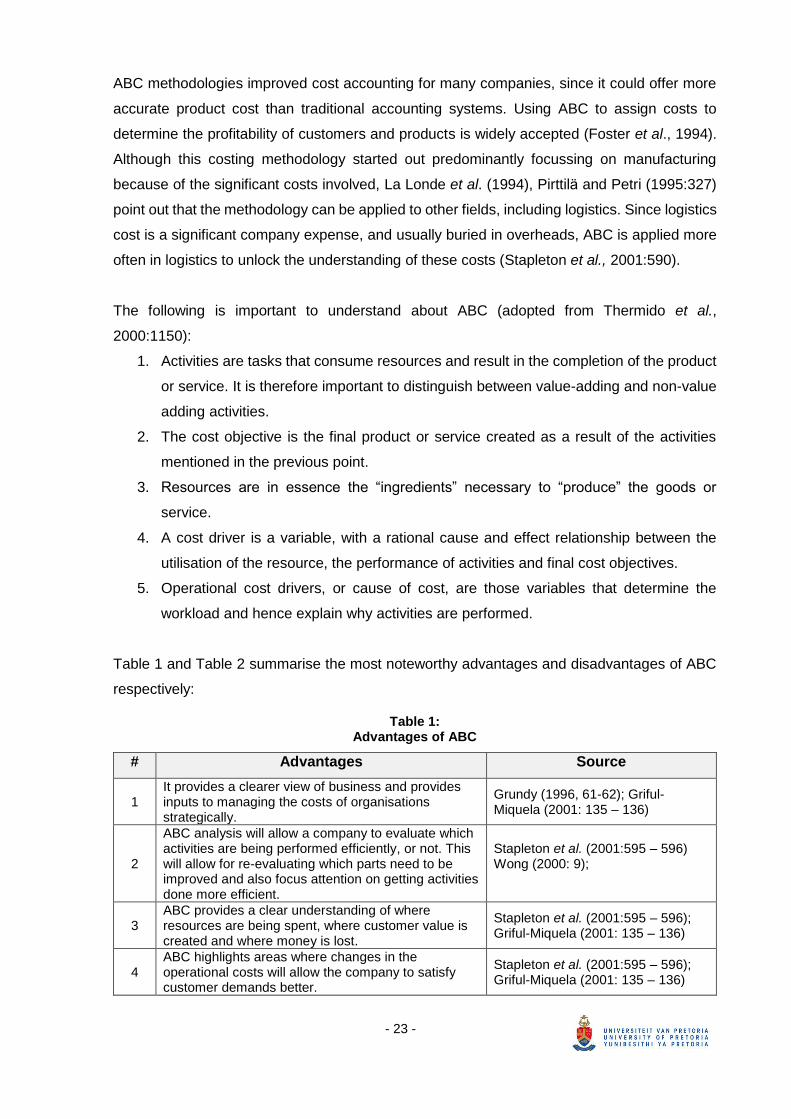
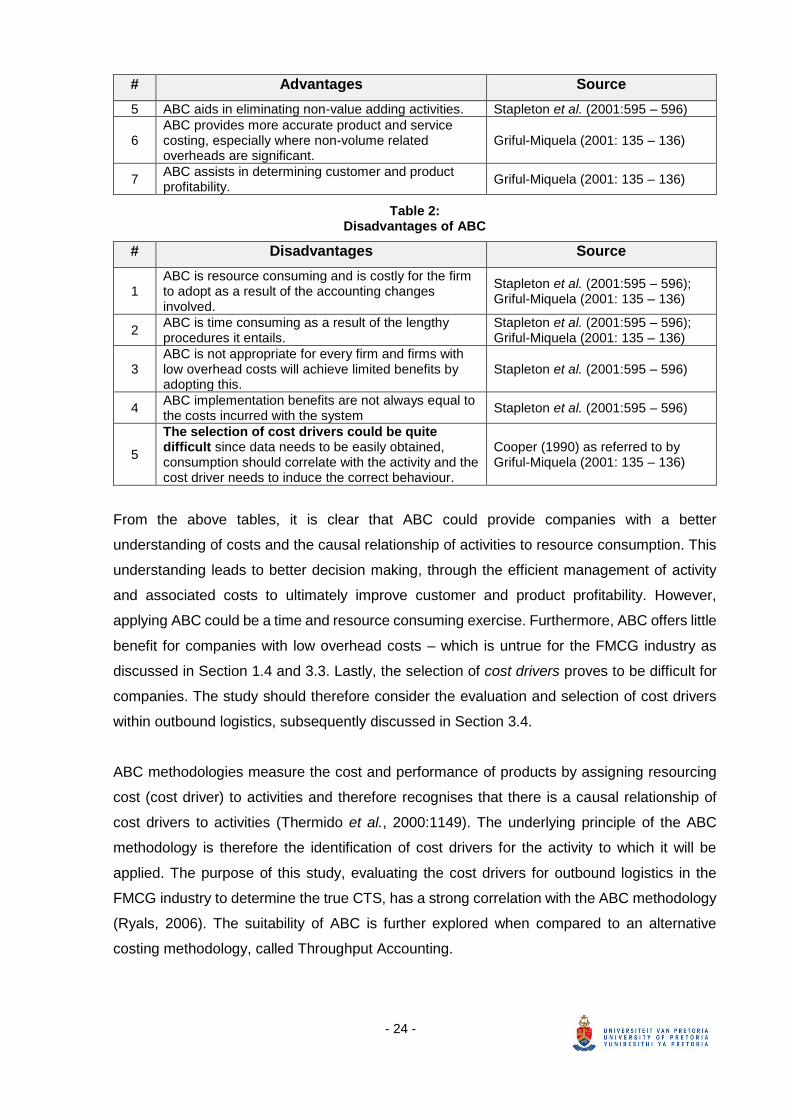
Table 1 and Table 2 summarise the most noteworthy advantages and disadvantages of ABC
respectively:
Table 1: Advantages of ABC
# Advantages Source
1 It provides a clearer view of business and provides inputs to managing the costs of organisations strategically.
Grundy (1996, 61-62); Griful-Miquela (2001: 135 – 136)
2
ABC analysis will allow a company to evaluate which activities are being performed efficiently, or not. This will allow for re-evaluating which parts need to be improved and also focus attention on getting activities done more efficient.
Stapleton et al. (2001:595 – 596) Wong (2000: 9);
3 ABC provides a clear understanding of where resources are being spent, where customer value is created and where money is lost.
Stapleton et al. (2001:595 – 596); Griful-Miquela (2001: 135 – 136)
4 ABC highlights areas where changes in the operational costs will allow the company to satisfy customer demands better.
Stapleton et al. (2001:595 – 596); Griful-Miquela (2001: 135 – 136)
- 24 -
# Advantages Source
5 ABC aids in eliminating non-value adding activities. Stapleton et al. (2001:595 – 596)
6 ABC provides more accurate product and service costing, especially where non-volume related overheads are significant.
Griful-Miquela (2001: 135 – 136)
7 ABC assists in determining customer and product profitability.
Griful-Miquela (2001: 135 – 136)
Table 2: Disadvantages of ABC
# Disadvantages Source
1 ABC is resource consuming and is costly for the firm to adopt as a result of the accounting changes involved.
Stapleton et al. (2001:595 – 596); Griful-Miquela (2001: 135 – 136)
2 ABC is time consuming as a result of the lengthy procedures it entails.
Stapleton et al. (2001:595 – 596); Griful-Miquela (2001: 135 – 136)
3 ABC is not appropriate for every firm and firms with low overhead costs will achieve limited benefits by adopting this.
Stapleton et al. (2001:595 – 596)
4 ABC implementation benefits are not always equal to the costs incurred with the system
Stapleton et al. (2001:595 – 596)
5
The selection of cost drivers could be quite difficult since data needs to be easily obtained, consumption should correlate with the activity and the cost driver needs to induce the correct behaviour.
Cooper (1990) as referred to by Griful-Miquela (2001: 135 – 136)
From the above tables, it is clear that ABC could provide companies with a better
understanding of costs and the causal relationship of activities to resource consumption. This
understanding leads to better decision making, through the efficient management of activity
and associated costs to ultimately improve customer and product profitability. However,
applying ABC could be a time and resource consuming exercise. Furthermore, ABC offers little
benefit for companies with low overhead costs – which is untrue for the FMCG industry as
discussed in Section 1.4 and 3.3. Lastly, the selection of cost drivers proves to be difficult for
companies. The study should therefore consider the evaluation and selection of cost drivers
within outbound logistics, subsequently discussed in Section 3.4.
ABC methodologies measure the cost and performance of products by assigning resourcing
cost (cost driver) to activities and therefore recognises that there is a causal relationship of
cost drivers to activities (Thermido et al., 2000:1149). The underlying principle of the ABC
methodology is therefore the identification of cost drivers for the activity to which it will be
applied. The purpose of this study, evaluating the cost drivers for outbound logistics in the
FMCG industry to determine the true CTS, has a strong correlation with the ABC methodology
(Ryals, 2006). The suitability of ABC is further explored when compared to an alternative
costing methodology, called Throughput Accounting.

- 25 -
3.3 THROUGHPUT ACCOUNTING VS. ACTIVITY BASED COSTING
Another philosophy challenging existing cost accounting and productivity improvements is
called the Theory of Constraints (TOC), developed by Dr. Eli Goldratt in the early 1980’s
(Spector, 2006: 45). TOC proposes an alternative accounting structure, called Throughput
Accounting (TA) which consists of the following three basic operating measures (Cox &
Spencer, 1998: 19; Sheu, Chen & Kovar, 2003: 434; Simatupang, Sridharan, Wright, 2004:
67):
1. Throughput (T), which is the rate at which the system (organisation or supply chain)
generates money through sales, in other words, revenue generated through the
production of sold products.
2. Inventory (I), which is the money invested in things the system intends to sell. The
“value-added” aspect of inventory is not accounted for to eliminate the temptation
to overproduce unneeded inventory to simply look good on paper. This includes
inventory as well as fixed assets and it is viewed as a liability rather than an asset.
3. Operating expense (OE), which is the money the system spends in turning
inventory into sales. This includes direct labour, manufacturing overhead as well as
selling and administrative costs.
Like the Du Pont analysis as discussed in section 3.1, Net Profit (NP), Productivity (P), Return
on Assets (ROA) and Return on Investment (ROI) are key financial measures, calculated as
follows:
𝑁𝑃 = 𝑇 − 𝑂𝐸
𝑃 =𝑇
𝑂𝐸
𝑅𝑂𝐴 =(𝑇 − 𝑂𝐸)
𝐼
𝑅𝑂𝐼 =𝑁𝑃
𝐼
As with ABC, TA has predominantly been applied to decision making in manufacturing. No
research could be found where TA was applied specifically to logistics, likely since the cost of
manufacturing is typically higher than that of logistics and that the focus is rather on a scarce
resource such as manufacturing (as defined by Simatupang, Sridharan & Wright, 2004).
One of the most fundamental differences between ABC and TA is how each deal with fixed
and variable costs. According to Mohr and Fourie (2004: 236) variable costs and fixed costs
are defined as follows:

- 26 -
1. Variable cost is defined as cost that changes when the total product volume, level or
quantity changes, therefore it corresponds to the cost of variable inputs. It is also
referred to as direct costs, prime costs or avoidable costs. In logistics, these costs can
be defined as the costs associated with the activity of distribution, and includes costs
such as fuel, tyres and toll fees. Labour is generally not a variable cost since the cost
is payable even if there is no activity. Hired labour are paid a rate per hour and hired
on a day to day basis, required to conduct an activity, may be considered as a variable
cost.
2. Fixed cost is defined as a cost that remains constant irrespective of the quantity of
output produced. These are therefore the costs incurred when no activity occurs and
include overheads, indirect or unavoidable costs. In terms of distribution, fixed costs
will be incurred whether the vehicle moves or is stationary. For vehicles this will include
depreciation, cost of capital, vehicle licences, insurance, as well as driver and assistant
salaries (assuming they are not labour hired on a day to day basis).
As explained previously, ABC splits costs between variable (direct) and fixed (indirect) which
is unlike TA, which doesn’t see the split as useful or applicable. This is because manufacturing,
where TA is mostly applied, is typically considered an indirect or fixed cost (adapted from
Dugdale and Jones, 1998:207; Sheu, Chen and Kovar, 2003:436; Simatupang, Sridharan,
Wright, 2004: 57 – 70). However, this is not the case for outbound logistics since it does
comprise variable costs as described above. For this reason, the ABC is more appropriate for
this study and therefore the chosen costing methodology.
As discussed in Section 3.2, ABC requires that cost drivers be defined for each activity in
question. Like the ABC methodology, the CTS framework will consider outbound logistics
processes and its related activities with associated cost drivers. The steps of identifying the
cost drivers and evaluating the causal relationship to activities is an important consideration.
3.4 IDENTIFYING COST DRIVERS
A company needs to clearly define the costs associated with deploying resources/activities
within the outbound logistics operation/process and then to ascertain the cost driver behind
each activity. This is to ensure accurate and fair allocation to customers and products when
calculating the CTS. The following steps are recommended to identify cost drivers for a function
or process (inputs from Stapleton, 2001: 586 – 590):
1. Create a process overview of the activities performed. This is important as it identifies
all the activities performed in the scope of the function being studied.

- 27 -
2. Obtain data on activities performed, which are also termed “cost drivers”. This includes
the quantity and type of activities required to produce/supply in each step of the
process.
3. Determine the costs associated with the process, therefore source all the relevant costs
(fixed and variable) associated with the process. Attention to detail is important to
ensure that all value and non-value adding costs are identified.
4. Allocate costs to each activity or group of activities. It is important that the
understanding of costs and activities be sufficient to allow for correct allocation of costs.
In many instances, fixed costs will need to be allocated to more than one group of
activities and the best available information or best guess should be used to determine
which portion of costs is allocated where.
5. Critically evaluate each group of activity. This helps to determine which activities are
cost effective, and steps can then be initiated to reduce costs or increase profit.
Outsourcing, cutting back or elimination are possibilities of such steps that may be
initiated to deal with activities that are cost prohibitive. The implementation of these
changes is known as activity based management (ABM). More relevant to this study,
this also forms the basis of product/service/customer profitability. By comparing the
Gross Contribution spent on these products/services/customers to the allocated costs
(as allocated via the CTS framework), companies can determine which product/
service/customer is profitable and which is not. This forms the basis of understanding
the reasons for profitability or non-profitability and will enable companies to re-focus on
increased profitability and underlying cost drivers.
For purposes of this study, the accuracy of ABC is reliant upon understanding the cost of
outbound logistics, the activities performed and the associated cost drivers. Table 3
summarises likely cost drivers for the outbound logistics environment, split between
warehousing and distribution (Lyly-Yrjänäinen and Paranko, 2001:1; Stapleton et al.,
2001:592; Griful-Miquela, 2001:139 – 142):
Table 3: Theoretical Outbound Logistics Cost Drivers
Process Activity Group Activities Cost Drivers
Ware
ho
usin
g
Handling In Unloading incoming goods Quantity and packaging (pallets or
cases or units)
Palletise Quantity and packaging (pallets or
cases or units)
Check incoming goods Quantity and packaging (pallets or
cases or units) as well as the quality
of the supplier

- 28 -
Put away Quantity and packaging (pallets or
cases or units)
Storage Storage Shelf space used
Replenishment Quantity
Handling Out Picking6 Quantity and packaging (pallets or
cases or units) as well as number of
visits to the pick location
Packaging and labelling Number of orders picked
Load outgoing goods Quantity
Dis
trib
uti
on
Transport Delivery to site Distance and m2 of pallet throughput
Trucking Distance and m2 of pallet throughput
Unloading at customer Number of consignments and type
of consignee
Sorting Number of consignments and
number of cases/pallets per
consignment
Return Empty container return Space and time required
Collection at consignor
location
Distance and number of collections
Admin Proof of delivery Number of consignments
Invoicing Number of consignments
The cost drivers summarised in above Table 3 provides a valuable understanding of the cost
drivers linked to an activity within a specific outbound logistics process. These cost drivers will
be exploited in Chapter 5 as a contributing consideration in the development of the CTS
framework.
It is worth noting that the FMCG industry is mostly making use of wooden pallets (as mentioned
in Table 3), on which product is loaded (Wiggill, 2016). A pallet is “a platform designed to be
loaded with packages and moved by forklift” (or other suitable material handling equipment)
(APICS, 2017). A pallet would therefore typically contain a number of units or cases of the
same or a mix of finished product on the same pallet.
3.5 CONCLUDING REMARKS
Companies still don’t have the financial controls to understand the true CTS of the product or
service they sell. Costing methodologies, such as ABC and TA, were developed to overcome
this challenge. ABC provides a systematic approach to identify activities and considers
fixed/variable cost for each process which is an important consideration in this study. However,
6 Picking is the “process of withdrawing goods from stock to ship to a distribution warehouse or to a
customer (APICS, 2017)

- 29 -
both methodologies are seldom applied to outbound logistics, especially in the South African
context.
The contribution of the study is to evaluate the cost drivers within the South African FMCG
industry and to design a cost allocation framework to calculate and allocate the true outbound
logistics CTS on a customer and product level. The value proposition is for FMCG companies
to understand whether all customers and products are making a positive contribution to the
company’s bottom line and where potential improvement opportunities could be.
The inter alia potential benefits of identifying cost drivers and the CTS framework are:
1. A systematic approach to increase profitability;
2. A platform to develop the appropriate route to market strategy;
3. An understanding of drivers (of cost and performance) and their impact (not just their
result);
4. An opportunity to increase service levels;
5. A pro-active approach to managing an efficient route to market strategy;
6. An understanding of transactions from a customer rather than internal perspective.
A structured interview process, to deal with current events, was followed to gather relevant
information from preselected FMCG companies.

- 30 -
4 MARKET INTERVIEWS
The aim of this chapter is to test the conjectures defined in chapter 1 against the market
perception and to enrich the literature review findings. Due to the author’s association with
Imperial Logistics (the author’s employer, Resolve Solution Partners, is a division of Imperial
Logistics South Africa Propriety Limited) as well as the sensitivity of the information, only three
Fast-Moving Consumer Goods (FMCG) companies were interviewed. It is therefore important
to note that the findings from the interviews are not representative of the FMCG industry as a
whole, but rather a useful and valuable indication.
4.1 INTRODUCTION
A questionnaire was developed to use as a guideline during interviews to gather information
pertaining to the following key questions:
1. Do current accounting systems and reporting techniques provide sufficient insight into
true logistics cost on a product and customer level?
2. What are the cost drivers of outbound logistics activities in the FMCG industry?
3. What are the potential benefits of designing an outbound logistics CTS framework?
This questionnaire was divided into five main sections;
• The first two sections provide limited detail of the respondents’ role within the FMCG
company and the company itself. This is to ensure that the feedback is relevant and
meaningful to the purpose and scope of the study.
• The third section tested the respondents’ experience with current accounting systems
and reporting techniques used within the company, and possible benefits or limitations
thereof.
• The fourth section tested the respondents’ view whether an outbound logistics CTS
framework, by evaluating cost drivers and allocation logic, can be value adding to the
company. Any limitations of such framework were prompted, followed by discussing
each outbound logistics process namely (i) primary distribution, (ii) warehousing/
storage, and (iii) secondary distribution. The following key aspects were addressed in
the questions for each respective process:
a. What the key performance indicators (KPIs) are and why;
b. Whether it’s straightforward to ring-fence the operating cost associated to the
process;
c. What the typical cost components are;
d. Identifying the key operational activities that drives the cost components.

- 31 -
• The fifth section inquired whether other activities should be included in future studies,
and lastly if there’s any other considerations or remarks regarding the research.
4.2 INTERVIEW RESULTS
The interview results are summarised in this section. Since the interviews were restricted to
three FMCG companies, the results are tabled for all three respondents representing their
respective companies.
4.2.1 Respondents
To ensure a common understanding, all respondents were briefed on the purpose of this
research study and all supply chain definitions were agreed upon to ensure a comparable
outcome. This was achieved through verbal discussion and clarification making use of an
introduction page and diagrams to illustrate the research scope and logistics terminology as
used in the questionnaire and in this research report.
Table 4 provides information about the respondents’ position and division within in the FMCG
company, who has partaken in the interviews. The respondents had a detailed understanding
of their respective company’s outbound logistics operations and financial mechanisms to
respond appropriately to the questions posed.
Table 4: Market Interview: Respondents
Company Respondent 1 Respondent 2 Respondent 3
Division Supply Chain
Development Planning & Logistics Supply Chain
Position Manager: Network
Development Manager Executive
4.2.2 Company Overview – Supply Chain Focused
Supply chains likely differ between FMCG companies and even in the company itself (mainly
due to different product origins). The purpose of this section is to get a basic understanding of
the outbound logistics network of each company, and to understand how this should be
incorporated into the final CTS framework solution. Table 5 provides an overview of the
company’s supply chain.
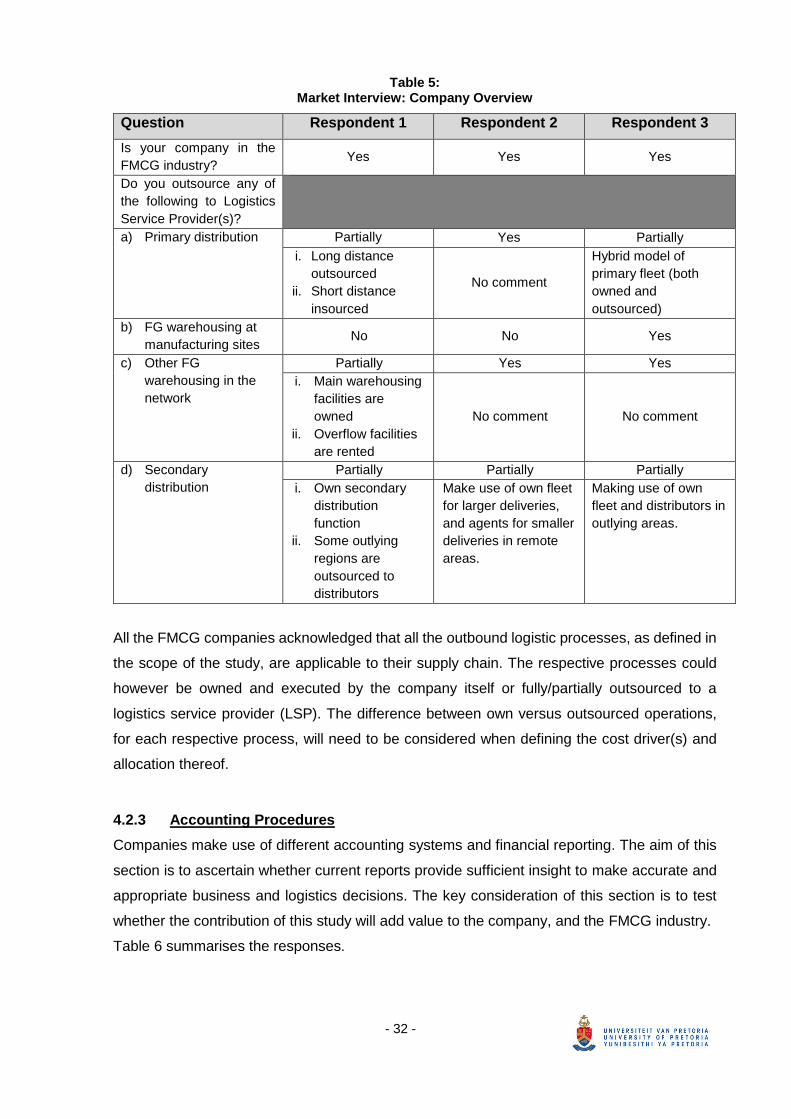
- 32 -
Table 5: Market Interview: Company Overview
Question Respondent 1 Respondent 2 Respondent 3
Is your company in the
FMCG industry? Yes Yes Yes
Do you outsource any of
the following to Logistics
Service Provider(s)?
a) Primary distribution Partially Yes Partially
i. Long distance
outsourced
ii. Short distance
insourced
No comment
Hybrid model of
primary fleet (both
owned and
outsourced)
b) FG warehousing at
manufacturing sites No No Yes
c) Other FG
warehousing in the
network
Partially Yes Yes
i. Main warehousing
facilities are
owned
ii. Overflow facilities
are rented
No comment No comment
d) Secondary
distribution
Partially Partially Partially
i. Own secondary
distribution
function
ii. Some outlying
regions are
outsourced to
distributors
Make use of own fleet
for larger deliveries,
and agents for smaller
deliveries in remote
areas.
Making use of own
fleet and distributors in
outlying areas.
All the FMCG companies acknowledged that all the outbound logistic processes, as defined in
the scope of the study, are applicable to their supply chain. The respective processes could
however be owned and executed by the company itself or fully/partially outsourced to a
logistics service provider (LSP). The difference between own versus outsourced operations,
for each respective process, will need to be considered when defining the cost driver(s) and
allocation thereof.
4.2.3 Accounting Procedures
Companies make use of different accounting systems and financial reporting. The aim of this
section is to ascertain whether current reports provide sufficient insight to make accurate and
appropriate business and logistics decisions. The key consideration of this section is to test
whether the contribution of this study will add value to the company, and the FMCG industry.
Table 6 summarises the responses.
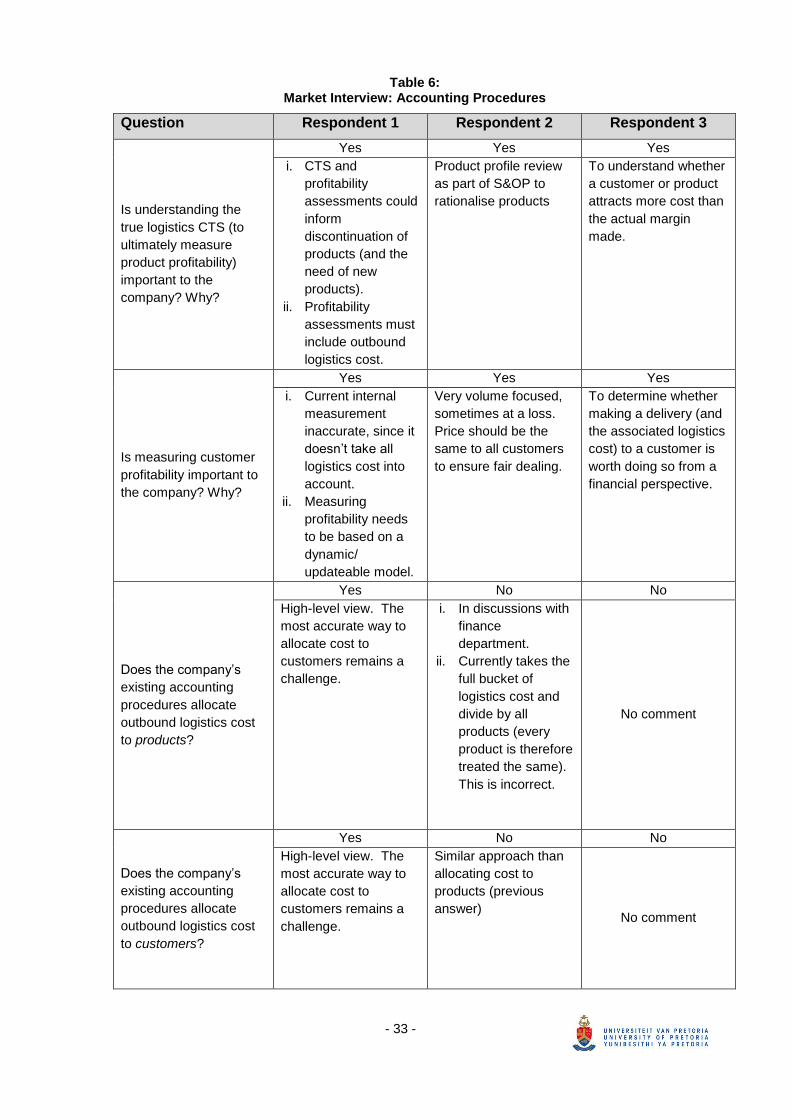
- 33 -
Table 6: Market Interview: Accounting Procedures
Question Respondent 1 Respondent 2 Respondent 3
Is understanding the
true logistics CTS (to
ultimately measure
product profitability)
important to the
company? Why?
Yes Yes Yes
i. CTS and
profitability
assessments could
inform
discontinuation of
products (and the
need of new
products).
ii. Profitability
assessments must
include outbound
logistics cost.
Product profile review
as part of S&OP to
rationalise products
To understand whether
a customer or product
attracts more cost than
the actual margin
made.
Is measuring customer
profitability important to
the company? Why?
Yes Yes Yes
i. Current internal
measurement
inaccurate, since it
doesn’t take all
logistics cost into
account.
ii. Measuring
profitability needs
to be based on a
dynamic/
updateable model.
Very volume focused,
sometimes at a loss.
Price should be the
same to all customers
to ensure fair dealing.
To determine whether
making a delivery (and
the associated logistics
cost) to a customer is
worth doing so from a
financial perspective.
Does the company’s
existing accounting
procedures allocate
outbound logistics cost
to products?
Yes No No
High-level view. The
most accurate way to
allocate cost to
customers remains a
challenge.
i. In discussions with
finance
department.
ii. Currently takes the
full bucket of
logistics cost and
divide by all
products (every
product is therefore
treated the same).
This is incorrect.
No comment
Does the company’s
existing accounting
procedures allocate
outbound logistics cost
to customers?
Yes No No
High-level view. The
most accurate way to
allocate cost to
customers remains a
challenge.
Similar approach than
allocating cost to
products (previous
answer) No comment
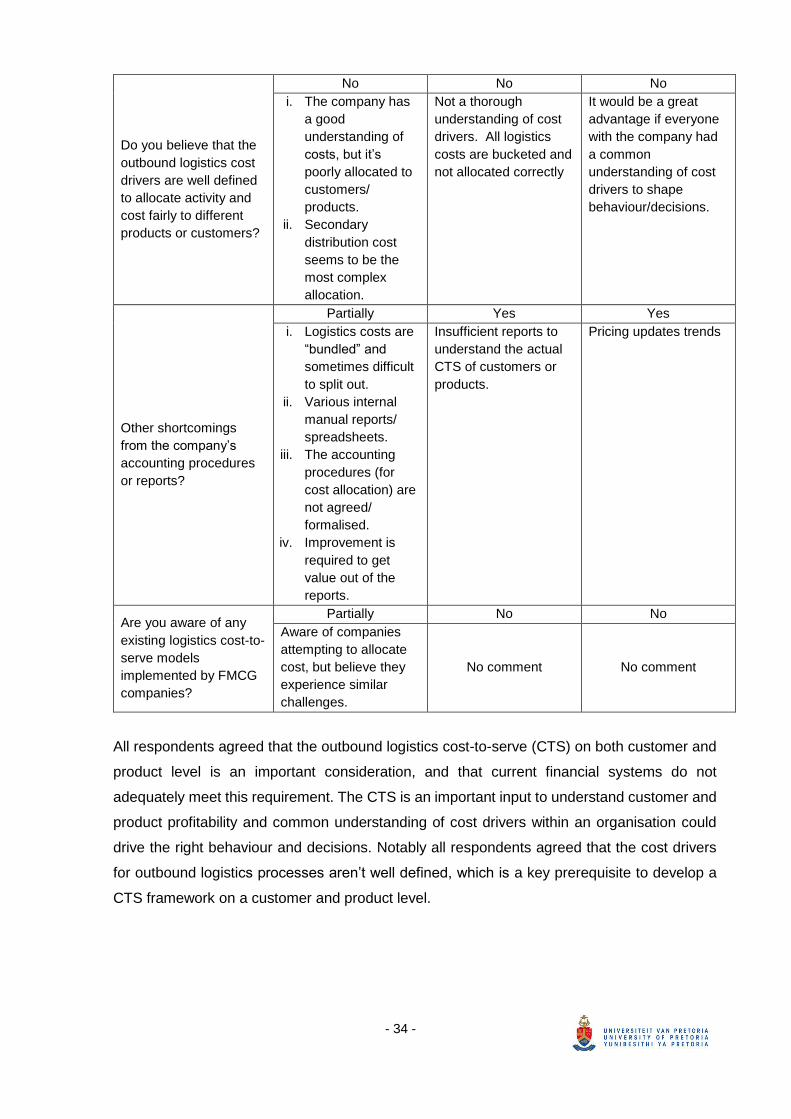
- 34 -
Do you believe that the
outbound logistics cost
drivers are well defined
to allocate activity and
cost fairly to different
products or customers?
No No No
i. The company has
a good
understanding of
costs, but it’s
poorly allocated to
customers/
products.
ii. Secondary
distribution cost
seems to be the
most complex
allocation.
Not a thorough
understanding of cost
drivers. All logistics
costs are bucketed and
not allocated correctly
It would be a great
advantage if everyone
with the company had
a common
understanding of cost
drivers to shape
behaviour/decisions.
Other shortcomings
from the company’s
accounting procedures
or reports?
Partially Yes Yes
i. Logistics costs are
“bundled” and
sometimes difficult
to split out.
ii. Various internal
manual reports/
spreadsheets.
iii. The accounting
procedures (for
cost allocation) are
not agreed/
formalised.
iv. Improvement is
required to get
value out of the
reports.
Insufficient reports to
understand the actual
CTS of customers or
products.
Pricing updates trends
Are you aware of any
existing logistics cost-to-
serve models
implemented by FMCG
companies?
Partially No No
Aware of companies
attempting to allocate
cost, but believe they
experience similar
challenges.
No comment No comment
All respondents agreed that the outbound logistics cost-to-serve (CTS) on both customer and
product level is an important consideration, and that current financial systems do not
adequately meet this requirement. The CTS is an important input to understand customer and
product profitability and common understanding of cost drivers within an organisation could
drive the right behaviour and decisions. Notably all respondents agreed that the cost drivers
for outbound logistics processes aren’t well defined, which is a key prerequisite to develop a
CTS framework on a customer and product level.

- 35 -
4.2.4 Outbound Logistics Cost-to-Serve and Cost Drivers
Table 7 lists the responses to determine whether identifying the outbound logistics cost drivers
(and the allocation thereof) will add value to the company and if any limitation could be
foreseen.
Table 7: Market Interview: Outbound Logistics CTS
Question Respondent 1 Respondent 2 Respondent 3
Will an outbound
logistics cost-to-serve
methodology, by
identifying cost drivers
and allocation logic, be
value adding to the
company?
Yes Yes Yes
Providing logistics
services to other
companies (principals)
as well. The
methodology might
assist to understand
the actual cost for the
company and its
principals.
i. Don’t understand
the true CTS on
product/customer
level.
ii. Will aid in product
pricing to
customers.
iii. Is it worth to service
some customers?
Or what service
(distribution model)
is sufficient.
i. Definite need to
identify
unprofitable
customers and
ii. Accurate allocation
on product level
will highlight if
cross-subsidising
occurs
Any limitations or
reasons why such a
methodology cannot
work?
Possibly Possibly Possibly
Concerned that even a
generic methodology
might still require some
customisation.
Agree that a
methodology could
work, but finance likes
simplicity. The model
might introduce some
complexity in
accounting principles.
Different perspective
of definitions.
All the respondents agreed that a CTS framework would add value to the company. It is
however noted that the CTS framework might need some level of customisation to reflect the
company’s outbound logistics realities and that keeping the framework simple is important.
The outbound logistics processes, namely Primary Distribution, Warehousing/Storage and
Secondary Distribution, were discussed to understand the realities of each company. The
discussion also specifically focused on the availability of costing information and the
identification of activities that drives the cost (cost driver) for each respective outbound logistics
process was encouraged. This is an important consideration to understand the availability of
data and to select cost drivers that will inform the CTS framework.
4.2.5 Primary Distribution
Table 8 lists the key performance indicators (KPIs), cost components and the activities that
drives the cost components relating to the primary distribution process.
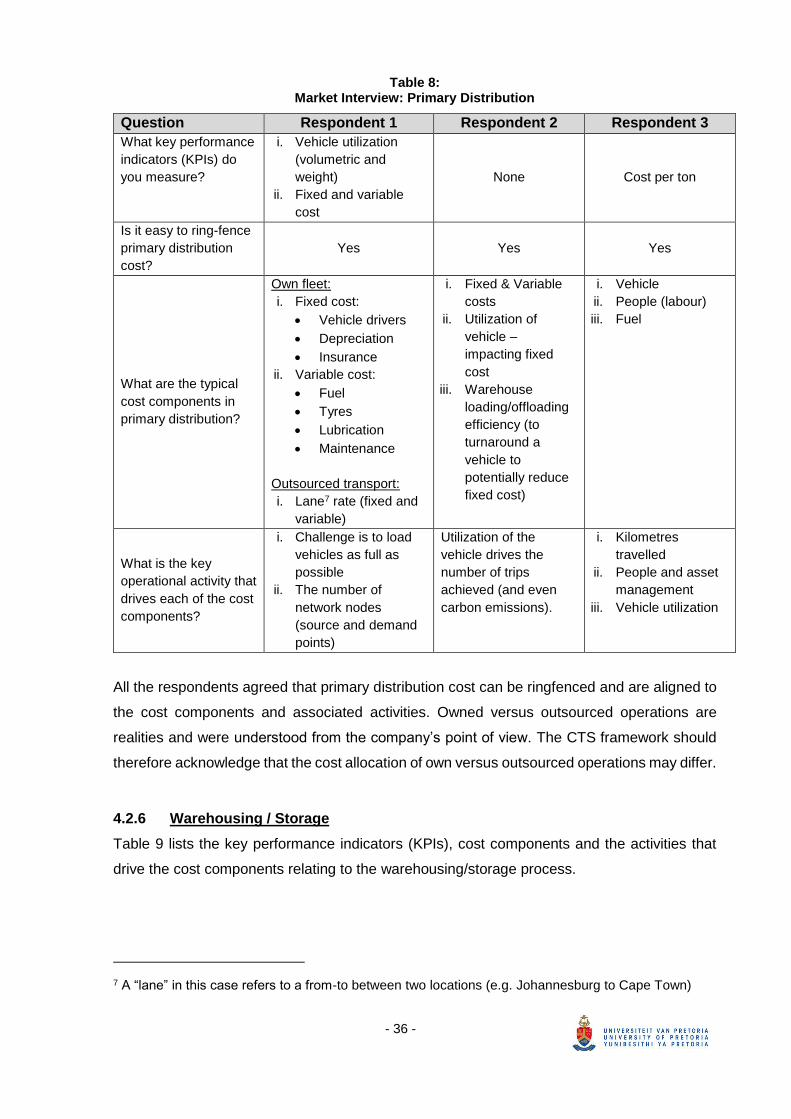
- 36 -
Table 8: Market Interview: Primary Distribution
Question Respondent 1 Respondent 2 Respondent 3
What key performance
indicators (KPIs) do
you measure?
i. Vehicle utilization
(volumetric and
weight)
ii. Fixed and variable
cost
None Cost per ton
Is it easy to ring-fence
primary distribution
cost?
Yes Yes Yes
What are the typical
cost components in
primary distribution?
Own fleet:
i. Fixed cost:
• Vehicle drivers
• Depreciation
• Insurance
ii. Variable cost:
• Fuel
• Tyres
• Lubrication
• Maintenance
Outsourced transport:
i. Lane7 rate (fixed and
variable)
i. Fixed & Variable
costs
ii. Utilization of
vehicle –
impacting fixed
cost
iii. Warehouse
loading/offloading
efficiency (to
turnaround a
vehicle to
potentially reduce
fixed cost)
i. Vehicle
ii. People (labour)
iii. Fuel
What is the key
operational activity that
drives each of the cost
components?
i. Challenge is to load
vehicles as full as
possible
ii. The number of
network nodes
(source and demand
points)
Utilization of the
vehicle drives the
number of trips
achieved (and even
carbon emissions).
i. Kilometres
travelled
ii. People and asset
management
iii. Vehicle utilization
All the respondents agreed that primary distribution cost can be ringfenced and are aligned to
the cost components and associated activities. Owned versus outsourced operations are
realities and were understood from the company’s point of view. The CTS framework should
therefore acknowledge that the cost allocation of own versus outsourced operations may differ.
4.2.6 Warehousing / Storage
Table 9 lists the key performance indicators (KPIs), cost components and the activities that
drive the cost components relating to the warehousing/storage process.
7 A “lane” in this case refers to a from-to between two locations (e.g. Johannesburg to Cape Town)
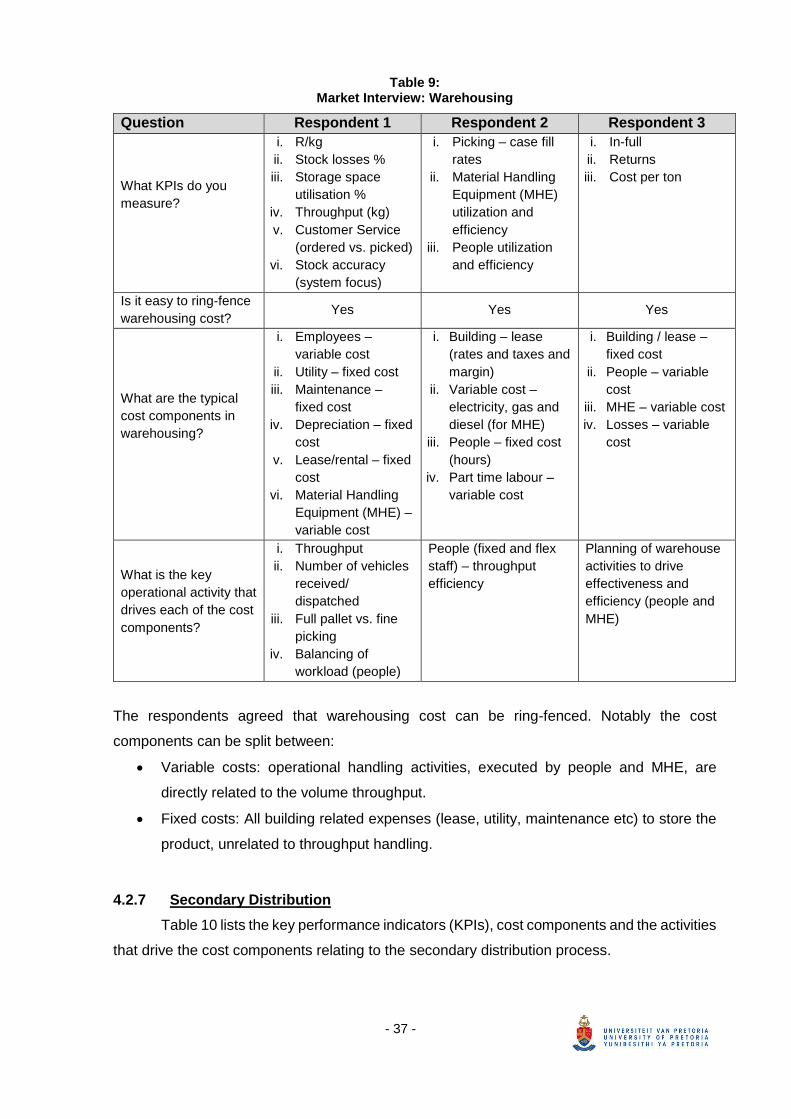
- 37 -
Table 9: Market Interview: Warehousing
Question Respondent 1 Respondent 2 Respondent 3
What KPIs do you
measure?
i. R/kg
ii. Stock losses %
iii. Storage space
utilisation %
iv. Throughput (kg)
v. Customer Service
(ordered vs. picked)
vi. Stock accuracy
(system focus)
i. Picking – case fill
rates
ii. Material Handling
Equipment (MHE)
utilization and
efficiency
iii. People utilization
and efficiency
i. In-full
ii. Returns
iii. Cost per ton
Is it easy to ring-fence
warehousing cost? Yes Yes Yes
What are the typical
cost components in
warehousing?
i. Employees –
variable cost
ii. Utility – fixed cost
iii. Maintenance –
fixed cost
iv. Depreciation – fixed
cost
v. Lease/rental – fixed
cost
vi. Material Handling
Equipment (MHE) –
variable cost
i. Building – lease
(rates and taxes and
margin)
ii. Variable cost –
electricity, gas and
diesel (for MHE)
iii. People – fixed cost
(hours)
iv. Part time labour –
variable cost
i. Building / lease –
fixed cost
ii. People – variable
cost
iii. MHE – variable cost
iv. Losses – variable
cost
What is the key
operational activity that
drives each of the cost
components?
i. Throughput
ii. Number of vehicles
received/
dispatched
iii. Full pallet vs. fine
picking
iv. Balancing of
workload (people)
People (fixed and flex
staff) – throughput
efficiency
Planning of warehouse
activities to drive
effectiveness and
efficiency (people and
MHE)
The respondents agreed that warehousing cost can be ring-fenced. Notably the cost
components can be split between:
• Variable costs: operational handling activities, executed by people and MHE, are
directly related to the volume throughput.
• Fixed costs: All building related expenses (lease, utility, maintenance etc) to store the
product, unrelated to throughput handling.
4.2.7 Secondary Distribution
Table 10 lists the key performance indicators (KPIs), cost components and the activities
that drive the cost components relating to the secondary distribution process.

- 38 -
Table 10: Market Interview: Secondary Distribution
Question Respondent 1 Respondent 2 Respondent 3
What KPIs do you
measure?
i. R/kg
ii. Delivery
turnaround time
iii. Vehicle utilisation
(weight)
iv. Deliveries per
vehicle per day
v. Number of multiple
trips per vehicle
per day
vi. Planned deliveries
vs. actual
deliveries
i. Order vs. pick vs.
invoice quantity
ii. Proof of Delivery
(POD)
iii. Kg per delivery –
minimum order
quantity (MOQ)
i. In-full
ii. Cost per ton
Is it easy to ring-fence
secondary distribution
cost?
Yes Yes Yes
What are the typical cost
components in secondary
distribution?
i. Fixed cost:
• Vehicle Drivers
and Assistants
• Vehicle Lease
ii. Variable cost:
• Fuel
• Tyres
• Lubrication
• Maintenance
i. Rate card (for
outsourced fleet),
ii. Split between
fixed and variable
cost for own fleet
i. Vehicle / rental
ii. People
iii. Fuel
What is the key
operational activity that
drives each of the cost
components?
i. Turnaround time
per delivery
ii. Number of
deliveries
iii. Delivery size
iv. Distance (km)
travelled
i. Load utilization
ii. Number of
deliveries
iii. Turn-around-times
is very important –
sweating the
assets.
i. Actual vs. planned
delivery routes
(deliveries & time)
ii. Kilometres
travelled
All the respondents agreed that secondary distribution cost can be isolated and are aligned on
the cost components. The activities that drive the cost can be summarised as maximising time
utilization, which is a function of number of deliveries and delivery size, whilst minimising
distance travelled.
The questionnaire primarily focussed on the outbound logistics processes as defined in the
research scope. However, a closing section was included in the questionnaire to ascertain
whether other logistics activities or supply chain costs should be included in future studies (with
the aim to expand the CTS framework). The respondents were also given the opportunity to
provide any further remarks or considerations concerning the research that may have been
omitted in the previous questions.

- 39 -
4.2.8 Closing
Table 11 summarises the responses to closing interview questions.
Table 11: Market Interview: Closing
Question Respondent 1 Respondent 2 Respondent 3
Are there any other
logistics activities and/or
costs that should be
included in future studies?
Yes Yes No
i. Source of products
(inbound logistics)
ii. Manufacturing
costs
i. Inbound logistics
ii. Manufacturing
This will provide a
holistic view of product
cost to inform pricing
decisions.
This study is a good
start.
Any other
remarks/considerations
(not covered in the
previous questions)
regarding the study?
No No No
Worth noting is that the respondents suggested that the scope of the research could be
extended in future studies to include other supply chain functions, for example inbound logistics
and manufacturing. No further remarks or considerations were received from the respondents.
4.3 CONCLUDING REMARKS
This chapter summarised the responses of interviews conducted with three FMCG company
representatives. Although the market interviews are likely not a representative sample of the
FMCG industry, it is assumed that the responses obtained are adequate to give sufficient
guidance to this study. The author strongly believes that the responses will be very similar
should more FMCG companies have been engaged, based on the author’s professional
experience and informal discussions with interested parties.
The following is evident from the interviews:
1. Current accounting procedures provide insufficient detail of the true CTS on customer
or product level. At best all customers and products are treated equally when allocating
costs on a high-level, which is not a true reflection of the actual logistics CTS.
2. Understanding the outbound logistics cost drivers and true CTS on a customer and
product level will provide significant insight, for example:
a. Customer and product margin contribution (profitability) can be calculated to
decide which customers and products to retain;
b. Could serve as an input to tactical planning processes, i.e. Sales & Operations
Planning;
- 40 -
c. Could inform product pricing;
d. Understanding the logistics cost associated to service levels;
e. Common understanding within the organisation will drive the correct behaviour
and business decisions.
3. The operating cost of the outbound logistics processes is easy to ring-fence. However,
the cost driver(s) of each of these processes is currently not well understood in order
to aptly allocate costs on a customer and product level.
4. Outsourcing of logistics services are still prevalent and worth noting that the cost drivers
will likely differ between in-house versus outsourced logistics activities, mainly due to
the charge model agreed with the LSP.
5. The interviews confirmed that it is possible to define a generic list of cost drivers for
each outbound logistics activity that could be representative of the FMCG industry.
6. Other supply chain functions, e.g. inbound logistics, manufacturing and trading
activities, can be included in future studies to provide a holistic view of the total supply
chain CTS. Although not mentioned during the interviews, the impact of the increasing
trend of e-commerce (e.g. home shopping and deliveries) will also be worth
considering. The outbound logistics CTS framework, considering the scope of this
study, could therefore be elaborated to include additional supply chain functions and
markets.
The following chapter synthesises the findings gathered from the interviews and the literature
study that evaluated and defined the activities and associated cost drivers for each respective
outbound logistics process. The activities and defined cost drivers will then serve as input to
ultimately design a CTS framework that can be applied by the FMCG industry.

- 41 -
5 COST DRIVER FRAMEWORK DEVELOPMENT
5.1 INTRODUCTION
The accurate calculation of the cost-to-serve (CTS) on both customer and product level has
become critically important to a business’ survival, and even small costing disparities (or cross-
subsidising) can have an overwhelming impact on whether a company survives over the long
term.
Activity based costing (ABC) is a costing methodology that identifies activities in a process and
assigns the cost of each activity resource to all products and services according to the actual
consumption by each. Its application can therefore be used to understand the outbound
logistics CTS on customers and product level. Although ABC is well known, the activities and
cost drivers for outbound logistics in the South African Fast-Moving Consumer Goods (FMCG)
industry are not well defined.
The aim is to therefore identify cost drivers that can be applied uniformly, mainly in the FMCG
industry, which includes the definitions of fixed and variable cost and cost drivers for each
outbound logistics process and associated activities. To move from conventional financial
reporting to a method of calculating the true CTS requires fair and detailed allocation of all
logistics operating costs. Based on the discussion thus far, the following is of importance:
1. Separation of fixed and variable costs per activity;
2. Allocation of fixed and variable costs to the correct cost drivers.
5.2 IDENTIFICATION OF THE COST DRIVERS
As discussed in Chapter 3 (section 3.4), the method to identify cost drivers is a step-by-step
approach. This section focusses on the key processes of outbound logistics (namely primary
distribution, warehousing and secondary distribution as part of the scope of this study), the
activity/activities associated to the process, and the underlying cost driver(s) for each
respective activity. The recommended cost drivers, activity data and cost components are an
amalgamation of the literature study and market interview responses. The activity data
measures the magnitude of a cost driver and the associated cost. For example; if the cost
driver is pallets, then number of pallets is required as activity data to determine the rate of the
cost driver within the activity. The cost to execute the activity is also part of activity data.
5.2.1 Primary Distribution
Table 12 provides a description of the cost driver, activity data, cost components and CTS
outputs for the primary distribution process.
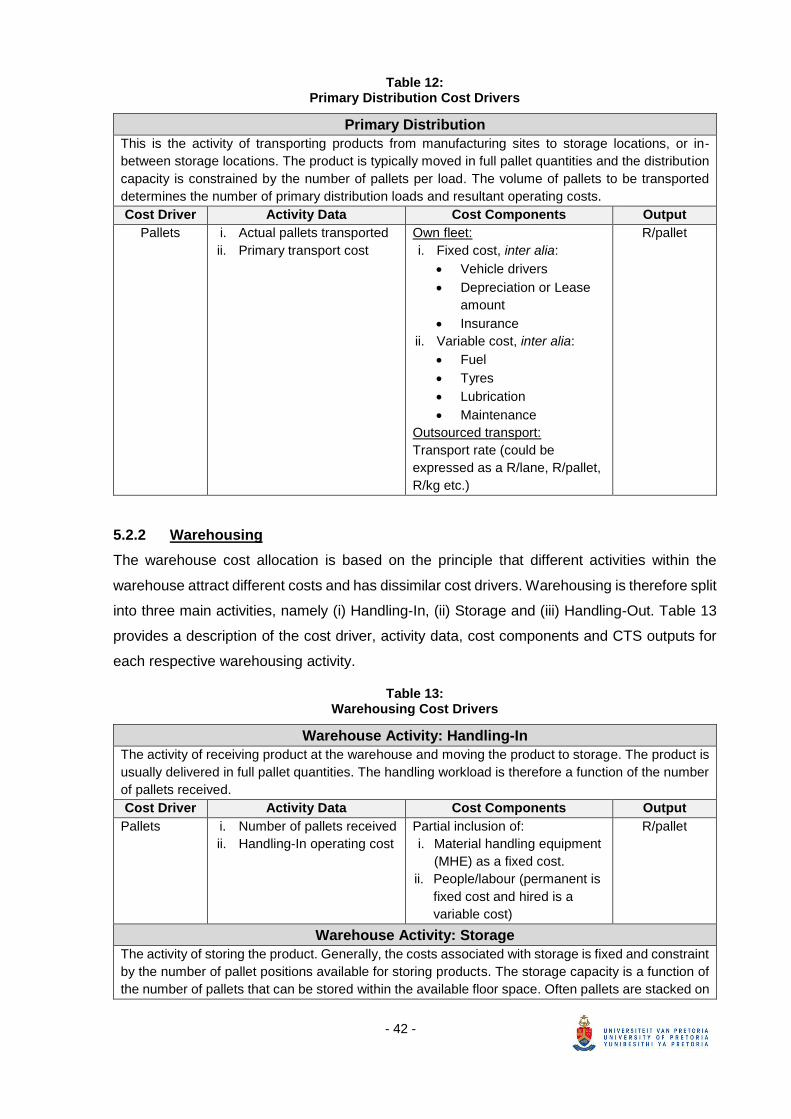
- 42 -
Table 12: Primary Distribution Cost Drivers
Primary Distribution
This is the activity of transporting products from manufacturing sites to storage locations, or in-
between storage locations. The product is typically moved in full pallet quantities and the distribution
capacity is constrained by the number of pallets per load. The volume of pallets to be transported
determines the number of primary distribution loads and resultant operating costs.
Cost Driver Activity Data Cost Components Output
Pallets i. Actual pallets transported
ii. Primary transport cost
Own fleet:
i. Fixed cost, inter alia:
• Vehicle drivers
• Depreciation or Lease
amount
• Insurance
ii. Variable cost, inter alia:
• Fuel
• Tyres
• Lubrication
• Maintenance
Outsourced transport:
Transport rate (could be
expressed as a R/lane, R/pallet,
R/kg etc.)
R/pallet
5.2.2 Warehousing
The warehouse cost allocation is based on the principle that different activities within the
warehouse attract different costs and has dissimilar cost drivers. Warehousing is therefore split
into three main activities, namely (i) Handling-In, (ii) Storage and (iii) Handling-Out. Table 13
provides a description of the cost driver, activity data, cost components and CTS outputs for
each respective warehousing activity.
Table 13: Warehousing Cost Drivers
Warehouse Activity: Handling-In
The activity of receiving product at the warehouse and moving the product to storage. The product is
usually delivered in full pallet quantities. The handling workload is therefore a function of the number
of pallets received.
Cost Driver Activity Data Cost Components Output
Pallets i. Number of pallets received
ii. Handling-In operating cost
Partial inclusion of:
i. Material handling equipment
(MHE) as a fixed cost.
ii. People/labour (permanent is
fixed cost and hired is a
variable cost)
R/pallet
Warehouse Activity: Storage
The activity of storing the product. Generally, the costs associated with storage is fixed and constraint
by the number of pallet positions available for storing products. The storage capacity is a function of
the number of pallets that can be stored within the available floor space. Often pallets are stacked on
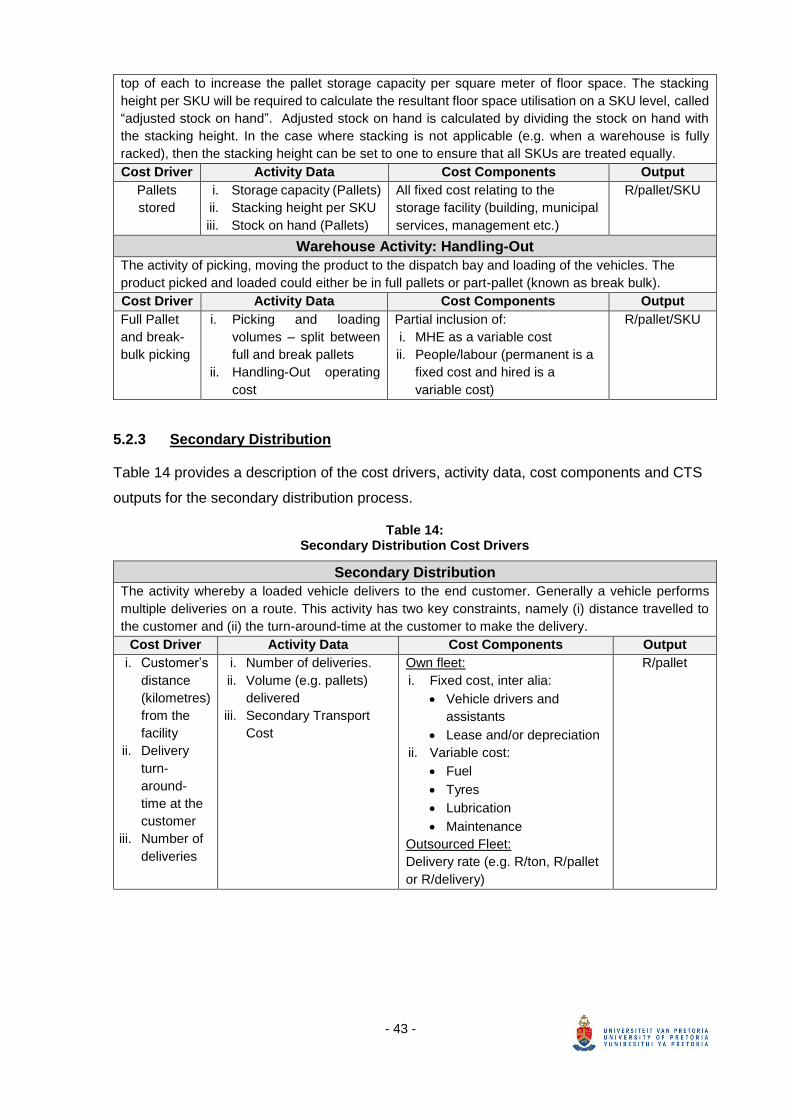
- 43 -
top of each to increase the pallet storage capacity per square meter of floor space. The stacking
height per SKU will be required to calculate the resultant floor space utilisation on a SKU level, called
“adjusted stock on hand”. Adjusted stock on hand is calculated by dividing the stock on hand with
the stacking height. In the case where stacking is not applicable (e.g. when a warehouse is fully
racked), then the stacking height can be set to one to ensure that all SKUs are treated equally.
Cost Driver Activity Data Cost Components Output
Pallets
stored
i. Storage capacity (Pallets)
ii. Stacking height per SKU
iii. Stock on hand (Pallets)
All fixed cost relating to the
storage facility (building, municipal
services, management etc.)
R/pallet/SKU
Warehouse Activity: Handling-Out
The activity of picking, moving the product to the dispatch bay and loading of the vehicles. The
product picked and loaded could either be in full pallets or part-pallet (known as break bulk).
Cost Driver Activity Data Cost Components Output
Full Pallet
and break-
bulk picking
i. Picking and loading
volumes – split between
full and break pallets
ii. Handling-Out operating
cost
Partial inclusion of:
i. MHE as a variable cost
ii. People/labour (permanent is a
fixed cost and hired is a
variable cost)
R/pallet/SKU
5.2.3 Secondary Distribution
Table 14 provides a description of the cost drivers, activity data, cost components and CTS
outputs for the secondary distribution process.
Table 14: Secondary Distribution Cost Drivers
Secondary Distribution
The activity whereby a loaded vehicle delivers to the end customer. Generally a vehicle performs
multiple deliveries on a route. This activity has two key constraints, namely (i) distance travelled to
the customer and (ii) the turn-around-time at the customer to make the delivery.
Cost Driver Activity Data Cost Components Output
i. Customer’s
distance
(kilometres)
from the
facility
ii. Delivery
turn-
around-
time at the
customer
iii. Number of
deliveries
i. Number of deliveries.
ii. Volume (e.g. pallets)
delivered
iii. Secondary Transport
Cost
Own fleet:
i. Fixed cost, inter alia:
• Vehicle drivers and
assistants
• Lease and/or depreciation
ii. Variable cost:
• Fuel
• Tyres
• Lubrication
• Maintenance
Outsourced Fleet:
Delivery rate (e.g. R/ton, R/pallet
or R/delivery)
R/pallet

- 44 -
5.3 CTS FRAMEWORK: COST DRIVERS AND ALLOCATION
This section describes a cost allocation framework for each outbound logistics processes,
based on the identified cost drivers for each activity discussed in the previous section. The
framework details the variables and calculation formulas for each respective activity. The
distinctive variables for each activity consist out of three main components:
1. Activity information: data about the activity occurrence (e.g. number of trips)
2. Quantity: the quantity (e.g. pallets) managed during the activity
3. Cost: the cost to perform the activity (e.g. Rand per trip)
5.3.1 Primary Distribution
Table 15 suggests a cost allocation framework for the primary distribution process.
Table 15: Primary Distribution Cost Allocation Framework
Primary Distribution Owner-
ship
Cost
Driver
Activity Variables Calculation Output
Ou
tso
urc
ed
Fle
et
Pallets / kg
/ volume
transported
(depending
on charge
model)
Example:
• PP = total pallets transported
per lane
• T = number of Trips per lane
• Rp = lane rate (Rands)
• CPP = cost per pallet
𝐶𝑃𝑃 =(𝑇 × 𝑅𝑝)
𝑃𝑃
R/Pallet
Inso
urc
ed
/ O
wn
Fle
et
Number of
trips
• TATp = turnaround time at
delivery location
• TA = total TAT time for all trips
• dp = distance (km) between
dispatch and receiving nodes
• dTp = total distance for all trips
• Sp = average travel speed
between nodes (km/h)
• T = number of trips between
nodes
• PP = total pallets transported
per lane
• Fp = fixed cost
• Vp = variable Cost
• Xp = time ratio per node
• FL = fixed cost per lane
• VL = variable cost per lane
• FLP = fixed cost per pallet per
lane
• VLP = variable cost per pallet
per lane
• TLP = total cost per pallet per
lane
Fixed cost per lane:
𝑋𝑝
=
(
(𝑇𝐴𝑇𝑝 + (
𝑑𝑆𝑝)) × 𝑇
(𝑇𝐴)
)
Then;
𝐹𝐿 = 𝑋 × 𝐹𝑝
Then;
𝐹𝐿𝑃 =𝐹𝐿
𝑃𝑃
Variable cost per lane:
𝑉𝐿 = (𝑑𝑝 × 𝑇
𝑑𝑇𝑝) × 𝑉𝑝
Then;
𝑉𝐿𝑃 =𝑉𝐿
𝑃𝑃
Total cost per lane:
𝑇𝐿𝑃 = 𝐹𝐿𝑃 + 𝑉𝐿𝑃
%
Rand
R/Pallet
Rand
R/Pallet
R/Pallet

- 45 -
5.3.2 Warehousing
Table 16 gives a breakdown of each of the activities costed and provides the calculation that
will be applied to allocate warehousing cost per depot per SKU for each activity.
Table 16: Warehousing Cost Allocation Framework
5.3.3 Secondary Distribution
Secondary distribution cost is allocated per SKU per customer on a fixed and variable basis to
account for vehicle operating (including labour) costs. The cost drivers for:
• Fixed costs are allocated per customer by apportioning the cost based on Turnaround
Time (TAT) and time travelled (distance from depot divided by travelling speed).
• Variable costs are allocated per customer based on the distance from the depot.
Activity Cost
Driver
Activity Variables Calculation Output
Handling-
In
Pallets • PI = pallets received
• HIVC = Handling-in variable
cost
• HIFC = Handling-in fixed cost
• HIVCP = Handling-in variable
cost per pallet
• HIFCP = Handling-in fixed
cost per pallet
• HITCP = handling-in total cost
per pallet
𝐻𝐼𝑉𝐶𝑃 =𝐻𝐼𝑉𝐶
𝑃𝐼
𝐻𝐼𝐹𝐶𝑃 =𝐻𝐼𝐹𝐶
𝑃𝐼
Then;
𝐻𝐼𝑇𝐶𝑃
= 𝐻𝐼𝑉𝐶𝑃 + 𝐻𝐼𝐹𝐶𝑃
R/Pallet/SKU
R/Pallet/SKU
R/Pallet/SKU
Storage Pallets • SOH = average pallets stock
on hand per SKU in location
• H = stacking height per SKU
• SC = storage cost
• ASOH = Adjusted stock on
hand (n = number of SKUs)
• TSOH = total adjusted SOH
for all SKUs
• n = number of SKUs
• SCP = storage cost per pallet
per SKU
𝐴𝑆𝑂𝐻 = 𝑆𝑂𝐻
𝐻
Then;
𝑇𝑆𝑂𝐻 =∑𝐴𝑆𝑂𝐻
𝑛
1
Then;
𝑆𝐶𝑃 =
𝐴𝑆𝑂𝐻𝑇𝑆𝑂𝐻
∗ 𝑆𝐶
𝑆𝑂𝐻
Pallets/SKU
Pallets
R/Pallet/SKU
Handling-
Out
Pallets (or
equivalent
unit)
picked for
dispatch
• PO = pallets picked/loaded
• HOVC = Handling-out variable
cost
• HOFC = Handling-out fixed
cost
• HOVCP = Handling-out
variable cost per pallet
• HOFCP = Handling-out fixed
cost per pallet
• HOTCP = handling-in total
cost per pallet
𝐻𝑂𝑉𝐶𝑃 =𝐻𝑂𝑉𝐶
𝑃𝑂
𝐻𝑂𝐹𝐶𝑃 =𝐻𝑂𝐹𝐶
𝑃𝑂
Then;
𝐻𝑂𝑇𝐶𝑃
= 𝐻𝑂𝑉𝐶𝑃 + 𝐻𝑂𝐹𝐶𝑃
R/Pallet/SKU
R/Pallet/SKU
R/Pallet/SKU
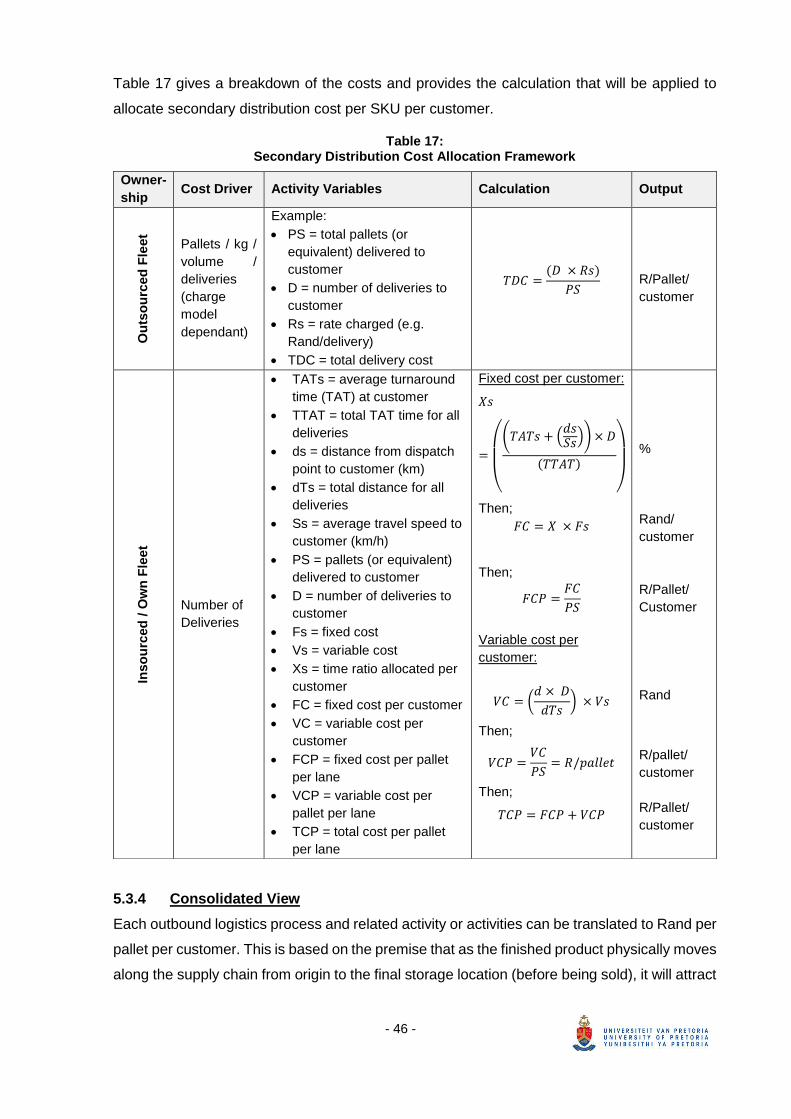
- 46 -
Table 17 gives a breakdown of the costs and provides the calculation that will be applied to
allocate secondary distribution cost per SKU per customer.
Table 17: Secondary Distribution Cost Allocation Framework
5.3.4 Consolidated View
Each outbound logistics process and related activity or activities can be translated to Rand per
pallet per customer. This is based on the premise that as the finished product physically moves
along the supply chain from origin to the final storage location (before being sold), it will attract
Owner-
ship Cost Driver Activity Variables Calculation Output
Ou
tso
urc
ed
Fle
et
Pallets / kg /
volume /
deliveries
(charge
model
dependant)
Example:
• PS = total pallets (or
equivalent) delivered to
customer
• D = number of deliveries to
customer
• Rs = rate charged (e.g.
Rand/delivery)
• TDC = total delivery cost
𝑇𝐷𝐶 =(𝐷 × 𝑅𝑠)
𝑃𝑆
R/Pallet/
customer
Inso
urc
ed
/ O
wn
Fle
et
Number of
Deliveries
• TATs = average turnaround
time (TAT) at customer
• TTAT = total TAT time for all
deliveries
• ds = distance from dispatch
point to customer (km)
• dTs = total distance for all
deliveries
• Ss = average travel speed to
customer (km/h)
• PS = pallets (or equivalent)
delivered to customer
• D = number of deliveries to
customer
• Fs = fixed cost
• Vs = variable cost
• Xs = time ratio allocated per
customer
• FC = fixed cost per customer
• VC = variable cost per
customer
• FCP = fixed cost per pallet
per lane
• VCP = variable cost per
pallet per lane
• TCP = total cost per pallet
per lane
Fixed cost per customer:
𝑋𝑠
=
(
(𝑇𝐴𝑇𝑠 + (
𝑑𝑠𝑆𝑠)) × 𝐷
(𝑇𝑇𝐴𝑇)
)
Then;
𝐹𝐶 = 𝑋 × 𝐹𝑠
Then;
𝐹𝐶𝑃 =𝐹𝐶
𝑃𝑆
Variable cost per
customer:
𝑉𝐶 = (𝑑 × 𝐷
𝑑𝑇𝑠) × 𝑉𝑠
Then;
𝑉𝐶𝑃 =𝑉𝐶
𝑃𝑆= 𝑅/𝑝𝑎𝑙𝑙𝑒𝑡
Then;
𝑇𝐶𝑃 = 𝐹𝐶𝑃 + 𝑉𝐶𝑃
%
Rand/
customer
R/Pallet/
Customer
Rand
R/pallet/
customer
R/Pallet/
customer
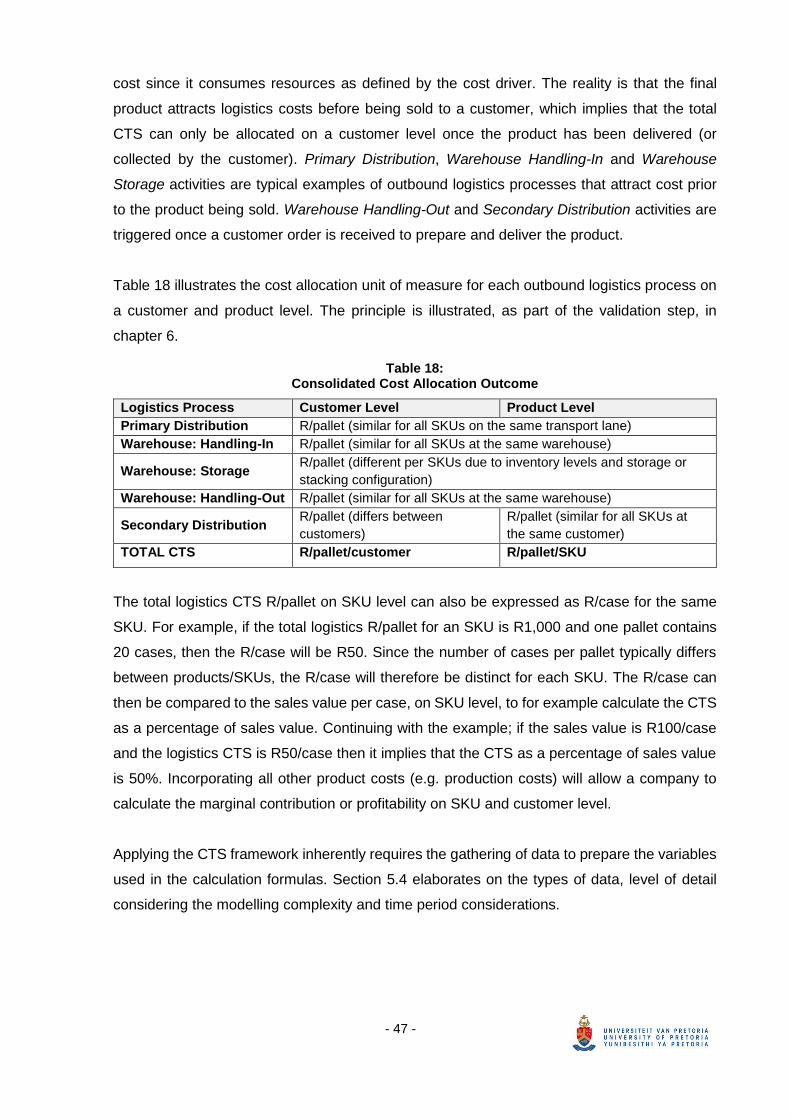
- 47 -
cost since it consumes resources as defined by the cost driver. The reality is that the final
product attracts logistics costs before being sold to a customer, which implies that the total
CTS can only be allocated on a customer level once the product has been delivered (or
collected by the customer). Primary Distribution, Warehouse Handling-In and Warehouse
Storage activities are typical examples of outbound logistics processes that attract cost prior
to the product being sold. Warehouse Handling-Out and Secondary Distribution activities are
triggered once a customer order is received to prepare and deliver the product.
Table 18 illustrates the cost allocation unit of measure for each outbound logistics process on
a customer and product level. The principle is illustrated, as part of the validation step, in
chapter 6.
Table 18: Consolidated Cost Allocation Outcome
Logistics Process Customer Level Product Level
Primary Distribution R/pallet (similar for all SKUs on the same transport lane)
Warehouse: Handling-In R/pallet (similar for all SKUs at the same warehouse)
Warehouse: Storage R/pallet (different per SKUs due to inventory levels and storage or
stacking configuration)
Warehouse: Handling-Out R/pallet (similar for all SKUs at the same warehouse)
Secondary Distribution R/pallet (differs between
customers)
R/pallet (similar for all SKUs at
the same customer)
TOTAL CTS R/pallet/customer R/pallet/SKU
The total logistics CTS R/pallet on SKU level can also be expressed as R/case for the same
SKU. For example, if the total logistics R/pallet for an SKU is R1,000 and one pallet contains
20 cases, then the R/case will be R50. Since the number of cases per pallet typically differs
between products/SKUs, the R/case will therefore be distinct for each SKU. The R/case can
then be compared to the sales value per case, on SKU level, to for example calculate the CTS
as a percentage of sales value. Continuing with the example; if the sales value is R100/case
and the logistics CTS is R50/case then it implies that the CTS as a percentage of sales value
is 50%. Incorporating all other product costs (e.g. production costs) will allow a company to
calculate the marginal contribution or profitability on SKU and customer level.
Applying the CTS framework inherently requires the gathering of data to prepare the variables
used in the calculation formulas. Section 5.4 elaborates on the types of data, level of detail
considering the modelling complexity and time period considerations.

- 48 -
5.4 DATA COLLECTION
The cost drivers, inputs and cost components described in the previous section intrinsically
require a business to collect data on some level of detail. An individual undertaking CTS
modelling should have strong analytical skills with a comprehensive understanding of financial
statements and supply chain processes (specifically outbound logistics) to gather the correct
data or make assumptions if required.
Based on the suggested CTS framework, Figure 7 provides a high-level overview of the data
requirements that aligns with the cost drivers discussed in the previous section. The data is
typically divided into two categories, namely:
• Master Data; containing information inter alia about customers, products and
warehouses.
• Transactional Data; containing the information of the physical product flow in the
network (whether internally or deliveries to customers) as well as the associated
operating cost.
Figure 7: Data Collection
The size and complexity of the CTS modelling can vary from relatively simple for a model built
on customer account and product group level, to quite complex for a model built on a SKU and
customer level. The complexity of the outbound logistics network (influenced by the number of
supply nodes and warehouses, double handling, number of customers etc.) will also have an
influence on the size and complexity of the CTS analysis.

- 49 -
The suggested CTS framework can be applied at varying levels of sophistication; from simple
spreadsheets (e.g. MS Excel®) to advanced relational databases storing the data and
performing the calculations. The decision of analytical tool(s) should be based on the particular
circumstances of the company in terms of both the complexity of the business, level of detail
required in terms of the analysis, availability of data and the type of decision support required
from the outcomes.
Lastly, the time period for which the data will be gathered should be decided. It’s recommended
that a company analyses a full year of data to ensure that the outcomes are representative in
terms of outbound logistics activities affected by product seasonality (which is a familiar
characteristic of the FMCG industry). A longer time period will also allow for comparative
analysis to identify trends, as an example. It’s also important that a reconciliation step is
introduced to ensure that the CTS results (in terms of cost and volume per outbound logistics
process) balance back to actuals.
5.5 CONCLUDING REMARKS
The chapter assimilates the insights gained from the literature study and market interviews to
define a generic outbound logistics cost driver framework. The framework speaks to outbound
logistics processes, the respective activities, associated cost drivers and illustrates cost
allocation calculations.
Based on the discussion thus far, the following is of importance:
1. Separation of fixed and variable costs
2. Allocation of variable costs to the correct cost drivers, understood by both parties.
For the CTS framework to be relevant for the FMCG industry, it’s vital that companies apply
the principles uniformly, which includes the definitions of fixed and variable costs as well as
the identification of cost drivers. The following outbound logistics cost drivers are
recommended as defined in the CTS framework (based on section 3.4, 4.2 and 5.2):
1. Primary distribution. This is the activity of transporting products from manufacturing
sites to storage locations, or in-between storage locations. The product is typically
moved in full pallet quantities and the distribution capacity is usually constrained by the
number of pallets per load. The quantity of pallets to be transported determines the
number of primary distribution loads and resultant operating costs. Therefore, the cost
driver is pallets.

- 50 -
2. Warehousing. This includes the following number of activities:
a. Handling In. The activity of receiving product at the warehouse and moving the
product to storage. The product is usually delivered in full pallet quantities. The
handling workload is therefore a function of the number of pallets received.
Therefore, the cost driver is pallets received.
b. Storage. The activity of storing the product. Generally, the costs associated with
storage is quite fixed and constrained by the number of pallet positions (or bin
locations) available for storing the product. Therefore, the cost driver is pallets
stored.
c. Handling Out. The activity of picking, moving the product to the dispatch bay
and loading of the vehicles. The product picked and loaded could either be in
full pallets or part-pallet (known as break bulk). Therefore, the cost driver is
pallets picked.
3. Secondary Distribution. The activity whereby a loaded vehicle delivers to the end
customer. This activity has two key constraints, namely (i) distance travelled to the
customer and (ii) the turn-around-time at the customer to make the delivery. This
activity therefore has multiple constraints, which include the location of the customer
(to account for distance), waiting time at customers (known as turnaround time),
quantity delivered (impacting the turnaround time) as well as delivery frequency (how
often a customer receives a delivery). To simplify this and yet keep the cost drivers
applicable, the suggested cost drivers is delivery frequency, coupled with distance and
turnaround time (TAT).
The CTS framework will provide a valuable understanding of the outbound logistics cost as
well as emphasise the cost drivers to effect efficiency throughout the supply chain. The CTS
framework is a tool that can support strategic logistics decisions such as pricing, customer
profitability, product profitability, outsourcing, and the identification and measurement of
process improvement initiatives. Applying the CTS framework will yield the following additional
benefits:
1. All transactions are understood from a customer point of view rather than merely an
internal/ functional point of view. This will assist in better understanding the associated
cost of specific customer service as well as the customer profitability and what can be
changed to improve this.
2. Drivers of outbound logistics activities are understood, not only the resultant effect in
the management accounts. This will assist in careful consideration of which costs or
actions are necessary and which are not and assist in aligning profitability with action.
- 51 -
3. Assist in aligning the organisation, whereby a route to market platform is created to
focus adequate service to the right customers through the correct product range. These
historic functions of marketing, sales and logistics will better understand their different
costs/contribution/impact on overall CTS and customer profitability.
4. Creating a systemic approach for increasing profitability, rather than just adopting the
latest management fad. Hence companies should understand the drivers of specific
behaviour and focus on managing these drivers rather than just reducing cost as a
result of some local or international benchmark.
Intrinsically the CTS framework alludes to extensive data gathering and analysis for each
activity and associated cost driver(s). The CTS framework relies on the availability of accurate
and comprehensive cost and activity data for each outbound logistics process. The quality of
the data inputs will impact the success of the CTS output. Understandably not all data might
be readily available, in which case a company should spend time to gather the data or make
informed assumptions.
Lastly, it must also be emphasised that the CTS framework is not intended to replace the
general ledger accounts, but should rather be used as a diagnostic tool to understand
outbound logistics costs at a much lo-wer level (as well as the associated cost drivers). The
CTS modelling should therefore be owned by the supply chain department (or similar) within
the company, as opposed to the finance department. The finance department can however be
helpful to provide cost information, splitting variable and fixed costs and assist with
reconciliation.
Chapter 6 illustrates the application of the CTS framework, through a case study, and the
expected benefits. Due to the sensitivity of the information presented, the name of the
company will remain confidential.
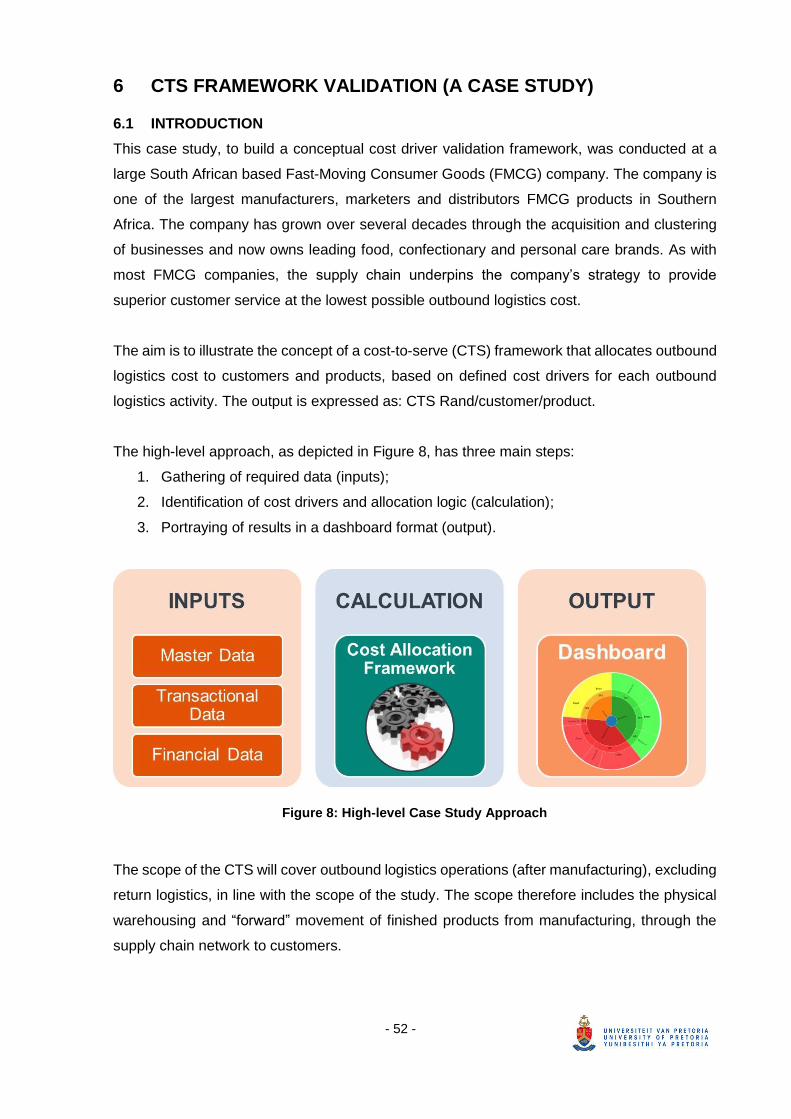
- 52 -
6 CTS FRAMEWORK VALIDATION (A CASE STUDY)
6.1 INTRODUCTION
This case study, to build a conceptual cost driver validation framework, was conducted at a
large South African based Fast-Moving Consumer Goods (FMCG) company. The company is
one of the largest manufacturers, marketers and distributors FMCG products in Southern
Africa. The company has grown over several decades through the acquisition and clustering
of businesses and now owns leading food, confectionary and personal care brands. As with
most FMCG companies, the supply chain underpins the company’s strategy to provide
superior customer service at the lowest possible outbound logistics cost.
The aim is to illustrate the concept of a cost-to-serve (CTS) framework that allocates outbound
logistics cost to customers and products, based on defined cost drivers for each outbound
logistics activity. The output is expressed as: CTS Rand/customer/product.
The high-level approach, as depicted in Figure 8, has three main steps:
1. Gathering of required data (inputs);
2. Identification of cost drivers and allocation logic (calculation);
3. Portraying of results in a dashboard format (output).
Figure 8: High-level Case Study Approach
The scope of the CTS will cover outbound logistics operations (after manufacturing), excluding
return logistics, in line with the scope of the study. The scope therefore includes the physical
warehousing and “forward” movement of finished products from manufacturing, through the
supply chain network to customers.

- 53 -
6.2 COMPANY’S SUPPLY CHAIN OVERVIEW
The company’s outbound logistics network includes numerous manufacturing and
warehousing facilities across South Africa, with significant logistics capabilities to store and
transport product. The product range exceeds 450 SKUs, delivered to more than 3,500
customers nationally.
Figure 9 aids in the visual presentation of all outbound logistics activities considered in the
CTS modelling. Each activity is explained in subsequent Table 19.
Figure 9: Case Study’s Supply Chain Definition
Table 19: Case Study: Outbound Logistics Activities
Icon / Line Description Definition
Manufacturing
Inbound movement of raw materials into manufacturing sites, as
well as the manufacturing operation and associated cost are
excluded from the scope.
Central
Distribution
Centre (CDC)
Warehousing facility of finished goods at manufacturing site that
could also store the full basket of product.
CDC distribution model:
• Secondary distribution to regional customers
• Full truck load (FTL) delivery to one customer (also
considered primary distribution).
• Replenish smaller depots / distribution centres (DCs)
Distribution
Centre
Regional DCs that store the full basket of products.
DC distribution model:
• Secondary distribution to regional customers
• Full truck load (FTL) delivery to one customer (also
considered primary distribution)
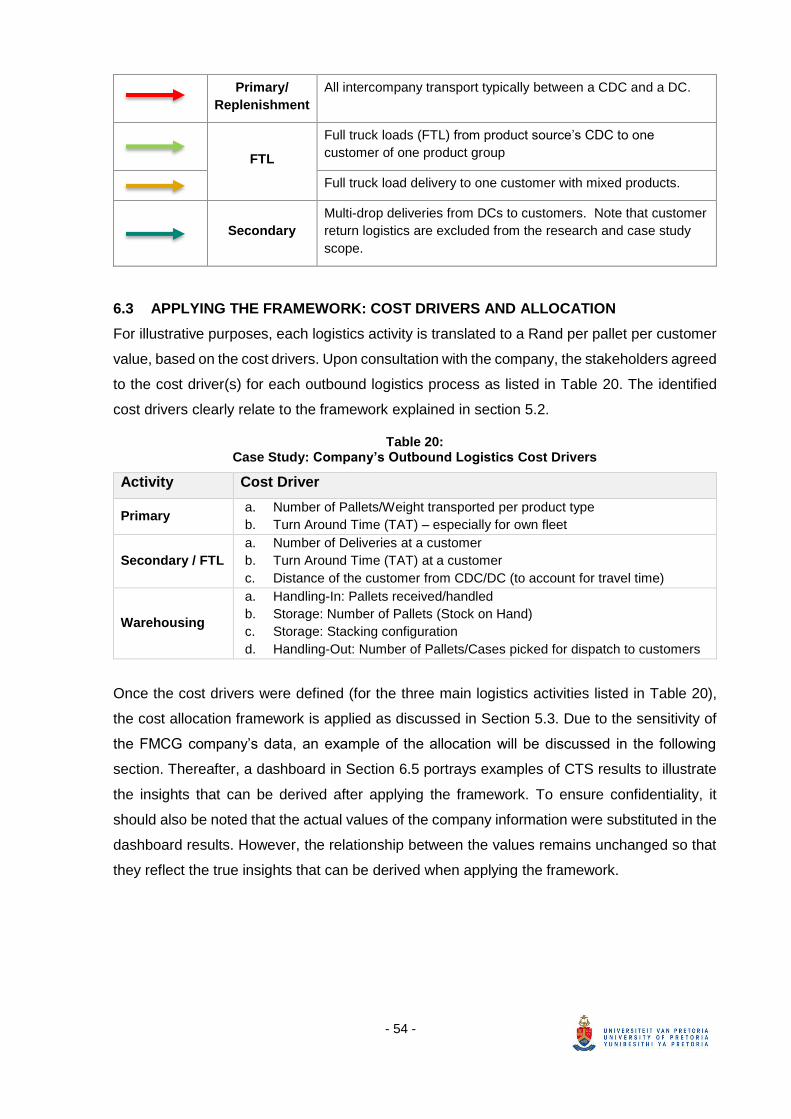
- 54 -
Primary/
Replenishment
All intercompany transport typically between a CDC and a DC.
FTL
Full truck loads (FTL) from product source’s CDC to one
customer of one product group
Full truck load delivery to one customer with mixed products.
Secondary
Multi-drop deliveries from DCs to customers. Note that customer
return logistics are excluded from the research and case study
scope.
6.3 APPLYING THE FRAMEWORK: COST DRIVERS AND ALLOCATION
For illustrative purposes, each logistics activity is translated to a Rand per pallet per customer
value, based on the cost drivers. Upon consultation with the company, the stakeholders agreed
to the cost driver(s) for each outbound logistics process as listed in Table 20. The identified
cost drivers clearly relate to the framework explained in section 5.2.
Table 20: Case Study: Company’s Outbound Logistics Cost Drivers
Activity Cost Driver
Primary a. Number of Pallets/Weight transported per product type
b. Turn Around Time (TAT) – especially for own fleet
Secondary / FTL
a. Number of Deliveries at a customer
b. Turn Around Time (TAT) at a customer
c. Distance of the customer from CDC/DC (to account for travel time)
Warehousing
a. Handling-In: Pallets received/handled
b. Storage: Number of Pallets (Stock on Hand)
c. Storage: Stacking configuration
d. Handling-Out: Number of Pallets/Cases picked for dispatch to customers
Once the cost drivers were defined (for the three main logistics activities listed in Table 20),
the cost allocation framework is applied as discussed in Section 5.3. Due to the sensitivity of
the FMCG company’s data, an example of the allocation will be discussed in the following
section. Thereafter, a dashboard in Section 6.5 portrays examples of CTS results to illustrate
the insights that can be derived after applying the framework. To ensure confidentiality, it
should also be noted that the actual values of the company information were substituted in the
dashboard results. However, the relationship between the values remains unchanged so that
they reflect the true insights that can be derived when applying the framework.
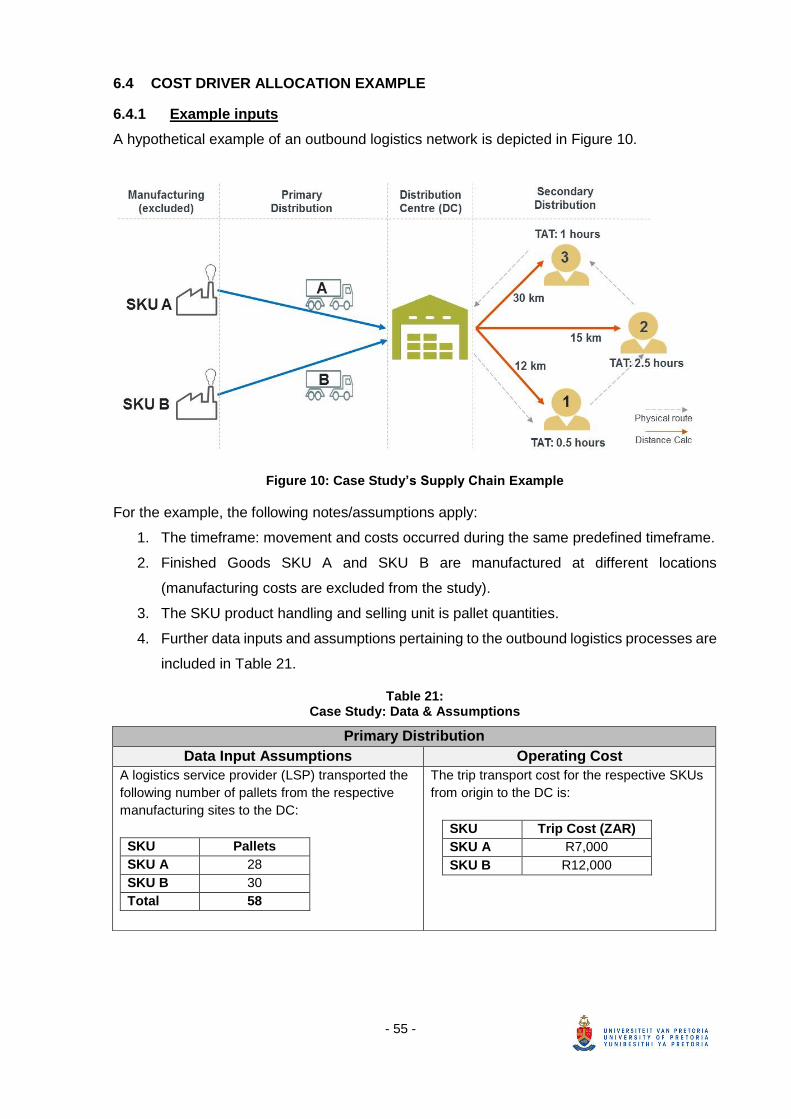
- 55 -
6.4 COST DRIVER ALLOCATION EXAMPLE
6.4.1 Example inputs
A hypothetical example of an outbound logistics network is depicted in Figure 10.
Figure 10: Case Study’s Supply Chain Example
For the example, the following notes/assumptions apply:
1. The timeframe: movement and costs occurred during the same predefined timeframe.
2. Finished Goods SKU A and SKU B are manufactured at different locations
(manufacturing costs are excluded from the study).
3. The SKU product handling and selling unit is pallet quantities.
4. Further data inputs and assumptions pertaining to the outbound logistics processes are
included in Table 21.
Table 21: Case Study: Data & Assumptions
Primary Distribution
Data Input Assumptions Operating Cost
A logistics service provider (LSP) transported the
following number of pallets from the respective
manufacturing sites to the DC:
SKU Pallets
SKU A 28
SKU B 30
Total 58
The trip transport cost for the respective SKUs
from origin to the DC is:
SKU Trip Cost (ZAR)
SKU A R7,000
SKU B R12,000
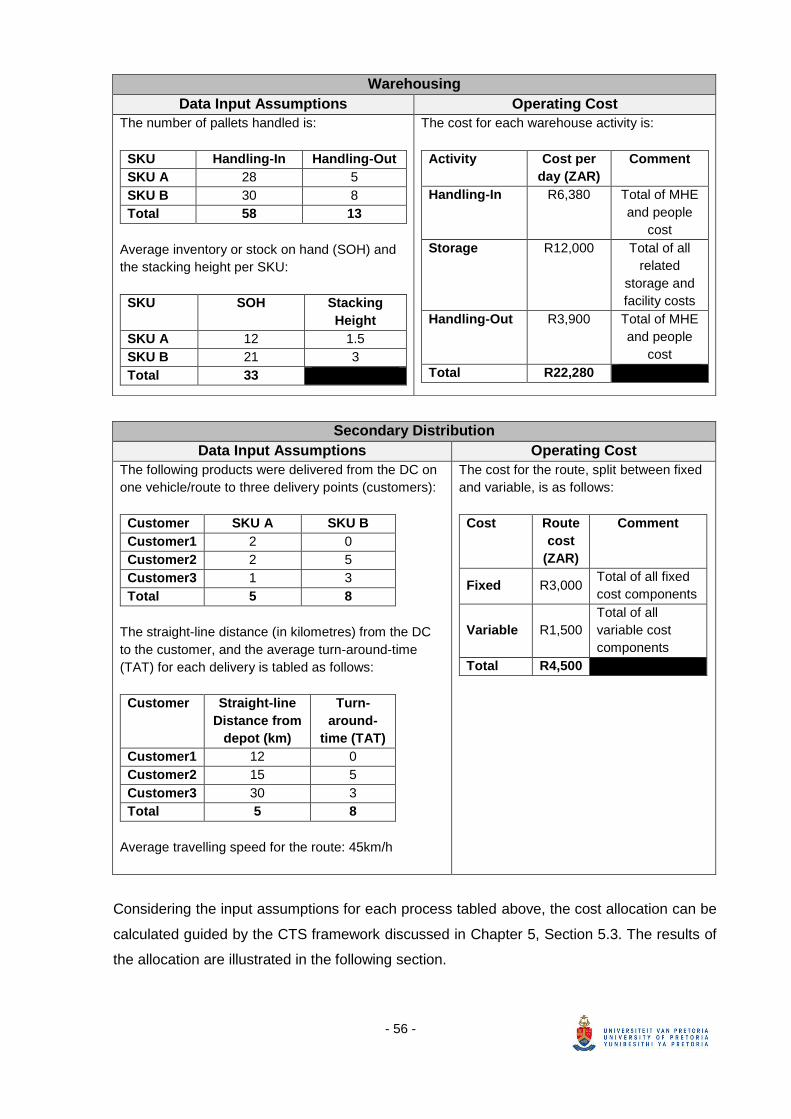
- 56 -
Considering the input assumptions for each process tabled above, the cost allocation can be
calculated guided by the CTS framework discussed in Chapter 5, Section 5.3. The results of
the allocation are illustrated in the following section.
Warehousing
Data Input Assumptions Operating Cost
The number of pallets handled is:
SKU Handling-In Handling-Out
SKU A 28 5
SKU B 30 8
Total 58 13
Average inventory or stock on hand (SOH) and
the stacking height per SKU:
SKU SOH Stacking
Height
SKU A 12 1.5
SKU B 21 3
Total 33
The cost for each warehouse activity is:
Activity Cost per
day (ZAR)
Comment
Handling-In R6,380 Total of MHE
and people
cost
Storage R12,000 Total of all
related
storage and
facility costs
Handling-Out R3,900 Total of MHE
and people
cost
Total R22,280
Secondary Distribution
Data Input Assumptions Operating Cost
The following products were delivered from the DC on
one vehicle/route to three delivery points (customers):
Customer SKU A SKU B
Customer1 2 0
Customer2 2 5
Customer3 1 3
Total 5 8
The straight-line distance (in kilometres) from the DC
to the customer, and the average turn-around-time
(TAT) for each delivery is tabled as follows:
Customer Straight-line
Distance from
depot (km)
Turn-
around-
time (TAT)
Customer1 12 0
Customer2 15 5
Customer3 30 3
Total 5 8
Average travelling speed for the route: 45km/h
The cost for the route, split between fixed
and variable, is as follows:
Cost Route
cost
(ZAR)
Comment
Fixed R3,000 Total of all fixed
cost components
Variable R1,500
Total of all
variable cost
components
Total R4,500
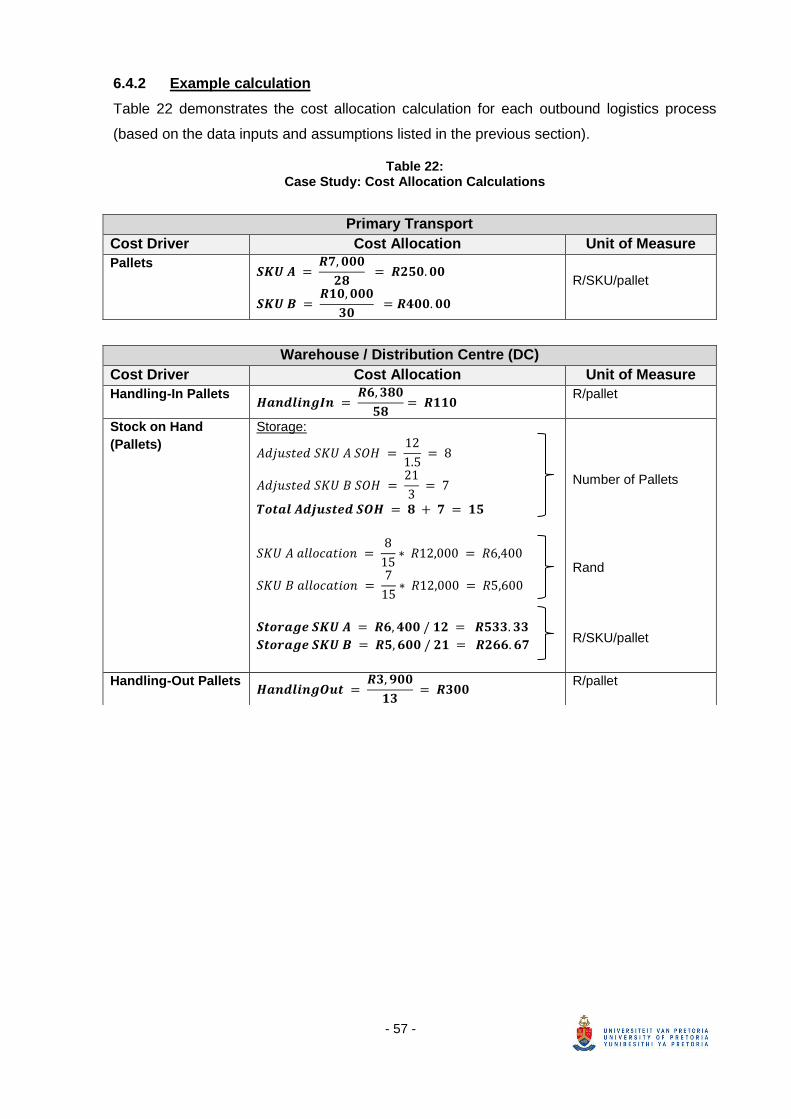
- 57 -
6.4.2 Example calculation
Table 22 demonstrates the cost allocation calculation for each outbound logistics process
(based on the data inputs and assumptions listed in the previous section).
Table 22: Case Study: Cost Allocation Calculations
Primary Transport
Cost Driver Cost Allocation Unit of Measure
Pallets 𝑺𝑲𝑼 𝑨 =
𝑹𝟕, 𝟎𝟎𝟎
𝟐𝟖 = 𝑹𝟐𝟓𝟎. 𝟎𝟎
𝑺𝑲𝑼 𝑩 = 𝑹𝟏𝟎, 𝟎𝟎𝟎
𝟑𝟎 = 𝑹𝟒𝟎𝟎. 𝟎𝟎
R/SKU/pallet
Warehouse / Distribution Centre (DC)
Cost Driver Cost Allocation Unit of Measure
Handling-In Pallets 𝑯𝒂𝒏𝒅𝒍𝒊𝒏𝒈𝑰𝒏 =
𝑹𝟔, 𝟑𝟖𝟎
𝟓𝟖= 𝑹𝟏𝟏𝟎
R/pallet
Stock on Hand
(Pallets)
Storage:
𝐴𝑑𝑗𝑢𝑠𝑡𝑒𝑑 𝑆𝐾𝑈 𝐴 𝑆𝑂𝐻 = 12
1.5 = 8
𝐴𝑑𝑗𝑢𝑠𝑡𝑒𝑑 𝑆𝐾𝑈 𝐵 𝑆𝑂𝐻 = 21
3 = 7
𝑻𝒐𝒕𝒂𝒍 𝑨𝒅𝒋𝒖𝒔𝒕𝒆𝒅 𝑺𝑶𝑯 = 𝟖 + 𝟕 = 𝟏𝟓
𝑆𝐾𝑈 𝐴 𝑎𝑙𝑙𝑜𝑐𝑎𝑡𝑖𝑜𝑛 = 8
15∗ 𝑅12,000 = 𝑅6,400
𝑆𝐾𝑈 𝐵 𝑎𝑙𝑙𝑜𝑐𝑎𝑡𝑖𝑜𝑛 = 7
15∗ 𝑅12,000 = 𝑅5,600
𝑺𝒕𝒐𝒓𝒂𝒈𝒆 𝑺𝑲𝑼 𝑨 = 𝑹𝟔, 𝟒𝟎𝟎 / 𝟏𝟐 = 𝑹𝟓𝟑𝟑. 𝟑𝟑
𝑺𝒕𝒐𝒓𝒂𝒈𝒆 𝑺𝑲𝑼 𝑩 = 𝑹𝟓, 𝟔𝟎𝟎 / 𝟐𝟏 = 𝑹𝟐𝟔𝟔. 𝟔𝟕
Number of Pallets
Rand
R/SKU/pallet
Handling-Out Pallets 𝑯𝒂𝒏𝒅𝒍𝒊𝒏𝒈𝑶𝒖𝒕 =
𝑹𝟑, 𝟗𝟎𝟎
𝟏𝟑 = 𝑹𝟑𝟎𝟎
R/pallet

- 58 -
The outcome of the calculations above yields the following insights for each outbound logistics
process:
1. Primary Distribution: the R/pallet value varies on SKU level for the following reasons;
a. The path and distance an SKU physically moves through the supply chain, from
origin to final storage destination, could differ. Therefore, the allocated primary
transport cost might be different, e.g. if an SKU pallet travels further it will likely
cost more.
b. The vehicle capacity and utilization thereof have an impact on the R/pallet (e.g.
28 versus 30 for each respective trip in the example above). The higher the
utilization, the lower the R/pallet. The vehicle capacity (in pallets) will also be a
function of the SKU characteristics and usually either constrained by weight or
volume.
Secondary Distribution
Cost Driver Cost Allocation Unit of Measure
Fixed Cost:
Theoretical travel time to customers:
𝐶𝑢𝑠𝑡𝑜𝑚𝑒𝑟 1 𝑇𝑟𝑎𝑣𝑒𝑙 𝑇𝑖𝑚𝑒 = 12 / 45 = 0.27
𝐶𝑢𝑠𝑡𝑜𝑚𝑒𝑟 2 𝑇𝑟𝑎𝑣𝑒𝑙 𝑇𝑖𝑚𝑒 = 15 / 45 = 0.33
𝐶𝑢𝑠𝑡𝑜𝑚𝑒𝑟 3 𝑇𝑟𝑎𝑣𝑒𝑙 𝑇𝑖𝑚𝑒 = 30 / 45 = 0.67
Travel time and TAT:
𝐶𝑢𝑠𝑡𝑜𝑚𝑒𝑟 1 = 0.27 + 0.5 = 0.77
𝐶𝑢𝑠𝑡𝑜𝑚𝑒𝑟 2 = 0.33 + 2.5 = 2.83
𝐶𝑢𝑠𝑡𝑜𝑚𝑒𝑟 3 = 0.67 + 1 = 1.67
𝑇𝑜𝑡𝑎𝑙 𝐻𝑜𝑢𝑟𝑠 = 0.77 + 2.83 + 1.67 = 5.27
𝐶𝑢𝑠𝑡𝑜𝑚𝑒𝑟 1 =(0.775.27
) ∗ 𝑅3,000
2= 𝑅218.35
𝐶𝑢𝑠𝑡𝑜𝑚𝑒𝑟 2 =(2.835.27
) ∗ 𝑅3,000
7= 𝑅230.56
𝐶𝑢𝑠𝑡𝑜𝑚𝑒𝑟 3 =(1.675.27
) ∗ 𝑅3,000
4= 𝑅237.34
Hours
Hours
R/pallet/customer
Variable Cost:
𝑇𝑜𝑡𝑎𝑙 𝑠𝑡𝑟𝑎𝑖𝑔ℎ𝑡𝑙𝑖𝑛𝑒 𝑑𝑖𝑠𝑡𝑎𝑛𝑐𝑒 = 12 + 15 + 30 = 57
𝐶𝑢𝑠𝑡𝑜𝑚𝑒𝑟 1 =(1257) ∗ 𝑅1,500
2= 𝑅157.89
𝐶𝑢𝑠𝑡𝑜𝑚𝑒𝑟 2 =(1557) ∗ 𝑅1,500
7= 𝑅56.39
𝐶𝑢𝑠𝑡𝑜𝑚𝑒𝑟 3 =(3057) ∗ 𝑅1,500
4= 𝑅197.37
R/pallet/customer
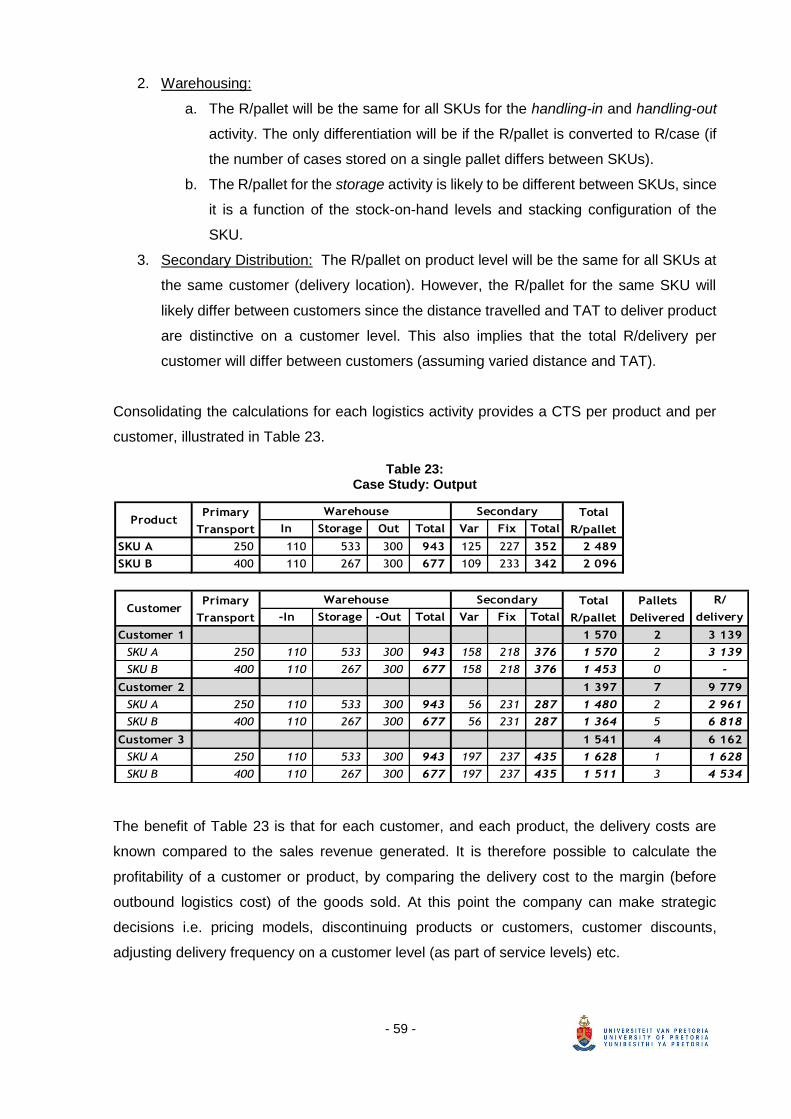
- 59 -
2. Warehousing:
a. The R/pallet will be the same for all SKUs for the handling-in and handling-out
activity. The only differentiation will be if the R/pallet is converted to R/case (if
the number of cases stored on a single pallet differs between SKUs).
b. The R/pallet for the storage activity is likely to be different between SKUs, since
it is a function of the stock-on-hand levels and stacking configuration of the
SKU.
3. Secondary Distribution: The R/pallet on product level will be the same for all SKUs at
the same customer (delivery location). However, the R/pallet for the same SKU will
likely differ between customers since the distance travelled and TAT to deliver product
are distinctive on a customer level. This also implies that the total R/delivery per
customer will differ between customers (assuming varied distance and TAT).
Consolidating the calculations for each logistics activity provides a CTS per product and per
customer, illustrated in Table 23.
Table 23: Case Study: Output
In Storage Out Total Var Fix Total
SKU A 250 110 533 300 943 125 227 352 2 489
SKU B 400 110 267 300 677 109 233 342 2 096
-In Storage -Out Total Var Fix Total
Customer 1 1 570 2 3 139
SKU A 250 110 533 300 943 158 218 376 1 570 2 3 139
SKU B 400 110 267 300 677 158 218 376 1 453 0 -
Customer 2 1 397 7 9 779
SKU A 250 110 533 300 943 56 231 287 1 480 2 2 961
SKU B 400 110 267 300 677 56 231 287 1 364 5 6 818
Customer 3 1 541 4 6 162
SKU A 250 110 533 300 943 197 237 435 1 628 1 1 628
SKU B 400 110 267 300 677 197 237 435 1 511 3 4 534
Pallets
Delivered
R/
delivery
Primary
TransportProduct
Total
R/pallet
SecondaryWarehouse
CustomerWarehouse SecondaryPrimary
Transport
Total
R/pallet
The benefit of Table 23 is that for each customer, and each product, the delivery costs are
known compared to the sales revenue generated. It is therefore possible to calculate the
profitability of a customer or product, by comparing the delivery cost to the margin (before
outbound logistics cost) of the goods sold. At this point the company can make strategic
decisions i.e. pricing models, discontinuing products or customers, customer discounts,
adjusting delivery frequency on a customer level (as part of service levels) etc.
- 60 -
Applying the CTS framework, as illustrated through the conceptual calculations above, to the
company’s transactional data yields very insightful results. The following section provides
examples of dashboards in which the CTS results can be reported and interpreted. Integrating
the CTS framework with the existing systems, and the details to be included in the dashboards,
depends on a company’s system architecture, reporting preferences and the business
application.
6.5 DASHBOARD
The aim of this section is to provide an overview of potential CTS dashboards that can be
created after applying the CTS framework. These dashboards can provide different users with
a single source of information of the outbound logistics activities per customer per product to
assist in visibility, performance measurement and quick decision making.
For illustrative purposes, products are moved to customers though the physical network, will
be measured in tons, pallets and sales value. All the physical movements attract logistics cost
which was split into three main processes, namely:
1. Primary transport,
2. Warehousing (split between handling-in, storage and handling-out activities), and
3. Secondary transport.
Figure 11 provides a summary of the cost to serve dashboard over a predefined time period.
It contains the following information (labelled on the graph accordingly):
1. Key facts over the time period, e.g. total CTS, pallets delivered, CTS R/pallet etc.
2. A total cost breakdown for each outbound logistics activity (amounting to total CTS).
3. The total CTS, in Rand value and expressed as a percentage of net invoice value (NIV),
for each depot / distribution centre.
4. Reconciliation or verification that the total CTS balances to the actual management
accounts or income statement (tying back to the cost base of the business).

- 61 -
The following dashboard, Figure 12, provides insight into the CTS for each individual customer
(each dot on the graph represents an individual customer), to clearly illustrate the CTS as a
percentage of a customer’s NIV on the y-axis and pallets delivered on the x-axis. In the table,
customers are grouped into CTS categories. A company could therefore quickly identify
customers with a high CTS (e.g. >20% of Sales Value, which is higher than the industry
benchmark) for further investigation. A similar dashboard could be developed on product SKU
level.
Figure 12: Case Study Customer Classification
1
2 3
4
Figure 11: Cast Study Dashboard (CTS Summary)

- 62 -
The company considers that an outbound logistics CTS (as a percentage of NIV) of greater
than 40% will completely erode profit margins. From above results, 27% of customers have a
CTS of greater than 40% which illustrates that these customers offset the profits of others. It
is important for a business to understand which products and customers these are and what
impact they have on the company, hence illustrating why identifying cost drivers to determine
the CTS is so important for decision-making purposes.
The final dashboard (Figure 13) provides a comparison view of different business units (BUs)
within the company, each having a unique supply chain. It’s therefore possible to clearly
understand each business unit’s respective CTS (on a total and R/pallet or R/ton level), which
would enable the determination of respective profitability. Even though the cost drivers for the
business units are the same, the resultant margin contribution could be substantially different.
Figure 13: Case Study Business Unit Comparison
The following insights can be derived from above dashboard:
a. BU3 has the highest SKU range and the highest sales (pallets) compared to the other
BUs. On an aggregated level (not on customer of product level), it seems to be a
profitable BU with a CTS of 8% of NIV.
b. BU4, on the other hand, is the smallest SKU range and low sales (pallets) with a
relatively high CTS % (>22%). It would be necessary to understand the percentage
margin of each product (that could be higher for i.e. a high-value low-volume product),
before inferences can be made with regards to profitability.
BU 1
BU 2
BU 3
BU 4
BU 5
BU 1
BU 2
BU 3
BU 4
BU 5

- 63 -
c. Expressing the CTS as R/pallet and R/ton shows interesting differences between the
BUs. The total R/pallet for BU2 is the highest. It is noteworthy that the R/ton for BU2 by
far exceeds that of the other BUs. This is due to the light weight of the product on the
pallet. Since pallets is the handling unit in logistics operations, this illustrates the
importance of appropriate metrics. For example, should the company measure CTS
expressed as R/ton, it will completely distort the outcome and interpretation thereof and
any benchmark will seem unreasonable. It is therefore recommended to express the
CTS as R/pallet for comparison purposes between BUs.
6.6 CONCLUDING REMARKS
Most companies know exactly what a product costs to produce, but yet don’t understand what
costs are involved to deliver the product on a customer level. The understanding of cost drivers
in outbound logistics based on the combinations of products and customers is essential to
identify the business issues associated with logistics, as part of the supply chain, and to
ultimately increase the business profitability. The demonstrated drivers and framework is a
powerful decision support methodology of deciding what to change, and how to prioritize such
changes.
The outcomes of the example boasted the following benefits:
1. Providing visibility of non-value-added activities and biggest cost contributors.
2. Improving overall business profitability by monitoring and reporting customer and
product CTS compared to product gross margin.
3. Improve the overall process of budgeting by identifying the cost/performance
relationship for different customers and product types.
4. Defining appropriate KPIs for the holistic outbound logistics function, that can be
customised for specific customer and product groups.
Finally, the intent of the example is to demonstrate a simplistic method of using the defined
outbound logistics cost drivers to enable cost allocation on a customer and product level. The
allocation calculations don’t need to descend to excessive detail, since the purpose thereof
can be used for setting strategic direction.
- 64 -
7 CONCLUSION
Management accounts are typically reported in business functional silos (e.g. marketing,
production, administration, logistics etc.) and not on a customer transactional level. This is a
major shortcoming since Fast-Moving Consumer Goods (FMCG) companies have a need to
understand the true cost-to-serve (CTS) and resultant profitability of individual customer and
product combinations. Existing cost methodologies were developed many years ago to
overcome the accounting shortcoming, of which activity based costing (ABC) is the most
prevalent. A key prerequisite of these costing methodologies is to identify the cost driver(s) for
the process and activities in question. For this study, outbound logistics processes and
activities were considered since they are significant cost contributors in the FMCG industry to
deliver product to customers.
The study evaluated the cost drivers and the development of a cost allocation framework,
specifically for outbound logistics processes within the South African FMCG industry. To
ensure sufficient background to the problem, a detailed literature study and market interviews
were undertaken, with particular attention to the following:
1. An overview of outbound logistics in South Africa and the significant costs it represents.
2. It is clear from the review that the FMCG industry poses several unique logistics
challenges. This includes inter alia the following:
o Highly competitive industry, typically selling high volumes at low margins.
o Prevalent seasonality trends across the year, months and weeks.
o The consumer and retail market are constantly changing, for example major
retailers “forcing” manufacturers to make use of the retailer’s centralised
logistics network.
o Continuous focus on product development with the added complexity of
delivering the product across large geographic regions to an expanding
customer footprint (especially the informal market).
3. Current accounting systems are insufficient to understand the CTS of customers and
products. The outbound logistics cost drivers, as a prerequisite to calculate the CTS,
are also not well defined for the FMCG industry.
4. The controlled market interviews confirmed that the outcomes of the study could be a
significant competitive advantage, however currently the cost drivers are not well
understood or homogenous.
5. The study evinced the activity cost drivers, based on the ABC methodology, for each
respective outbound logistics process and its application through a CTS allocation
framework for the FMCG industry.

- 65 -
Once a company defined the outbound logistics cost drivers and understand its costs to a
sufficient degree of accuracy, then it has a platform capable of making informed continuous
improvement decisions. The process of building and updating the platform is a unique skill and
one that must be learned and internalised. The CTS framework can assist a FMCG company
with the process of learning and internalising the valuable insights that can be derived from the
suggested framework and approach.
In the introduction of the dissertation three conjectures were formulated that needed to be
tested. These are:
1. Current accounting systems provide insufficient insight into the outbound logistics cost-
to-serve (CTS) on a product and customer level. The development of an alternative
CTS allocation framework, underpinned by cost drivers, is required to translate and
assign cost logically to customer transactions to determine the true CTS.
2. The cost drivers of outbound logistics in the South African FMCG industry are not well
defined or understood. This is a key component to develop cost allocation logic for each
cost driver on a customer transactional level.
3. An outbound logistics CTS allocation framework is a critical component of supply chain
optimisation as (i) cost is linked to actual activity, (ii) it leads to business understanding
of costs and cost drivers, (iii) it acts as a tool to identify customer servicing strategies
to improve service and profit.
Based on the literature review, market interviews as well as the validation of the suggested
CTS allocation framework the conclusions are:
• Conjecture 1: Current accounting systems are lacking the insights to understand the
outbound logistics CTS on a product and customer level. Being able to evaluate the
CTS on a more detailed level is a key requirement to ensure that informed and
appropriate business decisions are taken. The market interviews within the FMCG
industry supported the notion that a CTS allocation framework, based on defined cost
drivers, could be a critical input to supply chain optimisation and overall business
profitability.
• Conjecture 2: The market interviews indicated that cost drivers for outbound logistics
in the FMCG industry are not well defined. However, the literature study and structured
interview questions evinced that standard cost driver(s) for each outbound logistics
process and related activities can indeed be defined, albeit slight variations might exist
due to different supply chain intricacies. However, the principle of using the cost
driver(s) to develop a CTS allocation framework on a customer and product level holds
true.

- 66 -
• Conjecture 3: The study established that it’s probable that costs can be ringfenced for
the respective outbound logistics processes. Evaluating the cost drivers for the
activities associated to the processes will lead to a better understanding of the logistics
costs and the drivers thereof. The suggested CTS allocation framework determines the
true CTS on customer and product level and is therefore a valuable decision-support
tool to identify improvement initiatives and optimisation. Applying the tool to shape
customer servicing strategies, whilst reducing the outbound logistics CTS (and hence
increase profit), is a significant competitive advantage.
The research focused on FMCG outbound logistics activities and therefore excludes other
supply chain functions and trading activities. The key cost drivers for each outbound logistics
process, namely (i) primary distribution, (ii) warehousing/storage, and (iii) secondary
distribution, was identified identified through the literature study and market interviews.
Subsequently a CTS allocation framework was developed as a practical tool for FMCG to
determine the CTS on a customer and product level. Further studies could evaluate the cost
drivers and allocation framework that includes other supply chain processes for example
manufacturing, return logistics and trading activities associated with sales and marketing (e.g.
order capturing, invoicing, merchandising, after-market service etc.). It could also be valuable
expand the scope of the study to other industries, i.e. Financial, Mining and Petrochemical,
and note the potential cost driver and allocation differences.
- 67 -
8 REFERENCES
1. The Association for Operations Management (APICS), 2017. APICS Dictionary, 15th
Edition. Chicago (USA).
2. Bansal, R. 2014. A Comparative Financial Study: Evidence from Selected Retail
Companies. Journal of Finance and Investment Analysis, vol. 3, no. 3. Scienpress Ltd.
3. Barloworld Logistics, 2007. Supplychainforesight. TerraNova Research: Johannesburg.
Available from: http://barloworld-logistics.com/supply-chain-foresight/
4. Barloworld Logistics, 2014. Supplychainforesight. Frost & Sullivan: Johannesburg.
Available from: http://barloworld-logistics.com/supply-chain-foresight/
5. Barloworld Logistics, 2016. Supplychainforesight. Frost & Sullivan: Johannesburg.
Available from: http://barloworld-logistics.com/supply-chain-foresight/
6. Bokor, Z. and Markovits-Somogyi, R. 2014. Applying Activity-based Costing at Logistics
Service Providers. Periodica Polytechnica Transportation Engineering.
7. Burger, F. 2003. The Impact of Warehousing and Transportation Optimisation on Supply
Chain Effectiveness. Unpublished MCom Dissertation. Johannesburg: Rand Afrikaans
University.
8. Christopher, M. 2016. Logistics and Supply Chain Management 5th Edition. FT Publishing.
Financial Times.
9. Christopher, M. 1998. Logistics and Supply Chain Management: Strategies for Reducing
Cost and Improving Service. Pearson Education Limited: Essex (England).
10. Christopher, M. and Gattorna, J. 2005. 'Supply Chain Cost Management and Value-Based
Pricing' Industrial Marketing Management, p.115 – 121.
11. Cooper, R., and Kaplan, R.S. 1988. Measure costs right, make the right decisions. Harvard
Business Review. Vol 66 (5). England.
12. Cooper, R., and Kaplan, R.S. 1991. Profit priorities from activity-based costing. Harvard
Business Review. Vol 69 (5). England.
13. Cox, J.F. and Spencer, M.S. 1998. The Constraints Management Handbook. CRC Press:
Boca Raton.
14. CSIR, 2006. The third annual state of logistics survey for South Africa. Centre for Logistics,
CSIR Built Environment: Pretoria. Available from: https://www.csir.co.za/state-logistics-
survey-south-africa-gearing-change.
15. CSIR, 2008. The fifth annual State of Logistics Survey for South Africa 2008. Centre for
Logistics, CSIR Built Environment: Pretoria. Available from: https://www.csir.co.za/state-
logistics-survey-south-africa-gearing-change

- 68 -
16. CSIR, 2012. 8th annual State of Logistics survey for South Africa. Centre for Logistics, CSIR
Built Environment: Pretoria. Available from: https://www.csir.co.za/state-logistics-survey-
south-africa-gearing-change.
17. CSIR, 2013. 10th annual State of Logistics survey for South Africa. Centre for Logistics,
CSIR Built Environment: Pretoria. Available from: https://www.csir.co.za/state-logistics-
survey-south-africa-gearing-change.
18. Economist Intelligence Unit, March 2012. Industry report: Consumer goods and retail.
[Online] Available from: www.eiu.com.
19. Foster, G. and Gupta, M. 1994. Marketing, cost management and management
accounting. Journal of Management Accounting Research, p43-77.
20. Dugdale, D. and Jones, T.C. 1998. Throughput Accounting: Transforming Practices?
British Accounting Review. Vol. 30: 203 – 220.
21. Griful-Miquela, C. 2001. Activity-Based Costing Methodology for Third-Party Logistics
Companies. IAER, 7(1): 133 – 146.
22. Gulsecen, S. and Kubat, A. 2006. Teaching ICT to teacher candidates using PBL: A
qualitative and quantitative evaluation. Educational Technology & Society 9(2), 96.
23. Havenga, J. and Simpson, Z. 2013. Logistics Costs and Efficiency. 10th Annual State of
Logistics Survey for South Africa. Centre for Logistics, CSIR Built Environment: Pretoria.
Available from: https://www.csir.co.za/state-logistics-survey-south-africa-gearing-change
24. Havenga, J.H., Simpson, Z.P., King, D. de Bod, A. and Braun, M. 2016. Logistics
Barometer South Africa 2016. Stellenbosch University.
25. Havenga, J.H., De Bod, A.,Simpson, Z.P., Viljoen, N. & King, D. 2016. A Logistics
Barometer for South Africa: Towards sustainable freight mobility. Journal of Transport and
Supply Chain Management 10(1), a228. South Africa
26. Hill, P. 2013. Pricing for Profit : How to Develop a Powerful Pricing Strategy for Your
Business. Kogan Page Ltd, London.
27. Jooste, M and Van Niekerk, H.J. 2009. Why consider cost to serve modelling? SAPICS
31st Annual Conference and Exhibition. South Africa.
28. Kelly, P. 2016. Analysis: South Africa’s CPI reveals how volatile inflation hurts the poorest.
Article in Daily Maverick [online]. Available from: www.dailymaverick.co.za
29. Krajnc, J., Logozar, K., and Korosec, B. 2012. Activity-based management of logistic costs
in a manufacturing company. a case of increased visibility of logistic costs in a Slovenian
paper manufacturing company. Promet Traffic & Transportation, p. 15-24
30. La Londe, B.J. and Pohlen, T. L. 1994. Implementing activity-based costing (ABC) in
logistics. Journal of Business Logistics.
- 69 -
31. Lin, B., Collins, J. and Su, R.K. 2001. Supply Chain Costing: an activity-based perspective.
International Journal of Physical Distribution & Logistics Management, 31(10): 702 – 713.
32. Lyly-Yrjänäinen, J. and Paranko, J, 2001. A New Approach to Product Costing in Logistics
Business. 16th International Conference on Production Research. 29.7.-3.8.2001, Prague,
Czech Republic.
33. Massmart. Financial Statements. [Online] Available from: www.massmart.co.za [Accessed
August 2014]
34. Mohr, P. & Fourie, L. 2004. Economics: for South African students, 3rd ed. Pretoria: Van
Schaik Publishers.
35. Mouton, J. 2001. How to succeed in your Master’s and Doctoral Studies. Pretoria: Van
Schaik Publishers.
36. Norek, C.D. and Pohlen, T.L. 2001. Cost knowledge: A foundation for Improving Supply
Chain Relationships. The international Journal of Logistics Management, 12(1): 37 – 51.
37. Pick ‘n Pay. Investor Relations. [Online] Available from: www.picknpay.co.za [Accessed
August 2014]
38. Pirttila T., and Petri H. 1995. Activity-Based Costing and Distribution Logistics
Management. International Journal of Production Economics 41(1):327–33.
39. Pohlen, T., Coleman, B.J., 2005. Evaluating internal operations and supply chain
performance using EVA and ABC. SAM Advanced Management Journal.
40. PWC. South African retail and consumer products outlook 2012-2016. October 2012 South
African Edition. Available from: https://www.pwc.co.za/en/assets/pdf/retail-and-consumer-
products-outlook-2012-2016.pdf
41. Razzaque, M.A. and Sheng, C.C. 1998. Outsourcing of logistics functions: a literature
survey. International Journal of Physical Distribution & Logistics Management, 28(2): 89-
107.
42. Renuka, P. 2013. Supply Chain Management Challenges for FMCG in Retail Sectors in
India. Shri Jagdishprasad Jhabarmal Tibarewala University.
43. Ryals, L. 2006. Profitable relationships with key customers: how suppliers manage pricing
and customer risk. Journal of strategic marketing. 2006;14(2):101-113.
44. Ryals, L. 2008. Managing Customers Profitably. Chichester, England: John Wiley & Sons.
45. Seuring, S. and Muller, M. 2008. From a literature review to a conceptual framework for
sustainable supply chain management. Journal of Cleaner Production 16, 1699 – 1710.
46. Sheu, C., Chen, M. and Kovar, S. 2003. Integrating ABC and TOC for better manufacturing
decision making. Integrated Manufacturing Systems, 14(5): 433 – 441.
47. Simatupang, Togar M., Wright, A.C., and Ramaswami, S. 2004. Applying the Theory of
Constraints to Supply Chain Collaboration. Supply Chain Management: An International
Journal 9(1):57–70.

- 70 -
48. Shoprite Holdings. All Financial Documents. [Online] Available from:
www.shopriteholdings.co.za [Accessed August 2014]
49. Spector, R.E. 2006. How Constraints Management Enhances Lean and Six Sigma. Supply
Chain Management Review, January/ February: 43 - 47
50. StatsSA, 2017. CPI Statistics. [Online] Available from: www.statssa.gov.za
51. Stapleton, D., Pati, S., Beach, E., Julmanichoti, P. 2001. Activity-based costing for logistics
and marketing. Business Process Management Journal, 10(3): 584 – 597.
52. Steyn, J.N. and Sewell, W. 2013. Priority Research Needs of the South African Wholesale
and Retail Sector. SA Business Review Journal.
53. Stock, J. R. and Lambert, D. M. 2001. Strategic Logistics Management 4th Ed. Boston,
McGraw-Hill Irwin.
54. Thermido, I., Arantes, A., Fernandes, C. and Guedes, A.P. 2000. Logistics Cost Case
Study- An ABC Approach. The Journal of Operational Research Society, 51(10): 1148
55. Wiggil, T. 2016. How pallets stack up. [Online] Article available from
www.transportworldafrica.co.za.
56. Ye, X. 2001. Logistics cost management based on ABC and EVA integrated mode. IEEE
International Conference on Automation and Logistics (ICAL), p. 261 – 266.
57. Yin, R. 2014. Case study research design and methods. London