
EVALUALUATION AND OPTIMIZATION OF BENDING MOMENT … · length, screw length, number and dimension...
16
201 WOOD RESEARCH 59 (1): 2014 201-216 EVALUALUATION AND OPTIMIZATION OF BENDING MOMENT CAPACITY OF CORNER JOINTS WITH DIFFERENT BORING PLANS IN CABINET CONSTRUCTION Abdulkadir Malkoçoğlu Karadeniz Technical University, Faculty of Forest Industry Engineering Trabzon, Turkey Nurdan Çetin Yerlikaya Yalova University, Art and Design Faculty Yalova, Turkey Şükrü Özşahin Karadeniz Technical University Faculty of Technology Trabzon, Turkey (Received April 2013) ABSTRACT In this study, the effects of end-distances and lengths of specimen (depths of cabinet) of ready-to-assemble (RTA) furniture on the bending moment resistance of corner joints were investigated and optimized by Artificial Neutral Networks (ANN). Melamine-coated particleboard (MCP) and melamine-coated fiberboard (MCP), cam fasteners, wooden dowels, and polyvinyl acetate (PVAc) adhesive were used for specimen construction as used in the furniture industry. For each of the specimens, five different lengths and four other illustrations which had diverse front and back end distances were prepared. Consequently, test results showed that the bending moment capacity went up when the distance is decreased and when the specimen length is increased. MCF moment values were 40 % higher than MCP moment values in the test results. According to ANOVA results for both MCP and MCF, significant differences were found in bending moment capacity with respect to the lengths of specimen and end distances. By ANN, the most appropriate boring plans for the end distance that belongs to 10 mm specimen lengths are introduced. KEYWORDS: Ready-to-assemble furniture, corner joints, boring plans, melamine-coated boards, bending moment resistance, ANN.
Transcript of EVALUALUATION AND OPTIMIZATION OF BENDING MOMENT … · length, screw length, number and dimension...
201
WOOD RESEARCH 59 (1): 2014 201-216
EVALUALUATION AND OPTIMIZATION
OF BENDING MOMENT CAPACITY OF CORNER JOINTS
WITH DIFFERENT BORING PLANS IN CABINET
CONSTRUCTION
Abdulkadir Malkoçoğlu Karadeniz Technical University, Faculty of Forest Industry Engineering
Trabzon, Turkey
Nurdan Çetin YerlikayaYalova University, Art and Design Faculty
Yalova, Turkey
Şükrü ÖzşahinKaradeniz Technical University
Faculty of Technology Trabzon, Turkey
(Received April 2013)
ABSTRACT
In this study, the effects of end-distances and lengths of specimen (depths of cabinet) of ready-to-assemble (RTA) furniture on the bending moment resistance of corner joints were investigated and optimized by Artificial Neutral Networks (ANN). Melamine-coated particleboard (MCP) and melamine-coated fiberboard (MCP), cam fasteners, wooden dowels, and polyvinyl acetate (PVAc) adhesive were used for specimen construction as used in the furniture industry. For each of the specimens, five different lengths and four other illustrations which had diverse front and back end distances were prepared. Consequently, test results showed that the bending moment capacity went up when the distance is decreased and when the specimen length is increased. MCF moment values were 40 % higher than MCP moment values in the test results. According to ANOVA results for both MCP and MCF, significant differences were found in bending moment capacity with respect to the lengths of specimen and end distances. By ANN, the most appropriate boring plans for the end distance that belongs to 10 mm specimen lengths are introduced.
KEYWORDS: Ready-to-assemble furniture, corner joints, boring plans, melamine-coated boards, bending moment resistance, ANN.

202
WOOD RESEARCH
INTRODUCTION
The designs of furniture construction have been carried out as results of trials and error methods. Joints are generally the weakest parts in the construction of furniture. Therefore, joint design is the most important step of furniture production (Eckelman 2003). In furniture manufacturing, over 10 thousand joint methods are available (Güntekin 2002). Some of them based on connectors with fasteners have been used in RTA since the middle of 20th century. There are numerous types and sizes of RTA connectors such as mechanical cam locking, screws-in bolts, brackets, bolt-tightening, and hooks.
Panel type RTA furniture is usually attached with both cam fasteners and dowels which are placed as the cam fastener outer, and dowel inner position on a joint member. The various fasteners (cams, dowels etc.) are fixed 70-80 mm away from the member edge in workshops, and 50 mm away in mass production. Resistance values for all criteria of product groups need to be identified in order to set relevant standards related to optimal boring plans. Joint operations should be carried out according to boring plans in every type of furniture manufacturing. In this regard, for cabinet-type RTA furniture joints, time wasting should be minimized by using the optimal boring plan so that the number of processes, assembly and other stage operations can be reduced (Malkoçoğlu 2012).
ANN is a computer system which has been designed according to the assumed working principles of the human brain developed to establish skills for automatically producing new information and discovering through learning without any help. In the past, due to their ability to learn complex non-linear and multivariable relationships between process parameters, ANNs have been appropriate for modeling various manufacturing functions (Oztemel 2006; Ceylan 2008; Özşahin 2012).
There have not been many studies on cabinet-type ready-to-assemble furniture’s optimal boring plans. In this study, the significant similarities among different strength experiments conducted with various materials and assembling methods were investigated. In similar studiescarried out with dowels, Bechmann and Hassler (Bechmann and Hassler 1975) studied joints constructed with 8 mm-diameter dowels. They found that for all practical purposes, the capacities of joints regularly increased when constructed with 1 to 4 dowels. They stated that spaces should not be closer than 100 mm.
Zhang and Eckelman (1993) found that the highest bending moment capacities at the spacing between dowels to be at least 75 mm. Likewise, Ho and Eckelman (1994) claimed that the most powerful approach to increasing strength was to place assembling tools very close to the front of the cabinet furniture. They found that maximum racking resistance was obtained with screw spacing of 75-90 mm. Rajak and Eckelman (1996) investigated the effects of specimen length, screw length, number and dimension on the bending moment capacity of joints. They found that bending moment capacity increased in direct proportion to the number of screws. Subsequent research by Liu and Eckelman (1998) determined that bending strength increased fast until the “zones of influence” of the fasteners overlap. They explained that no increase in strength was obtained beyond that point. The bending strength per fastener began to drop as the spacing between fasteners decreased below 57 mm.
Norvydas et al. (2005) concluded that dowel centers and the dowel spacing and edge affected joint strength. They reported that edge components were the weakest part of cabinet-type ready-to-assemble furniture. Also, according to the same authors, when the space between the dowel and edge was smaller than 45 mm, then a decrease in the joint strength could be explicitly observed. Furthermore, the observations showed that the strength increases parallel to increases

203
Vol. 59 (1): 2014
in the dowel spacing and the dowel distance to the edge.In related works investigating types of fastener and material, Albin et al. (1987) conducted
extensive tests on corner joints constructed both with adhesive-based and mechanical fasteners. Overall, they found that the capacity of the joints varied mostly depending on the type of fastener along with the quality of particle board in the specimens. According to Efe (1998) and Tankut (2005), bending moment capacity was improved by increasing specimen length. MCF corner joints yielded approximately 3 times better results than MCPs joints. Also, Tankut (2005) explained that the maximum moment is obtained in joints when the spacing between dowels is at least 96 mm.
Simek et al. (2010) investigated the effect of the end distance of cam-lock RTA fasteners and un-glued wooden dowels on the splitting and bending moment resistance and number of dowels of RTA corner joints, respectively. Laminated particleboard, cam fasteners, and wooden dowels were used for specimen construction. They determined that the cam joints with a 60 mm end distance had significantly higher moment capacity than the joints with 30 and 90 mm edge distances.
The main purpose of this study was to determine the moment strength resistance of RTA furniture corner joints in the multi-boring unit machine which is mostly used in mass production. The effects of the corner joint and different panel types on the different lengths of specimen and end distances according to previously determined boring plan on the moment resistance were investigated. In addition, the maximum strength value and optimization of the moment capacity of 10 mm specimen length were determined using ANN application.
MATERIAL AND METHODS
MaterialAll specimens were constructed from 18-mm-thick MCP and MCP because of their common
utilization in the furniture sector. The panels were tested (Tab. 1) for moisture content (MC), density (D), and modulus of elasticity (MOE) in accordance with ASTM D 1037-06a (2006). Cam fasteners with 15 mm diameter were chosen for this study. Multi-grooved beech dowels with 8 mm in diameter and 34 mm length were used in combination with cam fasteners. Also, PVAc adhesive was used for the bonding of the dowels into the holes on the edge butt members.
MethodsSpecimen preparation
The general configuration of the corner joint members is shown in Fig. 1. Each specimen consisted of a face and butt members with dowels that were assembled with two cam fasteners. The parts of the cam fastener are listed as; plug, bolt, and cam housing as shown in Fig. 2.
Fig. 1: Members with connectors and description of boring plans applied in the tests.
Fig. 2: Sizes and parts of cam fastener used in the tests (mm).
204
WOOD RESEARCH
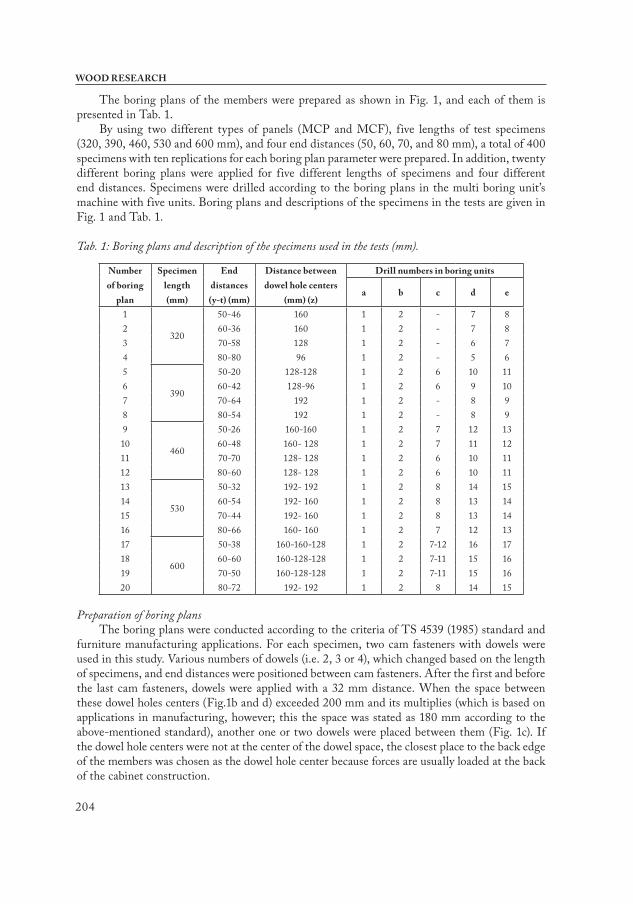
The boring plans of the members were prepared as shown in Fig. 1, and each of them is presented in Tab. 1.
By using two different types of panels (MCP and MCF), five lengths of test specimens (320, 390, 460, 530 and 600 mm), and four end distances (50, 60, 70, and 80 mm), a total of 400 specimens with ten replications for each boring plan parameter were prepared. In addition, twenty different boring plans were applied for five different lengths of specimens and four different end distances. Specimens were drilled according to the boring plans in the multi boring unit’s machine with five units. Boring plans and descriptions of the specimens in the tests are given in Fig. 1 and Tab. 1.
Tab. 1: Boring plans and description of the specimens used in the tests (mm).
Number of boring
plan
Specimen length (mm)
End distances (y-t) (mm)
Distance between dowel hole centers
(mm) (z)
Drill numbers in boring units
a b c d e
1
320
50-46 160 1 2 - 7 82 60-36 160 1 2 - 7 83 70-58 128 1 2 - 6 74 80-80 96 1 2 - 5 65
390
50-20 128-128 1 2 6 10 116 60-42 128-96 1 2 6 9 107 70-64 192 1 2 - 8 98 80-54 192 1 2 - 8 99
460
50-26 160-160 1 2 7 12 1310 60-48 160- 128 1 2 7 11 1211 70-70 128- 128 1 2 6 10 1112 80-60 128- 128 1 2 6 10 1113
530
50-32 192- 192 1 2 8 14 1514 60-54 192- 160 1 2 8 13 1415 70-44 192- 160 1 2 8 13 1416 80-66 160- 160 1 2 7 12 1317
600
50-38 160-160-128 1 2 7-12 16 1718 60-60 160-128-128 1 2 7-11 15 1619 70-50 160-128-128 1 2 7-11 15 1620 80-72 192- 192 1 2 8 14 15
Preparation of boring plansThe boring plans were conducted according to the criteria of TS 4539 (1985) standard and
furniture manufacturing applications. For each specimen, two cam fasteners with dowels were used in this study. Various numbers of dowels (i.e. 2, 3 or 4), which changed based on the length of specimens, and end distances were positioned between cam fasteners. After the first and before the last cam fasteners, dowels were applied with a 32 mm distance. When the space between these dowel holes centers (Fig.1b and d) exceeded 200 mm and its multiplies (which is based on applications in manufacturing, however; this the space was stated as 180 mm according to the above-mentioned standard), another one or two dowels were placed between them (Fig. 1c). If the dowel hole centers were not at the center of the dowel space, the closest place to the back edge of the members was chosen as the dowel hole center because forces are usually loaded at the back of the cabinet construction.

205
Vol. 59 (1): 2014
The dowels were bonded to butt members with polyvinyl acetate (PVAc) adhesive. Adhesive was applied to the dowel holes with about 150–200 g.m-2. Dowels were nailed down to those adhesive holes with the help of a mold. All of the members were conditioned in the conditioning room at 20±2°C and 65±5 % relative humidity. Plugs were inserted into the holes on the face member surfaces, and then the bolts were tightened into the plugs. After the bolts were inserted in the cams, the cams were tightened.
TestingAll tests were carried out with a universal testing machine. A loading rate of 6 mm.min-1
was used in all tests. Specimens were fixed to the test machine by a mold (Fig. 3) and then the load was applied.
Fig. 3: Test specimen and loading type (mm).
The loading process was continued until a significant decrease was observed in the strength of joints. Once the loading process was ended, the amount of loading was measured with ± 0.1 N sensitivity. The strength of joints was characterized by the bending moment value when the joint was disabled.
Method of ANNThe development of the ANN models significantly depends on the experimental results.
In the ANN modeling for the present work, the panel type, length of specimen (mm), first end distance mm (the space between the first hole center and front edge), back end distance mm (the space between the end hole center and back edge), number of dowels and distance between dowels (mm) were considered as the prime processing variables. The proposed ANN model was designed by software developed using the MATLAB Neural Network Toolbox. The data were obtained from the experimental study. To examine the effects of panel type, length of specimen, front end distance, back end distance, number of dowels and distance between the dowel hole center on moment capacity and the elasticity values of MCP and MCF, the experimental data were divided into training and testing data. Among these data, 26 samples were selected for the ANN training process, while the remaining 14 samples were used to verify the generalization capability of ANN. The data sets used in the prediction model are shown in Tab. 2 and Tab. 3.
The application of ANNThe ANN models, which have different network structures and parameters were constituted,
and ANNs training processes were performed with MATLAB package software to determine weight and bias values and to minimize the mean square error (MSE). MSE was calculated using Eq. 2. In order to determine the performance of networks, the models were tested using a set of data (namely test data) containing input-output pairs which were not utilized for the training processes. Thus, the most sensitive (appropriate) ANN result was targeted.

206
WOOD RESEARCH
The bending moments were calculated with Eq.1.
M = P x l (Nm) (1)
where: M- joint bending moment (Nm), P- applied load (N), l- moment arm defined in Fig. 3.
Tab. 2: The training data set used in the prediction model and prediction model results.
Panel type
Length of
specimen (mm)
End distances
(mm)
Number of dowel
Distance between dowel hole
centers (mm)
Moment (Nm)
Measured Predicted Error %
MCP
32050-46 2 160 8.85 9.03 -1.9960-36 2 160 12.63 12.66 -0.2280-80 2 96 10.99 11.00 -0.0850-20 3 128-128 15.35 15.34 0.04
390 70-64 2 192 8.76 8.73 0.4060-48 3 160-128 13.09 13.04 0.35
460 70-70 3 128-128 13.54 13.20 2.4980-60 3 128-128 13.60 13.58 0.1450-32 3 192-192 12.33 12.29 0.33
530 70-44 3 192-160 12.75 12.75 -0.02
60050-38 4 160-160-128 23.60 23.56 0.1760-60 4 160-128-128 19.70 19.77 -0.3780-72 3 192-192 12.98 12.98 0.01
MCF
32050-46 2 160 12.43 14.94 20.2260-36 2 160 15.72 14.94 4.9470-58 2 128 16.13 14.95 7.2960-42 3 128-96 24.38 24.38 0.00
390 70-64 2 192 15.30 14.94 2.3680-54 2 192 15.12 14.94 1.1850-26 3 160-160 18.80 18.76 0.19
460 80-60 3 128-128 17.14 17.20 -0.3850-32 3 192-192 17.03 17.06 -0.15
530 60-54 3 192-160 18.45 18.40 0.2570-44 3 192-160 18.23 18.31 -0.4260-60 4 160-128-128 30.23 30.19 0.12
600 80-72 3 192-192 19.93 19.70 1.14MAPE 1.740RMSE 0.578

207
Vol. 59 (1): 2014
Tab. 3: The testing data set used in the prediction model and prediction model results.
Panel typeLength of specimen
(mm)
End distances
(mm)
Number of dowel
Distance between dowel hole centers
(mm)
Moment (Nm)
Measured Predicted Error (%)
MCP
320 70-58 2 128 11.46 11.88 -3.70390 60-42 3 128-96 15.83 15.78 0.34390 80-54 2 192 7.67 8.40 -9.49460 50-26 3 160-160 13.62 13.52 0.75530 60-54 3 192-160 14.18 13.22 6.79530 80-66 3 160-160 15.35 12.58 18.04600 70-50 4 160-128-128 22.85 22.59 1.14
MCF
320 80-80 2 96 15.49 14.99 3.21390 50-20 3 128-128 20.55 19.74 3.96460 60-48 3 160-128 14.18 17.03 20.13460 70-70 3 128-128 16.94 17.11 -1.02530 80-66 3 160-160 22.45 18.20 18.93600 50-38 4 160-160-128 31.23 32.30 -3.41600 70-50 4 160-128-128 31.09 30.17 2.96
MAPE 6.705RMSE 1.659
(2)
where: ti - the actual output (targeted values), tdi - the neural network output (predicted values), N - the total number of measurements.
The obtained predicted values as a result of the testing process were compared with the real (measured) values. The model providing the best prediction values with respect to the root mean-square error (RMSE) ratio and the mean absolute percentage error (MAPE) ratio calculated with Eq. 3 and Eq. 4 respectively, was chosen as the prediction model (Eckelman 2003, Simek et al. 2010).
(3)
(4)
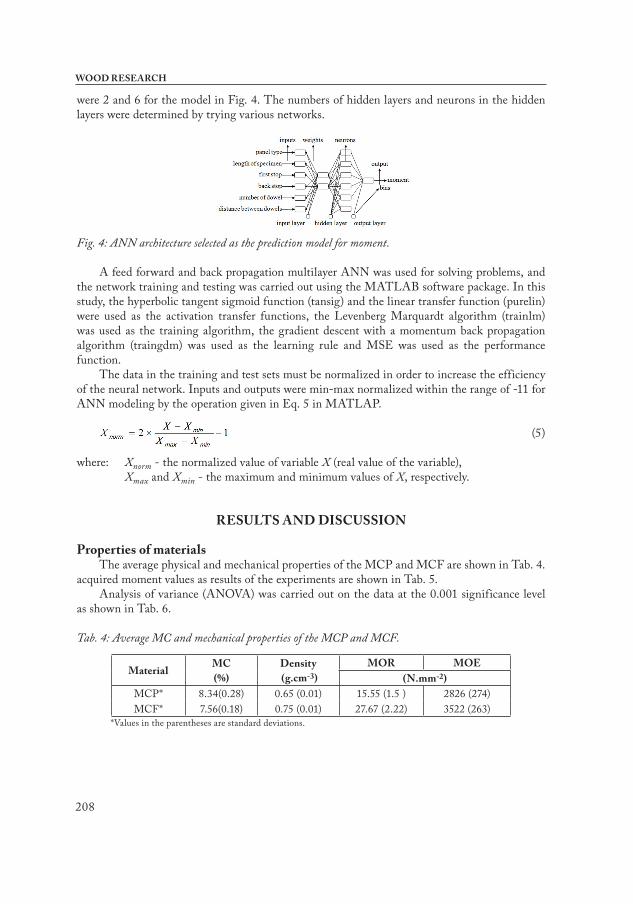
In Tabs. 2 and 3, the values calculated by utilizing this prediction model for the training and test data, real values, percentage error ratio, and the RMSE and MAPE values are indicated. Fig. 4 shows the ANN model containing one input layer, two hidden layer, and one output layer. The selected ANN model represents the prediction model that produced the closest values to the measured values for the moment capacity value of MCP and MCF. The panel type, length of specimen, first end distance, back end distance, number of dowels and distance between dowels were used as the input variables, while the moment capacity values were used as the output variables in the ANN model. The processing element numbers (neurons) of the hidden layers
208
WOOD RESEARCH
were 2 and 6 for the model in Fig. 4. The numbers of hidden layers and neurons in the hidden layers were determined by trying various networks.
Fig. 4: ANN architecture selected as the prediction model for moment.
A feed forward and back propagation multilayer ANN was used for solving problems, and the network training and testing was carried out using the MATLAB software package. In this study, the hyperbolic tangent sigmoid function (tansig) and the linear transfer function (purelin) were used as the activation transfer functions, the Levenberg Marquardt algorithm (trainlm) was used as the training algorithm, the gradient descent with a momentum back propagation algorithm (traingdm) was used as the learning rule and MSE was used as the performance function.
The data in the training and test sets must be normalized in order to increase the efficiency of the neural network. Inputs and outputs were min-max normalized within the range of -11 for ANN modeling by the operation given in Eq. 5 in MATLAP.
(5)
where: Xnorm - the normalized value of variable X (real value of the variable), Xmax and Xmin - the maximum and minimum values of X, respectively.
RESULTS AND DISCUSSION
Properties of materialsThe average physical and mechanical properties of the MCP and MCF are shown in Tab. 4.
acquired moment values as results of the experiments are shown in Tab. 5. Analysis of variance (ANOVA) was carried out on the data at the 0.001 significance level
as shown in Tab. 6.
Tab. 4: Average MC and mechanical properties of the MCP and MCF.
Material MC (%)
Density (g.cm-3)
MOR MOE(N.mm-2)
MCP* 8.34(0.28) 0.65 (0.01) 15.55 (1.5 ) 2826 (274)MCF* 7.56(0.18) 0.75 (0.01) 27.67 (2.22) 3522 (263)
*Values in the parentheses are standard deviations.
209
Vol. 59 (1): 2014
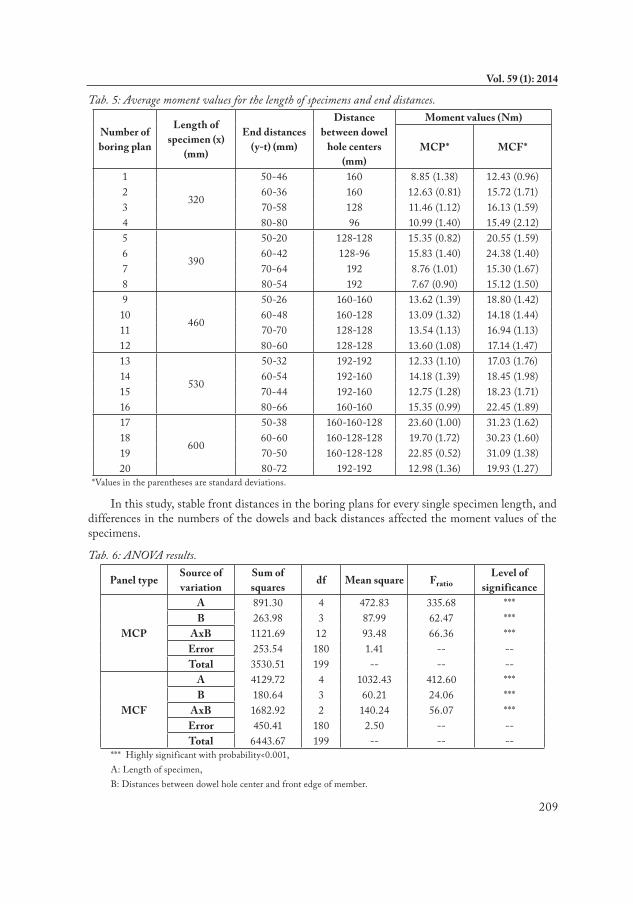
Tab. 5: Average moment values for the length of specimens and end distances.
Number of boring plan
Length of specimen (x)
(mm)
End distances (y-t) (mm)
Distance between dowel
hole centers (mm)
Moment values (Nm)
MCP* MCF*
1
320
50-46 160 8.85 (1.38) 12.43 (0.96)2 60-36 160 12.63 (0.81) 15.72 (1.71)3 70-58 128 11.46 (1.12) 16.13 (1.59)4 80-80 96 10.99 (1.40) 15.49 (2.12)5
390
50-20 128-128 15.35 (0.82) 20.55 (1.59)6 60-42 128-96 15.83 (1.40) 24.38 (1.40)7 70-64 192 8.76 (1.01) 15.30 (1.67)8 80-54 192 7.67 (0.90) 15.12 (1.50)9
460
50-26 160-160 13.62 (1.39) 18.80 (1.42)10 60-48 160-128 13.09 (1.32) 14.18 (1.44)11 70-70 128-128 13.54 (1.13) 16.94 (1.13)12 80-60 128-128 13.60 (1.08) 17.14 (1.47)13
530
50-32 192-192 12.33 (1.10) 17.03 (1.76)14 60-54 192-160 14.18 (1.39) 18.45 (1.98)15 70-44 192-160 12.75 (1.28) 18.23 (1.71)16 80-66 160-160 15.35 (0.99) 22.45 (1.89)17
600
50-38 160-160-128 23.60 (1.00) 31.23 (1.62)18 60-60 160-128-128 19.70 (1.72) 30.23 (1.60)19 70-50 160-128-128 22.85 (0.52) 31.09 (1.38)20 80-72 192-192 12.98 (1.36) 19.93 (1.27)
*Values in the parentheses are standard deviations.
In this study, stable front distances in the boring plans for every single specimen length, and differences in the numbers of the dowels and back distances affected the moment values of the specimens.
Tab. 6: ANOVA results.
Panel type Source of variation
Sum of squares df Mean square Fratio
Level of significance
MCP
A 891.30 4 472.83 335.68 ***B 263.98 3 87.99 62.47 ***
AxB 1121.69 12 93.48 66.36 ***Error 253.54 180 1.41 -- --Total 3530.51 199 -- -- --
MCF
A 4129.72 4 1032.43 412.60 ***B 180.64 3 60.21 24.06 ***
AxB 1682.92 2 140.24 56.07 ***Error 450.41 180 2.50 -- --Total 6443.67 199 -- -- --
*** Highly significant with probability<0.001, A: Length of specimen, B: Distances between dowel hole center and front edge of member.

210
WOOD RESEARCH
Results of these analysis show that there were significant differences in bending strength in terms of the length of sample, space between the front hole center and front edge and corresponding interactions of those. Average moment values based on length of samples are shown in Fig. 5. In addition, Duncan's test results for determining the homogeneity of groups are given in Tab. 7.
Fig. 5: Moment values based on the length of specimens.
Tab. 7: Homogeneity groups of moment values based on the length of specimens.
Length of specimens (mm)
MCP MCF
Moment (Nm) HG* Moment (Nm) HG*
320 10.98 D 14.94 D390 11.90 C 18.84 B460 13.46 B 16.77 C530 13.65 B 19.04 B600 19.78 A 28.12 A
* Homogeneity groups
As shown in Fig. 5 and Tab. 7, increasing the specimen lengths improved the strength values. This may be due to increasing the number of dowels and decreasing the distances between the hole center of the dowels.
In the studies related with fastener numbers, increasing the number of fasteners improves the strength of the joints (Bechmann and Hassler 1975; Rajak and Eckelman 1996; Lui and Eckelman 1998; Simek et al. 2010). When the distances between joint members were considered, lower strength values were obtained by using the lowest and greatest values in optimal numbers for distances. The strength values were lower for the distances 57 mm (Liu and Eckelman 1998), 32 and 64 mm (Norvydas et al. 2005), 32 and 128 mm (Tankut 2005) and less than 160 mm (Norvydas et al. 2005), while they were greater for the distances 75 mm (Zhang and Eckelman 1993; Ho and Eckelman 1994) and less than 100, 96 and 128 mm (Tankut 2005). Likewise, increasing member length improved the strength values (Tankut 2005). Accordingly, increasing the specimen lengths and the number of dowels improved the strength values. The results in this study illustrated similar findings to previous studies (Zhang and Eckelman 1993; Rajak and Eckelman 1996; Simek et al. 2010).
The average moment values based on the end distances are shown in Fig. 6. Furthermore, Duncan's test results which were made to determine the homogeneity of groups are given in Tab. 8.

211
Vol. 59 (1): 2014
Fig. 6: Moment values based on end distances.
Tab. 8: Homogeneity groups of moment values based on front end distance.
Front distance (mm)
MCP MCFMoment (Nm) HG* Moment (Nm) HG*
50 14.75 A 20.01 A60 15.09 A 20.59 A70 13.87 B 19.54 B80 12.12 C 18.03 C
* Homogeneity groups
As shown in Fig. 6 and Tab. 8, increasing the end distances decreased the strength values. Increasing the end distances which causes a decrease in the distances between dowels and the number of dowels could be reasons for the decrease in the strength values.
There are limited findings on the length or diameter of fasteners for end distances studies. In one study, end distances increased from 20 to 45 mm with an increment of 5 mm (Norvydas et al. 2005); however, the best strength values were obtained at 50, 55, and 60 mm end distance values (Norvydas et al. 2005). Likewise, another study showed that the strength values were lower for end distances for 30 and 90 mm than the one of end distance for 60 mm (Simek et al. 2010). In our study, it was observed that the strength was increased by decreasing end distances. This observation shows similarity to the previous studies (Ho and Eckelman 1994; Norvydas et al. 2005; Albin et al. 1987).
Fig. 7: Typical failures on the edges of face members.

212
WOOD RESEARCH
Failures of materials occurred mostly in the holes of the blugs and dowels on the edges of the face members, and some in the cam holes of butt members as seen in Fig. 7. As it would be expected, these joint failures could be due to the location of face member in construction that is very close to the end of the edge.
Artificial neural network It was decided that the 0.005 targeted MSE values would be sufficient for the training of
the artificial neural networks. When the MSE of the ANN training process reached 0.005, the training was terminated, and the change of f low and stability were modeled with the obtained network parameters. The amounts of error variation depending on the iteration of the selected ANNs are shown in Fig. 8 for moment. The number of epochs after which the training model was stopped was 100. Fig. 9 shows the relationship between the real values and calculated values obtained using the prediction model. The comparative plot of these values is given in Fig. 10.
Fig. 8: A plot of error variation depending on the iteration of the ANN.
Fig. 9: The relationship between experimental results and ANN predicted results for bending moment capacity.
Fig. 10: The comparison of the real and calculated values for bending moment capacity.
The regression curves of the output variables for the experiment and ANN data sets are shown in Figs. 4 and 5. The values of R2 in the testing set are 0.94 for moment, which indicates that the network obtained explains at least 0.94 % of the observed data. This value supports the applicability of using ANNs in the present study.
MAPE and RMSE were used to evaluate the performance of the proposed ANN. The MAPE was 1.74 % for moment in training, and 6.71 % for moment in testing. MAPE and RMSE results are shown in Tabs. 2 and 3. The comparative plot of outcomes of the ANN modeling and the experimental results for the moment are shown in Figs. 7 and 8. Close examination reveals

213
Vol. 59 (1): 2014
that the fits were quite reasonable.The results are satisfactory for the moment, and meet the integrity of the ANN learning and
testing stages. As seen from the results, the ANN approach has a sufficient accuracy rate for the prediction of moment values of MCP and MCF. ANN modeling can be used for the modeling (the optimization) of moment values of MCP and MCF without needing the experimental study requiring much time and high testing costs.
Tab. 9: Optimization of moment values according to different lengths of specimens and end distances of the MCP and MCF.
Length of specimen (mm)
MCP MCFEnd distances
(mm)Moment
(Nm)End distances
(mm)Moment
(Nm)320 60-36 12.66 80-80 14.99330 80-58 12.58 80-58 14.96340 70-46 9.76 80-68 14.96350 60-44 8.41 80-78 14.96360 50-22 16.49 50-22 17.22370 50-32 15.50 50-32 18.46380 60-32 15.44 60-32 21.22390 60-42 15.78 60-42 24.38400 60-52 16.56 70-42 27.91410 70-52 16.96 70-52 30.30420 80-52 17.77 80-52 32.07430 80-62 15.36 80-62 32.91440 70-50 13.52 80-72 33.28450 80-50 14.08 50-48 17.05460 80-80 13.58 50-26 18.76470 80-70 14.40 50-36 19.21480 60-36 12.70 80-80 20.73490 60-46 11.59 80-58 23.77500 70-46 11.40 80-68 26.94510 50-44 12.44 80-78 29.58520 50-22 13.04 60-44 18.99530 60-54 13.22 60-54 18.40540 60-32 12.24 70-54 17.66550 50-20 29.71 50-20 31.37560 50-30 27.78 50-30 31.09570 60-30 27.43 50-40 30.83580 60-40 25.19 50-50 30.60590 50-28 26.77 50-28 32.63600 50-38 23.56 50-38 32.30
The ANN can be used for optimization. For example, the optimization of the boring plans for MCP and MCF can be carried out through an analysis of the evaluated network response. The intermediate values not obtained from the experimental study were predicted by the designed ANN modeling. The highest moment values of MCP and MCF predicted by the ANN model for different length of specimen (mm) and end distances (mm) are given in Tab. 9.
Maximum values were obtained when the lower front end distances for MCP, and both the

214
WOOD RESEARCH
lowest and highest front end distances for MCF were determined. This could be a result of using both end distances and moment values for each specimen length together.
CONCLUSIONS
Generally, in both MCP and MCF, the biggest moment values based on length of specimen were obtained with the same end distance. In this regard, providing adequate resistance for the two types of boards in furniture construction can be suggested for the implementation of the same boring plans. The MCF corner joints obtained stronger values than the MCP corner joints. Accordingly, using MCF can be considered as appropriate in furniture manufacturing which has sensitivity to resistance. If higher resistance on furniture is not needed, MCP can be used.
According to the evaluation of the moment values of the lengths of specimens, these moment values were improved by increasing the length of the specimen. Thus, the effect of specimen size dimensions can be named as an important factor. The test results showed that bending moment capacity was decreased by increasing the end distance. The proposed ANN model yielded adequately sensitive results with 6.71 % MAPE for testing set of moment values. Depending on all this, the results obtained with ANN can be suggested for use in this type of furniture application.
For future studies, to determine and analyze joint moment capacity, the standard distances of dowels (first and last) between cam fasteners on different furniture member lengths might be considered as 64 and 96 mm instead of 32 mm. Some studies are needed to determine the interaction among furniture member size, fasteners, front and back end distances and boring machines.
REFERENCES
1. Albin, R., Müller, M., Scholze, H., 1987: Investigations on the strength of corner joints in case- type furniture. Holz als Roh-und Werkstoff 45(5): 171-178.
2. ASTM D 1037-06a, 2006: Standard test methods for evaluating properties of wood-base fiber and article panel materials.
3. Bechmann, G., Hassler, W., 1975: The strength of various furniture construction their component and fasteners. Part I. Die Festigkeit von verschiedenen Mobelkonstruktionen ihren Elementen und Verbindungsmitteln. Holztechnologie 6(4): 210-221.
4. Ceylan, I., 2008: Determination of drying characteristics of timber by using artificial neural networks and mathematical models. Drying Technology 26(12): 1469-1476.
5. Eckelman, C.A., 2003: Textbook of product engineering and strength design of furniture.Purdue Univ., West Lafeyette, IN, 99 pp.
6. Efe, H., 1998: Rational dowel design for furniture corner joints in case construction. Journal of Politeknik 1(1/2): 41-54 (in Turkish).
7. Güntekin, E., 2002: Experimental and theorical analysis of the performance of ready-to -assemble (RTA) furniture joints constructed with medium density fiberboard and particleboard using mechanical fasteners. Doctor Thesis, State University of New York, USA.
8. Ho, C.L., Eckelman, C.A., 1994: The use of performance tests in evaluation joint and fastener strength in case furniture. Forest Products Journal 44(9): 47-53.
215
Vol. 59 (1): 2014
9. Liu, W.Q., Eckelman, C.A., 1998: Effect of number of fasteners on the strength of corner joints for cases. Forest Products Journal 48(1): 93-95.
10. Malkoçoğlu, A., Yerlikaya, N.C., 2012: Boring plans and applications in the furniture production. Furniture and Decoration Magazine, March-April, Turkey; 109: 48-58 (in Turkish).
11. Norvydas, V., Juodeikiene, I., Minelga, D., 2005: The influence of glued dowel joints construction on the bending moment resistance. Materials Science 11(1): 36-39.
12. Özşahin, S., 2012: The use of an artificial neural network for modeling the moisture absorption and thickness swelling of oriented strand board. BioResources 7(1): 1053 -1067.
13. Oztemel, O., 2006: Artificial neural network. Second edition, Papatya Publishing, Istanbul. Pp 75-106 (in Turkish).
14. Rajak, Z., Eckelman, C.A., 1996: Analysis of corner joints constructed with large screw.Journal Tropical Forest Product 2(1): 80-92.
15. Simek, M., Haviarova, E., Eckelman, C.A., 2010: The effect of end distance and number of ready-to-assemble furniture fasteners on bending moment resistance of corner joints.Wood and Fiber Science 42(1): 92-98.
16. Tankut, A.N., 2005: Optimum dowel spacing for corner joints in 32-mm cabinet construction. Forest Products Journal 55(12): 100-104.
17. TS 4539, 1985: Wood joints-rules of dowel joints.18. Zhang, J., Eckelman, C.A., 1993: Rational design of multi-dowel corner joints in case
construction. Forest Products Journal 43(11-12): 52-58.
Abdulkadir Malkoçoğlu Karadeniz Technical University
Faculty of Forest Industry Engineering61080 Trabzon
TurkeyCorresponding author: [email protected]
Nurdan Çetin YerlikayaYalova University
Art and Design Faculty 77100 Yalova
Turkey
Şükrü ÖzşahinKaradeniz Technical University
Faculty of Technology 61830 Trabzon
Turkey

216
WOOD RESEARCH