
Eva Björkner
14
Eva Björkner Helsinki University of Technology Laboratory of Acoustics and Audio Signal Processing HUT, Helsinki, Finland KTH – Royal Institute of Technology TMH – Department of Speech, Music and Hearing Stockholm, Sweden
-
Upload
rudolpho-calvey -
Category
Documents
-
view
24 -
download
1
description
Eva Björkner. Helsinki University of Technology Laboratory of Acoustics and Audio Signal Processing HUT, Helsinki, Finland. KTH – Royal Institute of Technology TMH – Department of Speech, Music and Hearing Stockholm, Sweden. Analysis of voice production. Vocal tract (VT) Larynx ventricle - PowerPoint PPT Presentation
Transcript of Eva Björkner

Eva Björkner
Helsinki University of TechnologyLaboratory of Acoustics and Audio Signal ProcessingHUT, Helsinki, Finland
KTH – Royal Institute of TechnologyTMH – Department of Speech, Music and HearingStockholm, Sweden
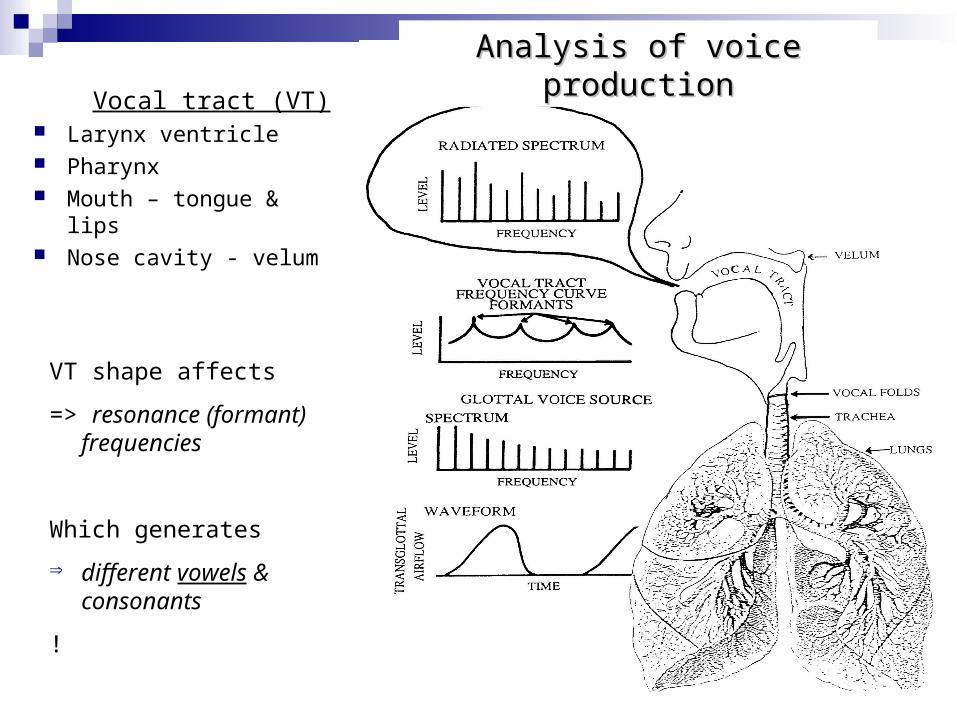
Vocal tract (VT) Larynx ventricle Pharynx Mouth – tongue & lips Nose cavity - velum
VT shape affects
=> resonance (formant) frequencies
Which generates
different vowels & consonants
!
Analysis of voice productionAnalysis of voice production

Keywords: voice source characteristics inverse filtering formant frequencies the effect of subglottal pressure variation on the voice
source AND..
The Normalized Amplitude Quotient NAQ (Alku et al. The Normalized Amplitude Quotient NAQ (Alku et al. 2002) - for what purposes can it be used?2002) - for what purposes can it be used?
My research:My research: Analysis of voice production in the singing voice

Speech: you decide
when to breathe pitch voice quality loudness
Singing – the music decides!
Entails demand for control of
breathing behaviour Ps
pitch voice quality
Glottal excitation estimation during singing is very challenging because of the wide ranges between extremes:
• from very low to extremely high pitches (Hz)
• from extremely loud to very soft phonations (dB)
• voice qualities – hypo-/hyper functional etc
• registers – differences in vocal fold vibratory pattern

Sound ProductionSound Production
Contraction of expiratory muscles
Rise in subglottic air pressure Escape through glottis Closure
Bernoulli effect elasticity
The voice The voice sourcesource
The pulsating air The pulsating air through the glottisthrough the glottis

Mask or microphone recordings
Flow (Rothenberg mask)
Audio
TEAC Multi channel digital recorder
Oral pressure
EGG

Flow glottogram Flow glottogram parametersparameters (Time-based & amplitude-based)
Differentiated flow glottgram
0 0,002 0,004 0,006 0,008 0,01 0,012
Time [s]
Flo
w
0 0,002 0,004 0,006 0,008 0,01 0,012
Time [s]
Flo
w
Peak-to-peak pulse Amplitude
[Up-t-p]Time [T0]
Derivative [MFDR]
Closed phase
Ûp-t-p
(MFDR*T0)
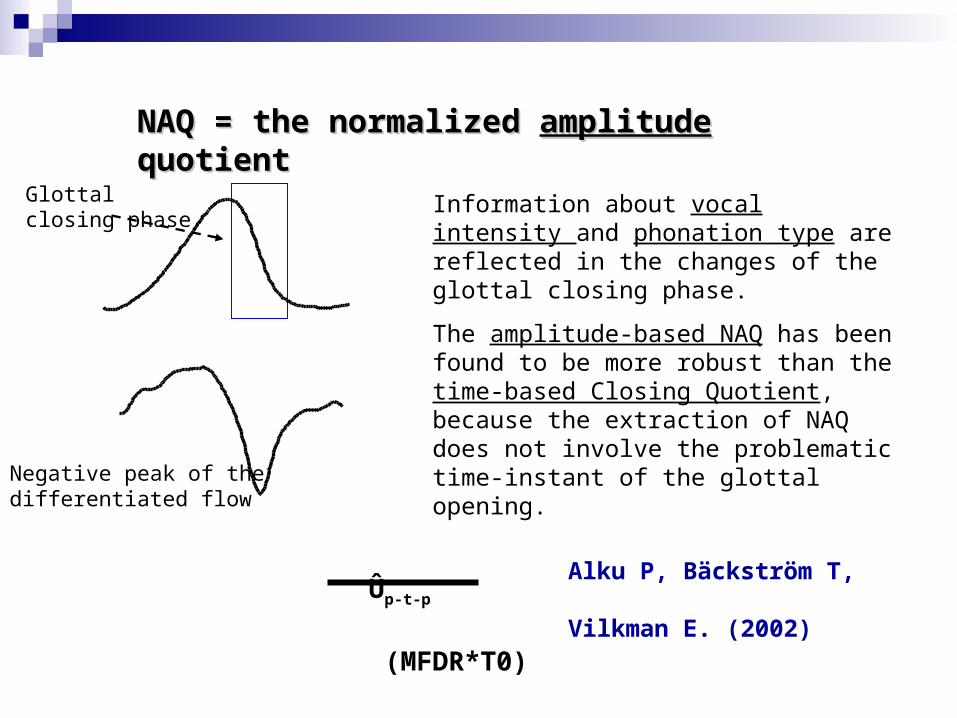
NAQNAQ = = the normalized the normalized amplitudeamplitude quotientquotient
Negative peak of the differentiated flow
Glottal closing phase
Information about vocal intensity and phonation type are reflected in the changes of the glottal closing phase.
The amplitude-based NAQ has been found to be more robust than the time-based Closing Quotient, because the extraction of NAQ does not involve the problematic time-instant of the glottal opening.
Alku P, Bäckström T, Vilkman E. (2002)
Voice Source Differences Between Voice Source Differences Between RegistersRegisters In Female Musical Theatre In Female Musical Theatre SingersSingers Björkner E, Sundberg J, Cleveland T & Stone R. E. Björkner E, Sundberg J, Cleveland T & Stone R. E.
accepted for publication in J.Voice
High subglottal pressures are known to jeopardize vocal health in both speech and singing
• Analysis: voice source and subglottal pressure Ps characteristics of the chest and head register in the female voice.
• studied by inverse filtering
• a sequence of /pae/ syllables sung at constant pitch and decreasing vocal loudness in each register by seven female musical theatre singers
• ten equidistantly spaced Ps values were selected and the relationships between Ps and several parameters were examined
Aim: Better understanding of register function in female singing voice

Ps [cmH2O]
0
5
10
15
20
25
Mea
n ac
ross
cle
ar c
ases
ChestHead
NAQ
0,00
0,05
0,10
0,15
0,20
0,25
0,30
Mean a
cross
cle
ar
case
s
Means across Clear Samples
=> RegisterRegister differences
Control Control parameterparameter
Qclosed [% ]
0
5
10
15
20
25
30
35
40
45
Mea
n ac
ross
cle
ar c
ases
MFDR [l/ s2]
-350
-300
-250
-200
-150
-100
-50
0
Mean a
cross
cle
ar
case
s
Glottogram Glottogram parametersparameters
0
5
10
15
20
25
30
MAR COX CIE SUB
Qcl
osed
[%]
-50
-40
-30
-20
-10
MAR COX CIE SUB
Soun
d le
vel [
dB]
chesthead
0.00
0.05
0.10
0.15
0.20
0.25
0.30
MAR COX CIE SUB
NA
Q
MAR COX CIE SUB-250
-200
-150
-100
-50
0
MFD
R[l
/s2]
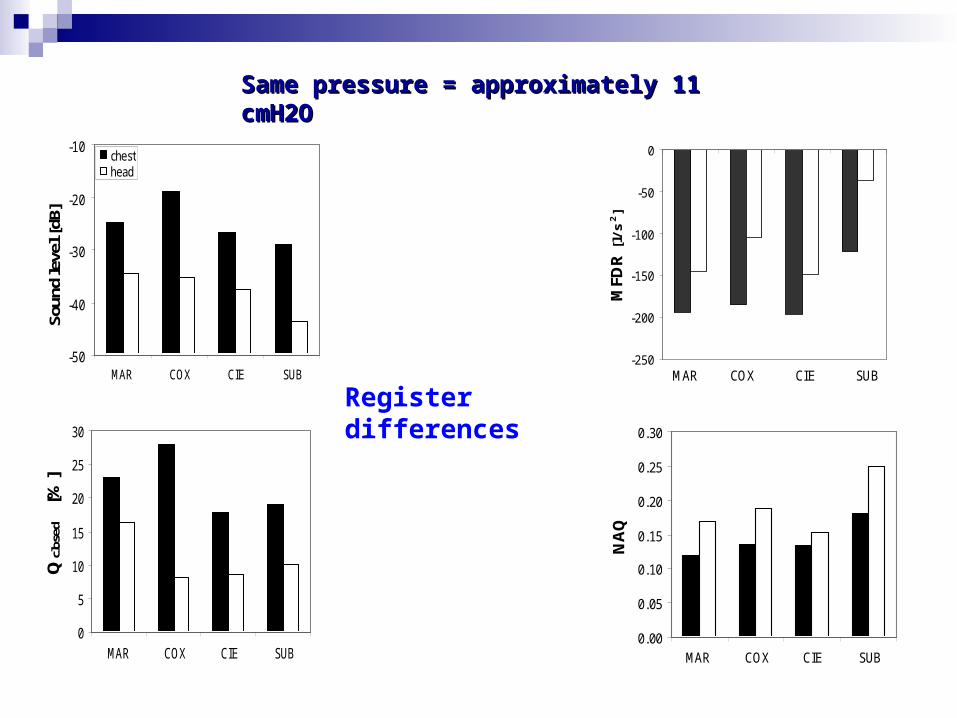
Same pressure = approximately 11 cmH2OSame pressure = approximately 11 cmH2O
Register differences

NAQ variation with Ps in Classically Trained Baritone Singers
Björkner E, Sundberg J & Alku P
NAQ high&low
0.00
0.05
0.10
0.15
0.20
0.25
0.30
0.35
0.40
0 10 20 30 40 50 60
True Ps
NAQ
LArv2
LoFa
KMF
IW
PM
Filled symbols= ~139 Hz
Open symbols= ~278 Hz

NAQ & Qclosed
0.00
0.05
0.10
0.15
0.20
0.25
0.30
0.35
0.40
0 10 20 30 40 50 60 70Qclosed
NAQ
LArv2 LoFaKMFIWPM
NAQ & MFDR
0.00
0.05
0.10
0.15
0.20
0.25
0.30
0.35
0.40
0 500 1000 1500 2000 2500 3000 3500 4000
MFDR
NAQ
LArv2
LoFa
KMF
IW
PM

Articles on their way:Articles on their way:
“NAQ variation with Ps in Classically
Trained Baritone Singers”
Björkner E, Sundberg J & Alku P
“Comparison of two inverse filtering methods for determining NAQ and closing quotient - Voice source characteristics in different phonation types”
Lehto L, Airas M, Björkner E, Alku P
Articles accepted for publication in Articles accepted for publication in the Journal of Voice:the Journal of Voice:
“Voice source differences Between Registers in Female Musical Theatre Singers”
Björkner E, Sundberg, Cleveland T & Stone R.E
“Throaty Voice Quality: subglottal pressure, voice source, and formant characteristics”
Laukkanen A-M, Björkner E & Sundberg J
An overview: the use of the NAQ paramete in voice source analysis
To be presented in Finnish-Swedish Voice meeting in Tampere 5-6 nov -04