EVA AIR 2018 Investor Conference · Firstly introduced by EVA in the airline industry, premium...
42
EVA AIR 2018 Investor Conference 2018.3.30
Transcript of EVA AIR 2018 Investor Conference · Firstly introduced by EVA in the airline industry, premium...

EVA AIR 2018 Investor Conference
2 0 1 8 . 3 . 3 0

1
Legal Disclaimer
The information contained in this presentation, including all forward-lookinginformation, is subject to change without notice, whether as a result of newinformation, further events or otherwise, and EVA Airways (the “Company”)undertakes no obligation to publicly update or revise the information contained inthis presentation.
Investors should not regard the above forward-looking information as legally bindingbut as information subject to change. No guarantees regarding the completeness,accuracy, and reliability of information contained are made explicitly or implicitly.They are not intended to represent complete statement of the Company, industryor future development.
2
2017 Business Results
1. Operating Performance
2. Operating Costs Analysis
3. Financial Risk Management
Development Trend of Airline Industry
Passenger & Cargo Business Review
Market Outlook & Strategies
Fleet
Major Affiliated Enterprises
Outline

3
2017 Business Results

Operating Performance
2017 2016 %
Group Operating Revenue
NT$ Million163,562 144,680 13.1%
Net Operating Income NT$ Million 8,695 7,130 21.9%
Profit NT$ Million 6,311 3,954 59.6%
Group profitattributable to owners of parent
NT$ Million 5,752 3,476 65.5%
Earnings Per Share NT$ 1.38 0.83 66.3%
Group Financial Statistics
2017 2016 %
Total assets NT$ Million 228,207 217,663 4.8%
Total liabilities NT$ Million 163,998 158,327 3.6%
Total equity NT$ Million 64,209 59,336 8.2%
Group Financial Position
4

Operating Performance
2017 2016 %
Operating Revenue NT$ Million 125,314 115,496 8.5%
Operating Income NT$ Million 5,943 4,961 19.8%
Profit NT$ Million 5,752 3,476 65.5%
Earnings Per Share NT$ 1.38 0.83 66.3%
EVA Financial Statistics
2017 2016 %
Total assets NT$ Million 201,146 195,750 2.8%
Total liabilities NT$ Million 143,138 142,422 0.5%
Total equity NT$ Million 58,008 53,328 8.8%
EVA Financial Position
5

Operating Costs Analysis
6
22% 21%
23% 21%
17%17%
9% 11%
9% 8%
9% 10%
6% 6%1% 1%4% 5%
0%
50%
100%
2017 2016
28% 26%
7% 9%
16% 15%
11% 13%
11% 9%
11% 12%
8% 8%1% 1%7% 7%
0%
50%
100%
2017 2016 Others
Commissions
Passenger service
Landing, parking
Lease rental
Depreciation and
amortization
Staff
Maintenance
Fuel
Group EVA

Operating Costs Analysis - Fuel Cost
2017 2016 %
Fuel average price(SIN JET)
USD/BBL 64.37 51.46 25%
Fuel consumption thousand/BBL 15,660 14,710 6%
Fuel cost NT$ Million 33,129 26,872 23%
Fuel hedging expenditure NT$ Million 361 2,007 -82%
Total fuel cost NT$ Million 33,490 28,879 16%
Fuel expenditure
Fuel hedging coverage
7
Year % Coverage
2017 17%
2018 Less than 10%
8
Financial Risk Management-Currency
The operating revenue of the Company is mainly from international passenger,cargo and postal revenue. Foreign currency income is sufficient to cover thedemand for foreign currency expenditure, which is equivalent to the effect ofNatural Hedge.
As for extra expense and demand in foreign currency due to time differences,the Company would carry out forward exchange agreement according to thetrend of foreign exchange markets to reduce risk.
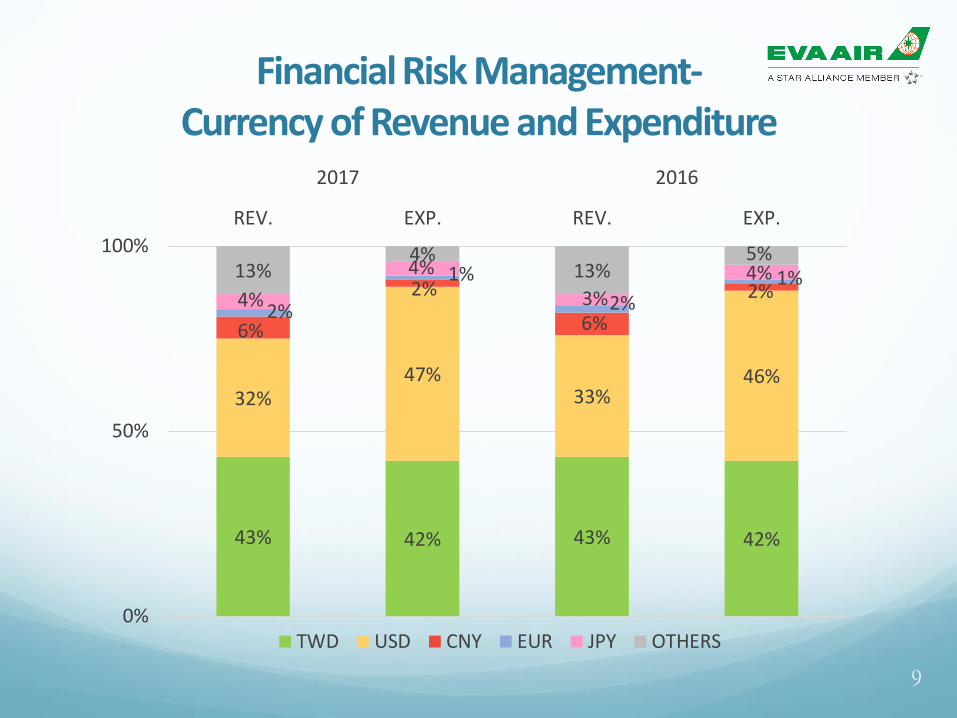
43% 42% 43% 42%
32%47%
33%46%
6%
2%
6%
2%2%
1%
2%1%
4%
4%
3%4%13%
4%13%
5%
0%
50%
100%
REV. EXP. REV. EXP.
2017 2016
TWD USD CNY EUR JPY OTHERS
Financial Risk Management-Currency of Revenue and Expenditure
9

Financial Risk Management-Cash Flow Analysis
10
(NT$ Million) 2017 2016 %
Cash and cash equivalents at the beginning of year 37,875 28,891 31%
Net cash flows from operating activities 15,942 17,719 -10%
Net cash flows from investing activities (16,187) (12,371) 31%
Net cash flows from financing activities (2,197) 3,636 -160%
Cash dividends paid (810) (1,158) -30%
Net increase (decrease) in cash and cash equivalents (2,442) 8,984 -127%
Cash and cash equivalents at the end of period 35,433 37,875 -6%

Profit and Net Debt/Equity Ratio
11
655 747
(1,307)
6,436
3,476
5,752
3.02 2.89
3.40
2.61 2.67 2.47
2.00
2.50
3.00
3.50
4.00
-2,000
-
2,000
4,000
6,000
2012 2013 2014 2015 2016 2017
D/E
RA
TIO
(T
IME
S)
PR
OF
IT/(
LOS
S)
NT$ Million
Development Trend of Airline Industry
13

14
Passenger Capacity Trend Global vs. Asia Pacific
Capacity worldwide trended upwards at a stable rate since year 2011. Asia Pacific posted slightly
faster growth than worldwide with similar trend.
EVA posted double-digit growth during year 2014-2017, faster than average of worldwide and Asia
Pacific.
Source :IATA&AAPA
% ASK Growth
5.9 6.6
4.0 4.8 5.5 6.7 7.5
6.3 5.7
4.1
7.0
5.3
7.1 7.4 8.4
9.9 8.3
6.8
1.1
4.0
6.4 6.1
12.3 11.8
17.2
14.5
3.3
0.0
5.0
10.0
15.0
20.0
2010 2011 2012 2013 2014 2015 2016 2017E 2018F
Global YoY Asia-Pacific YoY BR YoY

15
Cargo Capacity Trend Global vs. Asia Pacific
Worldwide and Asia Pacific capacity remain similar upward trend. Before 2017, global
posted slightly faster growth than Asia Pacific.
In line with growing passenger fleet, EVA shrank cargo fleet by plan to reduce capacity
that rebound in 2018 with the deployment of 777 freighters.
Source :IATA&AAPA
% AFTK Growth
6.1 3.0 3.7
5.7 6.0 6.6
3.0 0.1
(3.2)
1.1 4.1 3.5 3.5
4.4 6.8
(3.6)
(9.9)
(3.4)
(7.7)(7.8)
(2.0)(2.7)
6.5
(15.0)
(10.0)
(5.0)
0.0
5.0
10.0
2011 2012 2013 2014 2015 2016 2017E 2018F
Global YoY Asia-Pacific YoY BR YoY
16
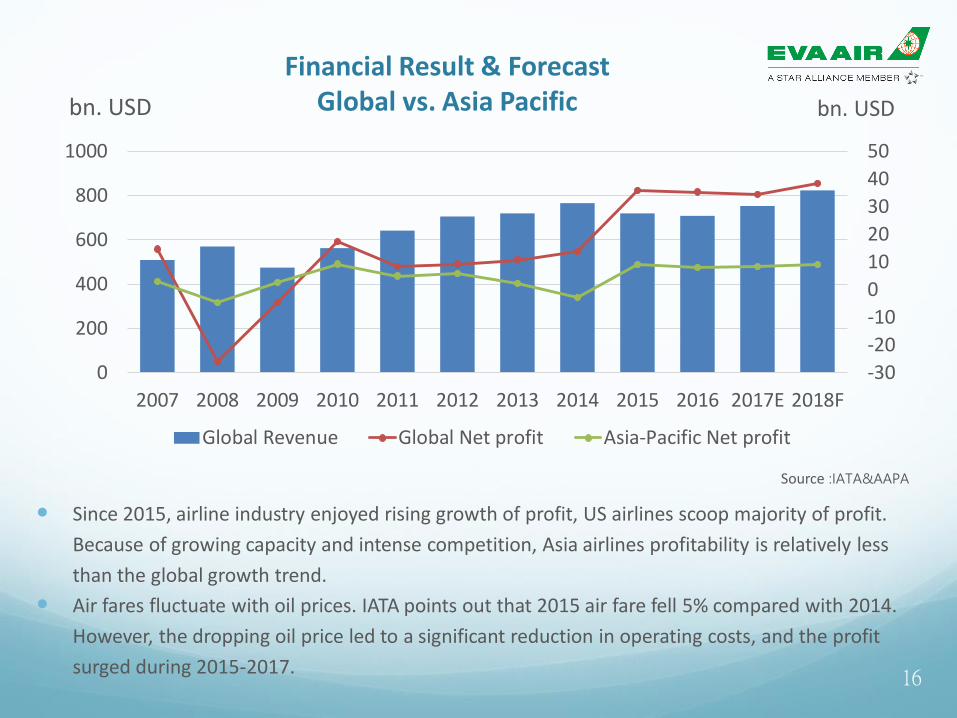
Financial Result & ForecastGlobal vs. Asia Pacific
Since 2015, airline industry enjoyed rising growth of profit, US airlines scoop majority of profit.
Because of growing capacity and intense competition, Asia airlines profitability is relatively less
than the global growth trend.
Air fares fluctuate with oil prices. IATA points out that 2015 air fare fell 5% compared with 2014.
However, the dropping oil price led to a significant reduction in operating costs, and the profit
surged during 2015-2017.
Source :IATA&AAPA
-30
-20
-10
0
10
20
30
40
50
0
200
400
600
800
1000
2007 2008 2009 2010 2011 2012 2013 2014 2015 2016 2017E 2018F
bn. USD
Global Revenue Global Net profit Asia-Pacific Net profit
bn. USD

Airline Industry Development Trend (I) In line with global fleet expansion, both supply and demand grow in passenger and
cargo.
New generation aircraft model with highly efficient performance, accelerates the development of long-haul direct flights.
Deepening airline partnerships to improve competitiveness.
Full-service airlines continue to enhance facilities and services to secure premium market.
Firstly introduced by EVA in the airline industry, premium economy class becomes the mainstream product.
To compete with LCC, full-service airlines incorporate low-cost business model into service lineup.
Full-service airlines start providing customer-made ancillary service.
Low cost carriers start constructing network, entering long-haul service and building up alliance.
17

Airline Industry Development Trend (II)
Belly capacity in passenger aircraft posts faster growth and the cargo volumecontinues to increase.
In line with new retail sales model, the share from e-commerce continues to grow.
In addition to traditional air cargo service, extended value-added service is providedto meet demand of integrated logistics.
Airport automation and self-served services enhance traveling experience.
Congestion at major airports is affecting network expansion and operation efficiency.
18

Passenger & Cargo Business Review
19

Passenger Traffic
2017 2016 17 VS 16 2015
Passenger Revenue(NTD 100M)
924 859 7.7% 819
ASK(100M Kilometer)
586 512 14.5% 436
Passenger Number(10 thousand)
1,213 1,124 7.9% 1,007
Yield (NTD) 2.02 2.10 (3.8%) 2.32
Load Factor (%) 78.3% 80.0% (1.7pp) 80.8%
20
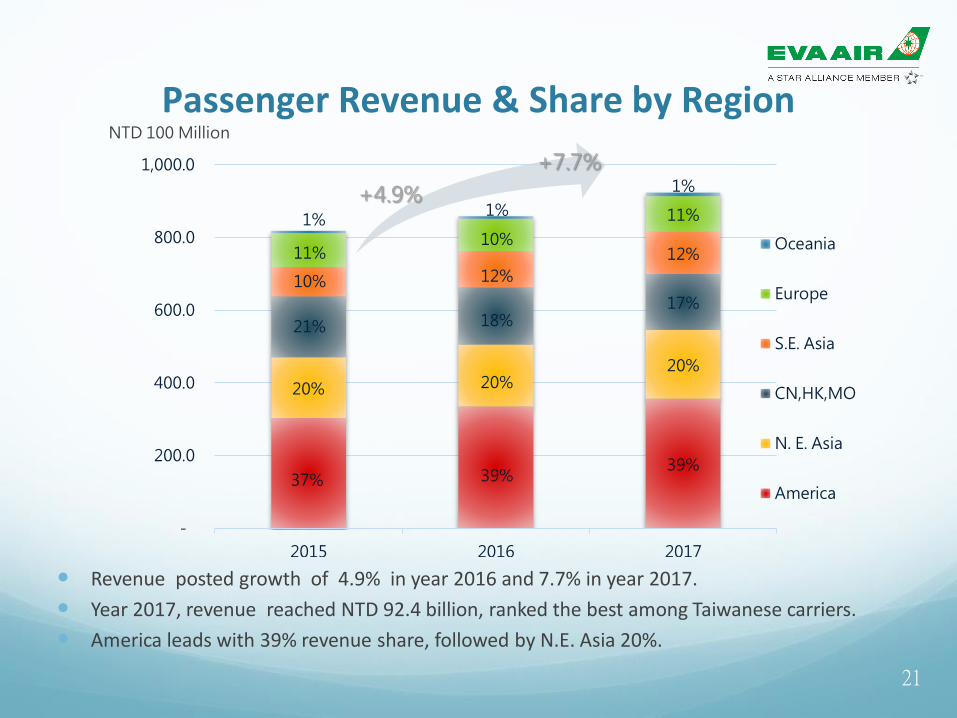
Passenger Revenue & Share by Region
Revenue posted growth of 4.9% in year 2016 and 7.7% in year 2017.
Year 2017, revenue reached NTD 92.4 billion, ranked the best among Taiwanese carriers.
America leads with 39% revenue share, followed by N.E. Asia 20%.
21
37% 39%39%
20% 20%20%
21% 18%17%
10% 12%
12%11%10%
11%1%1%
1%
-
200.0
400.0
600.0
800.0
1,000.0
2015 2016 2017
Oceania
Europe
S.E. Asia
CN,HK,MO
N. E. Asia
America
NTD 100 Million
+4.9%
+7.7%
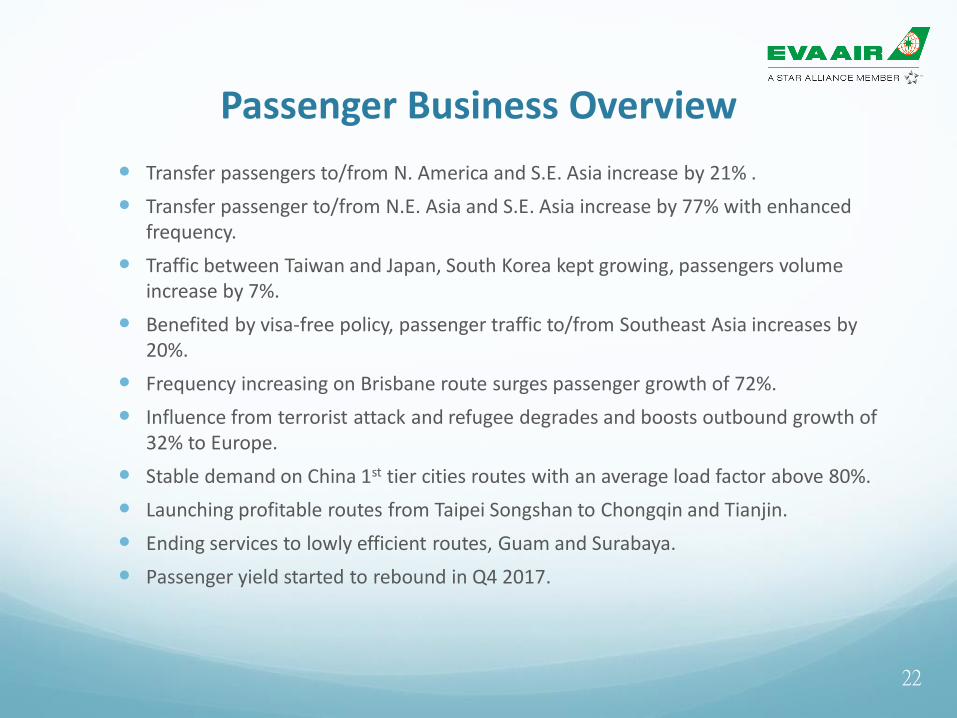
Passenger Business Overview
Transfer passengers to/from N. America and S.E. Asia increase by 21% .
Transfer passenger to/from N.E. Asia and S.E. Asia increase by 77% with enhanced frequency.
Traffic between Taiwan and Japan, South Korea kept growing, passengers volume increase by 7%.
Benefited by visa-free policy, passenger traffic to/from Southeast Asia increases by 20%.
Frequency increasing on Brisbane route surges passenger growth of 72%.
Influence from terrorist attack and refugee degrades and boosts outbound growth of 32% to Europe.
Stable demand on China 1st tier cities routes with an average load factor above 80%.
Launching profitable routes from Taipei Songshan to Chongqin and Tianjin.
Ending services to lowly efficient routes, Guam and Surabaya.
Passenger yield started to rebound in Q4 2017.
22
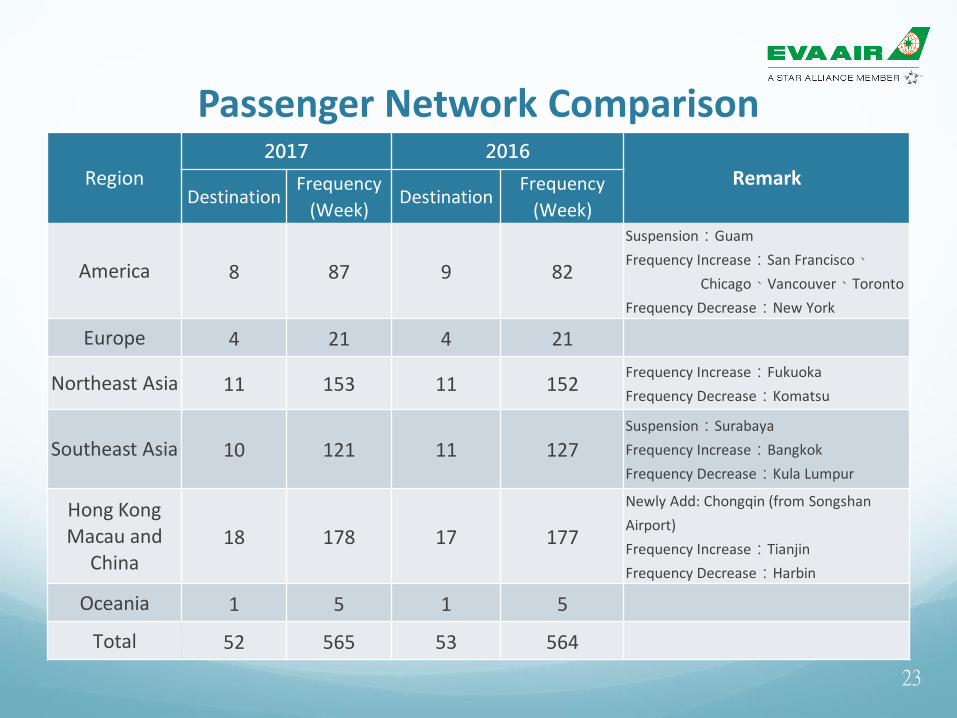
Passenger Network Comparison
Region2017 2016
RemarkDestination
Frequency
(Week)Destination
Frequency
(Week)
America 8 87 9 82
Suspension:Guam
Frequency Increase:San Francisco、
Chicago、Vancouver、Toronto
Frequency Decrease:New York
Europe 4 21 4 21
Northeast Asia 11 153 11 152Frequency Increase:Fukuoka
Frequency Decrease:Komatsu
Southeast Asia 10 121 11 127Suspension:Surabaya
Frequency Increase:Bangkok
Frequency Decrease:Kula Lumpur
Hong KongMacau and
China18 178 17 177
Newly Add: Chongqin (from Songshan
Airport)
Frequency Increase:Tianjin
Frequency Decrease:Harbin
Oceania 1 5 1 5
Total 52 565 53 564
23

Freight Traffic
2017 2016 17 VS 16 2015
Cargo Revenue(NTD100M)
248 222 11.9% 274
AFTK (100M kilometer)
42 43 (2.7%) 44
Cargo Volume (10 thousand ton)
64 61 5.2% 62
Yield (NTD) 6.73 6.23 8.0% 7.51
Load Factor (%) 87.9% 82.7% 5.2pp 82.8%
24

Cargo Revenue & Share by Region
Year 2017, revenue increased by 11.9% YOY owing to the recovery of cargo volume and yield.
America leads with an average more than 65% of total revenue share in recent 3 years.
Major revenue generated from belly cargo of passenger aircraft with share of 56% (year 2017) vs.
39% (year 2015).25
69%
67%65%
22%
23%
25%
9%
10%
10%
0%
0%
0%
-
50.0
100.0
150.0
200.0
250.0
300.0
2015 2016 2017
Oceania
Europe
Asia
America
+11.9%
NTD 100 Million

Operating 13 flights/week to America and 21 flights/week to Asia.
Volume and revenue increase by 3.6% and 11.9% respectively while capacity reduces by
2.7% compared to year 2016.
Both volume and yield soar and load factor exceeds 90% in America routes.
Capacity increases by 11.8% with almost full loading in Europe routes.
Freight yield rebounds from the bottom and increases by 8.0% YOY.
The deployment of Boeing 777 freighter has improved flight dispatch rate and operating
efficiency.
26
Cargo Business Overview

Region
2017 2016
RemarkDestination
Frequency
(Week)Destination
Frequency
(Week)
America 6 13 6 13Including technical landing
station in Anchorage.
Southeast Asia
4 7 4 7
Hong KongMacau and
China4 14 4 14
Total 14 34 14 34
27
Freighter Network Comparison

Market Outlook & Strategies
28

Passenger Market Outlook
Global economic growth forecast has been revised upward to 3.9% in 2018, liftingtravel demand.
OPEC continues to cut crude oil production, the risk of surging oil price may diluteoperating profit.
Transfer passenger to/from N. America and S.E. Asia grows steadily.
Relatively weak Euro and Pound Sterling encourage growth of European tourism.
Traffic between Taiwan and N.E. Asia remains upward trend, charter and extra flightsare to be arranged flexibly to meet market demand.
Passenger traffic to/from Southeast Asian countries is expected to continue growingowing to visa-free policy.
Subject to special cross-strait relationship, flexibility in aircraft type and frequency isarranged accordingly to meet market demand.
29

Passenger Market Strategies
Enhancing load factor and stabilizing declining yield trend.
Responding to market demand, increasing services in San Francisco and Vienna (direct flight), and launching Taoyuan - Chiang Mai operation.
Enhancing Star Alliance partnership, sharing resource and reducing operating costs.
Flexible fleet dispatching and scheduling to support market changes.
Diversified marketing channels and enhanced advertising campaign to increase brand recognition.
Continuing to explore time slot in congested Pudong Airport.
30

The long-standing downward trend in air cargo started to rebound from 2017owing to improved supply and demand. This upward trend is expected to continuein 2018.
New trade policy promotes American-Made products export and balances tradebetween Asia and North America.
E-commerce, IOT (Internet of Things) and artificial intelligence have become themainstream in air cargo market.
31
Cargo Market Outlook

To continue deploying highly efficient Boeing 777 freighters and the 4th 777freighter will be received by the end of 2018.
To strengthen belly cargo sales from passenger aircraft in line with its characteristicsof efficiency, frequency and punctuality.
To make more efficient use of passenger and cargo network.
To enhance sales from high yield products, such as temperature-controlled, courierand express services.
To continue collaborating with global logistics company as strategic partner.
To adjust freighter services with flexibility in response to the dynamic changes frominternational trade and moving manufacturing bases.
32
Cargo Market Strategies

Region City 2018 2017 Variance
North America 8 82 87 -5
Europe 4 24 21 +3
N.E. Asia 11 156 153 +3
S.E. Asia 11 128 121 +7
China 16 74 73 +1
HK,MO 2 105 105 0
Oceania 1 5 5 0
Total 53 574 565 +9
33
Frequency/Week
Passenger Fleet and Network
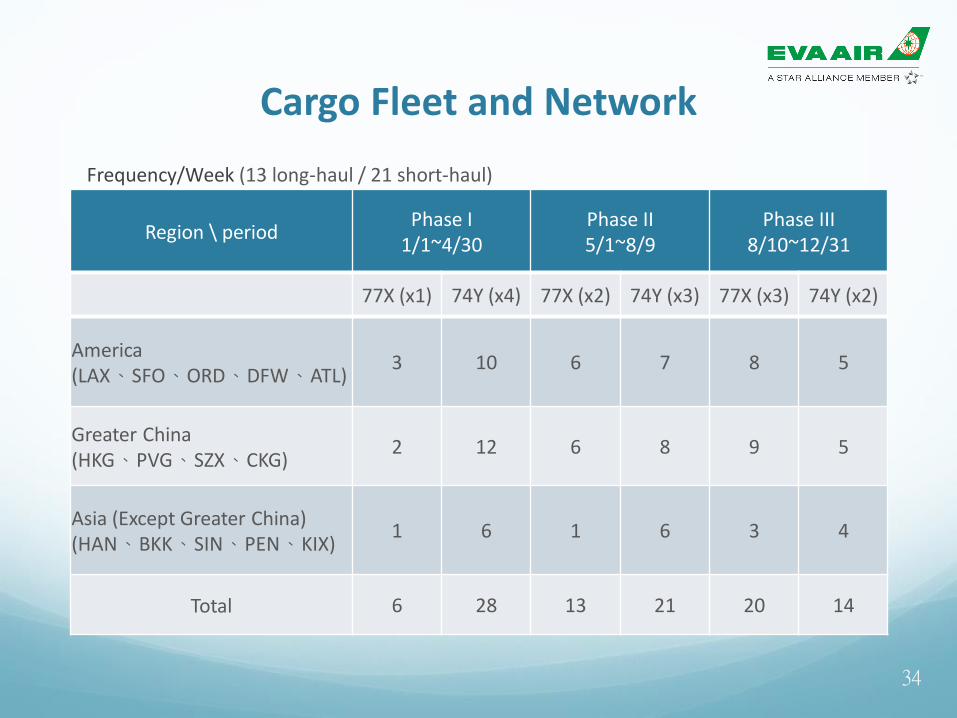
Frequency/Week (13 long-haul / 21 short-haul)
Region \ periodPhase I
1/1~4/30Phase II5/1~8/9
Phase III8/10~12/31
77X (x1) 74Y (x4) 77X (x2) 74Y (x3) 77X (x3) 74Y (x2)
America(LAX、SFO、ORD、DFW、ATL)
3 10 6 7 8 5
Greater China(HKG、PVG、SZX、CKG)
2 12 6 8 9 5
Asia (Except Greater China)(HAN、BKK、SIN、PEN、KIX)
1 6 1 6 3 4
Total 6 28 13 21 20 14
34
Cargo Fleet and Network

Fleet
35

Fleet (Year 2017)
Aircraft Type Owned Leased Total
777-300ER 20 14 34
A330-300 - 9 9
A330-200 3 - 3
A321-200 - 24 24
ATR72-600 2 - 2
777F 1 - 1
747-400F 5 - 5
Total 31 47 78
Average Passenger Fleet Age
4.2 years
36

Fleet
Aircraft Type 2018 2019 2020 ~2022
787-9 +2 +2
787-10 +4 +16
777F +3 +1
747-400F -3 -2
777-300ER -1
Continue to deploy highly efficient aircraft to reduce our fleet age and operation cost, meanwhile to enhance overall safety and quality.
37

Major Affiliated Enterprises
38

Company Name Capital EVA Share %
Evergreen Aviation Technologies Corp. NT$ 6.36 Billion 80.0%
Evergreen Aviation Precision Corp. NT$ 3.00 Billion 40.0%
Evergreen Air Cargo Services Corp. NT$ 1.20 Billion 60.6%
Evergreen Sky Catering Corp. NT$ 1.21 Billion 49.8%
Evergreen Airline Services Corp. NT$ 0.51 Billion 56.3%
EVA Flight Training Academy US$ 20 Million 100.0%
Major Affiliated Enterprises
39

Major Affiliated Enterprises (I)
Evergreen Aviation Technologies Corp.Provide aircraft maintenance, engine refurbishment and component repair procurement services.4th Hangar operated and New Engine Shop was under construction in 2017, with revenue increased by 23% YOY.World top 10 MRO (Maintenance Repair & Overhaul).
Evergreen Aviation Precision Corp.Aerospace parts manufacturing and assembling service provider.Receive order of GE engine “PP20” components and Boeing 767 Rigid Cargo Barriers.
Evergreen Air Cargo Services Corp.Provide air cargo import, export, and transfer of goods, clearance and warehousing services.Handling capacity reached a record high of 670,000 tons with market share of 30.2% in 2017.
40

Major Affiliated Enterprises (II)
Evergreen Sky Catering Corp.Provide in-flight meal service in Taoyuan and Taipei airport.Year 2017, number of meal service reached 13.81 million, up 10%.2nd factory is expected to operate in the second quarter of 2018 with the daily supply of meals up to 60,000 servings.
Evergreen Airline Services Corp.Provide ground handling services at Taoyuan, Taipei, Kaohsiung and Taichung airports.Year 2017, ground handling operation reached 73,324 aircrafts, up 9.7%.New laundry factory is expected to operate in the second quarter of 2018.
EVA Flight Training AcademyMay 2013, established in California, with 9 brand new training aircrafts.Stylish training facilities with capability of training 80 cadets per year.Training for other airlines’ pilot in addition to self-trained pilot.
41

Thank YouQ & A
42