EU’S ENERGY PRODUCTION IN YEAR 2030 FOCUS IN SCENARIOS ...
61
LAPPEENRANTA-LAHTI UNIVERSITY OF TECHNOLOGY LUT Faculty of Technology Energy Technology Vesa Korjula EU’S ENERGY PRODUCTION IN YEAR 2030 – FOCUS IN SCENARIOS, BIOMASS AND SOLAR POWER Inspectors of Thesis: Professor Esa Vakkilainen Research Assistant Kari Luostarinen
Transcript of EU’S ENERGY PRODUCTION IN YEAR 2030 FOCUS IN SCENARIOS ...

LAPPEENRANTA-LAHTI UNIVERSITY OF TECHNOLOGY LUT
Faculty of Technology
Energy Technology
Vesa Korjula
EU’S ENERGY PRODUCTION IN YEAR 2030 –
FOCUS IN SCENARIOS, BIOMASS AND SOLAR POWER
Inspectors of Thesis: Professor Esa Vakkilainen
Research Assistant Kari Luostarinen

ABSTRACT
Vesa Korjula
EU’ Energy Production in EU in Year 2030 – Focus in scenarios, Biomass and Solar
Power
Energy Technology
Lappeenranta 2020
Master’s Thesis, Energy Economics. Lappeenranta-Lahti University of Technology
LUT
56 pages, 12 tables and 47 figures
Keywords: energy, future, scenario, EU, solar, biomass, sustainability
This master's thesis focuses on scenario modellings of five different organizations.
Very widely discussed topics in energy business, biomass and solar energy are also in
focus in the thesis. In the future it will become more and more important to make sure
that in energy production of biomass it is mainly used residues and not logs. In solar
energy focus is on solar power. Technology development of solar power has taken
quite huge steps mainly because assisting political actions in China and Germany.
Solar power has wider possibilities for usage than for example thermal solar energy
production. Solar power technology will in the future quite rapidly take steps from
laboratory knowledge to commercial applications.

YHTEENVETO
Vesa Korjula
EU:n energiantuotanto vuonna 2030 – Keskittyen skenaarioihin, biomassaan ja
aurinkosähköön
Energy Technology
Lappeenranta 2020
Diplomityö, Energiatalous, Lappeenrannan-Lahden teknillinen yliopisto LUT
56 sivua, 12 taulukkoa ja 47 kuvaa
Avainsanat: energia, tulevaisuus, skenaario, EU, aurinko, biomassa, kestävyys
Tämä diplomityö keskittyy viiden eri organisaation skenaariomallinnuksiin. Tutkielmassa
keskitytään myös energia-alalla erityisesti puhutteleviin biomassaan ja aurinkoenergiaan.
Tulevaisuudessa on yhä tärkeämpää varmistaa, että biomassan energiantuotannossa
käytetään pääasiassa tähdeainesta eikä runkopuuta. Aurinkoenergiassa keskitytään
aurinkoenergiaan. Aurinkosähköteknologia ottanut kehitysaskeleita sekä kaupalliset
markkinat ovat kehittyneet nopeasti Kiinan ja Saksan aktiivisilla poliittisilla toimilla.
Aurinkosähköllä on laajemmat markkinamahdollisuudet kuin esimerkiksi aurinkoenergian
lämpötuotannolla. Aurinkoenergiateknologiassa on tulevaisuudessa kehitysaskeleita
edessä, kun parempia teknisiä ratkaisuja laboratoriosta tulee kaupallisiin sovelluksiin.

FOREWORD
Technical progress and development interested me as a theme. I am especially attracted
to the issues in the energy field, which kind of new technology solutions will appear,
ways to forward them, which kind of barriers there are and some political issues. The
whole energy business field is also under transition, which is also very interesting. The
EU area is a very interesting combination of different kind of people and nations. As a
field for research the EU is quite a unique economic union and political leaders are in
Brussel, Belgium. EU has a reputation as a climate leader in global scale and it has an
opportunity to be an example to other countries as which kind of trading system is
useful and effective to deal with climate change. For example, this has influenced
politicians in California, United States and China to build up their own Emission
Trading Systems. (Reuters, 2020)
This master's thesis focuses on scenario modellings of five different organizations.
Very widely discussed topics in energy business, biomass and solar energy are also in
focus in the thesis. From historical perspective biomass-based sources are quite
commonly used for energy production especially in Finland, Sweden, Germany and
Denmark. Nowadays, biomass resources shipment routes are from one continent to
another. It will become more and more important to make sure that in energy
production of biomass it is mainly used residues and not logs.
In solar energy focus is on solar power. Technology development of solar power has
taken quite huge steps mainly because assisting political actions in China and
Germany. Solar power has wider possibilities for usage than for example thermal solar
energy production. The potential market is quite narrow for the thermal solar energy
production, especially in countries, where it is cold a large part of a year and where is a
need for heating buildings, for example in North Europe. Solar power technology will
in the future quite rapidly take steps from laboratory knowledge to commercial
applications. At present the efficiency of the solar panels in the commercial market is
about 15-20%, whereas the efficiency in laboratory is about 35-50% (Wikipedia, 2020)

5
TABLE OF CONTENTS
1 INTRODUCTION .......................................................................................................................... 9
2 ENERGY CONSUMPTION IN THE WORLD ........................................................................ 10
2.1 Energy consumption statistics in the year 2017 ...................................................................11
2.2 The World’s TOP 30 and EU-28 .........................................................................................12
2.3 Renewable energy’s shares ..................................................................................................15
2.4 Renewable energy sources and electricity network .............................................................15
2.5 Restrictions, consumption and production daily and seasonal varieties ..............................15
2.6 Smart grids ...........................................................................................................................20
3 FUTURE SCENARIOS AND POLITICS .................................................................................. 22
3.1 Kyoto Protocol and the United Nations ...............................................................................22
3.2 IEA – International Energy Agency ....................................................................................23
3.3 WEC – World Energy Council ............................................................................................26
3.4 Royal Dutch Shell – International Oil Corporation .............................................................26
3.5 EREC – European Renewable Energy Council and Greenpeace ........................................26
3.6 Germany’s Energy Revolution ............................................................................................32
4 BIOMASS – WOOD, WASTE .................................................................................................... 36
4.1 Production technology and development, different raw materials ......................................38
4.2 Supply: transport, logistics, raw materials, sustainability ...................................................40
4.4 Supports, politics, taxes, prices, different raw materials .....................................................42
4.6 Future Outlooks ...................................................................................................................42
5 SOLAR POWER ........................................................................................................................... 45
5.1 Production, lifetime, efficiency ...........................................................................................48
5.2 Cost of constructions, supports, politics, R&D ...................................................................50
5.3 Future Outlooks ...................................................................................................................51
6 FUTURE PROSPECTS AND FORESIGHT ............................................................................. 53
7 CONCLUSIONS ........................................................................................................................... 56
SOURCES ......................................................................................................................................... 57

6
AEBIOM European Biomass Association
BICGT biomass internal combustion gas turbine
BIGCC biomass internal gasification combined cycle
bio-SNG bio synthetic natural gas
BECCS bioenergy carbon capture and storage
BRIC Brazil, Russia, India and China
CCS carbon capture and storage
CCU carbon capture and utilization
CHP combined heat and power
CO2 carbon dioxide
CSP concentrated solar power
EGEC European Geothermal Energy Council
EPIA European Photovoltaic Industry Association
EREC European Renewable Energy Council
EREF European Renewable Energies Federation
ESHA European Small Hydropower Association
ESTELA European Solar Thermal Electricity Federation
ESTIF European Biomass Industry Association
ETBE ethyl tertiary butyl ether
ETP Energy Technology Perspectives, IEA’s scenario
EU European Union
EUBIA European Biomass Industry Association
EUREC Agency European Association of Renewable Energy Research Centres
EU-12 European Union member states joined after 2004 (excluding
Croatia): Bulgaria, Cyprus, Czech Republic, Estonia, Hungary,
Latvia, Lithuania, Malta, Poland, Romania, Slovenia, Slovak
Republic
EU-15 European Union member states before the 2004 enlargement:
Austria, Belgium, Denmark, Finland, France, Germany, Greece,

7
Ireland, Italy, Luxembourg, Netherlands, Portugal, Spain,
Sweden, United Kingdom
EU-27 European Union countries before July 2013: Austria, Belgium,
Bulgaria, Cyprus, Czech Republic, Denmark, Estonia, Finland,
France, Germany, Greece, Hungary, Ireland, Italy, Latvia,
Lithuania, Luxemburg, Malta, Netherlands, Poland, Portugal,
Romania, Slovakia, Slovenia, Spain, Sweden and United
Kingdom
EU-28 European Union countries from July 2013: EU-27 and Croatia
EV electric vehicle
EWEA European Wind Energy Association
FFF Fridays For Future
FSU Former Soviet Union
IEA International Energy Agency
GHG greenhouse gas
LDV light duty vehicle
LHV lower heat value
MSW municipal solid waste
NA North America: Canada and United States
OECD Organization for Economic Co-operation and Development
OECD Americans Members of the Organization for Economic Co-operation and
Development in North America: Canada, Chile, Mexico, and
United States
OECD Europe Members of the Organization for Economic Co-operation and
Development in Europe: Austria, Belgium, Czech Republic,
Denmark, Estonia, Finland, France, Germany, Greece,
Hungary, Iceland, Ireland, Italy, Luxembourg, Netherlands,
Norway, Poland, Portugal, Slovakia, Slovenia, Spain, Sweden,
Switzerland, Turkey and United Kingdom
ORC Organic Rankine Cycle
PV photovoltaic
RES renewable energy sources
R&D research and development
8
UN United Nations
UNFCCC United Nations Framework Convention on Climate Change
USD United States dollar
WEC World Energy Council
2DS IEA’s Energy Technology Perspectives, 2 °C Scenario

9
1 INTRODUCTION
The aim of this Master’s Thesis work is to describe the EU-28’s energy consumption and
RES-share, and compare them to the consumption, RES-share and average of the world.
Different of scenarios of the future energy consumption and policies are also described. In
the RES-sector the focus is on biomass and solar power. Smart grids are briefly introduced.
In the year 2020 people are more and more concerned about the environmental issues and
climate change. In China and in the Europe’s biggest cities the air pollution has become a
very serious health problem.
Greta Thunberg started a school strike on 20th August 2018 by standing every day outside
the Swedish parliament building. Her demands are that political people must take more
effective actions to fight against climate change and people need to listen to scientists
about what kind of actions are necessary to do. Many people have been inspired by
Thunberg. She has been talking to politicians especially at the United Nations Climate
Action Summit in New York in September 2019. Thunberg has inspired a lot of people.
Fridays For Future -movement is developed by influence of Thunberg. Young students
gather all over the word usually once or twice in a month on Fridays in front of every
country's parliament buildings and demand politicians to take actions for the climate. Time
Magazine nominated Thunberg as Person of the Year 2019. Arguments were that
Thunberg has led by example and changed worldwide attitude on against climate change.
(NBCNEWS, Time, 2020)

10
2 ENERGY CONSUMPTION IN THE WORLD
The primary energy source quantity of the world is about 201 EJ, the electricity and heat
output are 90 EJ and the losses are 112 EJ. The overall energy production efficiency is
quite poor, about 45% are utilized benefit and 55% is losses. The largest part of losses
occurred because there are not many CHP-plants and the conversion efficiency of the
transport sector vehicles are only around 30 to 40%. Figure 1 shows energy flows in the
power energy sector, transportation fuels are not included. (IEA, Tracking Clean Energy
Progress 2013, 2014)
Figure 1. Energy flows in the global power sector in 2010. (IEA, Tracking Clean Energy Progress 2013,
2014)
From figure 1 it is seen that more than 50% of energy sources is losses. Coal and natural
gas dominate in primary sources, and the RES-share is very low. The energy production
share in CHP-plants is quite low compared to overall energy amount, but there is not so
large household heating demand in countries near equator than in northern countries. On
the power sector 20 EJ (10%) is RES-share and 151 EJ (75%) is fossil fuels, and 30 EJ
(15%) is nuclear power.

11
2.1 Energy consumption statistics in the year 2017
IEA collects energy consumption data from different countries over the world. Most
statistics about of the industry, transportation fuels and electricity production and
consumption are very accurate. In the RES-sector it is quite difficult to make reliable
statistics about biomass. People use wood for heating their apartments and for cooking. It
is very hard to calculate how much wood from forests are converted to gain energy. There
is a need to make some average assumptions on people’s behaviors. Table 1 shows the
energy consumptions over eight different groups in the year 2017. (IEA, Statistics, 2020)
Table 1. World’s energy consumption by different groups in the year 2017. (IEA, Sankey, 2020; Internet
World Stats, 2020; PRB, 2020; World Bank, 2020)
It is very noteworthy that the TOP 30 countries consumed 81% of the worldwide energy.
EU-28’s (Croatia joined in July 2013) share was only 12% of the total worldwide energy
share. Africa and Middle East shares are both 5%; Africa’s RES-share is 65% and Middle
East’s less than 1%. The total world’s average RES-share is 20%. TOP 30, OECD and
North America have lower RES-shares than world's average. EU-28’s RES-share is 21%,
so about the same than world’s average RES-share (20%). BRIC, Asia and Africa have
bigger RES-shares than world's average (20%). The energy amount from the primary
sources is 787 EJ, so 48% is different kind of losses, because most of the power plants
produce only electricity. (IEA, Statistics, 2020)
Rank Area / Group Inhabitants Hydro
[Million] [%] [EJ] [%] [EJ] [EJ] [EJ] [EJ] [EJ]
1. TOP 30 2,621 81 329 17 57 37 10.9 6.5 2.5
2. OECD 1,304 38 155 15 24 13 5.0 3.9 1.6
3. BRIC 3,122 34 139 19 27 17 6.6 3.0 0.4
4. Non-OECD Asia 4,494 33 136 23 31 21 5.6 2.9 1.7
5. North America 365 18 72 13 9.1 4.8 2.5 1.4 0.4
6. EU-28 512 12 48 21 9.9 6.6 1.1 1.9 0.3
7. Africa 1,284 6.1 25 65 16 15 0.4 0.1 0.2
8. Middle East 411 5.1 21 0.6 0.13 0.04 0.1 0.02 -
Total 7,621 100 406,828 20 81101 55,651 14,697 7158 3,595
Total World [EJ] 100 407 20 81 56 15 7.2 3.6
Total Share [%] 20 14 3.6 1.8 0.9
Total RES Share [%] 69 18 8.8 4.4
Resources [EJ] 787
Effiency [%] 52
ShareEnergy
Consumption
Renew-able's
shareRenew-
ableBiofuels /
waste
Solar /Wind /
TideGeo-
thermal
World[Million], [PJ]

12
2.2 The World’s TOP 30 and EU-28
80% of the world’s energy consumption is used in the top 30 most consuming countries.
Table 2 shows these countries' consumptions and RES-shares. (IEA, Statistics, 2020)
Table 2. The TOP 30 world’s most energy consuming countries in the year 2017. (IEA, Sankey, 2020; PRB,
2020)
Rank Country Inhabitants Share Hydro
[Million] [%] [PJ] [%] [PJ] [PJ] [PJ] [PJ] [PJ]
1. China 1394 21 83,904 14 11818 4,771 4,116 2497 434
2. United States 328 16 63,658 11 7002 4,251 1,089 1276 386
3. India 1371 6.1 24,755 35 8656 7,833 510 313 0
4. Russia 147 5.0 20,429 4.9 1005 332 666 3 4
5. Japan 127 3.0 12,257 10 1247 624 298 231 94
6. Brazil 209 2.3 9,537 54 5139 3,614 1,335 190 0
7. Germany 83 2.3 9,504 20 1931 1,296 73 551 11
8. Canada 37 2.0 8,199 26 2104 573 1,413 118 0
9. Iran 82 2.0 8,136 0.9 75 21 54 0 0
10. South Korea 52 1.9 7,665 4.7 361 301 10 42 8
11. Indonesia 265 1.8 7,274 47 3394 2,408 67 0 919
12. France 65 1.6 6,460 17 1080 750 180 133 17
13. Saudi Arabia 33 1.4 5,891 0 0 0 0 0 0
14. Nigeria 196 1.4 5,542 88 4894 4,277 20 0 0
15. United Kingdom 66 1.3 5,329 14 767 522 21 224 0
16. Mexico 131 1.3 5,118 13 674 380 115 52 127
17. Italy 61 1.2 4,978 23 1142 622 130 160 230
18. Turkey 81 1.1 4,398 17 762 127 210 127 298
19. Thailand 66 1.0 4,142 28 1156 1,101 34 21 0
20. Pakistan 201 0.9 3,773 41 1558 1,447 101 10 0
21. Spain 47 0.9 3,497 20 701 316 68 317 0
22. Australia 24 0.8 3,427 11 373 225 58 90 0
23. Poland 38 0.8 3,144 13 408 341 9.2 57 0.9
24. Taiwan 24 0.7 2,933 3 100 63 20 17 0
25. South Africa 58 0.7 2,839 12 327 282 3.1 41.8 0
26. Argentina 45 0.6 2,555 12 308 162 144 2.3 0
27. Egypt 97 0.6 2,548 5.3 135 76 48 10 0
28. Malaysia 33 0.6 2,537 5 127 30 96 1.2 0
29. Netherlands 17 0.6 2,461 8.4 208 157 0.2 48 3.0
30. 10 0.5 2,213 0.3 6.6 1.9 0 4.7 0
TOP-30 [Million], [PJ] 2,621 329102 17 57457 36905 10887 6536 2532
TOP-30 [EJ] 329 17 57 37 10.9 6.5 2.5
TOP-30 Share [%] 17 11 3.3 2.0 0.8
TOP-30 Share of RES [%] 64 19 11.4 4.4
Energy
Consumption
Renew-
able's
share
Renew-
able
Biofuels /
waste
Solar /
Wind /
Tide
Geo-
thermal
United ArabEmirates

13
In table 2 bolded countries the RES-share of overall energy consumption is higher or lower
compare to the average RES-share of the world, which is 21%. When comparing the RES-
share of TOP 10 most consuming countries, India and Brazil have the highest shares. USA,
Russia, Japan, Iran and South Korea have very low RES-shares, when Germany and
Canada have about the same as the world’s average RES-share (20%). In the TOP 30
countries Indonesia’s, Nigeria’s and Pakistan’s RES-shares are quite big, and all have large
populations. Indonesia uses some RES in industry, Pakistan has high amount of hydro
power and in Nigeria people burn wood. Table 3 shows all EU’s 28 countries energy
consumptions shares from the year 2017. Croatia joined in the EU on July 1st, 2013. (IEA,
Statistics, 2020)

14
Table 3. EU-28’s energy consumption in the year 2017. (IEA, Statistics, 2020; PRB, 2020)
In the bolded countries in the table 3 the RES-shares of overall energy consumption is
higher or lower compared to the average RES-share of the world (20%). The EU’s average
RES-share is 21%, which is about the same as the world’s average RES-share 20%. The
highest RES-shares are in Sweden, Austria, Finland, Portugal, Denmark, Latvia and
Estonia. Biomass plays a very big role in these countries, Finland and Sweden have quite
lot of forest industry. In Denmark, the wind power’s share has been growing in the last
years. The lowest RES-shares are in United Kingdom, Netherlands, Ireland and
Luxembourg. In these countries the biomass also has the highest share in the RES-sector.
Germany consumes about 20% of the EU-28’s primary energy. Other EU countries are
interested over Germany’s energy policy actions and effects. (IEA, Statistics, 2020)
Rank Country Inhabitants Share Hydro
[Million] [%] [PJ] [%] [PJ] [PJ] [PJ] [PJ] [PJ]
1. Germany 83 20 9,504 20 1931 1,296 73 551 11
2. France 65 13 6,460 17 1080 750 180 133 17
3. United Kingdom 66 11 5,329 14 767 522 21 224 0
4. Italy 61 10 4,978 23 1142 622 130 160 230
5. Spain 47 7.2 3,497 20 701 316 68 317 0
6. Poland 38 6.5 3,144 13 408 341 9 57 0.9
7. Netherlands 17 5.1 2,461 8.4 208 157 0.2 48 3.0
8. Belgium 11 3.5 1,705 12 196 159 1 36 0.0
9. Sweden 10 2.9 1,409 60 843 543 235 65 0
10. Austria 8.8 2.4 1,160 38 438 263 138 36 1.5
11. Czech Republic 11 2.4 1,136 17 197 179 6.7 11 0
12. Finland 5.5 2.2 1,073 45 483 412 53 18 0
13. Romania 20 2.1 995 26 257 170 52 33 1.8
14. Hungary 10 2 847 16 133 119 0.8 7.4 5.6
15. Greece 11 1.4 694 16 110 50 14 46 0.4
16. Portugal 10 1.4 687 31 211 130 21 51 8.3
17. Denmark 5.8 1.2 582 44 258 200 0 58 0.2
18. Slovak Republic 5.4 1.0 463 16 75 57 16 2.1 0.4
19. Ireland 4.9 0.9 456 13 61 31 2.5 27 0
20. Bulgaria 7.0 0.9 425 19 79 56 10 11 1.4
21. Croatia 4.1 0.6 307 26 80 55 19 5.2 0.3
22. Lithuania 2.8 0.6 270 25 68 60 2.2 5.2 0
23. Slovenia 2.1 0.4 209 23 47 30 14 1.5 2.0
24. Latvia 1.9 0.3 159 52 82 66 15.8 0.6 0
25. Luxembourg 0.6 0.3 153 8.3 13 11 0.3 1.3 0
26. Estonia 1.3 0.3 123 37 46 43 0.1 2.6 0
27. Cyprus 1.2 0.1 66 12 7.9 3.5 0 4.3 0.1
28. Malta 0.5 0.04 21 6.1 1.3 0.5 0 0.8 0
EU-28 [Million], [PJ] 512 100 48308 21 9922 6642 1083 1913 284
EU-28 [EJ] 48 21 9.9 6.6 1.1 1.9 0.3
EU-28 Share [%] 21 14 2.2 4.0 0.6
EU-28 Share of RES [%] 67 11 19 2.9
Energy
Consumption
Renew-
able's
share
Renew-
able
Biofuels /
waste
Solar /
Wind /
Tide
Geo-
thermal

15
2.3 Renewable energy’s shares
Biomass is the main RES used in EU-28 countries; the share is almost 70% of RES. There
is not so much improving potential in hydro power plants or rivers to build more than has
already been build. Hydro power has a 13% share, and solar, wind and tide have each 17%
share of RES in year the 2017. Solar power has a great potential to grow, in future there
will be seen technical improvements and breakthroughs. Wind power has been technically
developed quite slowly around 1980 and 2010, when prices have been dropping quite fast
between 2000 and 2020. Solar power technology has been developed very fast between
2000 and 2010 and still further, and prices have been dropping also very fast especially
between 2005 and 2017. Solar power can have a very big share of the energy production at
some stage in the future. (IEA, Statistics, 2020)
2.4 Renewable energy sources and electricity network
One of the main restrictions for RES share getting bigger are that the need of electricity
varies in different times of the day and the year. Generally, more electricity and especially
heat are needed during the winter than during the summer. RES production varies a lot in
different time of the day and by seasons. Solar power can be produced a lot in summer but
not so much in winter. Wind power production needs some adjustment power for days
when there is no wind. For example, in Denmark wind and solar energy comprises about
40% of the whole energy production and for adjustment power they use hydro and coal
power from Sweden, Norway and Germany.
2.5 Restrictions, consumption and production daily and seasonal varieties
In figure 2 the consumption of electricity is highest in July, and it is quite high also in
January. Solar power is produced almost only in the summer and wind power only when it
is windy. The daily consumption of electricity varies quite a lot. In the nighttime the
consumption is lowest about between hours 24 and 6. The consumption from 8 to 16 it is
very stable and from 16 to 24 consumption varies depending on how people are behaving,
so it can vary a lot of during different days.

16
Figure 2. Example of a 24-hour electricity system demand curve on several dates over the year. (IEA,
Technology Roadmap: Smart Grids, 2014)
For example, in Germany wind power are produced more in the north, because at the sea
there is quite much offshore wind power and solar power more in the north than some days
there is consumption. In the south there are a lot of industries and a lot of people to
consume electricity. The electricity networks between north and south cannot handle the
amounts that are necessary to transport to south. So, they need to use the networks of
Poland and Czech Republic, which are not so in modern condition as those in most of
Western European countries. There have been some blackouts because of overloads in the
electricity grid network.
Figure 3 presents solar and wind power production in Germany on May 25 and 26, 2013. It
can be seen that the production of electricity at noon is five times bigger than at midnight.
In East Germany the RES production can be four times bigger than the areal demand. The
government has stated that RES energy has priority, while nuclear and fossil powers have
second priority in the grid. So when production is sometimes four times bigger than the
demand, electricity needs to be exported somewhere. Poland and Czech Republic are
investing in a “switch off”-button on the boarders so their grids will stay at balance.

17
Figure 3. Wind and solar energy fed into the power grid in Germany on May 25 and 26, 2012. (Institute for
Energy Research, 2013)
The production of VRE / solar and wind power varies a lot. There will be need for short
time period, from hours to days, and for long time period, days to weeks, storage for
electricity. When VRE share in network increases more and more, long time period
electricity storages will prevent black out risk at network. Capacity fluctuations can be
helped with network connections; shown in figure 4 and figure 5.

18
Figure 4. Transmission links between Nordic countries. (IEA, Technology Roadmap: Smart Grids, 2014)

19
Figure 5. Bottlenecks in the European electricity network. (IEA, Technology Roadmap: Wind Energy, 2014)

20
2.6 Smart grids
Consumption of electricity and RES production varies some during a day and a lot in
different seasons so there is a strong need for development of smart grids and storage
systems for electricity. Figure 6 shows IEA’s 2D-Scenario’s drivers for smart grid
deployment.
Figure 6. Drivers for smart grid deployment. (IEA, Tracking Clean Energy Progress 2013, 2014)
Figure 6 presents different drivers for smart grid deployment.

21
Figure 7. Smart grid technologies. (IEA, Tracking Clean Energy Progress 2013, 2014)
In figure 7 are listed different smart grid technologies. The key challenge in the
development and deployment of smart grids is the integration of the many individual smart
grid technologies. The tracking progress in smart grid deployment is complex and efforts
are ongoing to determine appropriate metrics.

22
3 FUTURE SCENARIOS AND POLITICS
Different kinds of organizations made their own assumptions about how people, politics
and technology will develop and behave in the future. Scenarios are not like crystal balls,
they are developed to help politicians, corporate leaders and university research to make
decisions. Every organization has its own different kind of motivation aspects and goals.
Multinational corporations, as for example Shell have a priority to sell oil and gas products
to a lot of costumers.
3.1 Kyoto Protocol and the United Nations
The Kyoto Protocol is an international agreement linked to the United Nations Framework
Convention on Climate Change, which commits its parties by setting internationally
binding emission reduction targets. Recognizing that developed countries are principally
responsible for the current high levels of GHG emissions in the atmosphere as a result of
more than 150 years of industrial activity, the Protocol places a heavier burden on
developed nations under the principle of “common but differentiated responsibilities”.
(UN, 2020)
The Kyoto Protocol was adopted in Kyoto, Japan, on 11th December 1997 and entered
effect on 16th February 2005. The detailed rules for the implementation of the Protocol
were adopted at COP 7 in Marrakesh, Morocco, in 2001, and are referred to as the
“Marrakesh Accords”. Its first commitment period started in 2008 and ended in 2012.
In Doha, Qatar, on 8th December 2012, the “Doha Amendment to the Kyoto Protocol” was
adopted. The amendment includes:
- New commitments for Annex 1 Parties to the Kyoto Protocol, which agreed to take
commitments in a second commitment period from 1st January 2013 to 31st
December 2020
- A revised list of greenhouse gases (GHG) to be reported on by Parties in the second
commitment period; and

23
- Amendments to several articles of the Kyoto Protocol, which specifically
referenced issues pertaining to the first commitment period and which needed to be
updated for the second commitment period.
During the first commitment period, 37 industrialized countries and the European
Community committed to reduce GHG emissions to an average of five percent against
1990 levels. During the second commitment period, Parties committed to reduce GHG
emissions by at least 18 percent below 1990 levels in the eight-year period from 2013 to
2020; however, the composition of Parties in the second commitment period is different
from the first.
The Kyoto Protocol is based mainly on national measurements but has also three market-
based mechanisms. Those mechanisms are
1) International Emissions Trading
2) Clean Development Mechanism (CDM) and
3) Joint implementation (JI)
3.2 IEA – International Energy Agency
IEA is an autonomous organization founded in response to the oil crisis in 1973-1974. It
works to ensure reliable, affordable and clean energy for its member countries. Workers in
IEA are from different member states. IEA’s four main areas of focus are today energy
security, economic development, environmental awareness, and engagement worldwide.
IEA’s member countries are listed in table 4.
Table 4. IEA’s member countries in 2014. (IEA, 2014)
Australia Estonia Hungary New Zealand Spain
Austria European Union Ireland Norway Sweden
Belgium Finland Italy Poland Switzerland
Canada France Japan Portugal Turkey
Czech Republic Germany Luxembourg Republic of Korea United Kingdom
Denmark Greece Netherlands Slovak Republic United States

24
IEA collects from different fields of expertise knowledge and makes technical roadmaps
on special areas of energy. These road maps are good guidelines especially for politicians
and researchers.
Figure 8. World primary energy demand by different scenarios. (IEA, World Energy Outlook, 2014)
Figure 8 shows three different IEA’s scenarios for the world primary energy demand.
Table 5. World primary energy demand by fuels and scenarios (Mtoe). (IEA, World Energy Outlook, 2014)

25
Table 5 presents the world’s primary energy demand by fuels in three different scenarios.
Figure 9. World primary energy demand by fuels and scenarios, 2009 and 2035 (Mtoe). (IEA, World Energy
Outlook, 2014)
Table 9 shows world’s primary energy demand by fuels and three different scenarios in the
years 2009 and 2035.
Figure 10. Shares of energy sources in world primary energy demand by different scenarios, 2035. (IEA,
World Energy Outlook, 2014)
Figure 10 presents shares of energy sources in world primary energy demand by three
different scenarios in 2035.

26
3.3 WEC – World Energy Council
WEC is a non-governmental and non-commercial energy foundation. It was created in
1923 after World War I by Scotsman Daniel Dunlop. WEC gathered 40 countries to
discuss global energy industry problems. In 2014 WEC has almost 100 national member
committees and members are governments and different kinds of business and expert
organizations. (WEC, 2014)
3.4 Royal Dutch Shell – International Oil Corporation
Shell is a multinational Dutch-British oil product company. Its main products are oil,
natural gas and other petrochemicals products. Shell operates in over 70 countries, has over
90 000 employees, over 30 refineries and chemical plants, produces 3,2 million barrels of
oil every day and sold almost 20 million tons of equity LNG in a year. 2013’s revenue was
329 billion Euros, profit was 12 billion Euros, investments in research and development
was 1 billion Euros. Shell has spent on developing alternative energies, CCS and CO2-
related R&D 1,6 billion Euros between years 2008 and 2012. Shell has about 40 years of
experience of scenarios making (from 1972 and it predicted the oil crisis in 1973). (Shell,
2014)
Shell has two scenarios, called Mountains and Oceans. Mountains are quite business as
usual, there is now huge technological steps forward. The share of coal would decrease,
and gas would increase as primary source of energy. There are more big technological
development steps in many different areas in Oceans (Shell, 2020).
3.5 EREC – European Renewable Energy Council and Greenpeace
Greenpeace has published cooperation work scenario called Energy Revolution.
(Greenpeace, 2015. Wikipedia, 2016)
- Founded by a Canadian environmental activist in 1971
- 2.9 million individual supporters

27
- General consultative status with the United Nations Economic and Social Council
- Non-governmental organization, staff 2400 (2008), volunteers 15 000, budget 237
million Euros in 2011, offices in 55 countries
EREC is a coalition of different kinds of associations working on the RES energy sector.
Members are listed in table 6.
Table 6. Member associations in EREC. (EREC, 2016)
AEBIOM European Biomass Association EGEC European Geothermal Energy Council EPIA European Photovoltaic Industry Association EREF European Renewable Energies Federation ESHA European Small Hydropower Association ESTELA European Solar Thermal Elecricity Association ESTIF European Solar Thermal Industry Federation EUBIA European Biomass Industry Association EUREC Agency European Association of Renewable Energy Research Centres EWEA European Wind Energy Association
Figure 11. Estimated renewable energy share of global final energy consumption 2013. (Greenpeace, 2020)
Figure 11 shows estimated renewable energy share of the global final energy consumption
in the year 2013.
28
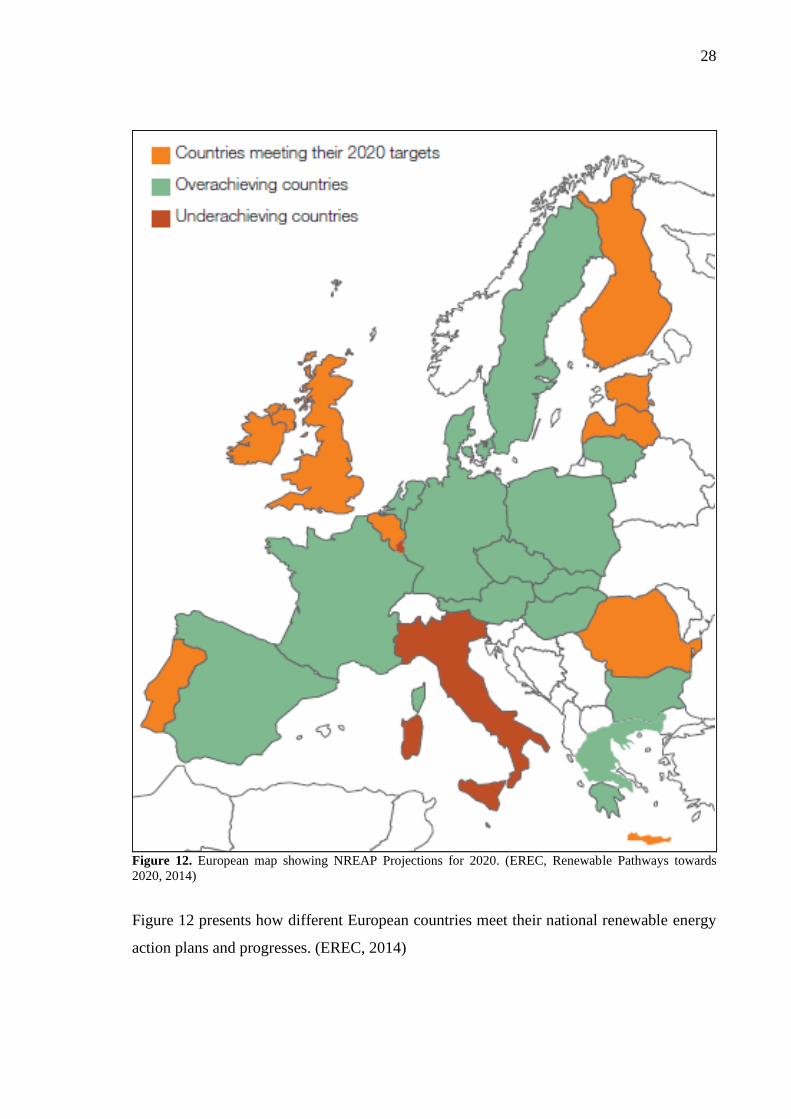
Figure 12. European map showing NREAP Projections for 2020. (EREC, Renewable Pathways towards
2020, 2014)
Figure 12 presents how different European countries meet their national renewable energy
action plans and progresses. (EREC, 2014)

29
Figure 13. Renewable energy sources in the electricity mix in 2020. (EREC, Renewable Pathways towards
2020, 2014)
Figure 14. Renewable energy sources in the heating and cooling mix in 2020. (EREC, Renewable Pathways
towards 2020, 2014)
Figure 15. Renewable energy sources in the transport mix in 2020. (EREC, Renewable Pathways towards
2020, 2014)

30
Figures 13, 14 and 15 presents the shares of renewable energy sources in the electricity
mix, the heating and cooling mix and the transport mix in Europe in the year 2020. (EREC,
2020)
Figure 16. Energy resources of the world. (EREC, Energy Revolution, 2020)

31
Figure 17. Global: Final energy intensity under the Reference scenario and the Energy revolution scenario.
(Greenpeace, 2020)
Figure 17 presents the global final energy intensity in the Reference and the Energy
revolutions scenarios from the year 2010 to the year 2050. (Greenpeace, 2020)
Figure 18. Global power plant market 1970 – 2010, excluding China. (Greenpeace, 2020)
Figure 18 ja 19 shows the global and the Europe (EU-27) power plant markets from the
year 1970 to the year 2010. (Greenpeace, 2020)

32
Figure 19. Europe (EU-27): Power plant market 1970 – 2010. (Greenpeace, 2020)
3.6 Germany’s Energy Revolution
Figure 20. Germany’s electricity generation, demand, and exports 2003-2013. (HBF, 2014)

33
Figure 20 shows Germany’s electricity production, demand and exports from the year 2013
to the year 2013. Figure 21 resents changes in Germany’s electricity production by
different sources. (HBF, 2014).
Figure 21. Changes in Germany’s electricity generation from 2003 to 2013. (HBF, 2014)

34
Figure 22. Germany’s Transition to Green Power. (Spiegel, 2013)
Figure 22 shows Germany’s transition to green electricity production to the year 2020 and
the year 2030. (Spiegel, 2013)
35
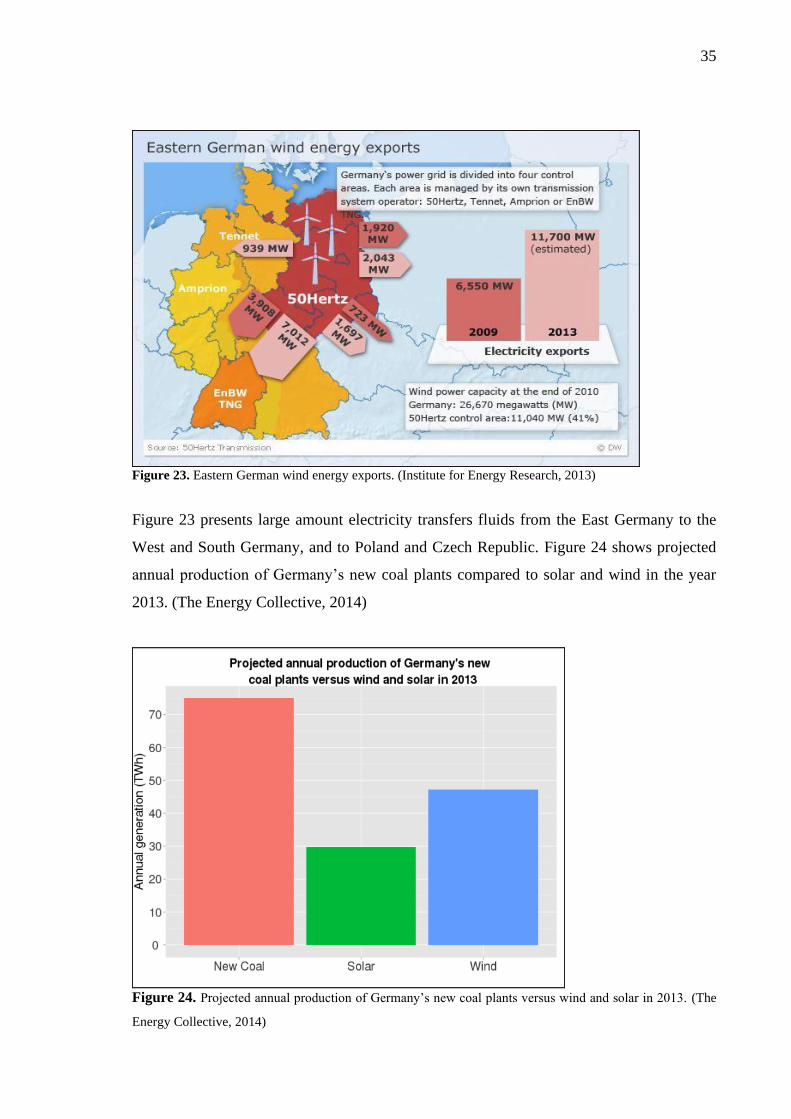
Figure 23. Eastern German wind energy exports. (Institute for Energy Research, 2013)
Figure 23 presents large amount electricity transfers fluids from the East Germany to the
West and South Germany, and to Poland and Czech Republic. Figure 24 shows projected
annual production of Germany’s new coal plants compared to solar and wind in the year
2013. (The Energy Collective, 2014)
Figure 24. Projected annual production of Germany’s new coal plants versus wind and solar in 2013. (The
Energy Collective, 2014)
36
4 BIOMASS – WOOD, WASTE
Biomass is the most widely used renewable energy source in the world. Most of it covers
different kind of use of wood-based materials. Wood is used in the building sector for
heating and cooking stoves. In the industrial sector wood-based biomass is mainly used in
forest, pulp and paper industry. They can easily use residues and side products. Biomass
also includes any organic materials from plants, agricultural crops and wastes.
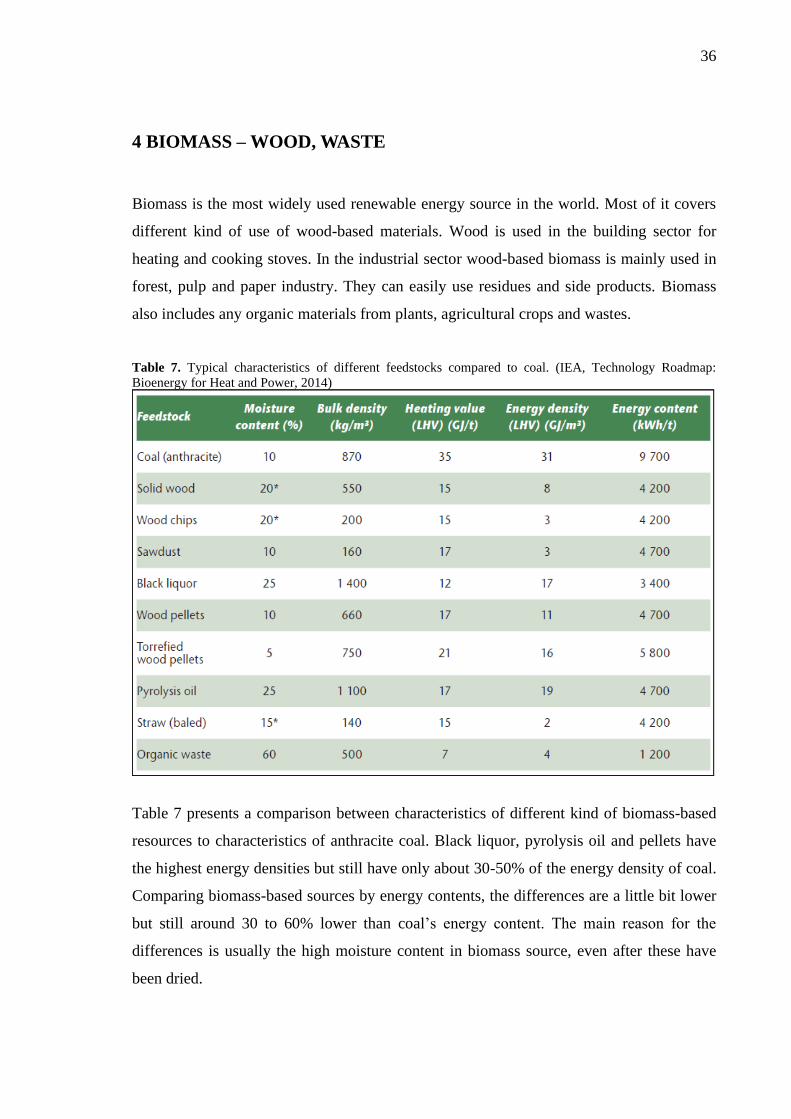
Table 7. Typical characteristics of different feedstocks compared to coal. (IEA, Technology Roadmap:
Bioenergy for Heat and Power, 2014)
Table 7 presents a comparison between characteristics of different kind of biomass-based
resources to characteristics of anthracite coal. Black liquor, pyrolysis oil and pellets have
the highest energy densities but still have only about 30-50% of the energy density of coal.
Comparing biomass-based sources by energy contents, the differences are a little bit lower
but still around 30 to 60% lower than coal’s energy content. The main reason for the
differences is usually the high moisture content in biomass source, even after these have
been dried.
37
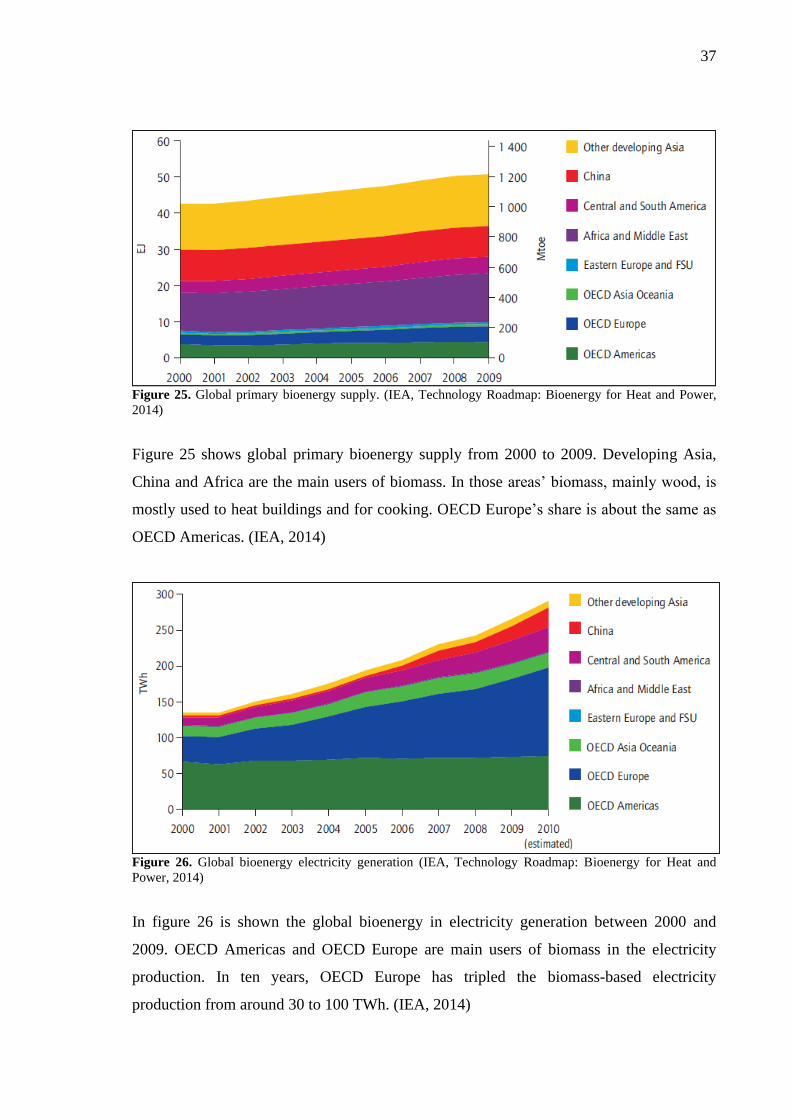
Figure 25. Global primary bioenergy supply. (IEA, Technology Roadmap: Bioenergy for Heat and Power,
2014)
Figure 25 shows global primary bioenergy supply from 2000 to 2009. Developing Asia,
China and Africa are the main users of biomass. In those areas’ biomass, mainly wood, is
mostly used to heat buildings and for cooking. OECD Europe’s share is about the same as
OECD Americas. (IEA, 2014)
Figure 26. Global bioenergy electricity generation (IEA, Technology Roadmap: Bioenergy for Heat and
Power, 2014)
In figure 26 is shown the global bioenergy in electricity generation between 2000 and
2009. OECD Americas and OECD Europe are main users of biomass in the electricity
production. In ten years, OECD Europe has tripled the biomass-based electricity
production from around 30 to 100 TWh. (IEA, 2014)

38
4.1 Production technology and development, different raw materials
Most typical sources of biomass are residues and side flows of forest industry. Most used
sources are wood barks, sawdust, pellets and black liqueur, which is utilized in pulp
industry. The black liqueur is utilized in a recovery boiler, in which can be collected
beneficial chemicals and the residue substance can be burned to produce heat and
electricity. Another very common biomass burning boiler is the fluidized bed boiler. In the
fluidized bed boilers wood chips and for example residues from households is usually
burned. In the water treatment plants the organic material is exploited from wastewater and
can be converted to energy in a boiler or digested to bio methane in a digest reactor. There
is plenty of research on different kind of technologies, which may improve economics of
biomass-based sources. Pyrolysis, bio coal and CCS / CCU have potential for commercial
markets. Carbon dioxide may have a lot of potential to be used in the brewery industry.
Figure 27. Examples of different biomass feedstocks, typical feedstock costs, and plant capacities. (IEA,
Technology Roadmap: Bioenergy for Heat and Power, 2014)
Figure 27 shows biomass divided in to four different main categories by electricity power
amounts for power plant, by energy content of resource and transport distance of resource.
The dividing limits are a little bit flexible. The transport cost of biomass sources increases
quite much by distance comparing for example to coal and oil. The main reason is that the
heat value of biomass for volume and weight is significantly lower than the heat value of
coal and oil. For example, one truck and one ship carry higher amount of energy content of
coal and oil than biomass.

39
Figure 28. Comparison of bulk density and energy density of different biomass feedstocks. (IEA,
Technology Roadmap: Bioenergy for Heat and Power, 2014)
Figure 28 presents the comparison of different biomass feedstocks by bulk density and by
energy density. (IEA, 2014)
Figure 29. Overview of conversion technologies and their current development status. (IEA, Technology
Roadmap: Bioenergy for Heat and Power, 2014)
Figure 29 shows the overview of different kind of conversion technologies for biomass-
based feedstocks and their development status. (IEA, 2014)

40
4.2 Supply: transport, logistics, raw materials, sustainability
Figure 30. Environmental, social and economic aspects of biofuel and bioenergy production. (IEA,
Technology Roadmap: Biofuels for Transport 2014)
Figure 30 presents biomass-based energy productions sustainability divided into three
different areas. Those areas are social, environment and economic. (IEA, 2014)
Figure 31. World biomass shipping today. (IEA, Technology Roadmap: Biofuels for Transport 2011, 2014)
Wood pellets are the most important energy biomass traded globally. From 2000 to 2010
EU’s pellet production, demand and imports have increased around tenfold. Trade inside
EU is very significant but quite large amounts are also transported mainly from Russia,
Canada and the United States. In the figure 31 are shown amounts of wood pellet trade
around the world. (WEC, 2014)

41
Figure 32. Major global wood pellet trade streams in 2011 [kt]. (WEC, World Energy Resources, 2013)
Figure 32 presents the major global wood pellet transport and trading streams in the year
2011. Some amounts of pellets are also transported from Asia, Africa and Australia.
Eastern Europe is a more rural area than Western Europe and has more forest, so pellets
are traded and transported from east to west. (WEC, 2013)
Figure 33. Lifecycle GHG emissions (excluding land use change) per unit of output for a range of bioenergy
(green) and fossil (black) options. (IEA, Technology Roadmap: Biofuels for Transport, 2014)
In figure 33 are compared greenhouse gases from fossil fuels to biomass. Biomass is
usually the new source for energy production, when replacing fossil sources to something
else. In these cases, the reduction in the amount of greenhouse gases is significant. (IEA,
2014)
42
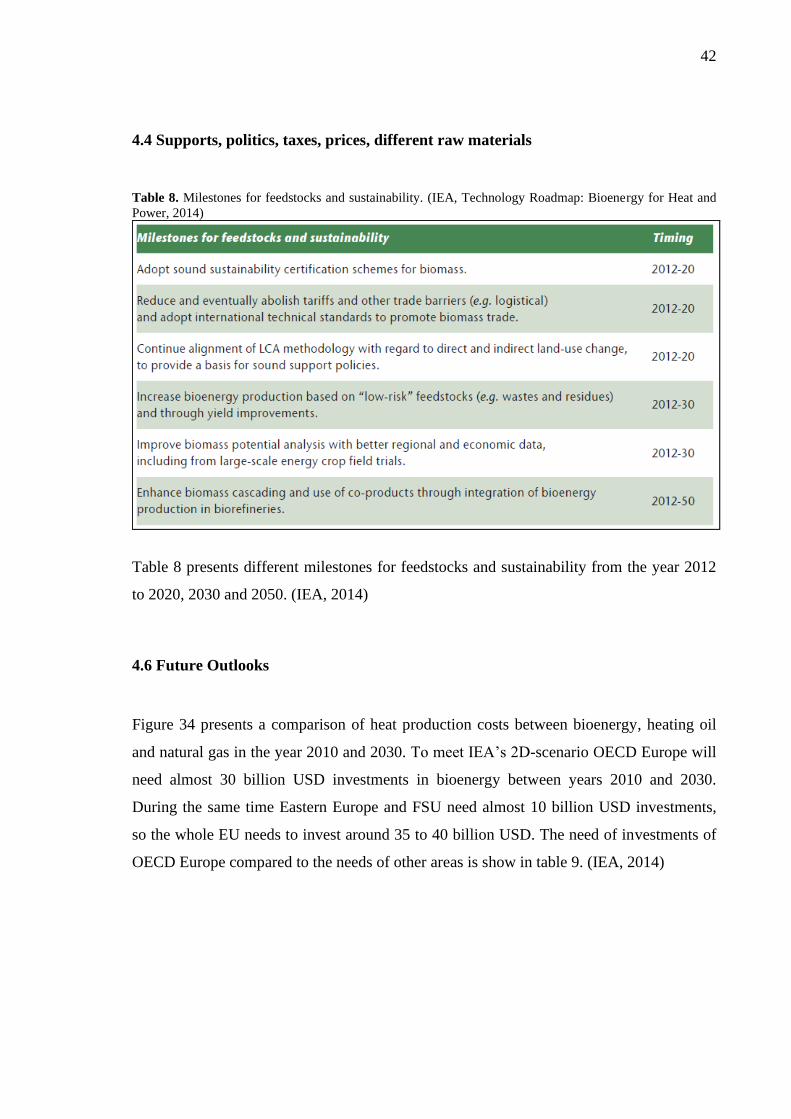
4.4 Supports, politics, taxes, prices, different raw materials
Table 8. Milestones for feedstocks and sustainability. (IEA, Technology Roadmap: Bioenergy for Heat and
Power, 2014)
Table 8 presents different milestones for feedstocks and sustainability from the year 2012
to 2020, 2030 and 2050. (IEA, 2014)
4.6 Future Outlooks
Figure 34 presents a comparison of heat production costs between bioenergy, heating oil
and natural gas in the year 2010 and 2030. To meet IEA’s 2D-scenario OECD Europe will
need almost 30 billion USD investments in bioenergy between years 2010 and 2030.
During the same time Eastern Europe and FSU need almost 10 billion USD investments,
so the whole EU needs to invest around 35 to 40 billion USD. The need of investments of
OECD Europe compared to the needs of other areas is show in table 9. (IEA, 2014)

43
Figure 34. Bioenergy heat production costs 2010 and 2030, compared to heating oil and natural gas heat
production. (IEA, Technology Roadmap: Bioenergy for Heat and Power, 2014)

44
Table 9. Investment needs (billion USD) in bioenergy electricity generation capacity, including co-firing, in
different world regions. (IEA, Technology Roadmap: Bioenergy for Heat and Power, 2014)
EU’s investment need, around 35 billion USD, is only about 12% of the need oh the whole
world from the year 2010 to the year 2030. It is noteworthy that the investment need
between 2030 and 2050 is also around 35 billion USD and is, comparing to the need of the
whole world, about 17%. (IEA, 2014)
Table 10. Milestones for technology improvements. (IEA, Technology Roadmap: Bioenergy for Heat and
Power, 2014)
Table 10 presents milestones for technology improvements. (IEA, 2014)

45
5 SOLAR POWER
Typically, the solar energy application is a solar panel. The solar panel is a photovoltaic
module as package of solar cells. The most common application for solar energy is a solar
photovoltaic (PV), solar panels of which produce electricity.
Figure 35. Photovoltaic Solar Elecricity Potential in European Countries. (European Commission, SolarGIS,
2020)
Figure 35 shows that in the South Europe there is a lot potential solar radiation to convert
to energy and in the Northern Europe the potential is smallest in Europe. In Central Europe
the potential is quite average comparing to the North and the South. On yearly base the

46
exploited potential is almost the same in North than in the Central, because in the North the
sun shines more time daily than in Central. Normally the best angle to get benfit of the sun
radiation is to place panels on 15-17 degrees angle, and when using angle adjustable
panels, the North can take more advantage of the sun radiation.
Figure 36. European total solar PV grid-connected capacity 2000 – 2016. (SolarPower Europe, Global
Market Outlook 2017, 2018)
Figure 36 shows the European total solar photovoltaic grid-connected capacity from the
year 2000 to the year 2016. (SolarPower Europe, 2018)
Figure 37 presents information of the European photovoltaic power market. (SolarPower
Europe, 2013)
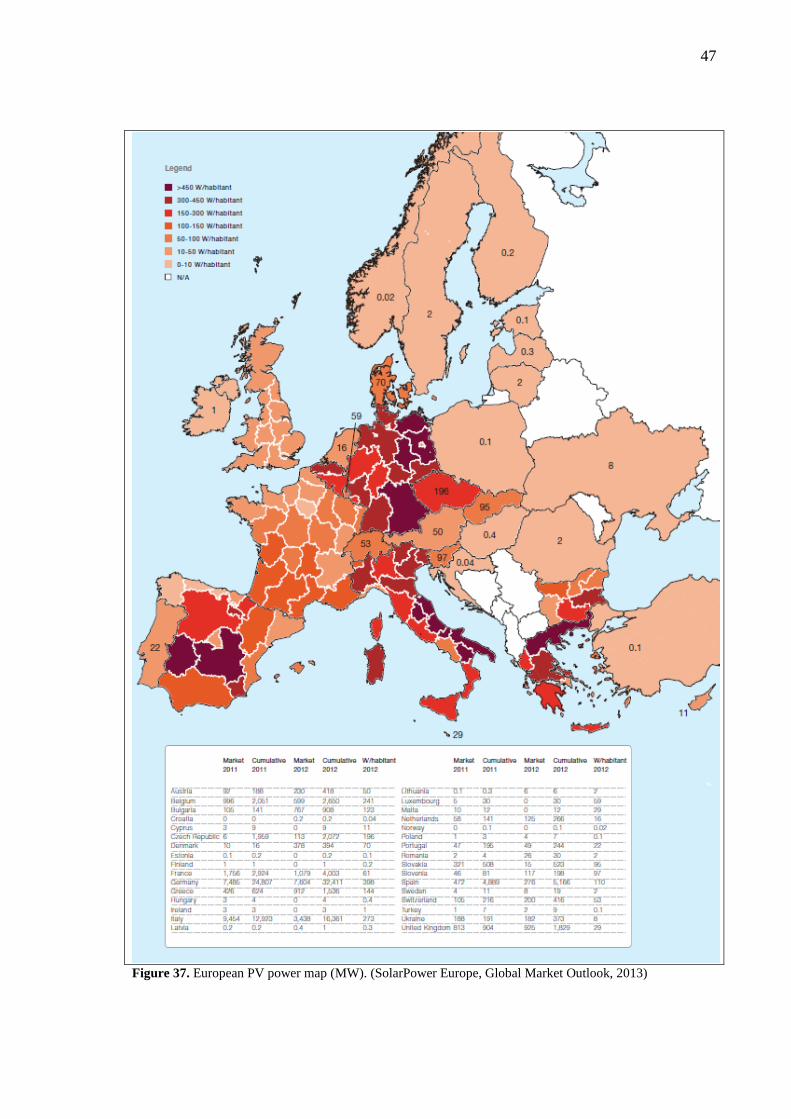
47
Figure 37. European PV power map (MW). (SolarPower Europe, Global Market Outlook, 2013)

48
5.1 Production, lifetime, efficiency
In the last year’s governments and companies have been investing on photovoltaic solar
research and development. (IEA, Technology Roadmap: Solar Photovoltaic Energy, 2014)
Figure 38. Solar PV installed capacities in leading countries. (IEA, Technology Roadmap: Solar
Photovoltaic Energy, 2014)
Figure 38 shows installed solar PV capacities in leading countries in the years 2000, 2004
and 2008. A handful of countries with strong policy regimes account for 80% of global
installed PV capacity; new countries have emerged as important players in the past few
years. (IEA, 2014)
Figure 39. Main CSP technologies. (IEA, Technology Roadmap: Solar Thermal Electricity, 2014)

49
Figure 39 presents main concentrated solar power technologies. Most current CSP plants
are based on trough technology, but tower technology is increasing and linear Fresnel
installations emerging. (IEA, 2014)
Figure 40. Weekly production of solar and wind energy in Germany 2013. (IEA, Technology Roadmap:
Solar Photovoltaic Energy, 2014)
Figure 40 shows weekly electricity production of solar and wind in Germany in the year
2013. Solar and wind energy productions have lowest and highest production times on
different seasons. (IEA, 2014)
Figure 41. Hourly electricity consumption profiles for different building types in Germany. (IEA,
Technology Roadmap: Sola Photovoltaic Energy, 2014)
Figure 41 presents different hourly electricity profiles for different building types in
Germany. (IEA, 2014)

50
5.2 Cost of constructions, supports, politics, R&D
Table 11. Typical PV system prices in 2013 in selected countries [USD]. (IEA, Technology Roadmap: Sola
Photovoltaic Energy, 2014))
Table 11 shows typical photovoltaic system prices in selected countries in the year 2013.
China has the lowest prices and the United States has the highest prices. (IEA, 2014)
Figure 42. Investment cost of a 50 MW trough plant with 7-hour storage. (IEA, Technology Roadmap:
Concentrating Solar Power, 2020)
Figure 42 presents investment components of a 50 MW plant with 7-hour storage. (IEA,
2020)

51
In Spain, the government is planning to collect taxes from people who produce solar power
electricity and are selling it to main grid. Spain has very big national debt, and many
people are unemployed, so they consider different kind of ways to collect money/taxes.
This can lead in other countries that people are afraid to install solar panels on their houses.
In the world there is no other country that is taxing on solar power production; Spain
would then be the first one. (BBC, 2013)
5.3 Future Outlooks
The efficiency of commercial solar power cells may continue to improve relatively fast
compared to the evolution from the year 2000 to the year 2015. The technology solutions
from laboratory discoveries will be commercially available in the future. The development
in China will affect quite much the commercial markets development and the prices of
solar panels.
Figure 44 shows IEA’s roadmap vision for solar heating and cooling. (IEA, 2020)
Figure 43. Growth of CSP production under four scenarios [TWh/a]. (IEA, Technology Roadmap:
Concentrating Solar Power, 2020)
Table 12 presents top Europeans solar PV market’s prospects. (SolarPower, 2018)
Figure 44 shows IEA’s roadmap vision for solar heating and cooling. (IEA, 2020)

52
Table 12. Top European solar pv market’s prospects. (SolarPower Europe, Global Market Outlook, 2018)
Figure 44. IEA’s Roadmap vision for solar heating and cooling [EJ/a]. (IEA, Technology Roadmap: Solar
Heating and Cooling, 2020)

53
6 FUTURE PROSPECTS AND FORESIGHT
Every EU country has different kind of plans and annual time frames to achieve carbon
neutral energy productions. The EU facilitates these plans thorough the Green Deal Invest
Program.
Figure 45. Centralized generation systems waste more than two thirds of their original energy input.
(Greenpeace, Energy Revolution, 2016)
Figure 45 presents the energy units flow from power plant to household use. On the way
some amount of the primary energy is always lost. (Greenpeace, 2016)

54
Figure 46. Future city. (Greenpeace, 2016)
Figure 46 shows one example of what a future city would look like. Figure 47 presents the
smart-grid vision for the energy revolution. (Greenpeace, 2016)

55
Figure 47. The smart-grid vision for the energy revolution. (Greenpeace, 2016)
In the future EU's energy policy will assert financial punishment when using fossil fuels,
so gradually renewable sources and low carbon technologies will compete for shares of
energy production with fossil fuels.

56
7 CONCLUSIONS
Using biomass as source of energy has a big role in some countries in EU. Policy makers
are taking some actions on the sustainable criteria because not all of biomass used is so
sustainable in the long term. Some of the wood pellets are shipped from North America,
Africa and Asia already and if politics are favoring biomass in energy production the
amount of overseas shipping will expand. There is currently research regarding many
different potential technological solutions on how to increase the heat value of a large
variety of biomass feedstocks and capturing CO2 and other greenhouse gases from
combusting processes.
Most of the obstacles for the use of new technologies are that the economics of the whole
process is not competitive enough compared to other sources of energy production. Policy
makers usually want to promote technologies which creates employment. The biomass
production chain will employ people, especially on the countryside.
In the future there would be more sustainability certifications in the EU and in the world
for using biomass in energy production. Some countries have different kind of specific
rules for using biomass feedstocks for energy production. When processing wood in pulp
industry, liquid materials can be collected. Chemicals from liquids can be reused in the
pulp process and the rest can be used to produce energy. These chemicals cannot so easily
be used elsewhere, other possibilities are under research.
Regarding solar power in the last 20 years in the Europe, installed capacity has developed
and increased quite a bit. Especially a lot of installations have been assembled in Germany,
Italy and Spain. During 2016 and 2017 installation speed has been a little bit slower than
during the years before, so it almost on the S-curve. The next few next years may also be
somewhat slow but there may be some speeding up in the future.

57
SOURCES
BBC, Spain’s sunshine toll: Row over proposed solar tax. Updated August 6, 2013
[retrieved December 12, 2013]. From: http://www.bbc.co.uk/news/business-24272061
BCG, Boston Consulting Group, Germany’s Energiewende: The End of Power Market
Liberalization? Updated September 25, 2014 [retrieved October 20, 2014]. From:
https://www.bcgperspectives.com/content/articles/sustainability_energy_environment_ger
many_energiewende_end_power_market_liberalization/
Bloomberg, Spain Hurts Solar With Plan to Penalize Power Producers. Updated August 2,
2013 [retrieved March 3, 2014]. From: http://www.bloomberg.com/news/2013-08-
01/spain-hurts-solar-with-plan-to-penalize-power-producers.html
The Energy Collective, The Energy Transition with Robert Wilson, “Why Germany’s
Nuclear Phase Out is Leading to More Coal Burning”. Updated January 20, 2014
[retrieved August 23, 2014]. From:
http://theenergycollective.com/robertwilson190/328841/why-germanys-nuclear-phase-out-
leading-more-coal-burning
EPIA, European Photovoltaic Industry Association. Updated March 1, 2014 [retrieved
March 28, 2014]. From: http://www.epia.org/news/publications/
EREC, European Renewable Energy Council, EU Energy Revolution scenario. Updated
January 22, 2014 [retrieved March 21, 2014]. From
http://www.erec.org/media/publications.html
European Commission, Photovoltaic Geographical Information System, Download, Maps,
Country and regional maps, Europe. Updated May 11, 2017 [retrieved February 21, 2018].
From http://re.jrc.ec.europa.eu/pvg_download/map_index_c.html

58
Greenpeace, Energy Revolution, 5th edition, 2015. Updated September 21, 2015 [retrieved
April 23, 2016]. From:
http://www.greenpeace.org/international/Global/international/publications/climate/2015/En
ergy-Revolution-2015-Full.pdf
HBF, Heinrich Böll Foundation, The German Coal Conundrum: The Status of coal power
in Germany’s energy transition. Updated June 6, 2014 [retrieved August 20, 2014]. From:
http://us.boell.org/2014/06/06/german-coal-conundrum
IEA, International Energy Agency, Clean Energy Tracking Progress 2013. Updated April
1, 2013 [retrieved October 20, 2014]. From: https://www.iea.org/reports/tracking-clean-
energy-progress-2013
IEA, International Energy Agency, Statistics, Energy balance flows, Sankey-diagram.
Updated January 1, 2018 [retrieved January 24, 2020]. From:
https://www.iea.org/statistics/
IEA, International Energy Agency, Technology Roadmap: Bioenergy for Heat and Power.
Updated May 29, 2012 [retrieved October 20, 2014]. From:
http://www.iea.org/publications/freepublications/publication/name-27281-en.html
IEA, International Energy Agency, Technology Roadmap: Biofuels for Transport. Updated
April 20, 2011 [retrieved November 20, 2014]. From:
http://www.iea.org/publications/freepublications/publication/name-3976-en.html
IEA, International Energy Agency, Technology Roadmap: Concentrating Solar Power.
Updated May 11, 2010 [retrieved June 19, 2020]. From:
https://webstore.iea.org/technology-roadmap-concentrating-solar-power
IEA, International Energy Agency, Technology Roadmap: Solar Heating and Cooling.
Updated July 9, 2012 [retrieved June 19, 2020]. From: https://webstore.iea.org/technology-
roadmap-solar-heating-and-cooling

59
IEA, International Energy Agency, Technology Roadmap: Solar Photovoltaic Energy –
2014 edition. Updated September 1, 2014 [retrieved October 20, 2014]. From:
http://www.iea.org/publications/freepublications/publication/technology-roadmap-solar-
photovoltaic-energy---2014-edition.html
IEA, International Energy Agency, Technology Roadmap: Smart Grids. Updated April 4,
2011 [retrieved November 30, 2014]. From: https://webstore.iea.org/technology-roadmap-
smart-grids
IEA, International Energy Agency, Technology Roadmap: Solar Thermal Electricity –
2014 edition. Updated September 1, 2014 [retrieved November 20, 2014]. From:
http://www.iea.org/publications/freepublications/publication/technology-roadmap-solar-
thermal-electricity---2014-edition.html
IEA, International Energy Agency, Technology Roadmap: Wind Energy. Updated October
16, 2013 [retrieved November 25, 2014]. From: https://webstore.iea.org/technology-
roadmap-wind-energy-2013
IEA, International Energy Agency, World Energy Outlook 2011. Updated November 1,
2011 [retrieved October 20, 2014]. From: https://www.iea.org/reports/world-energy-
outlook-2011
Institute for Energy Research. Updated January 23, 2013 [retrieved December 16, 2013].
From: http://www.instituteforenergyresearch.org/2013/01/23/germanys-green-energy-
destabilizing-electric-grids/
Internet World Stats – Usage and Population Statistics, Total Middle East, Population
(2018 Est.). Updated August 26, 2018 [retrieved January 16, 2019]
NBCNEWS, Read Greta Thunberg's full speech at the United Nations Climate Action
Summit. Updated September 23, 2019 [retrieved May 31, 2020] From:
https://www.nbcnews.com/news/world/read-greta-thunberg-s-full-speech-united-nations-
climate-action-n1057861

60
PRB, Population Reference Bureau, World Population Data Sheet 2018. Updated August
24, 2018 [retrieved January 6, 2020]. From: https://www.prb.org/2018-world-population-
data-sheet-with-focus-on-changing-age-structures/
Reuters, China to make national carbon trading 'breakthrough' by year-end: official.
Updated January 14, 2020. [retrieved June 3, 2020]. From
https://www.reuters.com/article/us-china-carbon/china-to-make-national-carbon-trading-
breakthrough-by-year-end-official-idUSKBN1ZD05N
SolarGIS, Geographical information system for solar energy industry. Updated January 1,
2020 [retrieved June 19, 2020]. From: http://solargis.info/doc/87
SolarPower Europe, Global Market Outlook for Solar Power 2017-2021. Updated May 1,
2017 [retrieved February 21, 2018]. From:
http://www.solarpowereurope.org/reports/global-market-outlook-2017/
SolarPower Europe, EU solar boom: over 100% solar market increase in 2019. Updated
December 10, 2019 [retrieved June 5, 2020]. From: https://www.solarpowereurope.org/eu-
solar-boom-over-100-solar-market-increase-in-2019/
Spiegel. Updated August 16, 2012 [retrieved December 16, 2013]. From:
http://www.spiegel.de/international/germany/instability-in-power-grid-comes-at-high-cost-
for-german-industry-a-850419.html
The World Bank Group, Data, OECD Members, Population. Updated January 16, 2018
[retrieved January 1, 2019]. From: https://data.worldbank.org/region/oecd-
members?view=chart
Time, Person of the Year 2019 – Greta Thunberg. Updated December 23, 2019 [retrieved
May 31, 2020]. From: https://time.com/person-of-the-year-2019-greta-thunberg/

61
United Nations, Framework Convention on Climate Change, Kyoto Protocol. Updated
January 1, 2020 [retrieved June 21, 2020]. From: https://unfccc.int/kyoto_protocol
WEC, World Energy Council, World Energy Resources: 2013 Survey. Updated October 1,
2013 [retrieved March 28, 2014]. From:
http://www.worldenergy.org/publications/2013/world-energy-resources-2013-survey/
Wikipedia, Greenpeace. Updated April 19, 2016 [retrieved April 23, 2016]. From:
https://en.wikipedia.org/wiki/Greenpeace
Wikipedia, Solar cell efficiency. Updated May 29, 2020 [retrieved June 19, 2020]. From:
https://en.wikipedia.org/wiki/Solar_cell_efficiency
World Population Review. Updated December 6, 2019 [retrieved January 6, 2020]. From:
http://worldpopulationreview.com/continents/the-middle-east-population/