EUROPE'S PHARMACEUTICAL INDUSTRY AN …aei.pitt.edu/49999/1/A9239.pdfEUROPE'S PHARMACEUTICAL...
81
- - - )( U,j uJ (..) EUROPEAN INNOVATION MONITORING SYSTEM (ElMS) ElMS PUBLICATION N° 32 EUROPE'S PHARMACEUTICAL INDUSTRY AN INNOVATION PROFILE BY SPRU, U Diversity of Sussex, UK EUROPEAN COMMISSION DIRECTORATE GENERAL XIII The Innovation Programme
Transcript of EUROPE'S PHARMACEUTICAL INDUSTRY AN …aei.pitt.edu/49999/1/A9239.pdfEUROPE'S PHARMACEUTICAL...

---)( U,j uJ (..)
EUROPEAN INNOVATION MONITORING SYSTEM (ElMS)
ElMS PUBLICATION N° 32
EUROPE'S PHARMACEUTICAL INDUSTRY
AN INNOVATION PROFILE
BY
SPRU, U Diversity of Sussex, UK
EUROPEAN COMMISSION
DIRECTORATE GENERAL XIII
The Innovation Programme


...
..
! w
I I
STUDY FINISHED ON:
ElMS Project N° 94/114
THIS STUDY WAS COMMISSIONED BY THE
EUROPEAN COMMISSION,
DIRECTORATE-GENERAL "TELECOMMUNICATIONS,
INFORMATION MARKET AND ExPLOITATION OF RESEARCH",
UNDER THE INNOVATION PROGRAMME
AUGUST96
© 1996, European Commission
{'15 b: Ytir/17
collsvs
Text Box
collsvs
Text Box

I
i
., I
' • !
..

Contents
Page
1 Introduction 1
2 Current Developments in the Pharmaceutical Industry 2
3 Major Market and Technology Trends 12
4 Firm Level Analysis 24
5 Biotechnology - A New Route to Drug Discovery 40
6 Alliances, Linkages and Technology Transfer 49 7 Conclusions 56
REFERENCES 61
Tables:
1: Trends in R&D Intensity of the Pharmaceuticals Sector 4 2: Major Take-overs 1990-1996 8 3: Top Twelve World Market Share with Newly Merged Companies 9 4: Health Expenditure and Pharmaceutical Consumption in Developed Countries 13 5: Pharmaceutical Production in Major World Markets 15 6: R&D Intensity by Industry 18 7: Trends in the Distribution of Pharmaceutical R&D 19 8: Trends in the Distribution of US Patenting in Pharmaceuticals 21 9: Top 50 Branded Products by Country of Origin 23 10: Company Rankings by sales 1993 26 11: Changing Places -the world's top 20 pharmaceutical corporations 1976-94 27 12: Seller Concentration Ratios in the Pharmaceutical Industry 30 13: Top 20 companies in terms of Pharmaceutical R&D expenditures 31 14: Company market share in Europe, United States and Japan 34 15: Geographic Location of Pharmaceutical Firms' US Patenting Activities 37 16: Top Non-national firms patenting in Europe 38 17: Top Ten Biotechnology drugs on the Market in 1993 48 18: Alliances and Joint Ventures between US DBFs and leading European
multinationals 50 19a: US-DBFs involved in biotechnology alliances 1982-91
' ' . 19b: Biotechnology Alliances 1992-94 20: Linkages between US-based facilities of European and Japanese companies 54 21: Collaboration through publication - company profiles 55

' ~ I ,. I l
I
• j
i
-I
i . ' j
•
•
' .
ElMS 94/114
EUROPE'S PHARMACEUTICAL INDUSTRY:
AN INNOVATION PROFILE
Margaret Sharp, Pari Patel and Keith Pavitt
August 1996
Final Report prepared for DG XIII - D-4 Contract: ElMS 94/114
Margaret Sharp/Pari Patel Senior Fellow/Research Fellow Science Policy Research Unit Mantell Building · University of Sussex Falmer BRIGHTON BN19RF Tel: +44 1273 678169 Fax: +44 1273 685865 e-mail: [email protected]

. ~
i
collsvs
Text Box
' .
''
..
1
1 INTRODUCTION
1.1 The main objective of the study is to describe and explain intra-industry differences of
innovative performance in the pharmaceutical industry (NACE 2423) across European
countries.
1.2 One of the reasons for focusing on the pharmaceutical industry is that in sectoral
comparisons of innovative performance between Europe, Japan and the USA, it emerges as
one of the main areas of strength for Europe. It is a science-based industry with high levels
of R&D intensity. Europe's capabilities date back to the late nineteenth century when the
German chemical company, Bayer became the first major company to develop in-house R&D
facilities which in turn became an internal 'engine' for innovation. Since then, German and
Swiss companies have continued to be major players in the pharmaceutical industry,
challenged in the post-war period by their US counterparts and more recently by the sharp
rise ofUK-based companies such as Glaxo. Cut backs in health care budgets combined with
new routes to drug discovery being introduced as a result of new biotechnology-driven
methodologies are currently stimulating major changes in both structure and strategy, with
external sub-contracting of R&D and new product development becoming a more usual
phenomenon than in the past.
1.3 This report uses publicly available qualitative and quantitative information to map a
number of key trends in the industry since the 1980s:
• Rising health care costs
• Rising R&D intensity
• Increasing globalisation of R&D
• Increasing use of external sources of knowledge: alliances, mergers and
acquisitions
• The rise of biotechnology
2
1.4 Its main aim is to examine how the innovative performance and strategies of
European firms have been affected by these trends with the focus being a comparison
between the leading European firms and their American and Japanese counterparts.
1.5 The report begins by identifying the main current developments in the pharmaceutical
industry world-wide (in section 2) which have led to a squeeze on profits. In Section 3 the
main consumptiof and production trends at the national level are identified. Section 4 uses
publicly available data to make comparisons of technology and market trends at the firm
level. The strategies of European companies on how to cope with the rise of biotechnology is
focus of sections 5 and 6. Section 7 contains some conclusions and policy recommendations.
2 CURRENT DEVELOPMENTS IN THE PHARMACEUTICAL INDUSTRY WORLD-WIDE
2.1 The pharmaceutical industry is one of Europe's success stories. Emerging in the late
nineteenth century as an adjunct to the chemical industry, it was for many years dominated by
German and Swiss firms. After World War II the American industry emerged as a strong
player, taking advantage of the incapacity of the German industry in the aftermath of the war
and establishing itself, via subsidiaries, in many European markets. By the 1960s German
companies had re-established themselves but failed to regain their pre-war market share.
Since the 1960s it has been the British firms that have seen the strongest gains and this has
helped to restore the European position. In 1995, of the 20 top ranking companies in terms of
sales, 10, including the top two slots, were European firms, seven American and three
. Japanese.
2.2 In spite of its record of success, the European pharmaceutical industry is highly
pessimistic about its future. Briefly, the main reason for this is that costs, especially R&D,
are rising, and revenues are falling, resulting in a squeeze on profits. For an industry which
• I
' - I
I
I * ! - i
i
' I I
• r . I !
• !
i'
' .
3
has enjoyed above average profits for a considerable period of time, this is an uncomfortable
situation. It is worth exploring the developments which lie behind these trends.
High and rising levels of R&D intensity
2.3 Table 1 gives details of R&D intensity in the industry since the early 1970s. While
there are significant differences between coUhtries (which can to some extent be explained, as
we shall see, by the degree to which the industry in that country is dominated by the leading
fmns in the industry) the other notable feature of the table is the rise in R&D intensity over
time. Whereas in the 1970s, R&D intensity averaged 7-8 per cent in the leading drug
producing countries (USA, Germany, Switzerland, UK and France) by the 1990s it averaged
10-12 per cent. There are two main explanations for these trends:
1 Increased regulatory requirements - over time safety checks on drugs have become
more and more rigorous and time consuming. In the 1960s many compounds being
tested were anti-infectives whose efficacy was readily apparent within a short time
frame. Drugs now being developed increasingly target the chronic long term diseases
such as cancer, heart disease and ageing, where efficacy takes time to judge and, more
importantly, where side effects sometimes take years to become apparent. Regulatory
authorities are becoming tougher; tests are more complicated and the time required to
bring the drug to market is longer;
2 Diminishing returns to drug discovery- in the 1950s and 1960s, the so-called 'golden
age' of drug discovery, new compounds for testing suggested themselves fairly readily
and a number of major breakthroughs emerged from the exploitation of the properties
of families of compounds such as the histamines, steroids, penicillin and the
cephalosporins. As time went by all the ready targets had been investigated and the
search had to be extended over a wider field and was therefore necessarily more
expensive. The more targeted approaches to drug discovery, pioneered by Sir James
Black with beta-blockers and cimetadine, helped to stave off diminishing returns, but

Table 1 Trends in R&D Intensity of the Pharmaceuticals Sector in selected OECD Countries: 1973 to 1992
1973 1974 1975 1976 1977 1978 1979 1980 1981 1982 1983 1984 1985 1986 1987 1988 1989 1990 1991 1992
Sweden 18.6 15.2 14.6 17.4 20.0 19.1 19.7 18.7 18.1 17.1 17.7 23.5 27.8 28.4 24.3 23.2 27.1 27.2 28.8 30.4 Denmark 12.2 10.6 9.4 9.3 9.1 9.7 9.9 8.9 8.7 9.4 9.5 9.7 9.1 10.0 10.2 12.2 14.3 16.4 18.3 18.0 UK 7.8 7.2 7.5 8.3 8.0 8.5 10.3 10.6 11.2 11.2 11.5 11.6 11.6 11.8 13.3 14.4 14.5 16.8 14.9 16.3 USA 7.9 8.0 8.8 8.4 7.8 8.0 8.9 9.1 9.5 10.2 10.6 11.4 11.0 10.4 10.6 13.1 12.8 12.7 fl.5 14.3 Finland 9.7 9.5 10.0 7.8 8.0 7.7 8.4 9.3 10.2 12.3 12.8 10.7 11.3 14.4 13.5 13.3 13.0 13.6 12.3 12.1 Netherlands 9.0 8.7 9.9 10.7 10.5 10.5 10.1 9.8 9.3 9.7 9.3 9.3 9.3 10.5 10.7 12.7 12.1 12.2 10.1 10.5 Japan 4.0 4.3 4.7 5.0 4.9 4.8 6.1 5.6 5.7 5.8 6.7 6.9 7.8 7.3 7.5 7.7 7.9 8.6 9.8 9.8 Germany 7.6 7.8 8.1 8.3 7.7 9.7 9.9 8.7 7.5 8.5 8.4 7.4 7.4 7.9 9.6 9.6 9.5 9.2 9.1 9.2 France 5.2 5.1 5.3 5.5 5.6 5.6 6.2 6.3 6.6 7.0 7.1 7.6 8.1 7.9 8.4 7.9 8.3 8.8 9.0 8.7 Italy 4.0 5.1 5.1 4.7 4.9 5.2 5.7 5.4 7.2 6.8 7.6 6.5 6.3 6.5 6.3 6.3 6.3 6.3 6.3 8.1 Canada 3.2 3.1 3.1 3.1 3.0 2.7 2.9 3.5 3.6 3.7 3.7 3.2 3.3 3.9 3.3 3.9 4.9 6.4 6.4 6.4 Australia 4.1 3.7 3.2 2.9 3.0 2.8 2.3 2.0 . 2.0 2.1 2.3 3.4 4.0 4.6 6.0 6.5 6.0 6.0 5.3 5.2
~
Total R&D as a proportion of gross output
Source: OECD
' 1 , ______ ,_.., _____ ~ -----., . .,_, • ~---------- •• ~- _,.,. -•-• .-. . .,. ·--,.-_ -·--•-r- -"" -----···--~ .... --~.--.-·-- ~ ---- __ ,..... ~-·- --~-------~--------·- ............. ...-... ____ _
collsvs
Text Box

5
the hope that biotechnology would short circuit the process and open up a whole new
range of cheap and easy targets proved ill-founded. On the contrary, biotechnology
has to date proved an even more expensive route to drug discovery.
2.4 A recent report from Lehmann Brothers1 suggests that R&D costs have now become
untenable. They calculate that it now costs $187 million ($120m grossed up over the 8-10
years taken) on average to launch a successful new drug. If allowance is made for R&D
which goes into drugs which fail to make the grade, then the cost goes up to $359 million.2
Even to break even requires profitable sales for 10 years with peak sales of at least $260
million. Lehmann Bros calculate that to obtain a 15 per cent rate of return on the $22.7
billion spent by the pharmaceutical industry on R&D in 1993 requires growth of 13 per cent
per annum. As such growth rates are not feasible in the current market conditions, the
conclusion has to be that current levels of R&D are untenable and that some way has to be
found to cut the costs of new drug development.
Pressures to cut health care costs
2.5 Company profits have come under pressure from another source in recent years. With
the exception of the US, the main funder of health services in developed countries is the
public sector (see below Table 4). A combination of slow growth, rising unemployment and
an ageing population has put intense pressure on welfare budgets at a time when the
buoyancy of tax and social security revenues has disappeared. Governments have sought to
make savings and the high prices (and high profits) of the pharmaceutical companies
provided an obvious target. In Germany, for many years one of the few countries in Europe
where there were no controls over drug prices, stringent controls were introduced and doctors
have been enjoined (as they had earlier in the UK) to limit prescribing to a 'limited list' of
I PhannaPipelines: Implications of Structural Change for retunl$ in the phannaceutical industry Lehmann Bros Phannaceutical Research London. June 1995 2This was the figure quoted by the Office of Technology Assessment in their recent survey of innovation in the phannaceutical industry.
6
branded pharmaceuticals and to use generics where possible. Even in the US, where health
care is largely privately funded, the costs of supporting the publicly funded Medicaid (for low
income families) and Medicare (for the elderly}have become insupportable, and the soaring
costs of private health insurance led to health care reform being one of the main issues in the
1992 Presidential election. As might be expected, the pharmaceutical industry in America
was amongst the most vociferous opponents of Mrs Clinton's reform proposals.
The search for savings - mergers, acquisitions and managed care organisations
2.6 The response of the pharmaceutical industry to these pressures has been to look on the
one hand for savings, particularly in R&D expenditures, and on the other for unexploited I
areas of profitability. The first has led in a number of different directions:
1 Extending patent lifo - as regulatory procedures lengthened the time needed for
clinical trials so the effective life of patents had been eroded. In the 1960s when a 5-7
year period of discovery/development was common, a 20 year patent enabled the
company introducing a new drug to reap 'premium' profits for 13 years provided no
major competitors emerged. Development times of 10-12 years cut 'effective patent
life' back to 10 or 8 years. A concerted campaign by American companies in the
1980s secured an extension of patent life by 5 years for products affected by such
delays, and this was followed by similar moves in Europe. The recent GATT round
harmonized US patent laws with those of other countries and makes the patent start
from the time when the patent is filed (previously in the US it had been from the time
it was granted). However, the provision for the five year extension remains where
there are undue delays in the patenting process.
2 Parallel trials and simulations - in seeking savings in the R&D process, many drug
companies have experimented with ways of short circuiting the lengthy development
period. Increasing use is being made of molecular modelling techniques which enable
companies to simulate the effects of drugs. Such developments have been particularly
i - I
• >
' >
< ! i
..
:' .
7
useful in the early phase of development but (rightly) cannot substitute for clinical
trials at later stages. It has, however, provided for effective screening and companies
making extensive use of the process (eg Glaxo, Zeneca) claim that it is highly cost
effective in helping to slim the number of drugs under development. At the same
time, companies moving into clinical trials, which have normally been undertaken on
a sequential basis, are 'doubling up' and running two trials in parallel. This, too,
seems to have been effective and companies are reporting a time saving of up to three
years on development times.l
3 Collaborations - an increasing number of products are being licensed-in by
pharmaceutical companies as a response to the emergence of biotechnology and the
need to cut costs. Where two companies cooperate in the development of a new drug,
development costs are shared. Traditionally pharmaceutical companies have not liked
such collaborations. In the last few years, 'vertical collaborations' between large
companies and small specialist firms (eg biotech companies) have become common.
At the same time cost pressures are now making 'horizontal' collaborations between
large companies at the R&D stage of development much more routine.4
4 Mergers - the logic that underlies collaborations leads inevitably to mergers. Given
the relatively small (world) market share enjoyed by even the largest companies,
pressure on profit margins has been the underlying factor in the large number of
mergers in the sector in recent years. In 1989 the first of the 'mega-mergers' involved
mainly US companies: Bristol Myers with Squibb, Smith Kline with the UK's
Beecham, and Dow with the mid-size US company Marion Merrell, and in 1990
Rhone Poulenc acquired Rorer. The recession brought a lull, but 1994 and 1995 have
seen a renewal of merger activity, the largest being Glaxo's take-over in early 1995 of
their fellow UK company, Wellcome for $14.5bn and the agreed merger of Sandoz
with Ciba Geigy to form the new Swiss company, Novartis (see Table 2). Although
3see David Bloom: 'Mergers and the Future of R&D- big is not always beautiful', Scrip Magazine, July/August 1994, pp 20-21 and Roger Longman: 'Pharmatactics in an age of strategic diversity', Scrip Magazine, October 1995, pp 30-34. 4See Roger Longman, op cit.

8
Table 2 Major Take-overs 1990-1996
Year Target
1990 Rorer 1994 Sterling Health 1 1994 Syntex 1994 American Cynamid 1994 Sterling Heatth2
1995 Wellcome 1995 Marion Merrell Dow 1995 Boots 1995 Fisons 1995 Pharmacia 1966 Sandoz
Buyer
Rhone Poulenc ElfSanofi Hoffmann LaRoche American Home Prod SmithKline Beecham
Glaxo Hoechst BASF Rhone Poulenc Rorer Upjohn CibaGeigy
Price
$3bn $1.8bn $5.1bn $9.7bn $2.9bn
£8.9bn (c $14bn) $7.1bn $1.3bn $2.7bn Agreed merger Agreed merger
Mergers involving biotechnology companies 1990 Genentech ( 60%) Roche 1991 Cetus Chiron 1993 Synergen Amgen 1994 Chiron (49.9%) Ciba Geigy 1995 Affymax Glaxo
$2.1bn $650m3 $260m3 $2.1bn $0.5bn
1 This consists of just the prescription drug division of Sterling Health. 2 SKB acquired the OTC division of Sterling Health. It subsequently sold theN American part
of the operation (including Bayer's aspirin) to Bayer for $1 billion. 3 These two cases were of one biotechnology firm acquiring another one.
American Cyanamid's take-over by American Home Products was a US: US merger,
Glaxo:Wellcome a UK: UK affair and Sandoz:Ciba Geigy and all Swiss merger, the
remaining seven mergers recorded in Table 2 have been cross-Atlantic, with the
European firm the more pro-active partner. The overall result of all this merger
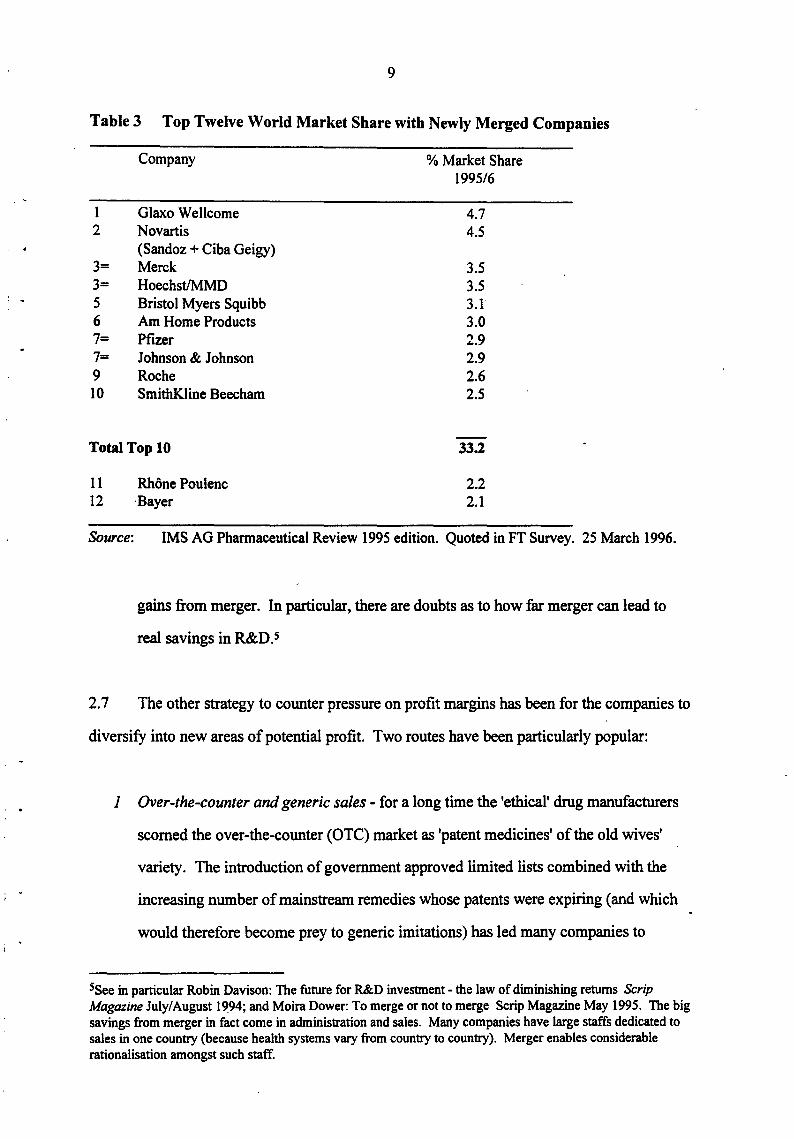
activity has been a considerable increase in concentration. The top ten companies
now control33 per cent of the world market (Table 3). They enjoyed an average
profit margin of 18 per cent and an R&D investment totalling $9.8 billion. (Scrip
Magazine, May 1995, p 25). Nevertheless, there is considerable scepticism as to how
far mergers will lead to cost savings. Many commentators point to the relatively
higher profit record of the non-merged companies, the disruption and extra
administration costs caused by merger and conclude that there may be few if any
I i ' I j
I I I l
I • i
l f
! . ' r ' i
,. i
.. i I l ' . \
I . ' ~
I
l
9
Table 3 Top Twelve World Market Share with Newly Merged Companies
Company % Market Share 1995/6
1 Glaxo Wellcome 4.7 2 Novartis 4.5
(Sandoz+ Ciba Geigy) 3= Merck 3.5 3= Hoechst/MMD 3.5 5 Bristol Myers Squibb 3.1' 6 Am Home Products 3.0 7= Pfizer 2.9 7= Johnson & Johnson 2.9 9 Roche 2.6 10 SmithKiine Beecham 2.5
Total Top 10 33.2
11 12
Rhone Poulenc ·Bayer
2.2 2.1
Source: IMS AG Pharmaceutical Review 1995 edition. Quoted in FT Survey. 25 March 1996.
gains from merger. In particular, there are doubts as to how far merger can lead to
real savings in R&D. s
2. 7 The other strategy to counter pressure on profit margins has been for the companies to
diversify into new areas of potential profit. Two routes have been particularly popular:
1 Over-the-counter and generic sales - for a long time the 'ethical' drug manufacturers
scorned the over-the-counter (OTC) market as 'patent medicines' of the old wives'
variety. The introduction of government approved limited lists combined with the
increasing number of mainstream remedies whose patents were expiring (and which
would therefore become prey to generic imitations) has led many companies to
Ssee in particular Robin Davison: The future for R&D investment - the law of diminishing returns Scrip Magazine July/ August 1994; and Moira Dower: To merge or not to merge Scrip Magazine May 1995. The big savings from merger in fact come in administration and sales. Many companies have large staffs dedicated to sales in one country (because health systems vary from country to country). Merger enables considerable rationalisation amongst such staff.

10
reconsider their positions. Far from being pressured to keep drugs on prescription,
governments were confronted by requests to allow low dosage. non-prescription
formulations for drugs such as Tagamet and Zantac. With patents expiring the
companies have been anxious to keep as much of the branded market as possible;
equally, where price discrimination is possible (and regulation fragments markets)
they have been more than willing to play this game (which helps to explain the very
considerable price variations across Europe). So far the UK and German governments
have been more inclined to accede to the companies requests than the US authorities.
Simultaneously there has been revived interest in the OTC operations, the biggest deal
being in I ?94 when SmithKline Beecham bought Sterling 's substantial ($2.9bn) OTC
business from Kodak, only to sell off the North American side to Bayer (which
thereby regain~d its name and trademark inN America for the first time since 1939).
2 Pharmacy Benefit Management and Managed Care - with reforms in the US health
care system encouraging the development of health maintenance organisations
(HMOs),6 a number of pharmaceutical companies sought to pre-empt the system by
allying themselves with the suppliers of care. Merck was the first big company to
move in this direction by means of a $6.6 billion deal in 1993 with Medco, one of the
largest suppliers of drugs to the HMOs. This was followed in 1994 by further deals
involving SmithKline Beecham, Pfizer, Bristol Myers Squibb and Lilly. With 115 I
million people in the US in HMO plans in 1994, the implications of their being tied
into purchasing from specific pharmaceutical companies caused interest from the US
anti-trust authorities, who rapidly indicated that they would not look favourably upon
any purchasing restrictions imposed on HMOs and demanded that their consent was
obtained to any further mergers. 7 This rapidly put a damper on what had seemed,
briefly, to be a strategy about to transform the whole of the pharmaceutical industry.
6Integrated health care organisations where physicians are linked into hospital groups to offer the individual a 'managed care' package for an annual per capita payment - given the high costs of health insurance, many individuals and companies found such packages to be preferable. 'See G Tobias and N Faigan: 'US reform is dead -long live reform', Scrip Magazine, January 1995, pp 16-18.
I • t
;
! . I
'
I . l
l I
I I
. I I I
! •
I ' I
11
3 Pharma-economics -links between the pharmaceutical companies and the HMOs has
led to the development of another new promotional idea - phanna-economics. Given
an organisation such as an HMO (or the NHS in Britain - which has been for a long
time the equivalent of a national HMO) with a relatively stable population of patients,
it is possible to track the long term response to different types of care and medication.
By using patient records in this way, the companies hope (a) to show that drug
therapy can be just as cost effective, if not more cost effective, than other forms of
intervention; and (b) to identify which types of drug therapy are the most cost
effective.
The pharmaceutical industry in the 1990s
2.8 The upshot of these trends has been to create turmoil in an industry which for years
has been remarkable for its stability. As we shall see when we discuss firm level data, some
thirty firms have dominated the 'ethical' or prescription drug industry for the last fifty years.
While some have changed pl~es within this cohort, the group as a whole have remained
surprisingly constant. Now these old certainties are breaking. The search for cost savings is
driving trends towards merger. Changes in technology, particularly the advent of
biotechnology and new routes to drug discovery, have destroyed the unique advantage of the
former R&D departments - mastery of synthetic organic chemistry; created a new cultural
divide within companies (between chemistry and biology) and caused many, for the first
time, to look beyond their own internal resources for new ideas and new competencies. The
following sections explore these developments in more detail focusing in particular on the
European industry and its innovative record.
12
3 MAJOR MARKET AND TECHNOLOGY TRENDS
Consumption
3.1 The European Union (EU) grouping of 15 countries now constitutes the world's
largest market for pharmaceuticals. Table 4 shows that total consumption for the EU 15
using 1989 figures totalled over 57 BECUs, compared to 50 BECUs for the United States and
36 BECUs for Japan. Within the EU, the largest markets are Germany (14.7 BECUs) and
France (13 BECUs), followed by Italy (10.9 BECUs) with the UK (5.9 BECUs).
3.2 In terms of per capita consumption, the United States at 200 ECUs per head is
relatively modest compared to Japan at 295, Germany 240 and France at 233 ECUs per head.
As might be expected the poorest countries of the EU, Greece, Portugal and Ireland have the
lowest per capita expenditure (59, 54, and 68 ECUs per head respectively). However,
Norway (105), the UK (104) and the Netherlands·(111) all record well under half German per
capita expenditures and illustrate that it is not always the poorest who spend least. Indeed,
expenditures per capita depend to a considerable degree upon the type of health delivery
system and, in particular, the price regimes within such systems. The Brit~sh National Health
Service (NHS), for example, not only regulates the prices that may be charged for
pharmaceuticals through the Pharmaceutical Price Regulation Scheme (PPRS) but also limits
the range of products that may be prescribed, encouraging the use of generics wherever
possible. By contrast, in Japan most doctors still dispense their own prescription drugs, on
which they take a percentage mark-up, and therefore have a built-in incentive to prescribe the
must expensiv~. The variations in terms of ex-factory prices (Column 3 of Table 4) are even
greater, again reflecting the different regimes operating in the different countries,s and
illustrating how far the EU has to go to achieve a single market in pharmaceuticals (and why
manufacturers are so worried about parallel importing).
BThe British NHS, for example, has always had considerable clout in its negotiations because it was the main purchasing authority for the whole of Britain
r - I
i
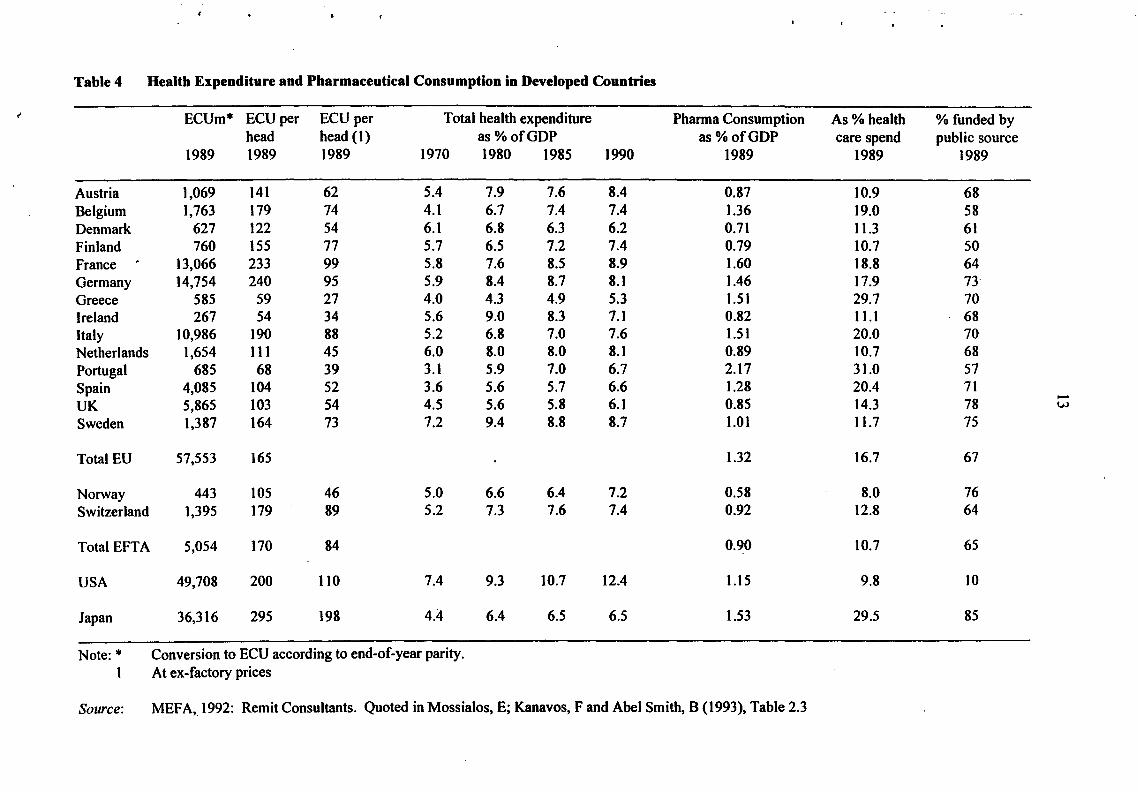
Table 4 Health Expenditure and Pharmaceutical Consumption in Developed Countries
t' ECUm* ECU per ECU per Total health expenditure Pharma Consumption As% health %funded by head head (1) as%ofGDP as%ofGDP care spend public source
1989 1989 1989 1970 1980 1985 1990 1989 1989 1989
Austria 1,069 141 62 5.4 7.9 7.6 8.4 0.87 10.9 68 Belgium 1,763 179 74 4.1 6.7 7.4 7.4 1.36 19.0 58 Denmark 627 122 54 6.1 6.8 6.3 6.2 0.71 11.3 61 Finland 760 155 77 5.7 6.5 7.2 7.4 0.79 10.7 so France . 13,066 233 99 5.8 7.6 8.5 8.9 1.60 18.8 64 Germany 14,754 240 95 5.9 8.4 8.7 8.1 1.46 17.9 73 Greece 585 59 27 4.0 4.3 4.9 5.3 1.51 29.7 70 Ireland 267 54 34 5.6 9.0 8.3 7.1 0.82 11.1 68 Italy 10,986 190 88 5.2 6.8 7.0 7.6 1.5 I 20.0 70 Netherlands 1,654 111 45 6.0 8.0 8.0 8.1 0.89 10.7 68 Portugal 685 68 39 3.1 5.9 7.0 6.7 2.17 31.0 57 Spain 4,085 104 52 3.6 5.6 5.7 6.6 1.28 20.4 71 UK 5,865 103 54 4.5 5.6 5.8 6.1 0.85 14.3 78
...... w
Sweden 1,387 164 73 7.2 9.4 8.8 8.7 1.01 11.7 75
Total EU 57,553 165 1.32 16.7 67
Norway 443 105 46 5.0 6.6 6.4 7.2 0.58 8.0 76 Switzerland 1,395 179 89 5.2 7.3 7.6 7.4 0.92 12.8 64
Total EFTA 5,054 170 84 0.90 10.7 65
USA 49,708 200 110 7.4 9.3 10.7 12.4 1.15 9.8 10
Japan 36,316 295 198 4.4 6.4 6.5 6.5 1.53 29.5 85
Note:* Conversion to ECU according to end-of-year parity. 1 At ex-factory prices
Source: MEFA,_1992: Remit Consultants. Quoted in Mossialos, E; Kanavos, F and Abel Smith, B (1993), Table 2.3
14
3.3 The remaining columns in Table 4 go further to illustrate the variations in health
regime between countries. The United States now spends 12.4 per centofGDP on health
expenditures, compared to the EU's lowest, Greece, at 5.3 per cent but with the UK (6.1 per
cent) and Denmark (6.2) the next lowest spenders. Every country, except Denmark, has seen
a considerable rise in health care expenditures as a per cent of GDP over the course of the last
two decades, but there is some evidence that the rise has been slower in the last decade
(almost certainly reflecting the tightness of public sector budgets). There are interesting
variations in the proportion of the health budget devoted to pharmaceuticals. In the EU,
Greece and Portugal top the list with 29.7 and 31 per cent respectively, a figure matched by
Japan at 29.5 per cent, whereas the US records a figure of 10.7 per cent. Within the EU, the
Scandinavian countries and Austria show the lowest percentages at approximately the 10 per
cent mark, with Britain somewhat higher at 14.3 per cent. Britain has the highest share of
pharmaceutical expenditures funded by the public sector (78 per cent) and Finland has the
lowest at 50 per cent. The EU 15 average was 66 per cent as of 1989.
Production
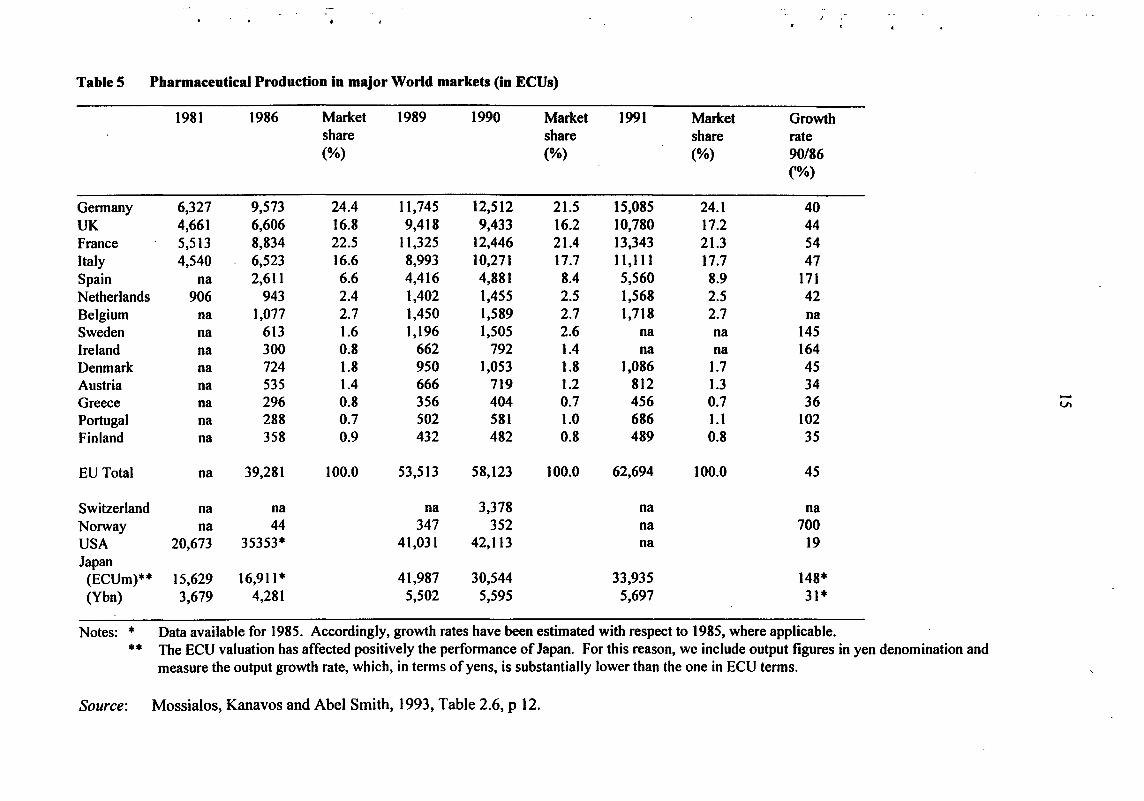
3.4 Table 5 shows the production of pharmaceuticals within the EU, compared to the US
and Japan. The EU15, as a whole, top the world production league, with 58 BECUs in 1990
compared to 42 BECUs in the United States and 30 BECUs in Japan.9 These figures include
the production of foreign multinationals within the respective countries so that, for example,
the British figure includes the of production of companies such as Merck or Pfizer in Britain.
The figures indicate that the EU15, as a whole, is a marginal net importer from the rest of the
world. 10
91990 figure which gives a better idea of relativities than 1989 figure. See footnote to Table 5 about yen!ECUs values. IOJn 1989 production in the EU 15 was 54.5 BECUs and consumption was 57.1 BECUs. Including Switzerland, Europe as a whole becomes a net exporter. Switzerland however publishes remarkably few statistics which make it very difficult to make precise comparisons.
i • I
'
i I
- I I
• !
' .
TableS Pharmaceutical Production in major World markets (in ECUs)
1981 1986 Market 1989 1990 Market 1991 Market Growth share share share rate (%) (%) (%) 90/86
('%)
Germany 6,327 9,573 24.4 11,745 12,512 21.5 15,085 24.1 40 UK 4,661 6,606 16.8 9,418 9,433 16.2 10,780 17.2 44 France 5,513 8,834 22.5 ll,325 12,446 21.4 13,343 21.3 54 Italy 4,540 6,523 16.6 8,993 10,271 17.7 11,1ll 17.7 47 Spain na 2,611 6.6 4,416 4,881 8.4 5,560 8.9 171 Netherlands 906 943 2.4 1,402 1,455 2.5 1,568 2.5 42 Belgium na 1,077 2.7 1,450 1,589 2.7 1,718 2.7 na Sweden na 613 1.6 1,196 1,505 2.6 na na 145 Ireland na 300 0.8 662 792 1.4 na na 164 Denmark na 724 1.8 950 1,053 1.8 1,086 1.7 45 Austria na 535 1.4 666 719 1.2 812 1.3 34 Greece 296 0.8 356 404 0.7 456 0.7 36 -na Vl
Portugal na 288 0.7 502 581 1.0 686 1.1 102 Finland na 358 0.9 432 482 0.8 489 0.8 35
EU Total na 39,281 100.0 53,513 58,123 100.0 62,694 100.0 45
Switzerland na na na 3,378 na na Norway na 44 347 352 na 700 USA 20,673 35353* 41,031 42,113 na 19 Japan
(ECUm)** 15,629 16,911* 41,987 30,544 33,935 148* (Ybn) 3,679 4,281 5,502 5,595 5,697 31*
Notes: * Data available for 1985. Accordingly, growth rates have been estimated with respect to 1985, where applicable.
•• The ECU valuation has affected positively the performance of Japan. For this reason, we include output figures in yen denomination and measure the output growth rate, which, in terms of yens, is substantially lower than the one in ECU terms.
Source: Mossialos, Kanavos and Abel Smith, 1993, Table 2.6, p 12.
16
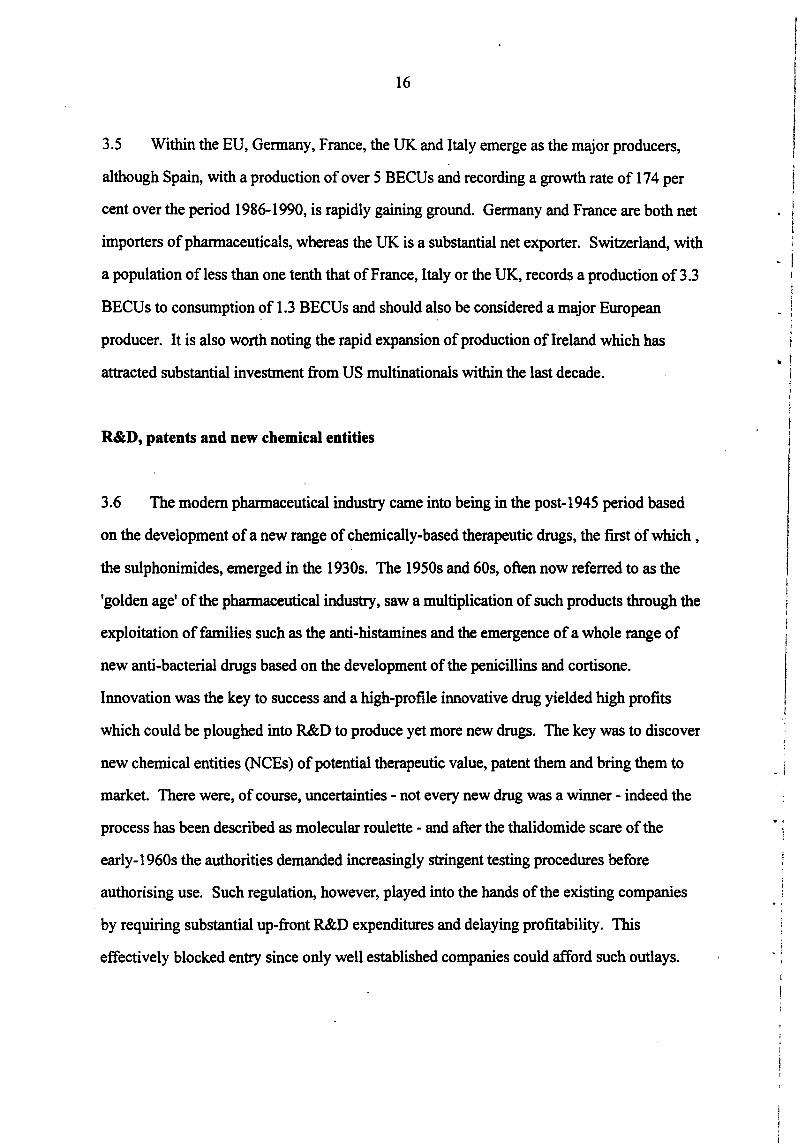
3.5 Within the EU, Germany, France, the UK and Italy emerge as the major producers,
although Spain, with a production of over 5 BECUs and recording a growth rate of 174 per
cent over the period 1986-1990, is rapidly gaining ground. Germany and France are both net
importers of pharmaceuticals, whereas the UK is a substantial net exporter. Switzerland, with
a population of less than one tenth that of France, Italy or the UK, records a production of3.3
BECUs to consumption of 1.3 BECUs and should also be considered a major European
producer. It is also worth noting the rapid expansion of production of Ireland which has
attracted substantial investment from US multinationals within the last decade.
R&D, patents and new chemical entities
3.6 The modem pharmaceutical industry came into being in the post-1945 period based
on the development of a new range of chemically-based therapeutic drugs, the first of which,
the sulphonimides, emerged in the 1930s. The 1950s and 60s, often now referred to as the
'golden age' of the pharmaceutical industry, saw a multiplication of such products through the
exploitation of families such as the anti-histamines and the emergence of a whole range of
new anti-bacterial drugs based on the development of the penicillins and cortisone.
Innovation was the key to success and a high-profile innovative drug yielded high profits
which could be ploughed into R&D to produce yet more new drugs. The key was to discover
new chemical entities (NCEs) of potential therapeutic value, patent them and bring them to
market. There were, of course, uncertainties - not every new drug was a winner - indeed the
process has been described as molecular roulette - and after the thalidomide scare of the
early-1960s the authorities demanded increasingly stringent testing procedures before
authorising use. Such regulation, however, played into the hands of the existing companies
by requiring substantial up-front R&D expenditures and delaying profitability. This
effectively blocked entry since only well established companies could afford such outlays.
I • I
! ' I
. I
• l
' . '

17
3.7 Pharmaceutical companies thus invest in R&D:
(i) in order to discover/invent innovative new drugs which will give 'first mover'
advantages and bring appropriate monopoly profits;
(ii) in order to prevent competitors from enjoying too great a profit from such first
mover advantage;
(iii) in order to meet the stringent regulatory requirements in relation to the
toxicological and clinical testing of any drug and to prepare the drug in other ways
for market - eg in terms of formulation and dosage requirements;
Items (i) and (ii) might properly be described as 'research' whereas (iii) comes closer to
development. The whole process seldom lasts less than eight years and more frequently lasts
10 to 12 years. Estimates of the cost vary, but allowing for failures, the OTA (1993) put the
cost higher at $359m.u
3.8 Given these costs it is hardly surprising to find that the pharmaceutical industry is
characterised as highly R&D intensive, or that the proportion of sales devoted to R&D has
been increasing over time (as the regulatory hurdles have increased). Table 6 (together with
the earlier Table 1) shows that pharmaceuticals, together with electronics and aerospace, tops
the R&D league tables among industries.
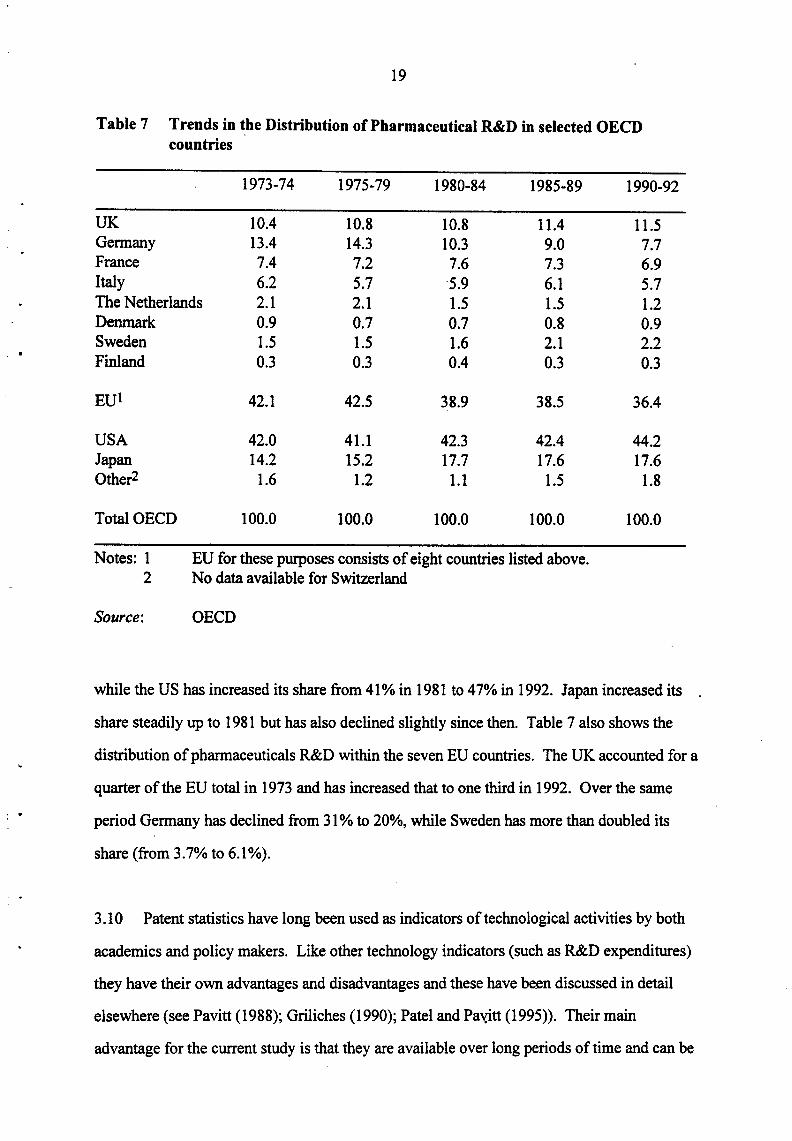
3.9 Table 7 examines ~e trends in the distribution of R&D expenditures among seven
European countries for which time series R&D data are available and compares European
performance with that of the US, Japan, Canada and Australia. The total expenditures (in
current prices) of these countries have risen from $1.7 billion12 in 1973, to $5.1 billion in
1981, and to $18.7 in 1992. Until the early 1980s the EU accounted for roughly the same
proportion of this total as the US (around 40%), but this has declined in the last 15 years,
11 It is estimated that for every 100, 000 compounds screened as possible new therapeutic agents, only 100 make to further investigation, only 10 to clinical trials and only one to be launched as a drug. The figure quoted takes account of the costs associated with the screening and testing of the 99,999 other molecules! Dimasi eta/ ( 1991) put the cost somewhat lower than the FDA - at $250m. 12All national currency data converted to US dollars using Purchasing Power Parities
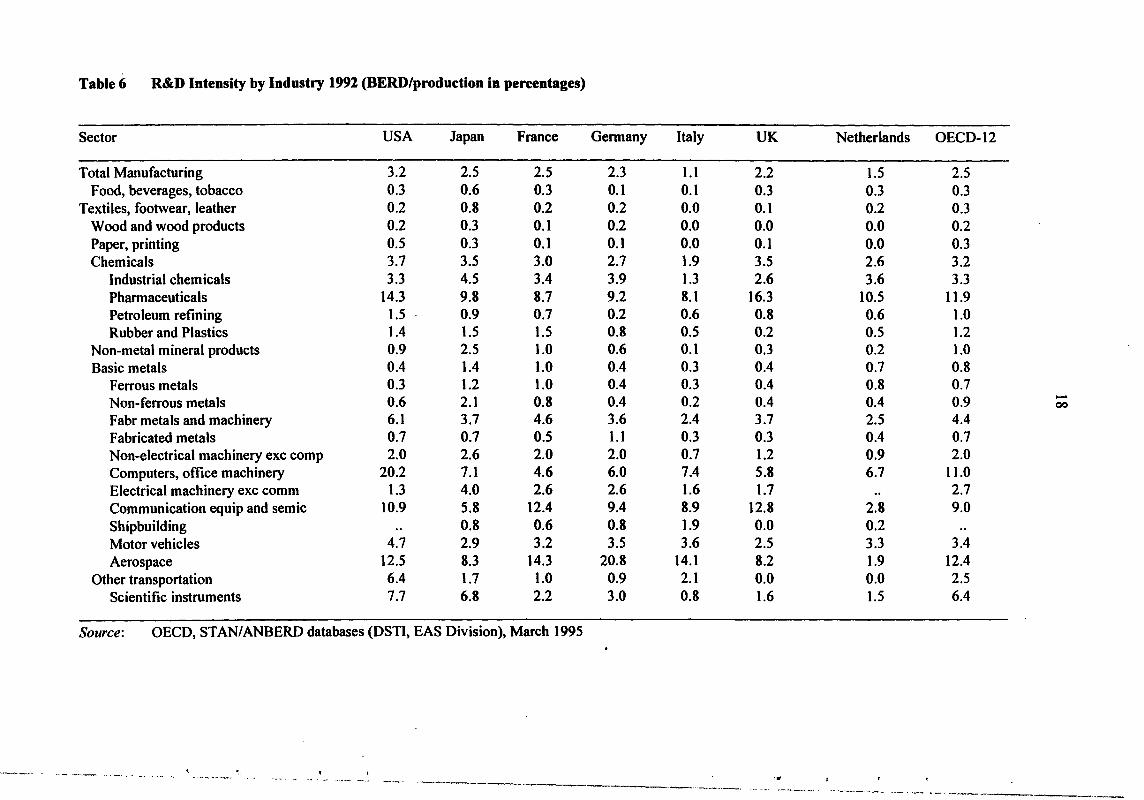
Table6 R&D Intensity by Industry 1991 (HERD/production in pereentages)
Sector USA Japan France Germany Italy UK Netherlands OECD-12
Total Manufacturing 3.2 2.5 2.5 2.3 1.1 2.2 1.5 2.5 Food, beverages, tobacco 0.3 0.6 0.3 0.1 0.1 0.3 0.3 0.3
Textiles, footwear, leather 0.2 0.8 0.2 0.2 0.0 0.1 0.2 0.3 Wood and wood products 0.2 0.3 0.1 0.2 0.0 0.0 0.0 0.2 Paper, printing 0.5 0.3 0.1 0.1 0.0 0.1 0.0 0.3 Chemicals 3.7 3.5 3.0 2.7 1.9 3.5 2.6 3.2
Industrial chemicals 3.3 4.5 3.4 3.9 1.3 2.6 3.6 3.3 Pharmaceuticals 14.3 9.8 8.7 9;2 8.1 16.3 10.5 11.9 Petroleum refining 1.5 0.9 0.7 0.2 0.6 0.8 0.6 1.0 Rubber and Plastics 1.4 1.5 1.5 0.8 0.5 0.2 0.5 1.2
Non-metal mineral products 0.9 2.5 1.0 0.6 0.1 0.3 0.2 1.0 Basic metals 0.4 1.4 1.0 0.4 0.3 0.4 0.7 0.8
Ferrous metals 0.3 1.2 1.0 0.4 0.3 0.4 0.8 0.7 Non-ferrous metals 0.6 2.1 0.8 0.4 0.2 0.4 0.4 0.9 -00
Fabr metals and machinery 6.1 3.7 4.6 3.6 2.4 3.7 2.5 4.4 Fabricated metals 0.7 0.7 0.5 1.1 0.3 0.3 0.4 0.7 Non-electrical machinery exc comp 2.0 2.6 2.0 2.0 0.7 1.2 0.9 2.0 Computers, office machinery 20.2 7.1 4.6 6.0 7.4 5.8 6.7 11.0 Electrical machinery exc comm 1.3 4.0 2.6 2.6 1.6 1.7 .. 2.7 Communication equip and semic 10.9 5.8 12.4 9.4 8.9 12.8 2.8 9.0 Shipbuilding .. 0.8 0.6 0.8 1.9 0.0 0.2 Motor vehicles 4.7 2.9 3.2 3.5 3.6 2.5 3.3 3.4 Aerospace 12.5 8.3 14.3 20.8 14.1 8.2 1.9 12.4
Other transportation 6.4 1.7 1.0 0.9 2.1 0.0 0.0 2.5 Scientific instruments 7.7 6.8 2.2 3.0 0.8 1.6 1.5 6.4
Source: OECD, STAN/ANBERD databases (DSTI, EAS Division), March 1995
. ~-- ~~-- ~---· ... ~~ '-- .. ----~-- ... ·-' ' . ..
----·--· -- ... -- ·--~--------- ··----·-··--- . ....,,_ -···--~ .,____ _ __ .,. __ _
: .
' . !
19
Table 7 Trends in the Distribution of Pharmaceutical R&D in selected OECD countries
1973·74 1975·79 1980·84 1985·89 1990·92
UK 10.4 10.8 10.8 11.4 11.5 Germany 13.4 14.3 10.3 9.0 7.7 France 7.4 7.2 7.6 7.3 6.9 Italy 6.2 5.7 5.9 6.1 5.7 The Netherlands 2.1 2.1 1.5 1.5 1.2 Denmark 0.9 0.7 0.7 0.8 0.9 Sweden 1.5 1.5 1.6 2.1 2.2 Finland 0.3 0.3 0.4 0.3 0.3
EUl 42.1 42.5 38.9 38.5 36.4
USA 42.0 41.1 42.3 42.4 44.2 Japan 14.2 15.2 17.7 17.6 17.6 Other2 1.6 1.2 1.1 1.5 1.8
Total OECD 100.0 100.0 100.0 100.0 100.0
Notes: 1 EU for these purposes consists of eight countries listed above. 2 No data available for Switzerland
Source: OECD
while the US has increased its share from 41% in 1981 to 47% in 1992. Japan increased its
share steadily up to 1981 but has also declined slightly since then. Table 7 also shows the
distribution of pharmaceuticals R&D within the seven EU countries. The UK accounted for a
quarter of the EU total in 1973 and has increased that to one third in 1992. Over the same
period Germany has declined from 31% to 20%, while Sweden has more than doubled its
share (from 3.7% to 6.1%).
3.10 Patent statistics have long been used as indicators of technological activities by both
academics and policy makers. Like other technology indicators (such as R&D expenditures)
they have their own advantages and disadvantages and these have been discussed in detail
elsewhere (see Pavitt (1988); Griliches (1990); Patel and Paxitt (1995)). Their main
advantage for the current study is that they are available over long periods of time and can be

20
broken down by detailed technical fields and by named institutions such as companies.
Moreover surveys (such as the Yale survey and the more recent PACE survey of European
firms) which assess patents versus other means of protecting technological leads show that in
the pharmaceutical industry patents are an extremely important means of protection.
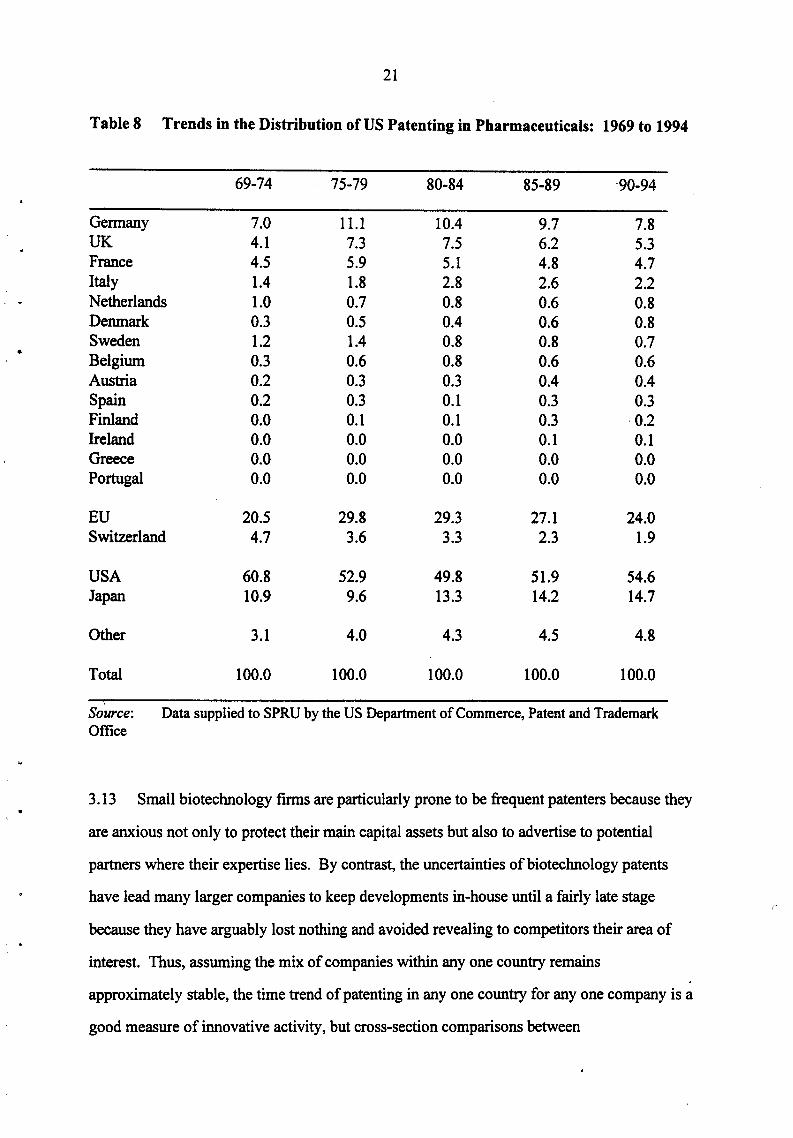
3.11 Table 8 shows the distribution of US patents granted to inventors from different
European countries compared to Japan and the us.n Here again it is clear that Germany, the
UK, France and Switzerland are the major European players, with the Swiss steadily
declining throughout the period. Both Germany and the UK show a substantial rise in
patenting activity during the late 70s and early 1980s, while both, but particular Gei'IIla&"tY,
have seen falls since the mid-1980s. The EU as a whole peaked in patenting activity in the
late 1970s but has recently been losing share. The US lost share as Europe gained in the late
1970s and early 1980s, but since that time has been steadily regaining share. Japan has been
steadily gaining patent share.
3.12 Such tables have to be treated with care. While patenting is of vital importance to this
industry, practice varies considerably from company to company and country to country. All
companies indulge in what is called 'defensive patenting' - that is not only taking out a patent
on NCE which constitutes the new discovery, but patenting widely around theNCE to pre
empt imitators. Japanese companies are well known for the systematic approach they adopt
to such defensive patenting and this may partially explain their relatively high patenting
share. Different traditions can also account for different practice even between EU countries.
For example, in Germany it is required that researchers in a corporate laboratory who have
been involved in discovering new chemical entities are not only identified on the patent but
also rewarded for their efforts. This leads to relatively narrow patents whereas in the UK,
where no such requirement exists, composite patents are often lodged in order to save costs.
13The figures in this table record the number of patents with inventor addresses in the different countries. It does not take account of patenting by companies whose HQ is in one country but which have substantial patenting outside that country.
I • I
i I
- I !
! I t l
I I I
> ! l l ~
f
I
I
•
21
Table 8 Trends in the Distribution of US Patenting in Pharmaceuticals: 1969 to 1994
69-74 75-79 80-84 85-89 ·90-94
Germany 7.0 11.1 10.4 9.7 7.8 UK 4.1 7.3 7.5 6.2 5.3 France 4.5 5.9 5.1 4.8 4.7 Italy 1.4 1.8 2.8 2.6 2.2 Netherlands 1.0 0.7 0.8 0.6 0.8 Denmark 0.3 0.5 0.4 0.6 0.8 Sweden 1.2 1.4 0.8 0.8 0.7 Belgium 0.3 0.6 0.8 0.6 0.6 Austria 0.2 0.3 0.3 0.4 0.4 Spain 0.2 0.3 0.1 0.3 0.3 Finland 0.0 0.1 0.1 0.3 0.2 Ireland 0.0 0.0 0.0 0.1 0.1 Greece 0.0 0.0 0.0 0.0 0.0 Portugal 0.0 0.0 0.0 0.0 0.0
EU 20.5 29.8 29.3 27.1 24.0 Switzerland 4.7 3.6 3.3 2.3 1.9
USA 60.8 52.9 49.8 51.9 54.6 Japan 10.9 9.6 13.3 14.2 14.7
Other 3.1 4.0 4.3 4.5 4.8
Total 100.0 100.0 100.0 100.0 100.0
Source: Data supplied to SPRU by the US Department of Commerce, Patent and Trademark Office
3.13 Small biotechnology firms are particularly prone to be frequent patenters because they
are anxious not only to protect their main capital assets but also to advertise to potential
partners where their expertise lies. By contrast, the uncertainties of biotechnology patents
have lead many larger companies to keep developments in-house until a fairly late stage
because they have arguably lost nothing and avoided revealing to competitors their area of
interest. Thus, assuming the mix of companies within any one country remains
approximately stable, the time trend of patenting in any one country for any one company is a
good measure of innovative activity, but cross-section comparisons between
r
22
countries/companies should be treated with some caution. In particular, in pharmaceuticals,
patents (or any other single measure) should never be taken as the sole indicator of successful
innovation. In all cases they need to be backed up by other indicators.
Other measures of innovativeness
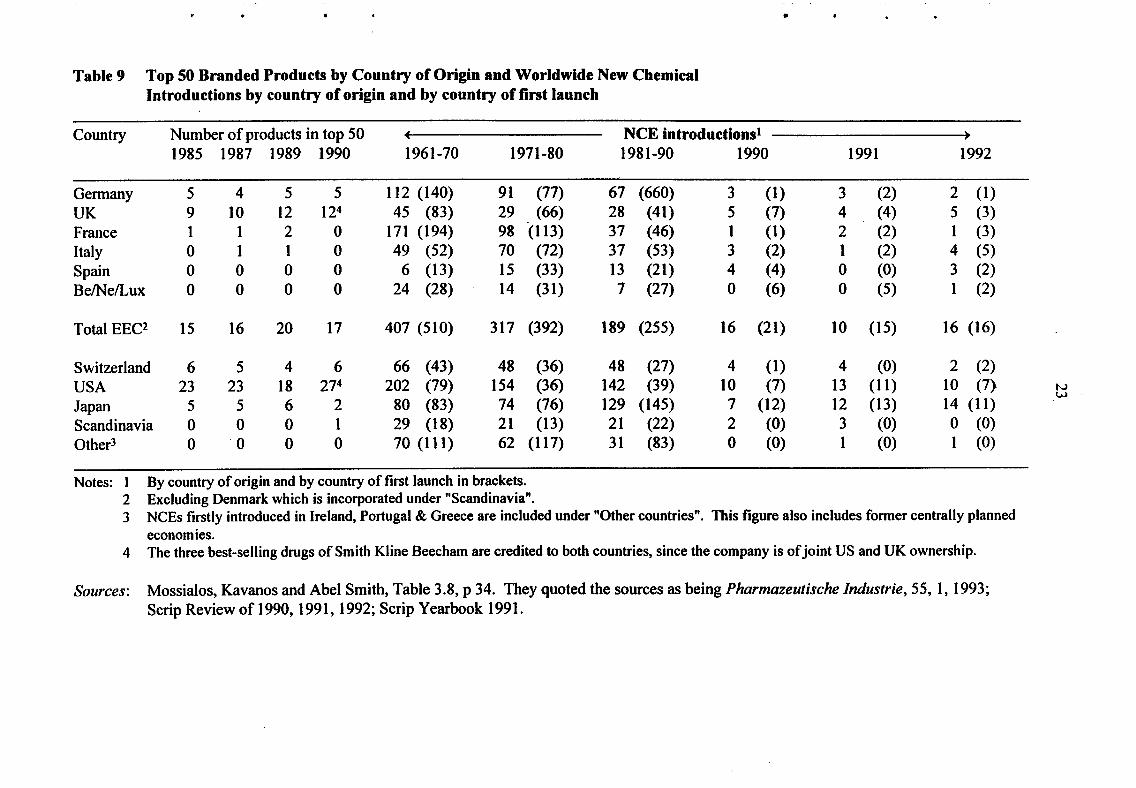
3.14 An important measure ofinnovativeness in the pharmaceutical industry is the number
ofNCEs launched by any one country/company over a given period of time and (given that
so many drugs that are introduced are 'me too' products possessing little novelty) also the
number of products amongst the top selling prescription drugs. Table 9 gives both these
measures for the main European drug producing countries, the US and the Japan. It shows a
number of interesting trends:
(i) while Germany and France have both been fairly prolific producers and launchers
of new drugs, neither has been very successful in marketing the high selling drugs,
with the French record in particular looking undistinguished;
(ii) within Europe, the UK and Switzerland are the most successful drug producers in
terms of numbers of products in the top 50, with the UK being particularly
successful in spite of the fact that its record of new introductions is well down on
its competitors;
(iii) worldwide, the US tops the bill on both scores with approximately 50 per cent of
the top selling brands, and more new introductions (but fewer new launches) than
any other country. Hqwever, given that the UK population is only 25 per cent of
that of the US, the UK record on top selling drugs is actually better than that of
the US, as is that of Switzerland;
(iv) in spite of fears in the early 1980s that Japan was set to break into the
pharmaceutical industry as it had in electronics, the Japanese record does not
match that of these other three countries;
(v) the poor record of new launches in the US is explained by differences in
regulatory procedures. Until recently, the backlog of cases with the US authorities
(the Food and Drug Administration- FDA) led to lengthy delays in drug
approvals which in turn encouraged US drug firms to launch new drugs in
European markets rather than in the US. Recent reforms to FDA procedures may
well change this in future.
' !
I • I
I
I f
I - t
I
I i ' l
. I ! ! I
•
Table 9 Top 50 Branded Products by Country of Origin and Worldwide New Chemical Introductions by country of origin and by country of first launch
Country Number of products in top 50 NCE introductions• 1985 1987 1989 1990 1961-70 1971-80 1981-90 1990 1991 1992
Germany 5 4 5 5 112 (140) 91 (77) 67 (660) 3 (1) 3 (2) 2 (1) UK 9 10 12 124 45 (83) 29 (66) 28 (41) 5 (7) 4 (4) 5 (3) France 1 1 2 0 171 (194) 98 (113) 37 (46) 1 (1) 2 (2) 1 (3) Italy 0 1 1 0 49 (52) 70 (72) 37 (53) 3 (2) 1 (2) 4 (5) Spain 0 0 0 0 6 (13) 15 (33) 13 (21) 4 (4) 0 (0) 3 (2) Be/Ne/Lux 0 0 0 0 24 (28) 14 (31) 7 (27) 0 (6) 0 (5) 1 (2)
Total EEC2 15 16 20 17 407 (510) 317 (392) 189 (255) 16 (21) 10 (15) 16 (16)
Switzerland 6 5 4 6 66 (43) 48 (36) 48 (27) 4 (1) 4 (0) 2 (2) USA 23 23 18 274 202 (79) 154 (36) 142 (39) 10 (7) 13 (11) 10 (7) N
w Japan 5 5 6 2 80 (83) 74 (76) 129 (145) 7 (12) 12 (13) 14 (11) Scandinavia 0 0 0 1 29 (18) 21 (13) 21 (22) 2 (0) 3 (0) 0 (0) Other3 0 -o 0 0 70 (111) 62 (117) 31 (83) 0 (0) 1 (0) 1 (0)
Notes: 1 By country of origin and by country of first launch in brackets. 2 Excluding Denmark which is incorporated under "Scandinavia". 3 NCEs firstly introduced in Ireland, Portugal & Greece are included under "Other countries". This figure also includes former centrally planned
economies. 4 The three best-selling drugs of Smith Kline Beecham are credited to both countries, since the company is of joint US and UK ownership.
Sources: Mossialos, Kavanos and Abel Smith, Table 3.8, p 34. They quoted the sources as being Pharmazeutische lndustrie, 55, I, 1993; Scrip Review of 1990, 1991, 1992; Scrip Yearbook 1991.

24
Trends in innovation between countries
3.15 Summing up the data on country level performance presented in this section, it is
clear that looking at it from a global perspective, the US remains the strongest player. It has
the largest home market of any industry, but remains a significant exporter and products from
its companies dominate the top 50 drugs league tables. Whereas many countries have
experienced declines in their shares of patenting and R&D, the US has held its own. Europe,
by contrast, has seen its share of both patenting and R&D fall, and variations in costs/prices I
from market to market indicate that although potentially a larger market than the US, it is still
highly fragmented. The one success story among European countries is the UK which has
seen a relative increase in its R&D expenditures in this sector and has been especially.
successful in developing products amongst the top selling drugs. This, as we shall see, helps
to create a virtuous cycle of R&D and innovation which is so important in this industry. By
contrast, Germany and Switzerland, the former dominant players in this sector, record a
relatively disappointing performance. France and Italy have both recorded a strong R&D
performance, but still fail to develop drugs of top class potential.
4 FIRM LEVEL ANALYSIS
A tight-knit international oligopoly
4.1 One of the notable features of the pharmaceutical industry is that it is a highly
regulated but intensely competitive international oligopoly dominated by a relatively small
number (30-40) of large companies. World-wide there are many thousands of companies but
many of these are small companies producing traditional remedies sold over-the-counter in
chemists shops' and with very limited markets. Others are companies producing off-patent
generic brands of medicine, often also for a local market. Because entry to such markets is
easy, competition is keen, mark-ups low and turnover among firms considerable. The larger
i . '
. • !
..
25
companies tend to concentrate on what are called the 'ethical' prescription drugsi4 most of
which are still covered by patents which limit entry and enable companies to reap as high a
profit as they can.
4.2 Table I 0 lists the top 30 companies in 1993 by sales, market share and ranking in
1991, 1992 and 1993. Because of the intense merger activity (see Tables 2 and 3 in Section
2) there has been a number of changing of place at the top of the table in the last two years
and a considerable increase in concentration. There is considerable variation in the
percentage of total sales devoted to phannaceuticals, ranging from 1 00 per cent for Glaxo to
16 per cent for Bayer. Many of the companies listed have interests in other parts of the
chemicals industry ( eg, Zeneca with pesticides and agro-chemicals) or in over-the-counter
health and beauty products ( eg, Johnson & Johnson with baby products, soaps, shampoos,
etc). It is also worth noting the relatively low levels of concentration for the industry as a
whole: while Merck and Glaxo each had more than 4 per cent of the world market in 1993,
half the firms on the list have less than 2 per cent.
4.3 Altogether these 30 companies contribute 60 per cent of world market sales, but over
75% of total R&D expenditures. Those that remain are to all intents and purposes, small
players in this Industry. Some of those small players are, like the new. biotechnology
companies we shall discuss in Section 5 below, highly creative, innovative companies,
challenging these industry giants at the core of their capabilities, namely in novel drug
design. But many, as already indicated, form a long tail of not very creative, imitative
companies which for many years have been 'living off the innovative activities of the top 30.
In terms of innovation, these are the companies that count.
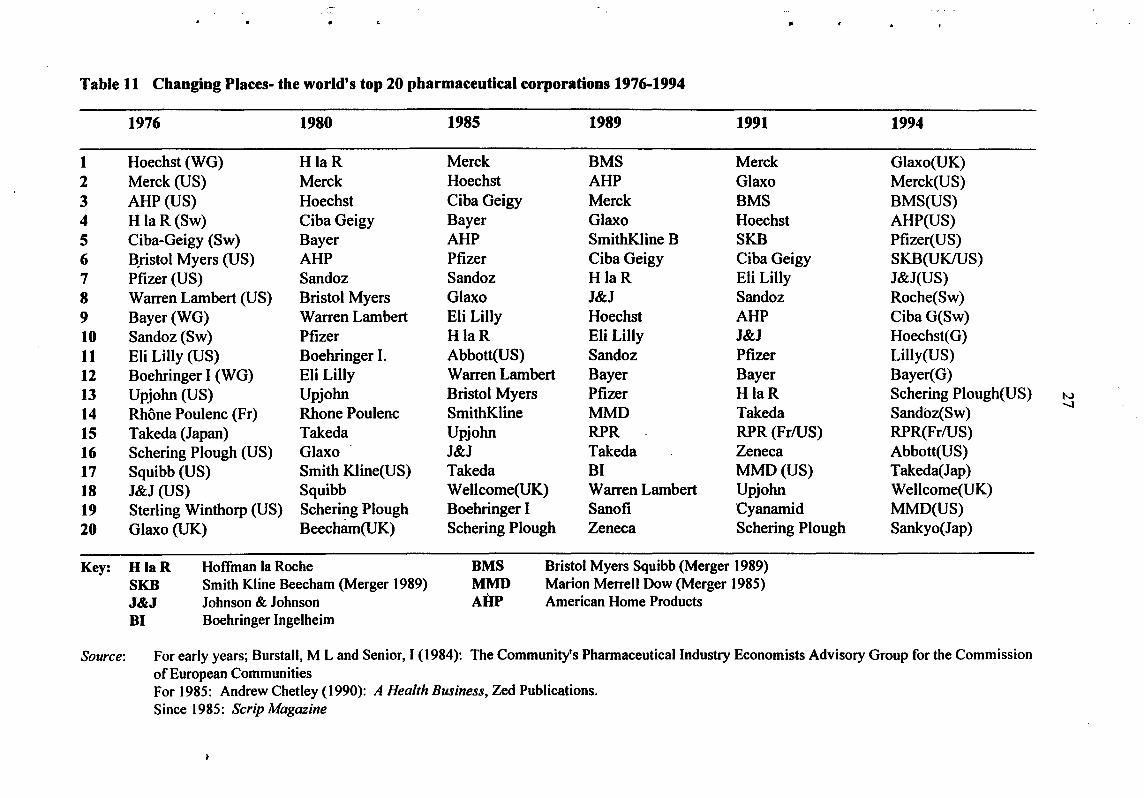
4.4 Table 11 shows the rankings of the top 20 firms for the last 20 years. While
position~ within the league table may change, there has been surprisingly little change
14As we shall see, quite a number of the larger companies have recently been expanding their activities from the production of on-patent prescription drugs into the generics and over-the-counter markets.

.. ..
Table 11 Changing Places- the world's top 20 pharmaceutical corporations 1976-1994
1976 1980 1985 1989 1991 1994
1 Hoechst (WG) HlaR Merck BMS Merck Glaxo(UK) 2 Merck (US) Merck Hoechst AHP Glaxo Merck(US) 3 AHP (US) Hoechst Ciba Geigy ·Merck BMS BMS(US) 4 H laR(Sw) Ciba Geigy Bayer Glaxo Hoechst AHP(US) 5 Ciba-Geigy (Sw) Bayer AHP SmithKline B SKB Pfizer(US) 6 B,ristol Myers (US) AHP Pfizer Ciba Geigy Ciba Geigy SKB(UKIUS) 7 Pfizer (US) Sandoz Sandoz HlaR Eli Lilly J&J(US) 8 Warren Lambert (US) Bristol Myers Glaxo J&J Sandoz Roche(Sw) 9 Bayer(WG) Warren Lambert Eli Lilly Hoechst AHP CibaG(Sw) 10 Sandoz(Sw) Pfizer HlaR Eli Lilly J&J Hoechst(G) 11 Eli Lilly (US) Boehringer I. Abbott(US) Sandoz Pfizer Lilly(US) 12 Boehringer I (WG) Eli Lilly Warren Lambert Bayer Bayer Bayer( G) 13 Upjohn (US) Upjohn Bristol Myers Pfizer HlaR Schering Plough(US) N
14 Rhone Poulenc (Fr) Rhone Poulenc SmithKline MMD Takeda Sandoz(Sw) -...J
15 Takeda (Japan) Takeda Upjohn RPR RPR(Fr!US) RPR(Fr!US) 16 Schering Plough (US) Glaxo J&J Takeda Zeneca Abbott(US) 17 Squibb (US) Smith Kline(US) Takeda BI MMD(US) Takeda(Jap) 18 J&J (US) Squibb Wellcome(UK) Warren Lambert Upjohn Wellcome(UK) 19 Sterling Winthorp (US) Schering Plough Boehringer I Sanofi Cyanamid MMD(US) 20 Glaxo (UK) Beecham(UK) Schering Plough Zeneca Schering Plough Sankyo(Jap)
Key: HlaR Hoffman Ia Roche BMS Bristol Myers Squibb (Merger 1989) SKB Smith Kline Beecham (Merger 1989) MMD Marion Merrell Dow (Merger 1985) J&J Johnson & Johnson AHP American Home Products 81 Boehringer Ingelheim
Source: For early years; Burstall, M Land Senior, I (1984): The Community's Pharmaceutical Industry Economists Advisory Group for the Commission of European Communities For 1985: Andrew Chetley ( 1990): A Health Business, Zed Publications. Since 1985: Scrip Magazine

28
amongst the overall cohort. As already noted the Germans (and Swiss) dominated the early
development of the industry, but with the war and the demand for antibiotics to treat the
wounded, the American industry emerged as a major player. As Table 11 shows, American, /
German and Swiss companies, and names such as Bayer, Hoechst, Ciba Geigy, Merck, and
Johnson & Johnson still dominate the league tables. The most notable change of the last two
decades has been the emergence of the UK industry as a significant player. IS Firms such as
Glaxo, Wellcome and (SmithKline) Beecham, who were minor companies in the 1950s, have
joined the top 20.16 They are now joined by Zeneca, the pharmaceuticallagro-chemicals arm
ofiCI which demerged in 1993. Nevertheless, with 9 out of the top 20 firms, the American
presence in the league tables is still impressive. The Japanese have yet to make much impact
Amongst European firms, the British and Swiss have been in the ascendant; the Germans on
the wane. The biggest shake-up in the industry has in fact come from the international
mergers of the last few years, which are not reflected in Tables 10 and 11: although Bristol
Myers Squibb and SmithKline Beecham appear as joint companies, Glaxo/Wellcome,
Hoechst/Marion Merrell Dow and Upjohn!Pharmacia mergers are not recorded. These
international mergers and alliances increasingly make national demarcation irrelevant. Firms
which for some time have been international in operation are now also becoming
international in ownership. It is noteworthy, for example, that Upjohn Pharmacia,
respectively American and Swedish firms, have chosen to locate their headquarters in London
which, they describe as becoming "a global pharmaceuticals' centre".l7 We return to this
theme below when considering the increasing internationalisation of R&D.
ISThe French frrm Rhone Poulenc has also advanced rapidly up the league tables, but largely as a result of merger with the US pharmaceutical company Rorer (to form Rhone Poulenc Rorer- RPR). As we shall see later, although the French companies feature as fairly substantial producers of drugs, their innovative record is not strong and there has been a tendency for the industry to rely on too many 'me too' products. The restructuring of RPR and the re-organisation of RP's vaccine interests around Merieux has strengthened RP's innovative capabilities, particularly in biopharmaceutical products. It still has to be seen whether the company · is able to profit from this potential. 16L G Thomas suggests that the rise of the British companies was helped by the existence of a price control regime which favoured the innovative drug companies, British or foreign, over me-too companies. See L G Thomas III, 1994. l1The Times, 6 February 1996.
I
! . !
I
1 • i
I ! . I I I '!
~
. ;
• t '
I; I ' I !

..
' ..
..
29
Low levels of concentration
4.5 Another significant feature of the international pharmaceutical industry- its low
levels of concentration - has been noted. Until the recent spate of takeovers the top three
firms in the industry commanded less than 12 per cent of total world markets. Is Even within
national markets, where it might well be thought concentration ratios would be higher,
concentration ratios are low as Table 12 demonstrates. The reason for this is the degree to
which companies concentrate on particular product areas - for example, cardiovascular,
central nervous system, antiviral, etc. Typically a company will concentrate its product range
in two or three areas and will find itself competing in these areas with, say, half a dozen of
the other major companies. Within product areas, therefore, concentration is likely to be
much higher than for the industry as a whole. Nevertheless, the introduction of a successful
drug in one area always attracts imitators. Tagamet, for example, SmithK.line's extremely
successful anti-ulcer drug which was launched in the late 1970s, was challenged within five
years by Glaxo's Zantac~ which in turn has been challenged by Merck's Pepcid and Astra's
Losee. In other words, concentration in specific product areas may lead to temporary excess
profits but also helps to promote the innovative dynamic of the industry. Firms are
constantly jockeying with each other to introduce new, high selling pharmaceuticals.
Technological performance of large firms: R&D, patenting and new chemical entities
4.6 The discussion above has already made clear the degree to which the pharmaceutical
industry is dominated by large multinational companies and the intense product competition
between these companies, with R&D and innovation the key issues. Table 13 lists the top 20
firms in the industry ranked by their R&D spending in 1993, together with their US patenting
activities, and the number of new drugs in R&D and their number of top selling drugs. The
most important message from this table is the lack of correlation between most of these
variables: the only significant correlation is between R&D intensity and number of new
18Recent takeovers have increased this to 16 per cent- see Table 3 above.
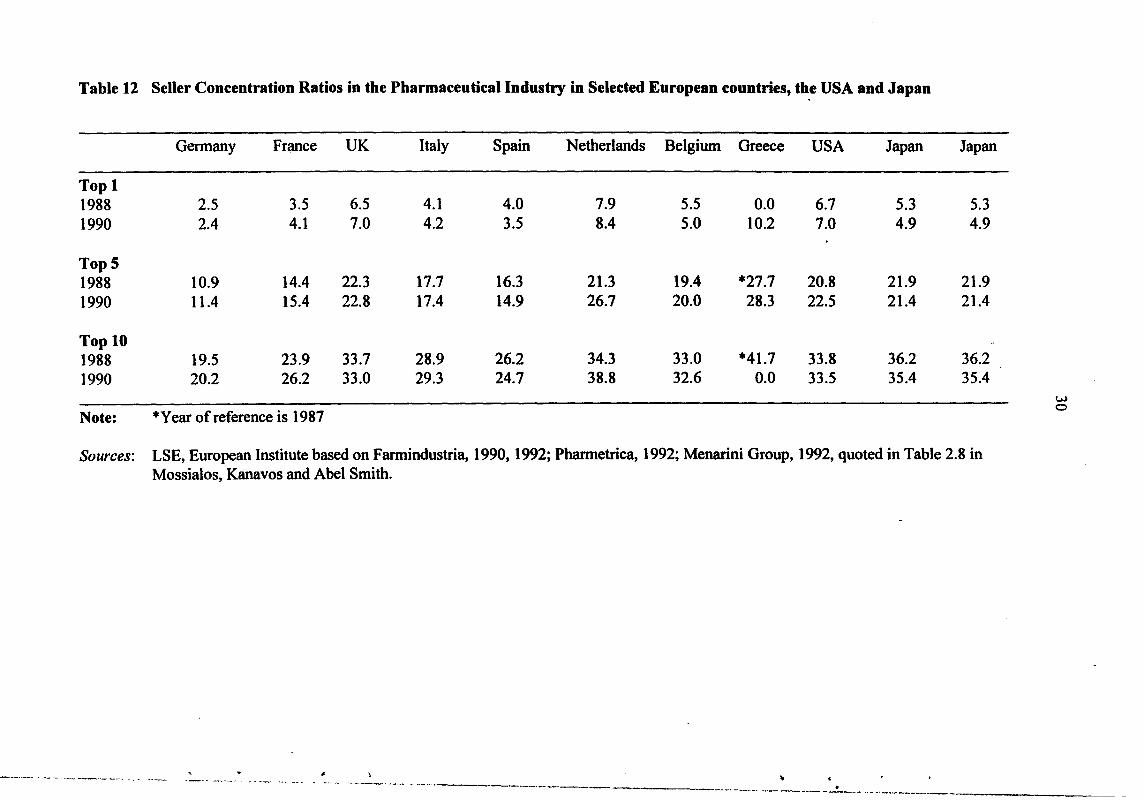
Table 12 Seller Concentration Ratios in the Pharmaceutical Industry in Selected European countries, the USA and Japan
Germany Fr~ce UK Italy Spain Netherlands Belgium Greece USA Japan Japan
Top 1 1988 2.5 3.5 6.5 4.1 4.0 7.9 5.5 0.0 6.7 5.3 5.3 1990 2.4 4.1 7.0 4.2 3.5 8.4 5.0 10.2 7.0 4.9 4.9
TopS 1988 10.9 14.4 22.3 17.7 16.3 21.3 19.4 *27.7 20.8 21.9 21.9 1990 11.4 15.4 22.8 17.4 14.9 26.7 20.0 28.3 22.5 21.4 21.4
Top 10 1988 19.5 23.9 33.7 28.9 26.2 34.3 33.0 *41.7 33.8 36.2 36.2 1990 20.2 26.2 33.0 29.3 24.7 38.8 32.6 0.0 33.5 35.4 35.4
w
*Year of reference is 1987 0
Note:
Sources: LSE, European Institute based on Farmindustria, 1990, 1992; Pharmetrica, 1992; Menarini Group, 1992, quoted in Table 2.8 in Mossialos, Kanavos and Abel Smith.
' --- '-~~-, ---~---· ·-·- ' . •.. .. ----· ·--- --------- . --.. -- ~- ____ _.,. ..... ------ ----~· ··- "' _,..,.,..

c -
Table 13 Top 20 companies in terms of Pharmaceutical R&D expenditures
R&D (1993) I US Patents (1990-94) I No of drugs in R&D 1993/4 I No of products in Top 50 $m %Sales Number per mil sales Total Own Under Licence Selling brands I993
1 Glaxo (GB) 1288.7 I5.17 I 51 1.78 80 51 29 6 2 Roche (CH) I226.3 23.20 '358 6.77 115 72 43 I 3 Merck & Co (US) 980.2 Il.I7 728 8.30 113 94 I9 6 4 Hoechst (DE) 966.6 I6.08 649 10.80 79 52 27 0 5 Sandoz (CH) 900.8 18.II 117 2.35 85 57 28 I 6 SmithKiine Beecham (GB) 743.5 I4.21 264 5.05 101 61 40 4 7 Eli Lilly (US) 690.5 14.69 248 5.28 93 67 26 3 8 Johnson & Johnson (US) 683.0 15.21 177 3.94 79 48 31 I 9 Pfizer (US) 668.3 13.03 245 4.78 57 43 14 3 I 0 Ciba-Geigy (CH) 649.0 12.72 356 6.98 102 71 31 I I1 Bristol-Myers Squibb (US) 644.8 9.88 413 6.33 94 76 18 2 w . 12 Rhone-Poulenc Rorer (FR) 561.2 13.96 176 4.38 64 40 24 0 -13 Schering Plough (US) 549.7 15.10 145 3.98 52 27 25 1 I4 Upjohn (US) 534.6 17.78 66 2.19 69 50 19 I I5 Boehringer lngelheim (DE) 531.1 19.21 93 3.36 69 51 18 0 16 Wellcome (GB) 489.6 15.97 115 3.75 38 46 12 1 17 Schering AG (DE) 473.6 18.92 147 5.87 49 35 14 1 18 Abbott (US) 459.9 10.48 235 5.35 51 27 24 0 I9 Marion Merrell Dow (US) 45I.O I6.00 294 10.43 57 33 24 3 20 Zeneca (GB) 434.1 15.45 326 11.60 49 44 5 3
Sources: SPRU/OTAF Patent Database; SPRU Large Firm Database; Scrip Magazine, January 1995, p 45 for Drugs under Development; James Capel, Global Pharmaceutical Review, October 1994, p III for 1993 Drug Ranking for Top 50 products.

32
drugs as a percentage of sales. Thus although Glaxo's R&D spending in 1993 was high
(inflated by the large expenditures incurred on building its new R&D facilities) and, together
with Merck, it topped the league in terms of top selling drugs, its patenting activities and the
, number of new products under development were relatively poor compared to companies
with much lower R&D expenditures. In contrast, Hoechst has the highest patent intensity, is
roughly equal to Glaxo in new drug development activity but has no drugs in the top 50 best
s~llers. At the same time Roche, which currently tops the league in terms of the percentage
of sales devoted to R&D at 23 per cent, and is amongst the top group in patenting activity and
new drug development, has only one of the top selling drugs. Zeneca, at the bottom of the
table in terms of overall R&D spend (although higher up in terms of R&D as a percentage of
sales), has a much better patenting record than Glaxo, and has three drugs in the top 50.
Zeneca also has a very slim development portfolio with nearly all the new drugs derived from
its own R&D rather than being developed under license.
4.7 As Table 13 indicates, there are important factors specific to each company and it is
these, more than general factors, which determine R&D and innovation strategy. For
example, Rhone Poulenc Rorer, the major French pharmaceutical/chemical company, has
been advancing up the pharmaceutical company league tables by a process of aggressive
acquisition, the most important of which was the take-over of the US middle size
pharmaceutical company Rorer in 1989. Hoffmann La Roche aims to increase the
company's presence amongst top selling drugs and hence has maintained a high R&D
investment rate for some years. This has helped to put it at the top of the league in terms of
drugs under development (115 compared to Merck's 113) but it has still to tum these into best
sellers. Upjohn, which recently merged with Pharmacia of Sweden, is another company
whose sales ranking was disappointing and whose spending on R&D could be seen as a
defensive attempt to revitalise sales. Indeed, it is notable that those companies with the
highest R&D to sales ratios (Roche, Boehringer Ingelheim, Schering, Sandoz and Upjohn) all
have on only one or no drugs among the top 50 best sellers. By contrast, Merck, which has
for the last decade been considered the most innovative drug company in the world and
. I
' . I I i
~ I l
I I I , I
i •'
33
matches Glaxo's record of 6 out of 50 top selling drugs, has relatively low R&D intensity but
shows high numbers of patents and products under development.
4.8 It is also worth noting in Table 13 the number of drugs under development which
have been licensed-in from other companies. This has long been a feature of pharmaceutical
" companies who both license-in and sell drugs discovered by fellow pharmaceutical
companies. Development here may mean taking the drug through the later stages of clinical " ..
trials in order to satisfy the indigenous regulatory authorities (the US FDA, for example,
insists that any drug launched on the US market goes through clinical trials in the US), or it
may mean taking the drug from Phase I clinical trials onwards, a process which can last
anything from upwards of 5 or 6 years. The development of biotechnology and the
increasing tendency for the large pharmaceutical companies to ally themselves with the small
dedicated biotechnology companies who do not have the knowledge or facilities to take drugs
through clinical trials has resulted in all pharmaceutical companies licensing-in more drugs
than they used. A high level of licensing-in should not therefore be seen as a sign of
weakness in innovation. On the contrary, there are an increasing number of companies who
now recognise that they cannot maintain in-house the wide range of expertise and speciality
required for modem drug development ( eg combinatorial chemistry and genomics) and who
deliberately seek to license-in such expertise arguing that the task of the large firm is
increasingly to act as co-ordinator in the drug discovery process. That said, there have also
been quite a number of pharmaceutical companies caught short by the rapid advance of
biotechnology and the bio-pharmaceutical drugs and obliged to reinforce their product
portfolios by buying-in products from the small biotechnology companies. (See Section 5
below for more discussion of this point.)
The role of multinationals and the intemationalisation of R&D activities
4.9 The pharmaceutical industry is characterised by an increasing number of truly multi
national firms. Table 14 illustrates the degree to which different markets within some of the

· Table 14 Company market share in Europe, United States and Japan by company nationality in 1991 (percentage of the pharmaceuticals market in each country)
Company Country of Origin 1 Market BEL GER SPA FRA ITA NET POR UK SWE SWI USA JAP
Belgium 10.7 13.7 0.0 9.8 2.1 1.5 0.0 16.9 3.0 10.2 29.5 0.7 Germany 1.7 51.9 0.3 5.1 0.9 1.5 0.0 6.2 3.3 8.1 18.6 1.1 Spain 1.7 14 . 31.0 4.5 5.9 0.9 0.0 9.3 2.1 11.7 17.0 0.1 France
. 2.1 12.3 0.0 46.0 0.6 1.0 0.0 8.1 . 1.6 6.7 20.5 0.4
Italy 0.5 13.8 0.0 5.3 38.3 0.3 0.0 9.6 0.8 11.6 18.9 0.3 Netherlands 2.4 14.5 0.0 4.1 1.3 11.6 0.0 18.4 7.0 10.1 23.6 1.9 Portugal 3.2 12.5 3.3 8.6 3.7 0.7 14.7 11.2 0.9 13.5 25.3 0.6 United Kingdom2 , 1.1 10.4 0.0 4.7 0.4 1.0 0.0 35.02 3.6 7.1 25.8 0.3 United States 0.4 4.6 0.0 1.2 0.1 0.0 0.0 14.6 0.1 8.0 70.2 0.3 Japan 0.0 4.8 0.0 0.2 0.0 0.2 0.0 2.9 0.3 3.1 . 5.9 82.1
1 Market share calculated from direct sales by companies or their majority-owned subsidiaries. Product sales under licence are credited to the company marketing them and not to the original patent-holder.
2 8.4% of the British market is occupied by generics for which the country of origin of the group marketing them is not specified. British companies are estimated to manufacture half the generics. This would add 4% to the market share of British companies in the UK.
Source: 'The Realities of the Pharmaceutical Industry in France', SNIP, February 1993, quoted as Table 3.2 in Mossialos, Kanavos and Abel Smith (1993).
'~-· • • ~ -..- -~ .•
'·--·-.----~- ·---... ..._ ______ -----
w .J:>.
-~--------- ... ~--~-~-~--·-··· --·---~-....-~_ .... __________________ _
35
OECD countries are controlled by national and foreign firms. Thus while the diagonal
illustrates the degree of self-sufficiency (with Japan the highest at 82 per cent, the US 70 per
cent, Germany 52 per cent, France 46 per cent) the vertical columns show who is supplying
whom. Table 14 also illustrates how important American companies are in all European
markets (the column under USA showing the proportion of each market supplied by US
• companies). Two features are worth highlighting. First, that German, British and Swiss
companies are the major European suppliers to European markets; France, although second in
. '
terms of production in Europe, is less important as a supplier to Europe.I9 Secondly, only
three European countries have companies making a noticeable impact on the US market - the
UK, which in 1991 enjoyed a market share of almost 15 per cent, Switzerland with an 8 per
cent share and Germany with a 4.6 per cent share. Given the importance of the US market as
the most open and competitive market for pharmaceuticals in the world and the very strong
showing of US pharmaceutical companies in other markets, US market share is a reasonable
indicator of competitiveness. It suggests again that in spite of their smaller productive size,
the UK and Swiss industries are amongst front runners in Europe.
4.10 The UK has in fact attracted a good deal of investment from foreign, and particularly
American, pharmaceutical companies. Initially they came in the 1950s when the dollar
strapped UK authorities demanded local drug formulation and provided subsidies for location
in the less favoured regions. As they matured they shifted from formulation to manufacture
and R&D and the availability of high quality scientific manpower proved a major attraction .
(Lake, 1976). In turn the UK authorities sought to attract them by offering favourable
treatment under the price regulation system to companies setting up R&D departments. Most
of these subsidiaries and R&D laboratories were staffed and run by UK nationals and over
time provided a training ground for many who went on to work for the successful UK
companies. In other words, the presence of successful multinational pharmaceutical
companies in the UK in the 1950s and 1960s provided a role model and a training ground
which subsequently helped the UK's indigenous companies to success. It took, however, a
19france is however a major exporter, particularly to Third World countries.

36
generation (25 years) for the effects to work their way through the system (Brech and Sharp,
1985).
4.11 Within Europe, the UK is still a favoured location for many multinational companies
as the recent decision by Upjohn Pharmacia signified. Like the UK, France and Italy both at
one time demanded local formulation and manufacture, and offered favourable treatment for
the location of R&D laboratories, but were less successful in attracting such facilities.
Patenting activity provides an another way of measuring how far the increasing
internationalisation of the industry is resulting in a shift of innovative activity. Table 15
shows the geographic distribution of US patenting activities20 for the 115largest
pharmaceutical companies worldwide. This shows that, for example, 89 per cent of patents
granted to US firms in 1990-94 were derived from activity within the US. At the same time
for German firms, 29 per cent of their innovative activity was located abroad, predominately
in the US; for British companies 35 per cent was abroad, again mainly in the US; and for
Swiss companies 58 per cent was abroad, 44 per cent of this being in the US; Within Europe,
the UK is the most important location of innovative activity, followed by France, Germany
and Italy.
4.12 Table 16 supplements the data in Table 15 by listing the foreign firms engaged in
patenting in Europe as a whole and in the UK, France, Germany and Italy. In Europe as a
whole, as might be expected, the top foreign patenters are the US pharmaceutical firms with
Johnson & Johnson, Pfizer and Dow Chemical topping the list. In each individual country,
other European companies are often major players. Hoechst, for example, owns France's
second largest pharmaceutical company (Roussel) and thus tops the foreign companies
patenting in France. Rhone Poulenc Rorer own May and Baker, one of Britain's oldest
pharmaceutical companies, which helps explain their place on the British list. Taking
patenting as a measure for innovative activity, once again Britain stands out as the most
innovative environment for pharmaceuticals in Europe. It hosts a large number of the leading
20These figures come from analysis of inventor addresses of patents granted to these firms in the US.
l
I r l
I ! l
~ I 1
i ' r
i
I l

... •• .. .. •
Table 15 Geographic Location of Pharmaceutical Firms' US Patenting Activities, according to nationality: 1990-94 (percentage shares)
Firm's Home Abroad Of Which Nationality us Japan Europe Ger UK Fr NL Swe Bel It Den Fin
USA (25) 89.2 10.8 2.2 8.4 0.8 4.6 0.6 0.0 0.0 1.5 0.6 0.0 0.0 'Japan (36) 94.9 5.1 4.4 0.5 0.3 0.0 0.0 0.0 0.1 0.1 0.0 0.0 0.0 Europe 81.5 18.5 17.2 5.3 Germany (13) 71.0 29.0 16.8 1.7 10.2 1.6 5.3 0.3 0.0 0.0 2.3 0.0 0.0 UK (10) 64.9 35.1 24.8 0.1 9.9 1.6 4.2 1.0 0.1 0.2 2.8 0.0 0.0 France (7) 80.1 19.9 10.9 0.3 8.4 1.1 3.4 0.0 0.0 2.1 1.7 0.0 0.0 Netherlands (3) 56.8 43.2 18.0 0.0 23.7 3.6 12.9 4.3 0.0 1.4 0.0 1.4 0.0 Sweden (2) 69.7 30.3 10.1 1.1 15.7 1.1 1.1 0.0 1.1 0.0 9.0 1.1 2.2 Belgium (2) 16.7 83.3 11.5 0.0 71.8 24.4 0.0 6.4 41.0 0.0 0.0 0.0 0.0 Italy (5) 88.8 11.2 7.9 0.0 2.6 1.3 0.0 1.3 0.0 0.0 0.0 0.0 0.0 Denmark (2) 75.8 24.2 20.3 0.5 3.3 1.6 1.1 0.0 0.0 0.0 0.0 0.0 0.0 Finland (1) 88.0 12.0 4.0 0.0 8.0 0.0 0.0 0.0 0.0 0.0 8.0 0.0 0.0 0.0 w Spain (1) 100.0 0.0 0.0 0.0 0.0 0.0 0.0 0.0 0.0 0.0 0.0 0.0 0.0 0.0 -..J
Norway (1) 34.3 65.7 31.4 0.0 34.3 2.9 0.0 0.0 0.0 11.4 0.0 0.0 5.7 0.0 Switzerland (7) 41.9 58.1 43.5 2.0 12.5 4.8 2.7 3.4 0.0 0.0 0.0 0.4 0.0 0.0
All Firms (115) 79.2 20.9 10.7 1.4 8.5 1.2 2.7 1.9 0.4 0.1 0.8 1.1 0.1 0.0
Source: SPRU Large Finns Database

38
Table 16 Top Non-national firms patenting in Europe: 1990-94
Numbers of US Patents granted
Top 10 non-European firms patenting in Europe Johnson & Jolmson 70 Pfizer 52 Dow Chemical 4 7 Mercklnc 45 Monsanto 36 American Home Products 36 Warner-Lambert 29 American Cyanamid 19 Eli Lilly 18 Bristol-Myers Squibb 15
Top 5 non-national firms patenting in UK Pfizer 49 Merck US 36 American Home Products 34 Rhone-Poulenc Rorer 21 Monsanto ,19
Top 5 non-national firms patenting in France Hoechst 104 Zeneca 39 Dow Chemical 13 Hoffmann-La Roche 12 MerckEAG 5
Top 5 non-national firms patenting in Germany Ciba-Geigy 24 Solvay 19 Hoffmann-La Roche 15 Monsanto 11 Warner-Lambert 10
Top 5 non-national firms patenting in Italy Dow Chemical 24 Hoechst 19 Boehringer Mannheim 18 SmithKline Beecham 15 Sanofi 12
Source: SPRU Large Firms Database
I l
. I i i I . i I '

39
US pharmaceutical companies, who in their turn contribute substantially to overall innovative
activity. Pfizer's 49 patents, for example, equal Zeneca's total and exceed Wellcome's 38
over the same period (Table 13). In looking at Europe's overall innovative potential in this
area, these multinational companies should not be forgotten.
f Innovative Traditions and Innovative Companies
4.13 In concluding this section it is worth emphasising again the importance of companies
to innovation in the pharmaceutical industry. It is in fact meaningless to talk, as we did in
Section 3, about a country's record in innovation, for it is the companies operating within that
country that create the innovation. The infrastructure and environment in a country may be
conducive to innovation - as seems to be the case with Britain - but each company is different
and has its own innovative profile. Merck, for example, is widely regarded today as the most
innovative pharmaceutical company in the world and certainly scores well on all the various
indicators presented in Table 13.
4.14 What makes for an innovative company such as Merck? Archilladelis eta/ (1990)
suggest that in the chemical and allied industries the concept of a 'technological tradition' is
of vital importance. The success of an innovation is, they found, linked to previous success
which itself provides both experience and/or knowledge of research at the forefront of the
relevant science. Success in pharmaceuticals, measured in terms of top selling drugs, is, as
noted previously, a key factor in funding R&D which in turn is a necessary (but not sufficient
-note Hoffman La Roche's heavy R&D expenditures in Table 13) condition of further
success. This view is echoed by Gambardella (1995). In his concluding chapter he writes:
"The case studies also suggested that competitive advantages based on science and
innovation exhibit self-reinforcing properties. Leading innovators produce new
drugs, which generate profits that can be reinvested in research, thereby strengthening
innovative capabilities. Firms lacking strong research capabilities have had great
difficulties in breaking into this virtuous spiral. Hence many of them, even though

40
they did attempt to become research intensive producers, had to merge with other
firms to join complementary resources in marketing and research, and to withstand ,
the enormous competitive pressures of the 1990s."
(Gambardella, 1995, p 163)
4.15 Gambardella warns, however, that scale is not everything. "The biological approach
implies that scientific creativity and highly qualified human capital, rather than scale, have
become the critical resources for drug discovery." (Gambardella, 1995, p 163). It is
important, therefore, to consider the impact of biotechnology and its effect on the European
pharmaceutical industry. This we do in the next two sections.
5 BIOTECHNOLOGY- A NEW ROUTE TO DRUG DISCOVERY
The emergence of the new biotechnology
5.1 Biotechnology as a new route to drug discovery dates from the early 1970s when two
breakthroughs in molecular biology :- the discovery of a mechanism by which part of a
foreign gene could be inserted into another and thereby change its characteristics
(recombinant DNA) and techniques for fusing and multiplying cells (hybridomas)- heralded
the coming of genetic _engineering. The applications of these radical new techniques were
rapidly appreciated. They have led to the emergence of a whole new generation of protein
drugs which are currently being launched on world markets. In the pipeline are further
'generations' of these products based on more sophisticated technology and beyond this
developments in gene therapy and genome mapping open the way a wholesale revolution in
medical technology. (See OTA (1991) for a detailed discussion of these developments.)
5.2 The leading edge of this new technology rapidly emerged in the United States, where
the combination of a ready venture capital market, more lenient stock exchange rules and, .
above all, leading edge research in the life-sciences generously funded from the federal
- ' !
I I
!( I
I I
• i - I
I
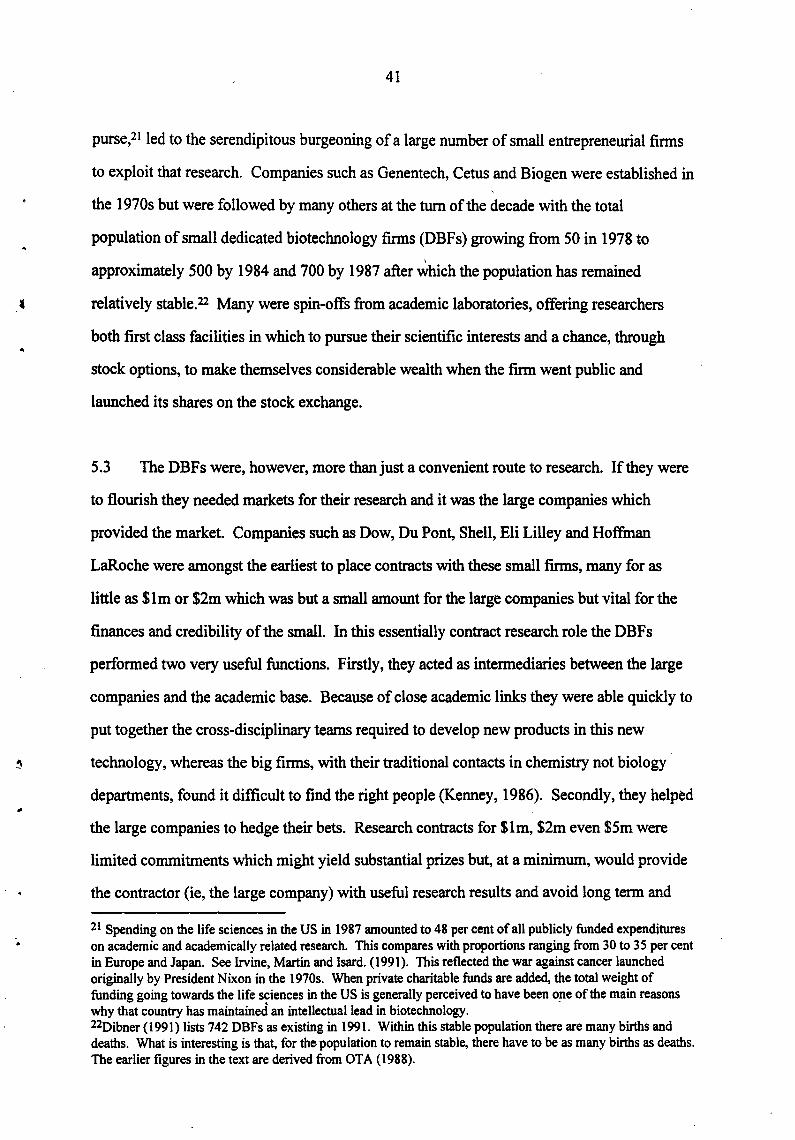
41
purse,21 led to the serendipitous burgeoning of a large number of small entrepreneurial firms
to exploit that research. Companies such as Genentech, Cetus and Biogen were established in
the 1970s but were followed by many others at the turn of the decade with the total
population of small dedicated biotechnology firms (DBFs) growing from 50 in 1978 to
approximately 500 by 1984 and 700 by 1987 after ~hich the population has remained
• relatively stable. 22 Many were spin-otis from academic laboratories, offering researchers
both first class facilities in which to pursue their scientific interests and a chance, through .. stock options, to make themselves considerable wealth when the fmn went public and
launched its shares on the stock exchange.
5.3 The DBFs were, however, more than just a convenient route to research. If they were
to flourish they needed markets for their research and it was the large companies which
provided the market. Companies such as Dow, Du Pont, Shell, Eli Lilley and Hoffman
LaRoche were amongst the earliest to place contracts with these small firms, many for as
little as $1m or $2m which was but a small amount for the large companies but vital for the
finances and credibility of the small. In this essentially contract research role the DBFs
performed two very useful functions. Firstly, they acted as intermediaries between the large
companies and the academic base. Because of close academic links they were able quickly to
put together the cross-disciplinary teams required to develop new products in this new
~ technology, whereas the big firms, with their traditional contacts in chemistry not biology ·
departments, found it difficult to find the right people (Kenney, 1986). Secondly, they helped
the large companies to hedge their bets. Research contracts for $1m, $2m even $5m were
limited commitments which might yield substantial prizes but, at a minimum, would provide
the contractor (ie, the large company) with useful research results and avoid long term and
21 Spending on the life sciences in the US in 1987 amounted to 48 per cent of all publicly funded expenditures on academic and academically related research. This compares with proportions ranging from 30 to 35 per cent in Europe and Japan. See Irvine, Martin and Isard. (1991). This reflected the war against cancer launched originally by President Nixon in the 1970s. When private charitable funds are added, the total weight of funding going towards the life sciences in the US is generally perceived to have been one of the main reasons why that country has maintained an intellectual lead in biotechnology. -22Dibner (1991) lists 742 DBFs as existing in 1991. Within this stable population there are many births and deaths. What is interesting is that, for the population to remain stable, there have to be as many births as deaths. The earlier figures in the text are derived from OTA (1988).

42
expensive employment commitments at a time when it was still, uncertain where
biotechnology was going.
5.4 In Europe the DBF has not flourished in the same way, partly because the institutional
framework (high funding/leading edge research in the life sciences, active venture capital
market) did not exist, partly because the academic entrepreneur was alien to much of the
European academic tradition. Earlier studies (Coleman 1987; Clark and Walton 1992)
suggest that the total population of small firms in Europe was small and grew only slowly.
However, recent research suggests that the early 1990s was a period of rapid change for this
sector in Europe and there is now a core of some 300 DBFs (Rizzoni 1995 unpublished
research). Most of them, however, are much smaller than their US counterparts and to date
relatively few are working at the leading edge of research. (See Martin and Thomas (1996) in
relation to developments in gene therapy.)
The first decade - establishing a window on the technology23
5.5 None of Europe's large traditional chemical/pharmaceutical companies played much
part in the frrst decade of 'the new biotechnology'. Most of the companies were uncertain
what to make of the new technology and especially of the hype surrounding its development
that grew with the small frrm sector in the US. Some had experience of fermentation
technology through the production of biological pharmaceuticals such as penicillin, or with
the use of enzymes and the techniques associated with immobilisation of enzymes that had
been developed during the 1960s. The latter, however, had tended to be the preserve of
medium-sized specialist companies such as Gist Brocades (Netherlands now owned by Shell)
or Novo (Denmark) rather than the large firms. A number of the larger companies had also
dabbled in single cell protein, including Shell, BP, Hoechst and ICI, but only ICI had pursued
23The infonnation in this section is culled from an earlier study by one of the authors on the development of biotechnology in Europe up to 1985. See Sharp (1985a). It is supplemented by case studies ofhow five of Europe's large integrated chemicaVpharmaceutical- ICI, Bayer, Ciba Geigy, Montedison- have accommodated to the emergence of biotechnology in the last 15 years. See Sharp and Galimberti (1993).
' t
• l
-I ' I
~ I

43
its interests through to the market place with its ill-fated animal feed supplement, Pruteen.
While the experience had been valuable in giving ICI hands-on experience of large scale
continuous fermentation technology, its main legacy was in fact to make the company
extremely cautious about further commitments to biotechnology.
5.6 This combination of uncertainty, scepticism and inexperience led to what might be
called a minimalist strategy on the part of most large firms. While avoiding large
investments most of the companies built up teams of researchers large enough to keep abreast
of the science and to monitor developments and competitors.24 Thus Bayer, ICI and Ciba
Geigy all established small research teams in their corporate R&D laboratories with a fairly
free rein to explore ideas as they wished.(Sharp and Galimberti 1993) Other companies, for
example BASF, left even these moves until the early 1980s, having only minor interest in
pharmaceuticals and being very uncertain whether biotechnology would have any relevance
to their main interests in areas such as plastics and fibres. (Sharp 1985a)
5.7 One consequence of this strategy of'watching and waiting' (Sharp 1985b). Was that it
conceded leadership in the development of the new technology to the American DBFs which
were so closely linked into the academic base. In this phase of development relatively few of
the major European chemical firms were to be found as partners to the DBFs, although some,
such as Ciba Geigy and Hoffman LaRoche, acknowledging that the US science base in this
area was much stronger than that available in Germany or Switzerland, threw tradition to the
winds and placed research contracts with a number ofDBFs.2s Hoechst, in placing a $67m,
10 year contract in 1981 with the Massachusetts General.Hospital (MGH), also linked itself
directly to the US academic base and made arrangements for its researchers to be trained at
the MGH, thereby implicitly acknowledging the limitations of its indigenous science base.
Other companies, among them Glaxo, Wellcome and Bayer, chose instead to expand their
24The exception was the US company Monsanto which in 1978 had appointed a biochemist as research director who championed early and major investments in biotechnology. (See Joly, 1992.) 25 American and Japanese chemical and pharmaceutical companies were more prominent as partners in the early part of the 1980s. See OTA (1984) which (wrongly) predicted that the main competitive challenge to the US in biotechnology would come from Japan.
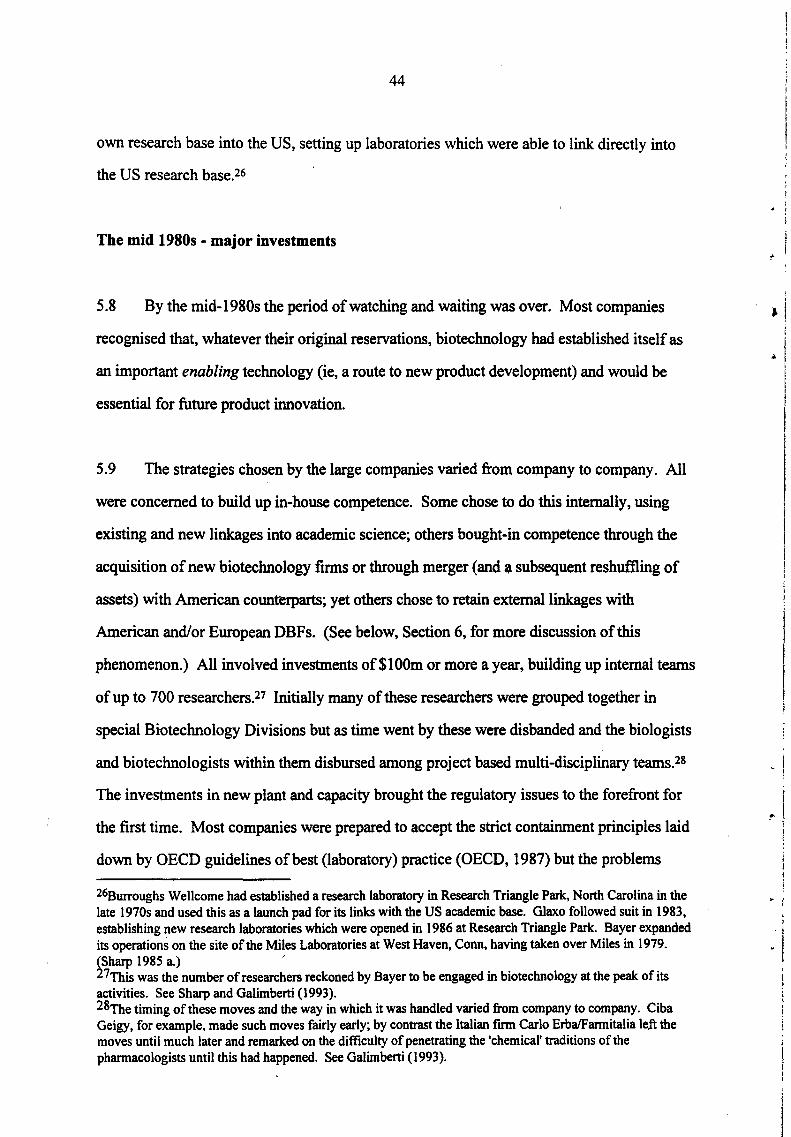
44
own research base into the US, setting up laboratories which were able to link directly into
the US research base.26
The mid 1980s - major investments
5.8 By the mid-1980s the period of watching and waiting was over. Most companies
recognised that, whatever their original reservations, biotechnology had established itself as
an important enabling technology (ie, a route to new product development) and would be
essential for future product innovation.
5.9 The strategies chosen by the large companies varied from company to company. All
were concerned to build up in-house competence. Some chose to do this internally, using
existing and new linkages into academic science; others bought-in competence through the
acquisition of new biotechnology ftrms or through merger (and a subsequent reshuftling of
assets) with American counterparts; yet others chose to retain external linkages with
American and/or European DBFs. (See below, Section 6, for more discussion of this
phenomenon.) All involved investments of$100m or more a year, building up internal teams
of up to 700 researchers.27 Initially many of these researchers were grouped together in
special Biotechnology Divisions but as time went by these were disbanded and the biologists
and biotechnologists within them disbursed among project based multi-disciplinary teams.2s
The investments in new plant and capacity brought the regulatory issues to the forefront for
the first time. Most companies were prepared to accept the strict containment principles laid
down by OECD guidelines of best (laboratory) practice (OECD, 1987) but the problems
26Burroughs Wellcome had established a research laboratory in Research Triangle Park, North Carolina in the late 1970s and used this as a launch pad for its links with the US academic base. G1axo followed suit in 1983, establishing new research laboratories which were opened in 1986 at Research Triangle Park. Bayer expanded its operations on the site of the Miles Laboratories at West Haven, Conn, having taken over Miles in 1979. (Sharp 1985 a.) ' 27This was the number of researchers reckoned by Bayer to be engaged in biotechnology at the peak of its activities. See Sharp and Galimberti (1993). 28The timing of these moves and the way in which it was handled varied from company to company. Ciba Geigy, for example, made such moves fairly early; by contrast the Italian frrm Carlo Erba!Farmitalia left the moves until much later and remarked on the difficulty of penetrating the 'chemical' traditions of the pharmacologists until this had happened. See Galimberti (1993).
. ' I
I
• I i I
~ I i
I I
• i
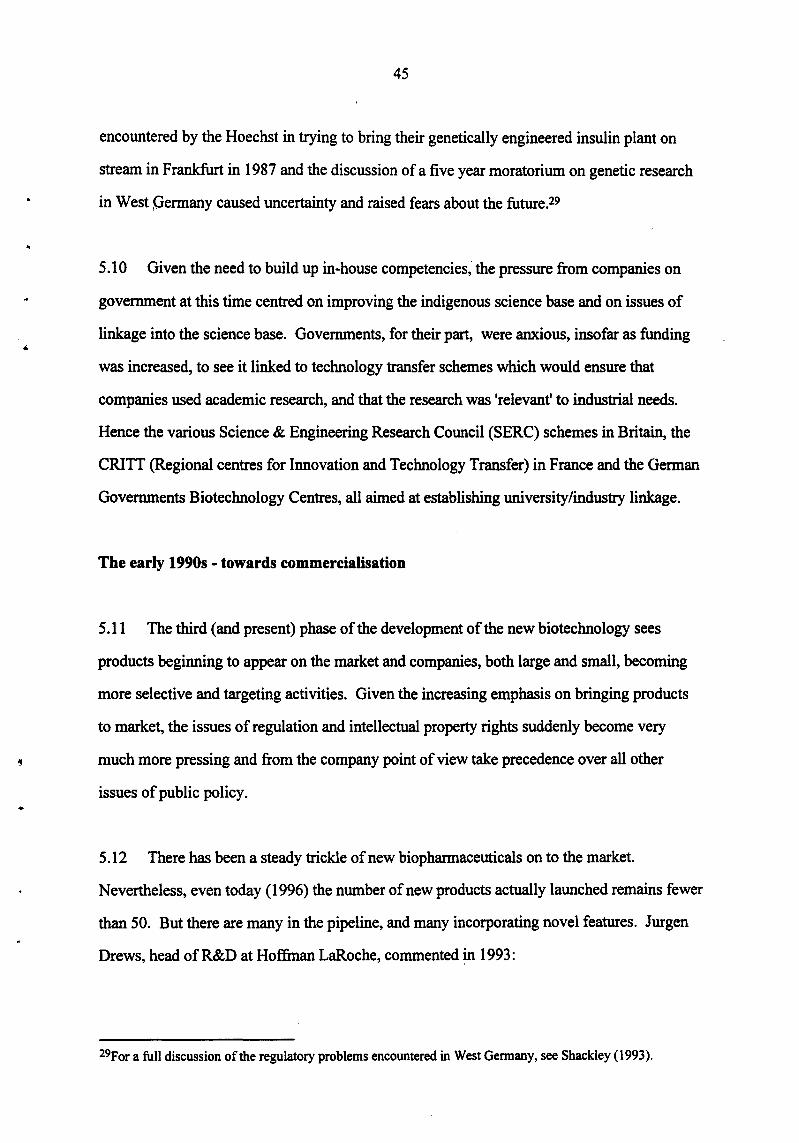
..
..
•
45
encountered by the Hoechst in trying to bring their genetically engineered insulin plant on
stream in Frankfurt in 1987 and the discussion of a five year moratorium on genetic research
in West permany caused uncertainty and raised fears about the future. 29
5.10 Given the need to build up in-house competencies; the pressure from companies on
government at this time centred on improving the indigenous science base and on issues of
linkage into the science base. Governments, for their part, were anxious, insofar as funding
was increased, to see it linked to technology transfer schemes which would ensure that
companies used academic research, and that the research was 'relevant' to industrial needs.
Hence the various Science & Engineering Research Council (SERC) schemes in Britain, the
CRITI (Regional centres for Innovation and Technology Transfer) in France and the German
Governments Biotechnology Centres, all aimed at establishing university/industry linkage.
The early 1990s - towards commercialisation
5.11 The third (and present) phase of the development of the new biotechnology sees
products beginning to appear on the market and companies, both large and small, becoming
more selective and targeting activities. Given the increasing emphasis on bringing products
to market, the issues of regulation and intellectual property rights suddenly become very
much more pressing and from the company point of view take precedence over all other
issues of public policy .
5.12 There has been a steady trickle of new biopharmaceuticals on to the market.
Nevertheless, even today (1996) the number of new products actually launched remains fewer
than 50. But there are many in the pipeline, and many incorporating novel features. Jurgen
Drews, head of R&D at Hoffman LaRoche, commented in 1993:
29For a full discussion of the regulatory problems encountered in West Germany, see Shackley (1993).

46
While there are some redundancies among the ISO or so novel proteins in
development, about 1 00 represent truly novel substances that have no precedent in
medical therapy. Not all of these proteins will reach the market, but it is fair to
assume that their attrition rate will be lower than that for small chemical entities
because they should cause few unmanageable toxicological problems. A conservative
estimatJ would expect 30-40 of the recombinant proteins now under development to
become successfully marketed products over the next 5-6 years.
(Drews, 1993)
Looking beyond the 10 year horizon, Drews foresaw the. arrival first of the cytokine based
drugs which will treat various kinds of cancer, many based on novel combinatiOil$ of proteins
and other chemical entities. Diseases such as Parkinson's and Alzheimer's and neural
disorders are high on the list of targets. The most far reaching of current developments,
however, come from another source - from work involved with understanding the human
genome (and, concomitantly, unravelling genes' physiological function and roles in disease
processes). Current initiatives in genome mapping will help identify many new proteins with
therapeutic potential and also illuminate an even greater number of possible targets especially
when linked to the new developments in combinational chemistry. Gene therapy itself
direct intervention to alter the genetic make-up of cells - may also have far reaching effect on
both pharmaceutical and health care industries.
5.13 The implications of these developments are interesting. Although they show a
maturing of biotechnology, it is still an area of active, indeed dynamic, development by both
large and small firms in the industry. In the small fmn sector, the early 1990s saw setbacks
for some of the leading players of the 1980s. Genentech, the largest and in many ways the
most successful of the new biotechnology companies, managed to launch its tissue
plasminogen activator (tP A) in 1989 after 10 years of development, but ran mto difficulties in
the process and was therefore in no position to fight the effective take-over bid from Hoffman
LaRoche the following year.JO Centacor took its product Centatoxin (for treating septic
30one of the problems Genentech faced was that in order to recoup its heavy R&D spend it priced its tPA at the top end of the price spectrum. This led to Medicare and many insurance companies in the US refusing to pay for its use and insisting on cheaper alternatives, especially after a damming report which suggested it was no
~ .
e I I
' I
, I . '
I
i

,.
47
shock) all the way but fell at the last hurdle of FDA (Food and Drug Administration)
approval which entailed another year of testing which has had a crippling effect on the
company.31 Cetus, one of the first DBFs to emerge in the 1970s and one of the strongest
duri~g the 1980s has also hit difficulties in developing its products32 and amalgamated with
another DBF, Chiron, for survival. Chiron, always closely linked to Ciba Geigy, is now 49.9
per cent owned by the Swiss firm.
5.14 In their place a new generation of leading players have emerged. Amgen, for
example, has succeeded in launching first its erythropietin (Epogen) and then its colony
stimulating factor, Neupogen. It now has sales of over $1 billion per annum. (See Table 17)
Human Genome Sciences is a leading firm in the gene sequencing business. Companies such
as Affimix and Sphinx are leaders in combinational chemistry. But although most DBFs still
aim to follow Amgen and become fully integrated pharmaceutical or chemical companies,
none have so far made it.JJ Most DBFs continue to exist because they have established a
synergistical relationship with the larger companies. Increasingly, as Table 17 shows, they
are the source of new product ideas, but for their part the small companies depend on the
larger firms not only to market these products but to carry them through the expensive
development stages (which means taking them through Phase II and III trials). The large
firms also remain a key source of fmance. The two sectors of the industry remain therefore
mutually dependent upon each other. Hence, while the DBF sector is as active as ever, the
larger firms are also increasing commitments.
more efficacious than these alternatives. As a result sales were lower than anticipated, share prices fell and help had to be sought. See "An Appetite for Technology: Hoffman LaRoche", BioTechnology, August 1992. 31 See "FDA flattens Centacor" and "What went wrong with Centoxin", Bio/Technology, Vol 10, June 1002, pp616 and 617. 32cetus only survived because it sold its best innovation (its PCR patents) to Hoffman LaRoche for $300m in 1991. It could neither afford to develop them in-house nor to sit on them. They also funded a collaboration with instrument manufacturer Perkin Elmer to develop machines for PCR techniques. See op cit footnote 14 above. Se also "Hope and Hype in Biotechnology", Bio/Technology, Vol10, September 1992, pp946-947. 33This is well illustrated in Barry Werth's The Billion Dollar Molecule (New York. Knopf 1994) which describes the frantic early years of the Vertex company in Boston.
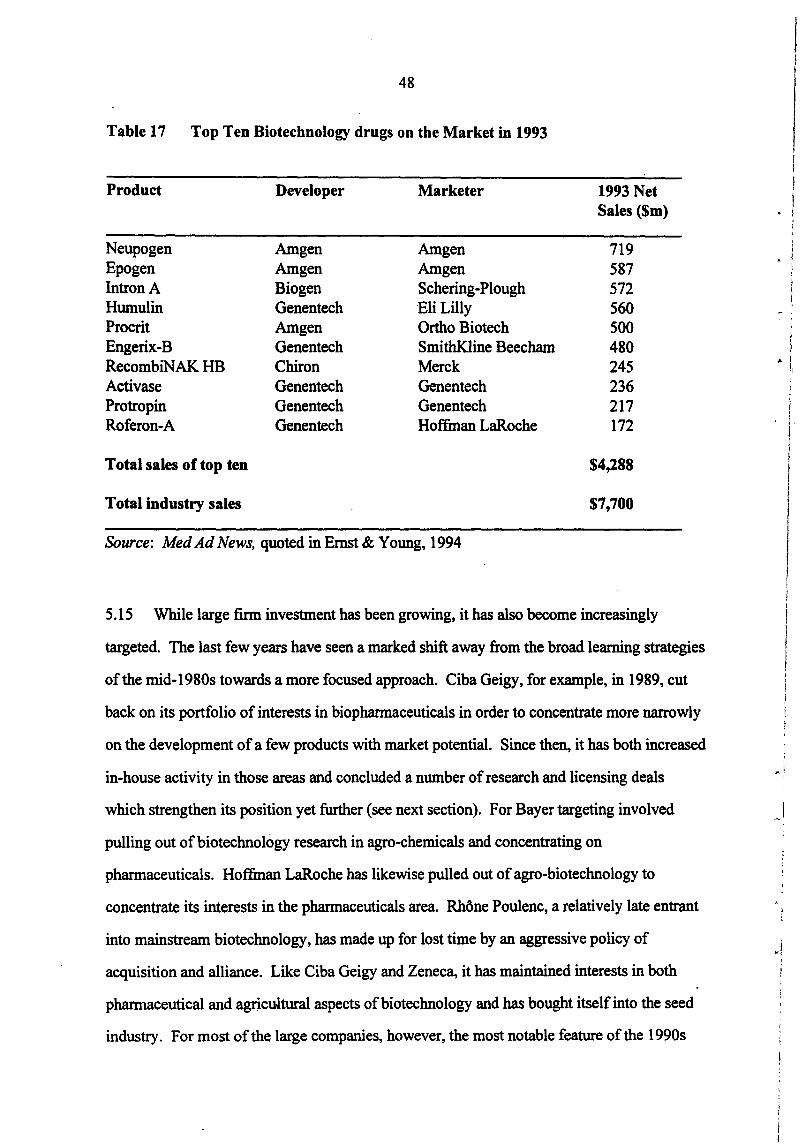
48
Table 17 Top Ten Biotechnology drugs on the Market in 1993
Product Developer Marketer 1993 Net Sales ($m)
Neupogen Amgen Amgen 719 Epogen Amgen Amgen 587 IntronA Biogen Schering-Plough 572 Humulin Genentech Eli Lilly 560 Procrit Amgen Ortho Biotech 500 Engerix-B Genentech SmithKline Beecham 480 RecombiNAK HB Chiron Merck 245 Activase Genentech Genentech 236 Protropin Genentech Genentech 217 Roferon-A Genentech Hoffman LaRoche 172
Total sales of top ten $4,288
Total industry sales $7,700
Source: Med Ad News, quoted in Ernst & Young, 1994
5.15 While large finn investment has been growing, it has also become increasingly
targeted. The last few years have seen a marked shift away from the broad learning strategies
of the mid-1980s towards a more focused approach. Ciba Geigy, for example, in 1989, cut
back on its portfolio of interests in biopharmaceuticals in order to concentrate more narrowly
on the development of a few products with market potential. Since then, it has both increased
in-house activity in those areas and concluded a number of research and licensing deals
which strengthen its position yet further (see next section). For Bayer targeting involved
pulling out of biotechnology research in agro-chemicals and concentrating on
pharmaceuticals. Hoffman LaRoche has likewise pulled out of agro-biotechnology to
concentrate its interests in the pharmaceuticals area. Rhone Poulenc, a relatively late entrant
into mainstream biotechnology, has made up for lost time by an aggressive policy of
acquisition and alliance. Like Ciba Geigy and Zeneca, it has maintained interests in both
pharmaceutical and agricultural aspects of biotechnology and has bought itself into the seed
industry. For most of the large companies, however, the most notable feature of the 1990s
I • !
~ '
'
.. lr
l i l I I I
I
)
I '

49
has been the explosion of collaborations with American DBFs. This development is explored
in more detail in the next section.
6 ALLIANCES, LINKAGES AND TECHNOLOGY TRANSFER
6.1 This section seeks to explore the degree to which the European chemical/
pharmaceutical industry is linked into the US biotechnology base, comprehending both the
,.. DBFs and the US university system. The main evidence is presented in Annex A which
presents in tabular form the linkages of some of Europe's major pharmaceutical companies.34
While not necessarily accurate in every detail, the weight of evidence points firmly to
relatively deep penetration of the US biotechnology base by European companies.
· Corporate alliances
6.2 The outstanding feature of Annex A is the very large number of corporate alliances
with American DBFs undertaken by these European multinationals. Table 18 summarises the
data. Ciba Geigy, the company which in the early 1980s broke with tradition in contracting
out key research on biotechnology, leads the list with 29 known alliances, but Hoffmann
LaRoche on 27 and Hoechst on 24 are close runners up. By contrast, the British companies
ICI and Zeneca (de-merged in 1993) between them have only two listings.
6.3 Even more interesting is the second column in Table 18, the number of agreements
concluded since 1990. This reinforces what has been said earlier about the continuing
dynamism of the DBF sector - indeed if anything it suggests an increase in the number of
alliances between these two sets of players in the last five years at a time when, as indicated
in the previous section, these companies have themselves been investing heavily in
biotechnology.
34This listing was compiled for another piece of research and does not give full details for companies dedicated to pharmaceuticals- eg, Glaxo or SmithKline Beecham.
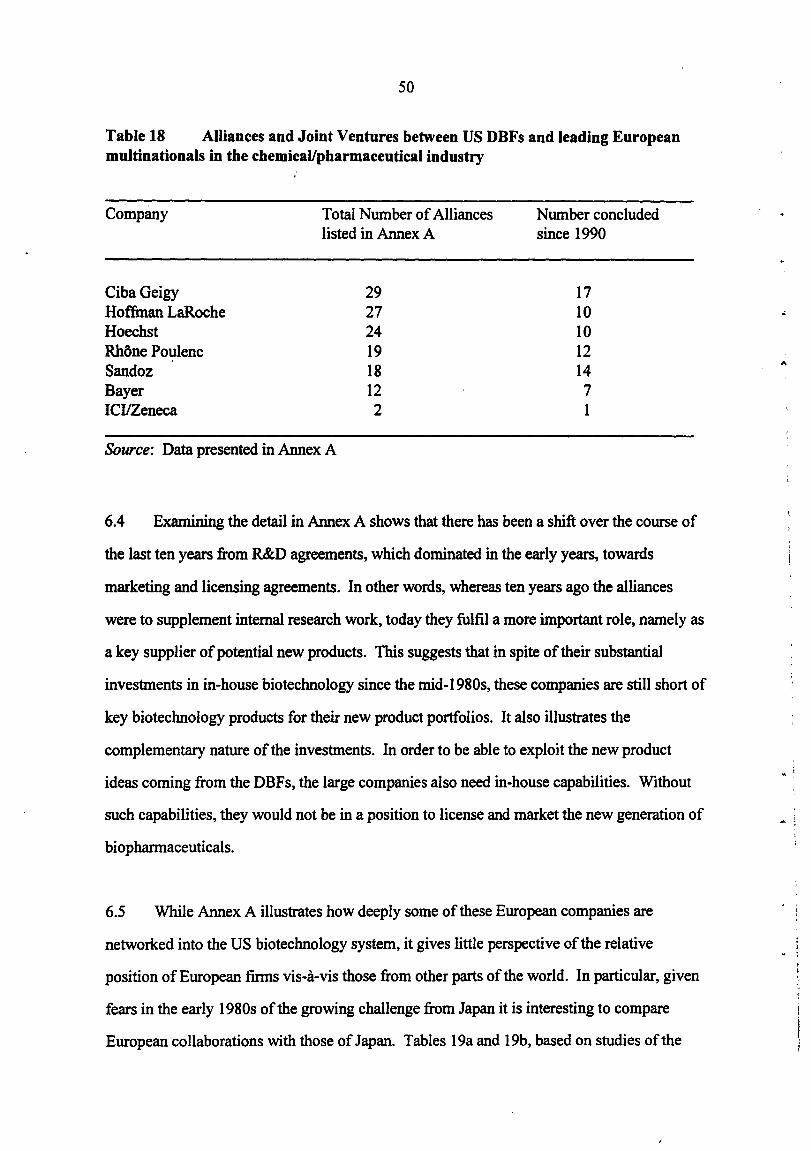
50
Table 18 Alliances and Joint Ventures between US DBFs and leading European multinationals in the chemical/pharmaceutical industry
Company
CibaGeigy Hoffman LaRoche Hoechst Rhone Poulenc Sandoz Bayer ICI!Zeneca
Total Number of Alliances listed in Annex A
29 27 24 19 18 12 2
Source: Data presented in Annex A
Number concluded since 1990
17 10 10 12 14 7 I
6.4 Examining the detail in Annex A shows that there has been a shift over the course of
the last ten years from R&D agreements, which dominated in the early years, towards
marketing and licensing agreements. In other words, whereas ten years ago the alliances
were to supplement internal research work, today they fulfil a more important role, namely as
a key supplier of potential new products. This suggests that in spite of their substantial
investments in in-house biotechnology since the mid-1980s, these companies are still short of
key biotechnology products for their new product portfolios. It also illustrates the
complementary nature of the investments. In order to be able to exploit the new product
ideas coming from the DBFs, the large companies also need in-house capabilities. Without
such capabilities, they would not be in a position to license and market the·new generation of
biopharmaceuticals.
6.5 While Annex A illustrates how deeply some of these European companies are
networked into the US biotechnology system, it gives little perspective of the relative
position of European firms vis-a-vis those from other parts of the world. In particular, given
fears in the early 1980s of the growing challenge from Japan it is interesting to compare
European collaborations with those of Japan. Tables 19a and 19b, based on studies of the
..
...
j i
• !
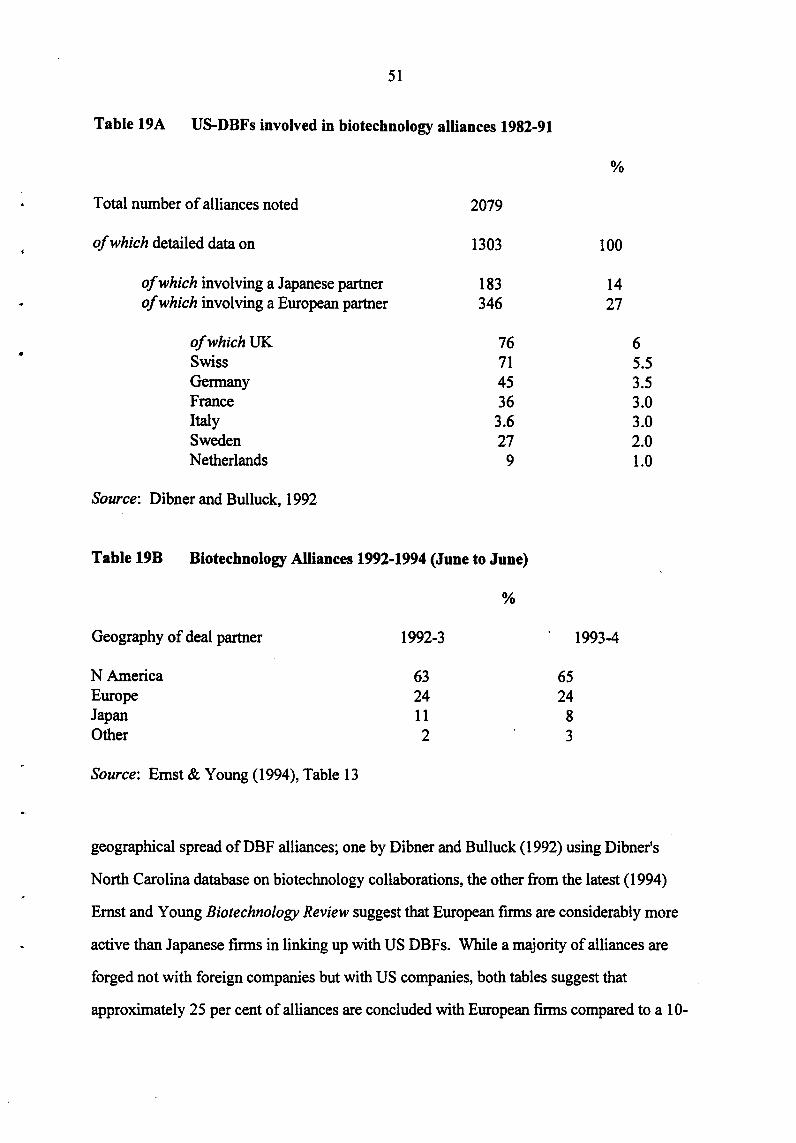
•
51
Table 19A US-DBFs involved in biotechnology alliances 1982-91
Total number of alliances noted 2079
of which detailed data on 1303
of which involving a Japanese partner 183 of which involving a European partner 346
ofwhichUK 76 Swiss 71 Germany 45 France 36 Italy 3.6 Sweden 27 Netherlands 9
Source: Dibner and Bulluck, 1992
Table 19B Biotechnology Alliances 1992-1994 (June to June)
Geography of deal partner
N America Europe Japan Other
Source: Ernst & Young (1994), Table 13
1992-3
63 24 11 2
%
65 24
8 3
%
100
14 27
1993-4
6 5.5 3.5 3.0 3.0 2.0 1.0
geographical spread of DBF alliances; one by Dibner and Bulluck (1992) using Dibner's
North Carolina database on biotechnology collaborations, the other from the latest (1994)
Ernst and Young Biotechnology Review suggest that European firms are considerably more
active than Japanese firms in linking up with US DBFs. While a majority of alliances are
forged not with foreign companies but with US companies, both tables suggest that
approximately 25 per cent of alliances are concluded with European firms compared to a 10-
52
12 per cent share with the Japanese and a 60 plus per cent share to North America (including
Canada). It is notable that on the issue of technology transfer, Dibner and Bulluck comment:
"Of the 346 alliances we were able to code the direction of technology or product
flow in all but 36. Of the coded alliances, 71 per cent had the technology or product
flowing to Europe, 25 per cent had the technology or product flowing to the United
States, and the remainder (14 alliances) were bilateral .... However, it should be
noted that many of the alliances are licensing or marketing agreements ... Since the
majority of these alliances involve smaller US firms not likely to have sufficient
resources to market globally, they may provide these firms with opportunities not
otherwise available."
(Dibner and Bulluck, 1992, p632)
It is perhaps worth adding that in saying that the alliance "had the technology or product
flowing to Europe", Dibner and Bulluck meant, of course, to European-owned firms. Most
of these firms are major multinational companies and have a substantial presence in the US.
Mergers, Acquisitions and Overseas Laboratories in the US
6.6 The ownership of subsidiaries and affiliates overseas is given by columns-3 and 4 in
the individual company tables in Annex A. Column 2 lists overseaS laboratories in the US;
Column 3 lists acquisitions anq mergers. Often the two are related. Bayer, for example,
acquired two medium-sized US pharmaceutical firms, Miles and Cutter, in the late 1970s and
their laboratories in West Haven, Connecticut and California have formed the basis of Bayer's
research presence in ·the US. Molecular Diagnostics, a DBF in New Haven established with
help from Bayer, was absorbed within the Miles Laboratories in 1992. Ciba Geigy's animal
health laboratory in the US is based on its acquisition from Bristol Myers Squibb in 1990.
On the other hand its plant breeding laboratories in North Carolina and its Pharmaceutical
Division in New Jersey derive from earlier decisions to develop these facilities in the US .
. Both are located close to university campuses. Indeed, Research Triangle Park in North
Carolina where Ciba Geigy's plant breeding laboratory is located has proved a popular

53
location for European multinationals. Glaxo, Wellcome, Ciba Geigy and Roche all have
research laboratories in the area. Rhone Poulenc is the company amongst those listed which
has pursued the most aggressive policy of growth by acquisition. Together with its
subsidiary Institut Merieux it bought Connaught Biosciences, Canada's largest biotechnology
firm, in 1989 to make the combin~d operation (Merieux plus Connaught) the world's largest
producer of vaccines. Then in 1990, it bought Rorer, a fairly substantial US pharmaceutical
company which already had a fair track record in research and the company's work in
pharmaceuticals is now led by Rorer. It was the Rorer laboratories which in 1994
spearheaded the company's 'network collaboration' Gencell of 14 companies in genome
sequencing area. Rhone Poulenc, like Zeneca, has also been actively acquiring seed
companies.
6. 7 The detail of Annex A also demonstrates the extent to which these European
multinationals have put down roots into the US science base. Table 20, derived from a study
which analysed European and Japanese company research laboratories in the US (Dibner,
Stock and Greis, 1992) located 76 sites where the companies concerned were engaged in
biotechnology R&D; of these, 60 belonged to European parent firms and only 16 to Japanese
parents. Even more revealing is the data contained in the second half of the Table which
shows the average number of collaborations for the two different typ~s of site - in particular
the degree to which the European sites are linked into the American university system with
(on average) over six linkages per site compared to the Japanese 2.4 average.
Academic Links
6.8 Table 20 highlights not only the large number of US laboratories run by European
multinationals, but the extensive linkages which these laboratories have with US universities.
The picture that emerges from this data for most companies is of extensive linkage through
the DBFs and their overseas research laboratories into the US science base.

54
Table 20 Linkages between US-based facilities of European and Japanese companies involved in biotechnology research
Number of Sites
Linkages with Universities (av) Biotechnology firms (av) Other corporations ( av) Total collaborations (av)
European-Owned Sites
60
6.04 0.93 1.00 7.42
Source: Dibner, Stock and Greis, 1992.
Japanese-Owned Sites
16
2.42 0.17 0.58 3.17
6.9 An exception to this general picture is Zeneca, which, although it has substantial
laboratories at Wilmington, PA, has few linkages with DBFs. Other UK firms (Glaxo,
SmithK.line Beecham, Wellcome) have also been slow to develop such linkages, although
Glaxo and SmithKline Beecham have recently been actively developing DBF links. By
contrast Zeneca (formerly ICI pharmaceuticals and agro-chemicals) has been very deeply
networked into the UK science base. An evaluation of the UK Science and Engineering
Research Council's (SERC) Biotechnology Directorate (Senker and Sharp, 1988) found ICI
the most active participant in the Directorate's programmes promoting university/industry
links and the company itself had established and supported laboratories at the Universities of
Leicester and Cambridge. Several of the products the company currently has under
development derive directly from such linkages. This view of Zeneca (ICI) as a company
linked into its home (UK) academic base rather than into the US is reinforced by recent work
undertaken at SPRU on collaboration as revealed by jointly authored publications. Table 21
looks at the performance of the individual firms in 1989. ICI tops the league with 363
papers.Js Of these 238 (66%) were collaborative and 203 of these (85%) were collaborative
with universities most of these (190) being within th~ UK. As a whole the data show that
3Szeneca demerged from ICI in 1993. At this time (1989) therefore it was an integral part ofiCI.

"
55
Table 21 Collaboration through publication - company profiles
ICI BASF Bayer Hoechst Ciba Geigy Total
Total No of publications 363 91 119 210 311 1094
Collaborative publicationsa23 8 38 55 133 159 623 (66%) (42%) (46%) (63%) (51%) (57%)
of which - with universitiesb 203 23 40 99 120 485
(85%) (60%) (46%) (63%) (51%) (78%) - domesticb 190 27 39 91 58 409
(80%) (71%) (73%) (75%) (76%) (65%) - with Europeb 223 34 51 112 124 544
(94%) (89%) (93%) (84%) (78%) (87%)
a Collaborative publications shown as a percentage of total publications b Publications shown as percentage of collaborative publications. Note: a small number of publications have been classified as both a domestic collaboration and a foreign collaboration where more than two authors are cited.
Source: Unpublished data from Hicks, lsard and Martin (93)
most of the collaborations were within Europe (94% for ICI- the lowest being Ciba Geigy
with 78% ). These figures suggest that there is very little co-authoring of work between
European researchers and their US counterparts in corporate laboratories.
Implications for Technology Transfer
6.10 The evidence presented so far in this section suggests that in their need to access
biotechnology expertise, many European based multinationals are linking into the American
science base via DBFs and overseas laboratories. While, following Reich (1991), this need
do no harm, ensuring production opportunities and profits for the multinational and high
productivity jobs for the US, it does pose the question of how far these companies are shifting
all leading-edge biotechnology_ research off-shore, thus depriving Europe of the necessary '
learning opportunities and training in newly emerging areas of biotechnology.
56
6.11 Recent research at SPRU funded under the Biotech programme (Senker, Joly and
Reinhard, 1996) has explored this question through a series of case studies based on
interviews with leading researchers in corporate laboratories. The answers are reassuring for
they show that while a good deal of research is being conducted in the US, much of it is
driven by the need to develop and test products for that market, in that market, and that in no
way is there any systemic tendency for leading edge biotechnology research to migrate across
the Atlantic. On the contrary, European laboratories have built up and are maintaining a
strong core of research in biotechnology, using linkages with US DBFs mainly in areas where
Europe has weaknesses- for example, gene therapy, genomics and combinational chemistry.
In such cases the link was directly from the European HQ to the DBF and the technology
transfer was from the DBF to the European firm. In this sense, the relationship remains
complementary and the linkage, far from weakening European capabilities, is helping to
reinforce them.
7 CONCLUSIONS
What conclusions emerge in relation to the innovativeness of Europe's pharmaceutical
industry?
(i) Innovation is not easily measured in the pharmaceutical industry. It is a research
intensive industry, but R&D does not necessarily lend to innovative drugs. Indeed, given the
oligopolistic nature of the industry and the need to block and counter advantage gained by
competitors, too much R&D is devoted to producing me-too drugs and duplicating research
undertaken by others. The same problem affects both patenting (too much defensive
patenting) and counts of drugs under development (does a large count mean poor
management or real innovation?). The best measure, which effectively leaves it to the market
to 'pick the winners', is to take numbers of drugs in the top selling 25 or 50 drugs on the
market, but even this has its drawbacks, measuring past rather than present innovation.
~.

..
57
(ii) Using this measure, US companies, with 26 out of the top 50 best selling drugs, prove
to be the most innovative with companies such as Merck, Eli Lilley and Pfizer, combining a
strong innovative tradition with high re-investment from profits into R&D so that the system
becomes self-reinforcing. Merck in particular stands out as a company which has kept itself
at the forefront of the industry with a steady stream of attractive and innovative new drugs.
(iii) Europe, with 21 out of 50 top selling drugs, is not far behind, whereas Japan with only
three of 50 lags well behind. Within Europe it is the British companies, with between them
14 out of the European total of21 top selling drugs, which stand out as the success story.
Their position in world rankings has risen steadily over the last two decades, they have a
larger market share of the highly competitive US market than their European counterparts and
they have been steadily increasing their share of European and South East Asian markets.
Britain is also host to a large number of overseas laboratories for American pharmaceutical
companies. These are almost wholly staffed and managed by British personnel and in this
sense both reflect and reinforce innovative capabilities in this area.
(iv) By contrast, the German and Swiss companies, traditional market leaders in Europe,
fare relatively badly, with Bayer and Ciba Geigy (each with two top selling drugs compared
to Glaxo's six (Glaxo-Wellcome seven) and SmithKline Beecham's four) leading the field. It
is notable, however, that it is Swiss and German companies that top the lists in terms of R&D
and numbers of drugs under development. This could be seen as following a 'Merck strategy'
-trying to buy themselves into the virtuous self-reinforcing cycle of high investment in R&D
yielding high profit drugs which finance yet further investment.
(v) The key to the future lies with the biopharmaceuticals and biotechnology where
European pharmaceutical companies were slow to develop in-house capabilities allowing the
leading edge of the technology to be developed in the United States by the small, specialised
dedicated biotechnology companies (DBFs). In contrast to the position in the 1950s and
1960s when the innovative new drugs were coming from the in-house research laboratories of
58
the major pharmaceutical companies, today's innoyative drugs have been 'discovered' in
academic laboratories or the quasi academic laboratories of the DBFs.
(vi) In some senses Europe's large pharmaceutical companies have shown surprising
flexibility in this shift from chemistry to biology. Swiss and German companies have broken
with tradition and bought into external research, both through linkages with the DBFs and
through agreements of one sort or another which have given them access to the American
science base. The French too have been active in developing such links, with Rhone
Poulenc's merger with Rorer providing that company with an American base for the
development of pharmaceuticals. These linkages, combined with heavy in-house investments
in the new technologies, means they are now in a position to exploit developments in
biotechnology. In the last few years in particular there has been a notable shift towards deals
with DBFs which replenish product portfolios with drugs in development rather than the
early deals involving exploratory research.
(vii) The exception, until recently, have been the British drug firms which have chosen to
exploit linkages with the British rather than the American science base. British capabilities in
molecular biology and molecular genetics, combined with a more mature venture capital
market mean that Britain also has had a stronger and more active small firm sector in
biotechnology than any other country in Europe. Substantial investments in the public
science base and the development of venture financing in other European countries, means
that Britain is no longer as distinct in this field as it was in the 1980s.
(viii) Significant changes have taken place in the last two-three years. The emergence of a
new 'generation' ofbio-pharmaceutical research with developments in genomics, bio
informatics and combinational chemistry have seen the British companies, SmithKline
Beecham and Glaxo-Wellcome investing heavily in US capabilities, Rhone Poulenc Rorer
developing its Gencell network and Pfizer now following suit. These developments suggest
that all companies are now shifting from the old model of concentrated in-house R&D to one
' .

..
59
which accepts a new extended division-of labour, with specialist companies performing
specialist roles.
(ix) These changes reinforce other cost cutting pressures on the major pharmaceutical
companies, especially pressures from governments anxious to limit the public sector
liabilities on drugs expenditure. The spate of mergers already seen in the industry, which
seek to reinforce research and rationalise distribution systems, are likely to be followed by
others as companies reassess capabilities and reposition themselves in the market.
(x) It is not yet clear where these trends will lead- to large, international companies
whose main role is to co-ordinate specialist international teams? Or to tight knit
organisations like Merck which, nevertheless, have the ability to assimilate and use
information from a wide variety of sources?
(xi) Given continuing uncertainty, priority in terms of innovation means creating an
environment conducive to innovation rather than pre-empting particular routes. For
European countries and companies this means:
(a) continuing high level support for the public research base in the life sciences- so
much of the creativity in the US has come from the exploitation of public research
fmdings, it is vital that the squeeze of public fmances does not 'kill' this 'goose which lays
the golden eggs';
(b) exploitation of that science b~e as a European resource - at present too little is
known, especially by the company sector, of capabilities that lie within Europe but
outside national boundaries;
(c) the reinforcement of the Single Market in pharmaceuticals with the dismantling of
national regulatory regimes and the development of Community institutions such as the·
EMEA. Developments to date have been too slow and hampered by too many national

60
sensitivities. In particular an efficient regulatory framework for biotechnology-based
drugs is essential.
(d) The easing of fmancial restrictions on venture capital financing and the promotion
of other mechanisms for the support and funding of new, technology-based companies.
-..
61
REFERENCES
Archilladelis, Bet a/ (1990): 'The Dynamics of Technological Innovation: The Case of the
Chemical Industry', Research Policy, 19 (1), pp 1-35.
Brech, M and Sharp, M (1985): 'Inward Investment: Policy Options for the UK', Chatham
House Paper No 21, Routledge & Kegan Paul for Royal Institute of International Affairs.
Burstall, M Land Senior, I (1994): The Community's Pharmaceutical Industry, Economists
Advisory Group for the Commission of the European Communities.
Chetley, A (1990): A Health Business, Zed Publications.
Clark, C and Walton, F (1992): 'Europe's Emerging Biopharmaceutical Companies'.
Bioi/'echnology, VollO, October, pp1108-1110.
Coleman, R F (1988): 'National Policies and Programmes in biotechnology', in
Biotechnology: The Changing Role of Government, OECD, Paris.
Dibner, M (1991): 'Tracking trends in US biotechnology'. Bioi/'echnology, Vol9,
December, ppl334-1337.
Dibner, M and Bulluck, J A (1992): 'US/European Strategic Alliances in Biotechnology'.
Biotechnology Forum Europe, Vol9, October, pp628-635.
Dibner, M; Stock, G and Greis, N (1992): 'Away from Home: US sites of European and
Japanese Biotech R&D'. Bioi/'echnology, VollO, December, ppl535-1538.
Dimasi, J A; Hansen, R W; Grabowski, H G and Lasagna, L (1991): 'The Cost oflnnovation
in the Pharmaceutical Industry: New Drug R&D Cost Estimates', Journal of Health
Economics, June.
Drews, J (1993): ... Into the 21st Century. Biotechnology and the Pharmaceutical Industry in
the next I 0 years", Bioi/'echnology, 11 March 1993.
Ernst and Young (1994): Reform, Restructure and Renewal, 9th Annual Report on the
Biotechnology Industry.

62
Galimberti, I (1993): Large Firms in Biotechnology: Case Studies on Learning Radically
New Technologies, DPhil Thesis, SPRU.
Gambardella, A (1995): Science and Innovation: The US pharmaceutical industry during
the I 980s, Cambridge University Press, Cambridge, UK.
Griliches, Z (1990): 'Patent Statistics as Economic Indicators', Journal of Economic
Literature, 28.
Hicks, D; Isard, P and Martin, B (1993): University-Industry Alliances as revealed by joint
publications, Mimeo, SPRU.
Irvine, J; Martin, BRand Isard, P (1990): Investing in the Future: An International
Comparison of Government Funding of Academic and Related Research, Edward Elgar.
Joly, P-B (1992): Organisational Learning, Diversity and Interactions in a Sectoral
Innovation System. Paper presented at workshop on "Systems of Innovation", Bolgna,
October 1992. Mimeo. Obtainable from INRA/SERD BP47 38040, Grenoble, Cedex.
Kenney, M (1986): Biotechnology: The University-Industry Complex, Yale University
Press, New Haven.
Lake, A W (1976): 'Foreign Competition and the UK Pharmaceutical Industry', NBER
Working Paper No 155.
Martin, P and Thomas, S (1996): The Development of Gene Therapy in Europe and the
United States: A Comparative Analysis, STEEP Special Report No 5, SPRU, University of
Sussex, September 1996.
MEFA (1992): Facts 1992: Medicine and Health Care, Copenhagen, July
Mossialos, E; Kanavos, F and Abel Smith, B (1993): Policy Options for Pharmaceutical
R&D in the European Community, London School of Economics, November.
OECD (1987): Recombinant DNA Safety Considerations: For Industrial, Agricultural and
Environmental Applications of Organisms Derived by Recombinant DNA Techniques, Paris,
OECD.
~ ' -,!
63
Office of Technology Assessment (OTA) (1984): Commercial Biotechnology. OTAIUS
Government Printing Office.
Office of Technology Assessment (OTA) (19.88): New Developments in Biotechnology: US
Investment in Biotechnology, OTAIUS Government Printing Office, Washington DC.
Office ofTechnology Assessment (OTA) (1991): Biotechnology in a Global Economy,
Office of Technology Assessment, Congress of the United States, Washington DC.
Office of Technology Assessment (OTA) (1993): Pharmaceutical R&D: Costs, Risks and
Rewards, OTA-H-522, Washington, DC: US Government Printing Office, February.
Patel, P and Pavitt, K (1995): 'Patterns of Technological Activity: their Measurement and Interpretation', in Stoneman, P ( ed): Handbook of Economics of Innovation and Technical Change" Oxford, Blackwell.
Pavitt, K (1988): 'Uses and Abuses of Patent Statistics', in Van Raan, A (ed): Handbook of Quantitative Studies of Science and Technology, North-Holland, Amsterdam.
Rizzoni, A (1995): 'SPRU Database on Europe's new dedicated biotechnology companies',
unpublished research, Science Policy Research Unit, University of Sussex.
Senker, J and Sharp, M (1988): The Biotechnology Directorate of the SERC: Report and
Evaluation of its Achievements, mimeo, SPRU.
Shackley, S (1993): The Regulation of Biotechnology in Europe, DP~l thesis submitted to
University of Sussex, UK.
Sharp, M (1985a): The New Biotechnology: European Governments in Search of a Strategy.
Sussex European Paper No 15. Available from SPRU, University of Sussex.
Sharp, M (1985b): "Biotechnology: Watching and Waiting". Chapter 6 in Sharp, M (ed):
Europe and the New Technologies, Pinter Publishers, London.
Sharp, M and Galimberti, I (1993): Coherence and Diversity: Europe's Chemical Giants
and the Assimilation of Biotechnology. Case study undertaken for EC FAST Project:
Coherence and Diversity in Europe's Industrial System. Mimeo, SPRU, University of
Sussex.
64
Thomas, L G III (1994): 'Implicit Industrial Policy: The Triumph of Britain and the Failure
of France in Global Pharmaceuticals', Industrial and Corporate Change, vol3, No 2, pp 451-
490.
!' '
,.. :
I'
..

AnnexA
Company Biotech Overseas Labs Interests USA
HOECHST Animal Health !.!SA inc Roussel Uclaf Phannaceuticals 1991 new R&D centre -
neurological disorders (I) Diagnostics Hoechst-Celanese
Separation Products Div ~ $27.85bn (1993) (2) (4)
Vaccines J!ti!: Plant breeding ~ S1865m (1992)
Pesticides 1988 Japan - drug research centre esp MADs ( 1)
1989 Japan - biotech centre and production plant 91)
1991 Japan- expansion of R&D/new research labs (I)
..
Acquisitions and Equity Purchases in US DBFs
Alliances with DBFs and Universities USA
1981 Massachusetts Hospitalresearch into molecular biology (I)
1984 lmmunex - drug development
1985 Genex- R&D serum proteins (I)
1985 Cetus- R&D vitamins (1)(3) Before 1986 Biogeo- R&D antimalaria vaccine (1)
Before 1986 Chiron- R&D t-PA (1)
19871ntegrated Genetics- development ofEPO(I)
1988 Codon- vaccines for animal parasites (I) 1988 Massachusetts Hospital - drug research (I) 1988 CaJon- R&D into vaccines (4) 1988 Calgene R&D programme into plant genetics (I)
19891mmunex -licensing (GM-CSF (3)
"
1989 University of Illinois- R&D into insecticides (I) 1989 Genex- veterinary (unspecified) (S) 1990 ImmunoGen -licensing anti-cancer drug (3)(c) 1991 Ecogen- R&D insecticides (I) 1991 Ecogen- marketing insecticides (3)
. 1991 Syntro- marketing vaccine (3) 1991 Syntro - R&D poultry vaccines (I) 1992 Triplex Phannaceuticals- R&D anti-viral drugs (I) 1992 Syntro- R&D cattle and horse vaccines (I) 1993 Oncogene Science-Don transcription-based drugs (6)
1993 Vertex- R&D on anti-inflam drugs (6) 1994 Oncogene Science - D on drugs against Alzheimers (7)
•
Biotech links in other countries
Annex A/1
1988 Bayer (Eur)- R&D into IDS diagnostics (4)
1988 Glaxo (Eur)- cephalosporins (4)
1988 lora (Eur) - R&D fungicides
1989 Nippon Kayaku (Jap)- drug R&D (4) 1990 DNARD (Jap)- joint venture develop/ market transgenic animal models (I)

_Company
BAYER
SJ!n: £24.70bn (1993)
MD: $1988m (1992)
Biotech Interests
Pharmaceuticals
Diagnostics
Vaccines
Plant protection
Agrochemicals
Overseas Labs USA
1!S.A
1988 major expansion of drug research centre (1)(2)
1989 new experimental station - plant protection (I)
Cutter Biological (2)
Miles Inc (2)
Miles Inc Diagnostic
Acquisitions and Equity Purchases in US DBFs
Acquisitions
Before 1986 Molecular Diagnostics (I)
1988 Cooper Technicondiagnostics (I)(S)
1989 Agricon- veterinary vaccines (S)
1989 Diamond Scientificveterinarian vaccines (I)
Division (2) 1994 Onyx Pharmacs (for Mlles)(7) Molecular Diagnostics (2)
Qlhl;[ 1988 Japan - construction agchem research labs (I)
1988 Japan - new drug research centre (I)
1990 Japan- new R&D facilities into CV disease (I)
• ..
Alliances with DBFs and Universities USA
Before 1986 Genentetech - factor VIII
Before 1986 Genetic Systems- MADs v infections (I)
1988 Cutter Biologjcal- production of therapeutics ( S)
1989 Calgene - research into plant herbicide resistance (I)
1989 Chiron -licensing TNF (4)(5)
1990 California Biotechnology -licensing therapeutics (S)
1991 California Biotechnology- CV disease drugs (I)
1991 lterex Pharmaceuticals - drug discovery (I) 1992 Syntro- marketing vaccines (c) 1992 Viagene - R&D on gene therapy for haemophia (b)
1993 N American Biologicals- supply of plasma (6) 1994 Onyx Pharmaceuticals -joint research on cancer drugs (7)
• -·
Biotech links in other countries
Annex A/2
1988 Hoechst (Europe)- R&D into AIDS diagnostics ( 4)
1988 Georg-Speyer Hans Research Lab (Europe)R&D(4)
'•
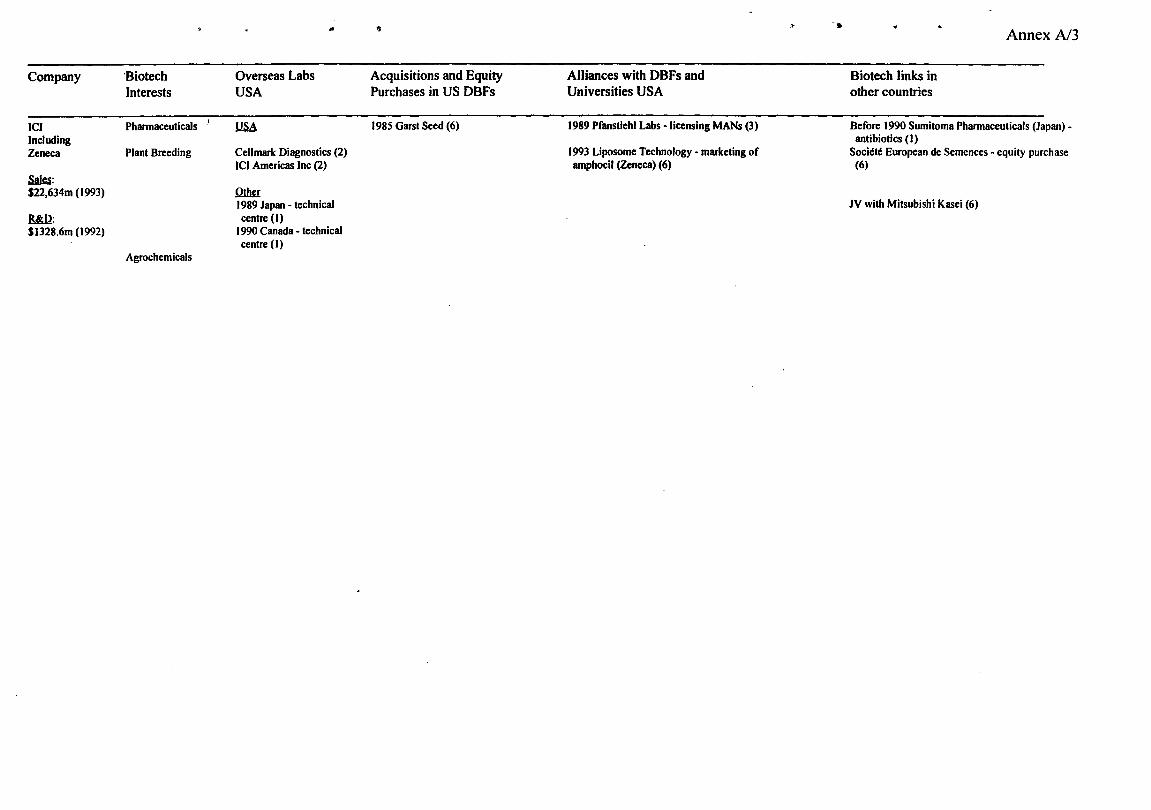
Company
ICI Including Zeneca
Saki: $22,634m (1993)
Bid!: $1328.6m (1992)
·Biotech Interests
"
Phannaceuticals
Plant Breeding
Agrochemicals
Overseas Labs USA
1!SA
•
Cell mark Diagnostics (2) ICI Americas Inc (2)
Q1lw: 1989 Japan - technical centre (I)
1990 Canada - technical centre (I)
1)
Acquisitions and Equity Purchases in US DBFs
1985 Garst Seed (6)
Alliances with DBFs and Universities USA
1989 Pfanstiehl Labs -licensing MANs (3)
1993 Liposome Technology - marketing of amphocil (Zeneca) (6)
» •
Biotech links in other countries
Annex N3
Before 1990 Sumitoma Phannaceuticals (Japan)antibiotics (I)
Societe European de Semences -equity purchase (6)
JV with Mitsubishi Kasei (6)

Company
CIBA-GEIGY
Sllg: $15.32bn (1993)
.R6dl: $1678m (1992)
Biotech Interests
Pharmaceuticals Diagnostics
Plant breeding/
Pesticides
Overseas Labs USA
!.!.SA 1984 N Carolina-plant breeding (I )(2)
Ciba Coming Diagnostic Corp (2)
Ciba-Geigy Corp Agricultural Division (2)
Ciba-Geigy Pharmaceuticals Division (2)
Qlbg 1987 Japan - research centre (I)
1990 Japan - research labs (I)
·~
Acquisitions and Equity Purchases in US DBFs
Acquisitions 1988 Cooper - therapeutics
1989 Ciba Coming Diagnostics buy out of joint venture (5)
1990 Bristol Myers Squibb (animal) health unit) (5)
1990 Biotrack (I)
1992 Sogetal - part of R&D programme on plants (I)
Eqpjtv purchase
1988 Chiron (1)(5)
1990 ISIS Pharmaceuticalstherapeutics (5)
1990 Tannox- diagnostics and therapeutics
1991 Affymax Research Institute (1)
;,J
Alliances with DBFs and Universities USA
1984 Bio-Response- protein production project (I) 1985 Biogen -licensing yeast promoter (3)
1985 Unigene Laboratories- research protease inhibs (3)
Before 1986 Chiron- R&D into insulin (I)
1987 joint venture Co with Chiron- vaccines (1)(3)
1988 Plant Technology- plant diagnostics (1)(3)(5)
1988 Synergen- marketing therapeutics (5) Before 1989 Agridiagnostics- fungal diagnostics (1)(5)
Before 1989 Calgene- plant resistance to pathogens (I)
1989 Evans Biocontrol - marketing plant agricultural products (5)
1989 Tannox Biosystems- MABs v AIDS (l)(c)(5)
19891nnovat -licensing drug delivery system (5) 1990 Univ California - funding research re arthritis (I) ISIS Pharmaceuticals - antisense technology (1 )(c)(5) 1990 Biosys- marketing pesticide (3)(5) 1990 synergen- marketing elastase inhibitor (3)(5) 1990 ICI America -licensing plant agriculture (5) 1990 Tannox Biosystems- MABs v allergies (c) 1991 Biosys ·marketing insecticide (3) 1991 Affymax ·drugs v cancer/autoimmune disease (c) 1992 Sibia ·research into CNS drugs (c) 1992 Biosys ·R&D into insect control agents (c) 1992 Aphton Corp - development of drugs against parasites in animals (6)
1992 Genencor lnt • development of enzymes for the pulp and paper industry (6)
1992 Glyco Tech- R&D on carbohydrates-based drugs (7)
1992 lnCyte Pharmaceuticals -licensing of PN-1 (6)
1993 Biocryst Pharmaceuticals -licensing of one family ofPNP inhibitors (6)
1993 Mycogen Corp -licensing and research on com hybrids (Ciba Seeds) (6)
1993 Oncogene Science and Pfizer - R&D on chemoprotectant (6)
,.,, •
Biotech links in other countries
'•
Annex A/4

Company Biotech Interests
---RHONE Animal health POULENC Phannaceuticals inc lnstitut Merieux Diagnostics
Sa)n: Vaccines $14.33bn (1993)
Plant Breeding Blill: $I 150m (1993)
,.
Overseas Labs USA
llSA
..
Before 1988 R&D centre - agrichemicals
1988 veterinary lab (I)
1990 R&D lab - food additives (I)
1990 R&D centre -drugs (I )(2??)
Rhone Poulenc Central Research (2)
CeiPrillndustries Inc (2)
~
1989 Japan- research/ production centre agrochems (I)
"'
Acquisitions and Equity Purchases in US DBFs
Acquisition 1984 Callaghan Enterprises - soya and com seeds (I)
1986 Select Laboratories - veterinary vaccines (3)
1989 Harris Moran Seeds (partial acquisition) (I)
1989 Connaught Biosciencesvaccines (I)
1989 Virogenetics - viral vector systems (I)
1990 Rorer - therapeutics ( 5)
Egujtv purchases
1991 Sepracor- bioseparation (3) 1994 Applied Immune Sciences (I)
Alliances with DBFs and Universities USA
19?? Scripps Clinic- R&D antithrombotic (I) 1984 Calgene- sunflower genetics (I)
1988lmmune Response- AIDS immunogen (I)
1989 Cal gene -plant herbicide resistance (I )(3)
1989 Cambridge Bioscience - veterinary •unspecified) (S)
1989 Molecular Genetics - R&D genetics of com (1)(3) ·
1989 Cenzyme - drug development (I) 1990 ISIS Phannaceuticals p R&D antisense (I)
1990 Medimune- drug research (I)
1990 Eastman Kodak - licensing veterinary products ( 5)
1990 Immune Response -licensing vaccines (5) 1990 ImmunoGen -licensing therapeutics (5) 1991 Wistar Institute- marketing rabies vaccine (I) 1991 Ecogen- marketing plant agricultural products (5) 1992 Merck- development of vaccines (I) 1992 Synbiotics -licensing of cat biological products (c) 1993 Enzon - licensing of Enzon's Oncaspar (I) 1994 Vical- development of vaccines (lnstitut Merieux) (4) 1994 Applied Immune Sciences, Darwin Molecular,
~
Genopoetic, Genetix Phannaceuticals, lntrogen Therapeutics, and others - JV to develop an international network of cell therapy centers (PRP Gencell) (I)
Biotech links in other countries
AnnexA/5
1988 Allelix (Can) into interleukine 6 (4) 1989 Mochida Phannaceutical (Jap)- drug development (4)
1989 Chugai Phannaceutical (Jap)- drug development (4)
1989 Nissue (Jap) - diagnostic reagents (4)
1989 Limagrain Nestle (Eur)- R&D (tomatoes)
1989 Biolafitte (Eur)- ultrafiltration (4)
1989 Condor Y cida De Cordoba (Eur)- R&D (4) 1989 Centre lot de Transfusion Sanguine (Eur) -R&D(4)
1990 University of Toronto (Canada)vaccine research (I)
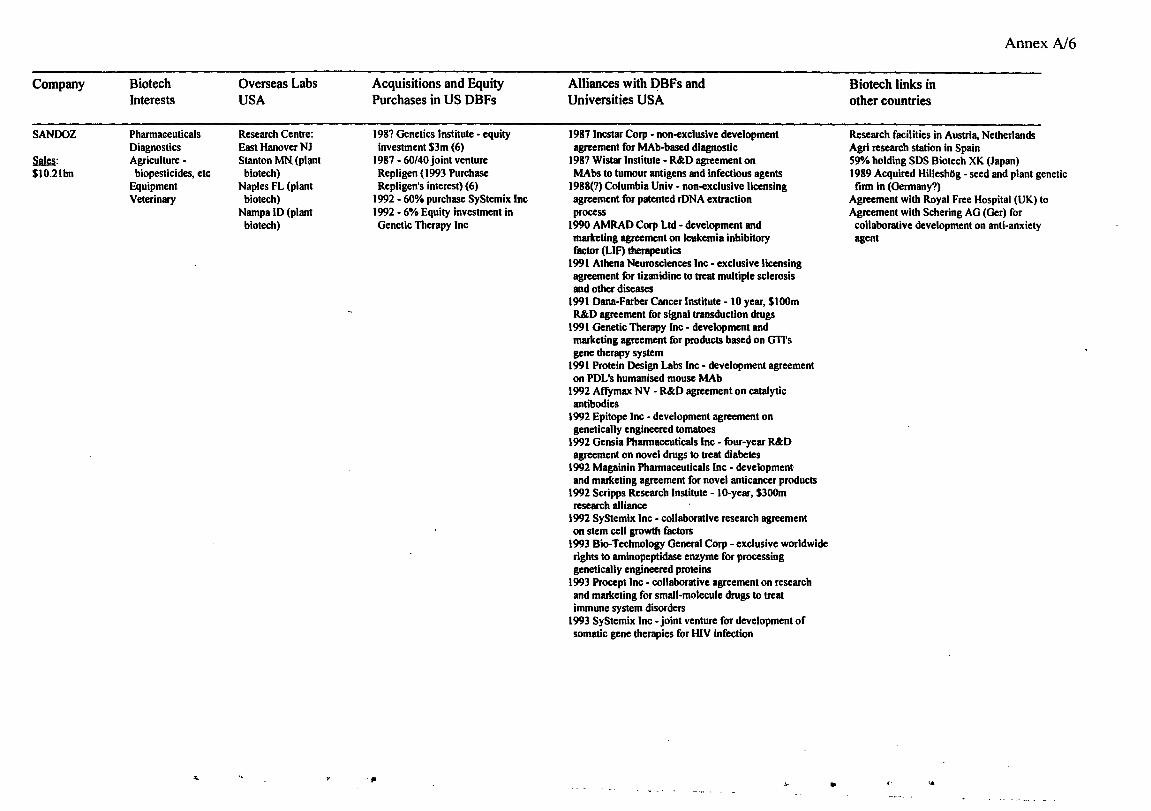
Company Biotech Overseas Labs Acquisitions and Equity Interests USA Purchases in US DBFs
SANDOZ Pharmaceuticals Research Centre: 198? Genetics Institute • equity Diagnostics East Hanover NJ investment $3m (6)
SW: Agriculture - Stanton MN. (plant 1987 - 60/40 joint venture $10.2lbn biopesticides, etc biotech) Repligen ( 1993 Purchase
Equipment Naples FL (plant Repligen's interest) (6) Veterinary biotech) 1992 - 60% purchase SyStemix Inc
Nampa ID (plant 1992 - 6% Equity investment in biotech) Genetic Titerapy Inc
-"" ,. ,,.
Alliances with DBFs and Universities USA
1987 lncstar Corp • non-exclusive development agreement for MAb-based diagnostic
198? Wistar Institute - R&D agreement on MAbs to tumour antigens and infectious agents
1988(?) Columbia Univ • non-exclusive licensing agreement for patented rONA extraction process
1990 AMRAD Corp Ltd • development and marketing agreement on leukemia inhibitory factor (LIF) therapeutics
1991 Athena Neurosciences Inc· exclusive licensing agreement for tizanidine to treat multiple sclerosis and other diseases
1991 Dana-Farber Cancer Institute- 10 year, $100m R&D agreement for signal transduction drugs
1991 Genetic Therapy Inc • development and marketing agreement for products based on GTI's gene therapy system
1991 Protein Design Labs Inc- development agreement on POL's humanised mouse MAb
1992 Affymax NV - R&D agreement on catalytic antibodies
1992 Epitope Inc- development agreement on genetically engineered tomatoes
1992 Gensia Pharmaceuticals Inc - four-year R&D agreement on novel drugs to treat diabetes
1992 Magainin Pharmaceuticals Inc· development and marketing agreement for novel anticancer products
1992 Scripps Research Institute- 10-year, $300m research alliance
1992 SyStemix Inc- collaborative research agreement on stem cell growth factors
1993 Bio-Technology General Corp- exclusive worldwide rights to aminopeptidase enzyme for processing genetically engineered proteins
1993 Procept Inc • collaborative agreement on research and marketing for small-molecule drugs to treat immune system disorders
1993 SyStemix Inc -joint venture for development of somatic gene therapies for IUV infection
..\- ..
Biotech links in other countries
AnnexN6
Research facilities in Austria, Netherlands Agri research station in Spain 59"/o holding SDS Biotech XK (Japan) 1989 Acquired HilleshOg - seed and plant genetic firm in (Germany?)
Agreement with Royal Free Hospital (UK) to Agreement with Schering AG (Ger) for collaborative development on anti-anxiety agent
<' .•
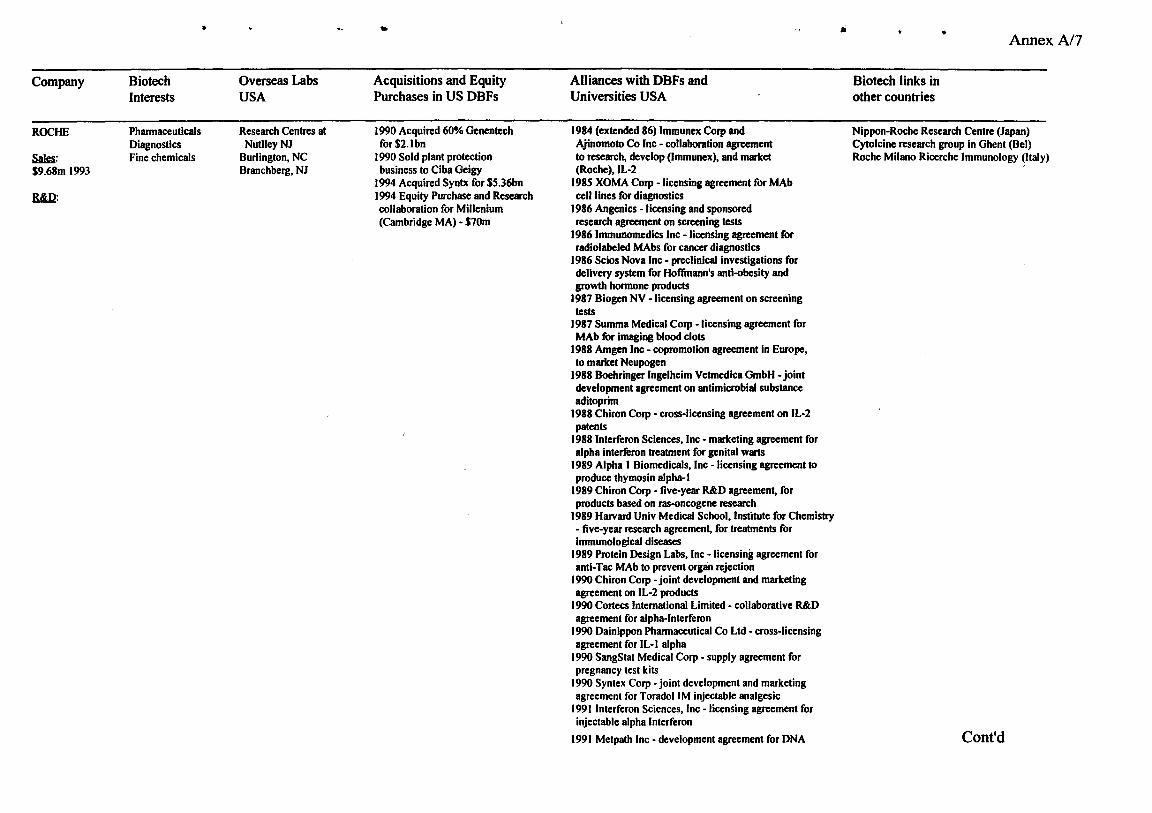
"
Company Biotech Interests
ROCHE Pharmaceuticals Diagnostics
SA!§: Fine chemicals $9.68m 1993
R&U:
Overseas Labs USA
Research Centres at NudleyNJ
Burlington, NC Branchberg, NJ
..
Acquisitions and Equity Purchases in US DBFs
1990 Acquired 60% Genentech for$2.1bn
1990 Sold plant protection business to Ciba Geigy
1994 Acquired Syntx for $5.36bn 1994 Equity Purchase and Research collaboration for Millenium (Cambridge MA) - $10m
Alliances with DBFs and Universities USA
1984 (extended 86) lmmunex Corp and Ajinomoto Co Inc - collaboration agreement to research, develop (lmmunex), and market (Roche), IL-2
1985 XOMA Corp -licensing agreement for MAb cell lines for diagnostics
1986 Angenics -licensing and sponsored research agreement on screening tests
19861mmunomedics Inc -licensing agreement for radiolabeled MAbs for cancer diagnostics
1986 Scios Nova Inc - preclinical investigations for delivery system for Hoffmann's anti-obesity and growth hormone products
1987 Biogeo NV -licensing agreement on screening tests
1987 Summa Medical Corp - licensing agreement for MAb for imaging blood clots
1988 Amgen Inc- copromotion agreement in Europe, to market Neupogen
1988 Boehringer lngelheim Vetmedica GmbH- joint development agreement on antimicrobial substance aditoprim
1988 Chiron Corp- cross-licensing agreement on IL-2 patents
1988 Interferon Sciences, Inc - marketing agreement for alpha interferon treatment for genital warts
1989 Alpha I Biomedicals, Inc - licensing agreement to produce thymosin alpha- I
1989 Chiron Corp - five-year R&D agreement, for products based on ras-oncogene research
1989 Harvard Univ Medical School, Institute for Chemistry - five-year research agreement, for treatments for immunological diseases
1989 Protein Design Labs, Inc - licensing agreement for anti-Tac MAb to prevent organ rejection
1990 Chiron Corp -joint development and marketing agreement on IL-2 products
1990 Cortecs International Limited - collaborative R&D agreement for alpha-Interferon
1990 Dainippon Pharmaceutical Co Ltd - cross-licensing agreement for IL-l alpha
1990 SangStat Medical Corp - supply agreement for pregnancy test kits
1990 Syntex Corp -joint development and marketing agreement for ToradoiiM injectable analgesic
1991 Interferon Sciences, Inc - licensing agreement for injectable alpha Interferon
1991 Metpath Inc- development agreement for DNA
•
Biotech links in other countries
• Annex A/7
Nippon-Roche Research Centre (Japan) Cytolcine research group in Ghent (Bel) Roche Milano Ricerche Immunology (Italy)
Cont'd

• .,.
probe assays 1992 Gencntech Inc - I 0-year development and marketing agreement DNase to treat cystic fibrosis and chronic bronchitis
1992 Xenova Ltd- exclusive rights to develop and market novel biochemical assay for immunosuppressant screening
1993 Celltech Group pic- four-year manufacturing agreement on humanised MAb
1993 Hybridon,lnc- R&D agreement (through Hoffinan IaRoche Inc) for antisense oligonucleotide compounds
AnnexA/8
• '"

v
'