Weather Derivatives and Weather Risk Management - International

EUROPEAN WEATHERDERIVATIVES
This paper concentrates on where the future of the weather derivatives marketmay lie, where the new applications may be situated and what will be the maindrivers of the market size. We realise that some of the applications are notcurrently available or commercially viable at present but take the view that, ifdemand is sufficient, they will become available given time. In fact, one of thelikely drivers of demand is the rate of change in the European climate. To thisextent we have included a chunky appendix summarising the latest findings andviews on climate change as we believe that this will have a huge influence onwhere the weather derivative market in Europe will be in 5-10 years time.
WORKING PARTY MEMBERS
Nick BuckleyAlex Hamilton
Justyn HardingNicola Roche
Nick Ross (chairman)Emma Sands
Richard SkeldingNick WatfordHeidi Whitlow
Special Thanks to: Jeff Sayers
Contents
Section
1. Introduction to this paper and Summary of Previous Paper
2. Current Market Conditions
3. Case Study
4. Broker Survey
5. Underlying Measures
6. Climate Change
7. Weather Derivatives vs other types of risk management
8. Acknowledgements
Appendix A Climate Change

1. Introduction to this paper and Summary of Previous Paper
1.1 Introduction
Welcome! It has been great fun pulling this paper together, for most of the teamweather derivatives is an area we rarely touch on during our day to day work. Wehave all therefore learnt a great deal from writing this paper and I hope that everyonewho reads it will also learn something.
The main theme of last year's paper was to set the current scene in the weatherderivative market. It covered the current market conditions, recent trades, the recentgrowth in the market and pricing techniques (among other topics). Rather thandevelop this further in our paper, we chose to concentrate on where the future of theweather derivatives market may lie, where the new applications may be situated andwhat will be the main drivers of market size.
We have therefore opted for a more hypothetical view, although there is plenty ofanalysis and fact underpinning our speculation. We realise that some of theapplications are not currently available or commercially viable at present but take theview that if demand is sufficient, they will become available given time. In fact, one ofthe likely drivers of demand is the rate of change in the European climate. To thisextent we have included a chunky appendix summarising the latest findings andviews on climate change as we believe that this will have a huge influence on wherethe weather derivative market in Europe will be in 5-10 years time.
1.2 Summary of the Previous Working Party's Paper
The introduction covers some examples of weather derivative contracts and theunderlying variable on which they are based. It also details who the current playersare and the current situation in the market. It then goes on to describe some of therecent deals and the factors that were taken into consideration. There is someanalysis around the reasons why the weather derivatives market has not yet taken offin Europe.
The introduction then moves on to detail some of the key terminology around weatherderivatives and how deals can be structured. Finally, it covers in some detail thegrowth of the market over the past 5 years or so.
The next section deals with data issues around the pricing of weather derivatives andincludes coping with missing and erroneous values, coping with discontinuities in dataand dealing with and understanding trends in the data. The section goes on to statethe lack of availability of data in Europe compared to the US.
The following section details the modelling of weather derivatives and how to goabout pricing them using a number of approaches. It covers Auto Regressive MovingAverage models in some detail as well as brushing over arbitrage pricing techniques.
Finally, the paper covers the role of forecasts in pricing weather derivatives anddistinguishes between weather forecasts (10-15 days ahead) and seasonal forecasts(predicting seasons ahead). It also touches on the El Nino and other similar

phenomena and describes how it would be possible to incorporate forecasts intopricing models.
We would like to thank last year's working party for their work. The paper has beenan excellent start upon which to build on. Special thanks to Jeff Sayers who hasattended a couple of meeting and passed on some very valuable information andopinions.

2. Current Market Conditions
2.1 Demand for weather derivatives
The majority of weather derivative deals are still carried out in the US, but there is agrowing market of participants and contract types within Europe. The growth withinEurope is occurring mostly in France and the UK, with Scandinavia and Germany closebehind. In addition, most European deals continue to be over-the-counter (OTC) ratherthan exchange traded contracts.
According to a survey carried out in 2002 by the Weather Risk ManagementAssociation (WRMA), measuring activity over the year ending 31 March 2001, theEuropean market recorded a total of 765 contracts worth a total notional value(maximum payout) of over $600m. This compares to 172 contracts worth a total of over$49m measured in the 2001 survey, an increase of 345% in terms of number ofcontracts and 1126% in terms of notional value.
The survey also shows that, whilst temperature-related protection continues to be themost prevalent, the proportion of rain, snow and wind related contracts have increased.
There has also been growth in other parts of the world:
� There has been rapid growth in Asia. The first deal on wind speed has been carriedout in Asia, for a wind power project. In addition, the Japanese have seen themajority of their deals coming from the non-energy sector, with banks acting asintermediaries between end users and weather risk management providers.
� In Australia, many deals have involved power retailers. Weather derivatives haveprovided protection against losses due to extreme heat, when there may be a largerise in electricity prices.
2.2 The collapse of Enron
Enron was a major market player within both the US and European weather derivativemarkets and the collapse may have caused some slowdown in market growth. Inparticular:
� Enron was a major market maker and would quote both buying and selling pricesfor weather derivatives. However, during 2002, several exchange-traded contractsand indices have been set up throughout Europe (see sections 2.3 and 5 below).
� Enron took an active approach to marketing weather derivatives to end-users.However, other companies (such as Societe Generale and Element Re) seem tohave become more active in marketing weather derivatives.
� Enron created liquidity for the market as it traded large volumes of contracts forsmall profits. This is perhaps the function that has been most difficult to recreate.
However, confidence in the market seems to remain high and many of Enron’s laid-offtraders are actively promoting weather derivatives in their new companies.

2.3 Current Market participants
The main market participants in the past have been energy traders, insurers andreinsurers. However several banks have recently entered the market, for example:
� French banks such as Societe Generale and Credit Lyonnaise.� Several German banks such as Deutsche Bank and Dresdner Bank.� Rome based Banca Nazionale del Lavoro is planning to establish a weather
derivatives desk in preparation for the winter 2002/2003 season and IntesaBCI hasbeen globally active in the market for the last year.
New exchange-traded contracts and weather indices have been set up throughoutEurope. Exchange traded contracts offer the removal of long-term administrativeliabilities associated with OTC instruments and the efficient management ofcounterparty credit risk.
� In July 2001, LIFFE launched six exchange-traded contracts based on indices ofdaily average temperatures in London, Paris and Berlin. The indices are based onthe mean of daily average temperatures (Mean DATs) and are available monthlyand for the winter season. The indices are calculated as:
Monthly Index = 100 + �(Mean DAT) summed over each day in the calendar monthWinter Index = 100 + �(Mean DAT) summed over each day of the winter season period
LIFFE has started trading with cash settled futures contracts referenced against theindices. Each contract is worth £3,000 for every degree Celsius of temperature change.LIFFE has chosen to focus on average temperature rather than Heating or CoolingDegree Days (as used in the US). This is because there is not a correspondingdemand for cooling in the summer.
� Following a commercial and technical partnership with Meteo France, Euronext islaunching a series of temperature indices. Euronext will offer standardised productsenabling anticipation of the financial impact of a change in temperature onbusiness.
� Entergy-Koch announced in December 2001 that it will be publishing a new windpower index which may be used to trade wind power derivatives worldwide.Entergy-Koch will be actively trading the index.
Reinsurers (e.g. Element Re, Swiss Re) have also become more active in the market.They have been proactively marketing weather derivatives and also provide a lot ofcredit capacity to the market. However, some reinsurers prefer to work with moretraditional insurance policies, which deal with the risk of more extreme events.
Finally, new advocates for expanding use include the World Bank, who are pushingweather risk management products in countries where economic subsidies are lessreadily available and the impact of weather has greater economic significance.

2.4 Take-off speed in Europe vs US
Possible reasons why the take up of weather derivatives in Europe has been slowerthan in the US include:
� A lack of reliable, standardised, inexpensive European weather data.� So far, there has been less internal hedging of weather risk by energy companies
throughout Europe compared to the US market. One possible reason for this couldbe that there is less variation in extremes of weather in Europe compared to theStates. The temperature spread is smaller and the seasons less likely to fluctuategreatly.
� Deregulation of energy markets.
Each of these reasons are discussed in more detail below.
2.5 European weather data
European weather data is expensive and data issued by different met offices is notstandardised. As a result, major upfront investment is required. Specific problems withEuropean data include:
� A country can change or shut down a weather station, without warning.� Recording times of maximum and minimum temperatures are different for each
country.� The definition of daily average temperature can vary from country to country.� Weather data delivery times are different for each country. In some cases, it can
take as long as a month to obtain data.� Data cleaning practices are different for each country.� Have to go to each Met office to acquire the data.� Some countries do not have long enough historical records of the quality of data
needed.� The data from each country may be provided in a different format.
However, secondary data providers are being set up throughout Europe to provide thedata required and there is evidence that Met offices are becoming more commerciallyminded. For example:
� WeatherXchange is a joint venture between the UK Met office and UmbrellaBrokers Ltd. It provides up-to-date weather information, forecasts, historical dataand a wide range of climate prediction information. Temperature data is availablefrom eight UK and three European sites, while rainfall data is available from eightUK sites.
� Following a partnership with Meteo France, Euronext is launching a series oftemperature indices (“NextWeather”) comprising a national index and five regionalindices for France. In September 2002, Euronext is planning to extend the indicesto Belgium and the Netherlands.
These secondary data providers can provide data of the quality required, but smallertraders may find the cost prohibitively high.
In the US, whilst weather data is plentiful and free of charge, there are still some qualityissues with the data. For example weather stations can change location orinstrumentation, so some data cleaning is still required.
2.6 Variation of extremes of weather in Europe
See section 6 and appendix A.
2.7 Deregulation of energy markets
Energy markets worldwide are undergoing deregulation in order to provide consumerswith the lowest possible prices. In the US, Australia and the UK, deregulation hasalready caused utility prices to fall. In Germany, deregulation of the energy markets hasjust started, whereas in France the industry is still predominantly regulated.
Under regulation, utility companies tend to maintain excess capacity to protectthemselves from demand fluctuations due to the weather. Consumers pay for thisthrough higher rates. In an unregulated market, supply and demand must meet in orderto have the lowest common clearing price per unit delivered. This leads to a moreefficient use of infrastructure, but the utility company must bear the financial impact ofbeing at risk from the weather.Weather derivatives are an important tool in managing volatility of demand in aderegulated market.
2.8 Future growth of the market – where do we go from here?
During the development of the weather derivative market in Europe, the first targets ascounterparties were energy companies. The reasons for this are that many energycompanies understand their weather risk in precise terms and that they also have atrading mentality. For the next target sectors such as agriculture, tourism and retailing,these advantages do not, in general, apply. This second stage of development of themarket has been slower because it involves a difficult educational process.
In addition, other market conditions that may make weather derivatives attractive in thefuture are outlined below:� An increasing trend for the insurance industry to provide “holistic” products that
cover all business risks instead of just standard products.� More awareness of weather derivatives meaning that bad weather is no longer an
excuse for poor profits.� Less asymmetry in knowledge between experienced market players and new
entrants.� More exchange traded contracts as they offer the removal of long-term
administrative liabilities associated with OTC instruments and the efficientmanagement of counterparty credit risk.

� Improved techniques in analysing wind and rain risk. Energy companies andweather risk are a good fit because the weather variable most affecting revenues istemperature, which is easy to measure and model. By contrast, wind and rain aremuch more localised and if there is no weather station to capture an event, aderivative deal would be impossible to structure.
� Agriculture is one of the most subsidised sectors in the world. Traditional subsidieshave in some cases been replaced by subsidised crop insurance. This has perhapsslowed the use of weather derivatives to manage risk. Changes in the level ofmethods of subsidy may have an impact on the market.
� An increase in penalties for failing to meet targets in construction could encouragemore use of weather derivatives.
� The number of users able to trade in weather derivatives may have contributed toslowing growth. Smaller companies may not be sufficiently credit worthy for therisks. One possible solution would be for smaller companies to group together in asyndicate in order to purchase weather derivative protection.
2.9 Accounting treatment
In general, there are two ways in which a weather derivative can be accounted for:
� By treating the weather derivative as a hedge so that premium and profit/loss onthe derivative is treated as ordinary income and will be subject to corporation tax.
� By treating the weather derivative as a derivative instrument so that premiums andprofit/loss is treated as capital gain/loss and taxed as such.
There seems to be some confusion over how to account for weather derivatives underthe current legislation. It is possible that this requirement has resulted in companiestransacting fewer derivatives.
These two treatments are considered in more detail below:
Accounting for weather derivatives as a hedge
When a company buys or sells a derivative, it must prove that the purchase was a trueand fair hedge, not speculation. In order to do this, historical and third party data maybe required.
Another issue to accounting in this manner is that a winter hedge may span more thanone accounting period with a single payout at the end of the season. For example, ahedge may span November to March and the accounting year-end may be 31December. In this case, a possible approach is:
� Decide what is “expected weather” over the remainder of the hedge (i.e. January toMarch). For example, this may be a 10 year average or may incorporate some sortof global warming trend.
� Accrue the profit or loss on the contract given actual weather to 31 December andthe expected weather from January to March.
� When the actual profit/loss on the contract is realised in March, this is accountedfor as the difference between the actual profit/loss and the profit/loss accrued in the31 December accounts.
Ordinary income treatment may or may not be preferable to capital losses, which areonly deductible if capital gains exist.
Accounting for weather derivatives as a derivative
For exchange-traded derivatives, this treatment involves “mark-to-market” accounting.This means that the derivative is treated as a capital asset and any movement of themarket value is treated as a capital gain or loss.
However, there has been criticism of this method, especially following the collapse ofEnron. The lack of liquidity in the market for some types of weather derivative maymean that a large market maker is effectively prescribing their value.
If the derivative is not exchange traded, then the capital gain or loss is accounted foronly when the derivative has elapsed/is exercised/is sold.

3. Case Study
3.1 European Weather Derivatives
A number of deals have recently been completed in the European weather derivativesmarket. Primarily over the counter deals which are structured as reinsurance on abespoke basis, we introduce below some basic concepts.
3.2 Objective
Structured to provide an alternative to conventional high layer catastrophe reinsurance,deals to date focus on perils such as windstorm and freeze with low frequency, highseverity characteristics.
In contrast to more traditional heating and cooling day based derivatives which arecommonly used by US energy companies, these deals are tailored for insurers seekingalternative sources of protection against aggregation of natural peril catastrophe risk.We have therefore focussed our attentions in this part of the paper on weatherderivatives recently seen in the European catastrophe reinsurance marketplace whichare neither commoditised nor publicly traded.
An objective approach is central to the pricing process. Typically this requires anindependently produced weather index from which it is possible to define the trigger orattachment point for the derivative. When the trigger is exceeded by the index thederivative is exercised. Through constructing an index which is unique to the cedant’sportfolio of risks, the payout under the derivative should be highly correlated to anylosses caused by the peril hedged. This requires a non-trivial analysis of thecorrelations between claim experience and weather station indices.
Basis risk, whereby the loss experience of the cedant is not accurately reflected by theindex is an important consideration for these products. For example, there would besignificant basis risk for a derivative protecting against a concentration of flood risk inthe South West of England were it to use rainfall indices with measurements taken inLondon.
The extent to which basis risk exists depends upon the number of weather stations forwhich indices are available, their location and their proximity to one another. Indicesare available for the following countries:
� Belgium� England� France� Germany� Ireland� Netherlands

An example of chosen weather stations for each of these countries and their associatedcatchment areas is shown graphically in the map below:
3.3 Advantages & Disadvantages V Traditional Reinsurance
When looking at the merits of such transactions there are a number of advantages anddisadvantages relative to traditional catastrophe reinsurance products:
Advantages
- Cedant loss history is irrelevant as the payout is determined purely by an index ofobjective measurements. Problems with poor quality historic data are lessimportant than for traditional catastrophe reinsurance.
- Catastrophe software modelling error eliminated.- Extension of markets to reinsurers otherwise unwilling to play in this arena and
wider financial markets.- Event definition clearly and objectively defined- Payout determined immediately by index- Cost of structuring the deal is less than for other ART solutions such as Cat
bonds.- Difficult to insure risks can be covered.- There are no exclusions for individual risks.
Disadvantages
- Damage incurred may exceed the indemnity received- Requires a correlation analysis between cedant portfolio and selected index
3.4 Example Contract
Coverage:
Annual windstorm cover protecting property portfolio across 10regions
Index: Multiple indices used with each weather station weighted by aloading Li representing proportion of portfolio in each region
Excess: i) Monetary excess = Eur 100m of accumulated theoretical lossesfrom all weather stations
Trigger ii) Option triggers vary by station to reflect anticipated damagefactors in each regioniii) Each day index exceeds trigger for each station contributesexcess km/h x tick size in theoretical losses to layer Eur 100m xs100m
Limit: Eur 100m of accumulated theoretical lossesTick Size: Eur xm
In determining the payout from such a contract, the windspeed at each weather stationis measured on a daily basis. If the peak windspeed exceeds the individual trigger forthat station on a particular day then the station contributes
(observed wind speed – trigger) x tick size x station loading (Li)
to the accumulated theoretical losses under the contract for that particular day. Theaccumulated losses for all stations are then applied to an excess reinsurance layer ofEur 100m xs Eur 100m.
3.5 Pricing Approaches
The pricing of such contracts requires either an historic index for the proposed periland/or statistical models of the index. Models are particularly important in the eventthat the historic data is limited in quantity or invalidated in some other way. These arethen used to quantify the risk of the observed measurements exceeding the trigger foreach weather station.
The most basic approach to pricing such a contract would be akin to a burning costcalculation similar to those carried out in traditional reinsurance pricing. The historicindex observations would be applied to the proposed structure and averaged across allor several years to calculate the expected value of claims to the contract. Thesecalculations are in fact simpler than for traditional reinsurance as the usual adjustmentsfor claim inflation, terms and condition changes are no longer relevant. This approachprovides a basic estimate of the expected loss cost to which profit and expenseloadings could be added to calculate the premium.
Building a statistical model where a distribution of the underlying index is generatedwould allow a more complete investigation of the range of possible outcomes under thecontract. Standards simulation techniques would then enable a more rigorousapproach to pricing.

4. Broker Survey
4.1 Introduction
Brokers currently play a small, yet significant role, in the market for weather derivatives.According to Peter Brewer, formerly of Aquila Europe, insurance brokers account foronly around 5% of weather derivatives deals. However, those deals that are placed byinsurance brokers tend to be much larger than their energy broker counterparts.
The history of the weather derivatives market is relatively short, yet insurance brokershave been a part of this market from the start, with Willis being involved in one of thefirst set of transactions back in 1997. Since then each of the major broking houses hasto a greater or lesser extent, developed an interest in using weather derivatives toprotect clients from weather related risks.
In order to gauge the current and likely future involvement of insurance brokers in themarket a series of face-to-face interviews was undertaken with the four largestinsurance brokers: MMC (Marsh), AON, Benfield Greig and Willis. In addition,interviews were also conducted with Aquila (energy commodities) and JPMorgan(merchant banking) to gain an alternative viewpoint.
4.2 Contracts Placed or Under Consideration
Of the four brokers taking part in this survey, each had considered placing weatherderivatives deals on behalf of clients and three of them had completed at least oneweather derivatives contract.
Three of the brokers had considered placing weather derivative for clients from asimilar set of industries, namely:
� Utilities (gas, electricity, water)� Retail� Restaurants� Agriculture� Food and drink� Transport� Tour Operators� Airports� Construction� Hydro� Leisure
The vast majority of these “derivative” deals were constructed in the form of optionsalthough a few swaps have been considered. Weather derivatives can take theregulatory form of a financial instrument or insurance, depending on the wishes of theclient and the regulatory environment of the country in question. With regard tolocation, by far the highest proportion of deals, placed by brokers, are for NorthAmerican clients. However, an increasing number of deals are being placed in Europeand a number of other markets (notably in the Far East, Australasia, Central Americaand Russia) are continuing to develop.

All contracts placed by insurance brokers have been over the counter deals. Thelocalised and non-standard nature of the risks covered by weather derivatives havemade exchange traded deals impractical. Most deals have covered a 3-4 month period,particularly those in the retail or energy sectors. There have, however, been somecontracts that have been placed for as short as 1 week or for as long as 5 years! Thecounter-party to most of these deals has been an insurance company, (Swiss Re andXL Re commonly being used) with some energy companies and banks also beinginvolved.
One of the brokers in the survey has decided to take an alternative approach to theclients sought for these products, concentrating its efforts on structuring weatherderivative products to serve the risk management needs of insurance companies. Ineffect, using weather derivatives to supplement, or replace, the traditional role ofreinsurance in protecting against weather related losses. This broker, has alreadyplaced a deal to protect a client against French windstorm claims, partly in response tothe hardening of the French catastrophe reinsurance market (following the 1999storms). It was an option style contract, with the underlying index being calculated fromthe weighted weather readings obtained several weather stations across France, theweightings reflecting the underlying exposures of the insurer. In addition, the brokerhas also considered the options for protecting against freeze claims on a Europe-widebasis for clients.
All of the contracts constructed on behalf of insurance company clients have been 1year deals, which mirrors the period covered by most traditional reinsurance treatypurchases.
4.3 Marketing
The marketing of weather derivative products within insurance brokers variessignificantly depending on the industry type of the client. In the main, interest forweather derivative products in respect of the utilities industry is client led, reflecting thehigh level of understanding of the market in this industry. However, with clients fromother industries, the brokers had taken a more proactive approach to marketing.
The approach taken, also varied from broker to broker. Unsurprisingly, the one brokerin the survey that had not placed any weather derivatives to date was also the onlybroker that had not actively marketed weather derivative products. The other brokershad all, to a greater or lesser extent, recommended the use of weather derivatives tosome clients within their networks.
4.4 Operations
Out of those brokers surveyed, the majority of weather derivative deals were placedthrough their structured finance/credit or capital markets divisions. However, the wassome involvement of the traditional (re)insurance broking teams in some of the deals.The extent to which either is involved is heavily dependent on the structure of the deal(pure derivative or a type of insurance) and the local regulations of the market inquestion. In the UK, the Securities and Futures Authority Limited regulate brokersinvolved in the sale or arrangement of pure weather derivative products, and hencehave a large impact on the placement of these products.
4.5 Pricing
In order for brokers to assess the fair price of a weather derivative deal for their client aset of historic weather data will be obtained, usually from government meteorologicalservices. A range of techniques from the actuarial, financial economics andmeteorological fields have been used by brokers to analyse the data and thendetermine a fair price, including
� Correlation and regression analysis� De-trended time series� Burning cost� Scenario testing and Monte Carlo simulations� Black-Scholes derivative pricing� Seasonal weather forecasting
Most brokers employ the services of a team of professionals including actuaries,financial mathematicians, statisticians and climatologists in order to price weatherderivatives. Long-term weather forecasting, with respect to European weather patternsis of limited use and as a result, the pricing techniques employed in Europe owe moreto the statistical than the meteorological sphere.
4.6 Future Prospects
Most brokers felt that the market for European Weather Derivatives would continue togrow, although there was a general feeling that it wouldn’t take off in the same way asin the United States due to the less volatile nature of European weather.
The brokers felt that they would not play a significant role in placing products for theutilities sector, since there was already sufficient in-house expertise in this industry tonegate the need their services. However, in other sectors, it was felt that brokers wouldplay an important role in the evaluation and execution of weather derivatives in dealingwith the weather risks faced from their existing major clients.

5 Underlying Measures
5.1 Introduction
As stated previously in this report, there are a wide variety of potential uses for weatherderivative contracts, such as:
� as an alternative to re-insurance for insurance companies for non-extreme butmore persistent events (such as prolonged period of rain affecting motor claimfrequencies)
� for turn-over or profit smoothing for companies affected by the weather
There are also a large number of weather variables that could be used as a measure,for example:
� Temperature� Precipitation Levels (Rain or snow)� Hours Of Sunshine� Wind Speed
Finally, there are two main methods by which a contract could be carried out:
� Using a specific Weather Index (such as the Monthly or Winter Season Index onLIFFE)
� Using a more tailored measure of a particular weather variable
The reason for the protection and the method of the contract would influence the exactvariable used. For example, if a new weather index was to be constructed, a standardvariable, suitable for various uses, would be required. However, if an individualcontract was to be established, a much more tailored and specific measure could beused.
In this section, we will go through each of the possible weather variables and discussexamples of its use, different measures that could be constructed, suitability for aWeather Index and disadvantages or limitations of the variable.
One other point to note is the fact that many of these weather-related variables arehighly correlated. For example, if a company’s results are poorly affected by lack ofsunshine (e.g. wine bar on a river-front), then they will also be affected in the same wayby a high rainfall index. Therefore, there may only be take-up in the weather contractsthat are easiest to define and best portray the level of risk associated by the company.For example, in the wine-bar case, customers would be more put off if it was cold andraining but less put off if it was simply cloudy. What would the most relevant weathervariable be in this case, therefore? Perhaps rainfall.
5.2 Temperature
Temperature is the measure that has been most widely used to-date – firstly in the USmarket and more recently on the UK’s London International Financial FuturesExchange (LIFFE).

Suitable Measures
Heating & Cooling Degree Days (HDDs & CDDs)
This is the most common measure that has been used to indicate temperaturevariability in the US. As mentioned earlier, the US weather derivatives market hasbeen dominated by the energy companies, therefore, this measure was the mostsuitable in defining energy demands for heating or air-conditioning.
A “Degree Day” is defined as a one degree difference between a referencetemperature and the average daily temperature. For example, if the referencetemperature is set at 65�F and the average daily temperature was 55�F, this wouldmean 10 HDDs. Indexes are often an aggregate of the HDDs or CDDs over a certainperiod, for example 6 months.
LIFFE Weather
The London & International Futures Exchange has recently set up it’s own Monthly and“Winter Season” Indexes based on temperature. These indexes are based on anaverage of the daily average temperature in the month for 3 locations – London, Parisand Berlin.
LIFFE states the reason for its different approach to an index is the different nature ofEuropean weather and the lower dependence on cooling in the summer. They alsobelieve that their index will promote more growth in the weather derivatives market dueto the indexes being more transparent and easy to understand.
The Winter Season Index is similar to the monthly index except it is the average indexof the daily average temperatures over a specified period (namely 1st November to 31st
March inclusive).
Other Measures
The introduction of the LIFFE Weather Indexes has vastly increased the choice open tocompanies exposed to European temperature fluctuations, however, it will not be ableto cater for all scenarios.
For example, certain localised events (e.g. a freeze in Glasgow or a heat-wave inAthens) will not necessarily be picked up by the Monthly Indexes because the locationis too far away from the three weather stations chosen by the index. Therefore, if abusiness was solely affected by events such as these, a more tailor-made contractspecifying more detailed temperature variations might be preferable.
Uses Of Measure
A low temperature index would be beneficial to the following industries:
� Energy companies (in terms of increased requirement for heating)� Overseas tour operators
On the opposite side of the scale, a high temperature index would be beneficial to thefollowing industries:
� Energy companies (in terms of increased requirement for cooling)� Recreation/Tourism industries (including outside activities, sea-side resorts, etc.)� Retail industry (e.g. increase in DIY/gardening activities, people more encouraged
to go out shopping for clothes on warmer days, etc.)� Food retail industry (higher demands for barbecue food/accessories and generally
drinks/ice-cream, etc.) Bottled water and diluted drinks manufacturers have bothstated statistics on the affect of temperature on demand for their products
� Construction is generally more productive in warmer temperatures. For example,extreme low temperatures can affect material requirements, freeze the soil andcause physical discomfort to workers (all of which will reduce production levels).
The agriculture industry generally sits somewhere in the middle of the scale – needingneither extreme low or high temperatures. One stated example is the severe damageon crop yields to citrus fruits caused by freeze temperatures.
Agriculture is also affected by the weather due to its’ affect on pests and hence theamount of crop yield lost.
Data Available
Data availability has been investigated for the UK, France and Germany, since theweather derivatives markets are biggest in these three European countries. However,no freely available information could be found from either the Meteo France or theDeutscher Wetterdienst websites (that is the domestic meteorological offices for Franceand Germany respectively). Therefore, no further comments are included below. Note,that this applies to all weather variables not just temperature.
In the UK, the MetOffice, has a wealth of historic information about temperature. Freelyavailable on their website are monthly statistics on average minimum and maximumtemperatures for the following stations:
Armagh Bradford Durham Lerwick Long AshtonOxford Sheffield Southampton StornowayValley
and more are available by contacting their Customer Service department. In somecases, the data goes back to 1853.
In addition to all of this historic information, more up-to-date information is collected at avast network of stations around the country.
Historic information would be used for pricing of contracts (probably both by suppliersand demanders of contracts because both sides would to be well informed about thelevel of risk involved), whereas daily information is needed either to maintain an indexor to monitor specific terms of contract.

5.3 Precipitation (Rainfall and Snowfall)
Suitable Measures
Measures could be set up in a similar manner to the LIFFE Temperature Indexes – forexample, a monthly average of the total daily rainfall at certain key locations could beused. Again, more detailed contracts may need more specific locations than thoseused for an index.
An alternative to a monthly average of total rainfall would be a measure of the intensityof rainfall, for example the maximum amount of rain per hour in the day. This would beof interest in the more immediate risk of a localised flood, increase in motor claimfrequency, etc.
Uses Of Measure
A low index of rainfall would be beneficial to the following industries:
� Insurance industry, in relation to rain-related claims such as property flood claimsand motor accidents
� Recreation/Tourism industries, especially for outdoor events and tourism, becausethey will generally receive higher trades in dryer conditions
� Retail industry, especially clothing and gardening� Construction industry is usually delayed by high levels of rainfall� Airline industry is significantly affected by rainfall. One estimate states that when
precipitation exceeds 0.025 inches at the destination airport, delays are more thandoubled.
On the opposite side of the scale, a high index of rainfall would be beneficial to thefollowing industries:
� Insurance industry, if during summer months, because could reduce risk ofsubsidence for the following year
� Water utilities industry� Indoor recreation/tourism facilities, such as Center-Parcs, etc.� Energy industry (especially if heavily dependent on hydro-electrical power stations)
Again, agriculture is often somewhere in the middle of the scale, but this depends onthe exact type of crop being grown. One example often given is barley – which isdamaged by excessive levels of rainfall at harvest time.
Another example is councils protecting themselves against lower than expectedsnowfall, which offsets the cost of salt purchases which are proved to be unnecessary.
Data available
As with temperature information, the UK MetOffice has a lot of historic informationabout rainfall – it has the total amount of monthly rainfall at the stations mentioned inthe temperature section. Since about 1960, the MetOffice has also been recording the“number of snow days” per month, which is defined as the number of days where snowis lying at 9 am at the stations concerned.

In addition to all of this historic information, again, more up-to-date information is alsocollected.
5.4 Sunshine Hours
Suitable Measures
Again, a simple measure, suitable for an index, would be monthly average of totalnumber of hours of sunshine at certain key locations. As stated with the temperatureand rainfall indexes, more detailed contracts may need more specific locations thanthose used for an index.
Uses Of Measure
A low index of sun-shine would be beneficial to the following industries:
Overseas tour operators
On the opposite side of the scale, a high index of sun-shine would be beneficial to thefollowing industries:
� Recreation/Tourism industries, including pubs/wine bars, sea-side resorts, etc.� Retail Food industry, in terms of ice-cream, cold-drinks, barbecues, etc. sales!� Agriculture industry
One quote explained how the brewery industry was affected by sunshine levels: Itexplained that lower beer consumption was correlated with lower levels of sunshinebecause of the number of activities that result in beer consumption also being lower –for example, going to the beach, golf, water-sports, barbecues, etc.
Data available
In the UK, the MetOffice has less historic information on sunshine hours. The averagenumber of hours of sunshine in a month has been recorded since 1930.
In addition to this historic information, more up-to-date information is collected at a vastnetwork of stations around the country.
Limitations
The main limitation with this variable is the fact that it is heavily correlated withtemperature. Since temperature is significantly easier to measure and probably is doneso in many European countries, it may be some time before sunshine weatherderivatives are used.
5.5 Windspeed
Suitable Measures
Similar to the other weather indicators, a simple measure would be the daily averagewind speed averaged over a month. This could be recorded at specific locations.

A more detailed measure could be maximum wind speed over a month. This would bean indicator of more stormy weather.
Uses Of Measure
Wind probably has less direct effect on industry. Although, it is highly correlated withother weather scenarios, such as heavy rain (with high winds) or sunny, warmconditions (with light winds).
Therefore, the uses of such a measure would probably be more limited.
A low index of wind-speed would be beneficial to the following industries:
� Insurance industry to a small extent because high winds may result in damage toproperty, car collisions, etc.
� Agriculture industry, because higher levels of winds usually result in lower cropyields and eventually damaged crops.
� Ferry companies are affected by high winds, causing delays and cancellations
On the opposite side of the scale, a high index of wind-speed would be beneficial to thefollowing industries:
� Wind-generating power stations
Data available
The MetOffice in the UK does not appear to collect either average or maximum windspeeds.
Limitations
The main limitation for all the weather variables described above involves dataproblems. This was discussed in the last paper and involves:
1. Data availabilityFor example, out of the three European countries investigated, freely available datacould only be found for the UK and then not all variables or sufficient detail wasavailable
2. Data reliabilityThis covers different countries recording data in different ways, missing anderroneous values and discontinuities in data.
3. Data anomalies/trendsFor example, urban heat islands or trends caused by climate change
5.6 Summary
In addition to the variables discussed above, there are numerous other weathermeasures that could possibly be used. One particular example is humidity. This hasbeen proved to have a direct affect on the sales of cold/flu products (because lowerhumidity in the winter is the cause, rather than temperature, of the easier spread of

viruses – due to the nasal passages being dried out more and therefore, moresusceptible to infection).
Another variation in the weather derivatives field is the ability to protect against short-term forecasts – such contracts are provided, for example, byGuaranteedWeather.com. Potential clients of such contracts are out-door eventorganisers, agriculture industry, recreation industry, etc.
Particular conditions are also emerging under specific contracts – for example“Guaranteed Growing Days,” which is a contract also offered byGuaranteedWeather.com. This contract is based around the number of days wherebygrowing conditions (i.e. the correct mixture of weather variables) exist.
The table below summarises the potential trade-off between industries for the variousweather variables discussed in the sections above:
Measure Low High
Temperature(Average In Month) Energy Industry (higher heating
demand)Overseas Tour Operators
Energy Industry (highercooling demand)Recreation/TourismIndustriesRetail IndustryConstruction Industry
Rainfall(Average In Month) Insurance Industry (Flood/Motor)
Recreation/Tourism Industries(Outdoor)Retail IndustryConstruction IndustryAirline Industry
Insurance Industry(Subsidence)Water IndustryAgricultureRecreation/ToursimIndustries (Indoor)Energy Industry (Hydrogenerators)
Sunshine Hours(Average In Month) Overseas Tour Operators Recreation/Tourism
IndustriesFood Retail IndustryAgriculture Industry
Windspeed(Average In Month) Insurance Industry
Agriculture IndustryFerry Companies
Energy Industry (WindGenerators)Recreation Industry (windsurfing/sailing)

6. Climate Change
6.1 Summary
One of the reasons why the weather derivatives market has not taken off in Europemay be because the weather has been relatively stable and uniform across Europe.Thus, demand for derivative products that protect against the volatility of weatherrelated profits have been muted, and the market to trade risk has been small.However, demand for weather derivatives could increase if the widely anticipatedchanges in European weather materialise.
Several indicies have been developed to monitor changes in the Earth’s climate. Themost useful index is the average surface-air temperature of the planet. Changes in thisindex indicate that global temperatures have risen by about 0.6oC since the beginningof the 20th Century. About 0.4 oC of this warming occurred in the Century’s last 30years. This trend is expected to continue; the IPCC has projected an average globalsurface temperature rise of between 1.4 and 5.8 oC from 1990 to 2100. A moredetailed discussion of climate change is given in Appendix on page #.
This section concentrates on the likely effects of climate change on the weatherderivatives market.
6.2 What impacts will this have?
6.2.1 Background
Climate affects both social and economic systems, as well as having an impact on theenvironment. This happens through weather extremes, climate variability and longer-term climate change. For insurers, the future behaviour of extreme weather events iscritical. For other industries, for example tourism, weather variability is a key influenceon profitability.
The range of impacts associated with future climate change can be better understoodby looking at how climate extremes and weather variability have affected society andthe environment in the past. Various issues can be considered such as the impact ofclimate on supply and demand, or the positive and negative consequences of change.The development of opinion over time obtained through population and managementsurveys from different European countries gives an indication of how seriously theimpacts of climate change are being taken. Analysis of existing provisions made forchange can then identify the potential for new financial and risk-related products, suchas weather derivatives, to assist society to adapt.
In the following sections, we take a closer look at specific industries and discuss theimpact that climate change has already had, and will have in the future. Within eachsection, the various issues relevant to different European countries are alsoconsidered. Results have been taken from population and management surveyscarried out by the WISE (Weather Impacts on Natural, Social and Economic Systems)workshop – an EU-funded project. The industries covered are:
� Recreation and tourism� Energy and water industries� The construction industry and property insurance
6.2.2 Recreation and tourism
Demand within different European countries may well change in the near future as aresult of global warming. Northern Europe may experience increased demand duringthe summer peak period, decreasing demand in southern Europe. Demand forsouthern Europe destinations may shift more towards off-peak seasons. Rapidlychanging demands could result in increased need for protection and insurance indeveloping holiday destinations. Consequences for accommodation transport links oremployment could be dramatic.
Increased occurrence of extreme events will lead to increased flood and storm risk topeople and property. Increased running costs of flood vulnerable tourist facilities,coupled with higher demand, could have a gearing effect on the sensitivity ofprofitability to extreme events. The need for increased sea defences and the impact ofextreme events on land erosion reduces amenity value in many areas. For example,golf courses in coastal areas are vulnerable to erosion and changes in the environment– a fact that has been recognised and discussed in the golfing community.
Differences in perception amongst European countries are consistent for most issuesregarding climate. Mild winters were generally viewed positively. Hot and drysummers were generally viewed positively in northern countries such as the UK,whereas southern countries such as Italy viewed them negatively. Tourism andrecreation companies considered extreme weather events to be of minor importance totheir operations and in most cases (golf being one notable exception) little to noplanning is being adopted to deal with climate change in the near future. Somecountries such as the UK and Germany are responding by developing insensitivetourist facilities (e.g. indoor leisure complexes), whereas other countries like Italy aremore concerned with the impact of hot summers on agriculture and forest fires. Thereduction of the skiing season due to mild winters has negative impacts on winterresorts dependant on tourism, but in many cases can be managed through the use ofsnow machines.
Whilst climate does have an influence on recreation and leisure patterns, it is unlikely tobe the driving force to changes. Social, economic and cultural changes are more likelyto have a stronger influence in shifting demands. The complexity of the processesinvolved make it difficult to draw firm conclusions from analyses carried out. Forexample, there is a lack of data differentiating between pre-booked and spontaneoustrips or between destination type (coastal, urban, winter sport).
In summary, the factors affecting demand for recreation and tourism are complex, butare influenced by climate. Changing climate will potentially influence recreationalpatterns in the near future. Despite evidence highlighting climate change, the leisureindustry has generally not taken any major steps in formulating plans to deal withchanging demands. As awareness is raised, and parallels drawn with experiences inthe USA, there should be potential to provide new financial and risk-related productssuch as weather derivatives.
6.2.3 Energy and water industries
Supply and demand for energy and water is clearly heavily influenced by climate andweather extremes. For water, hot summers increase demand whilst reducing supply.A mild winter will reduce demand for energy thus lowering profits for energy providers.

The energy sector has recognised this and actively tried to establish the relationshipsbetween changes in the weather and the demand for energy. In the USA, weatherderivatives have been primarily used by energy companies to “weather-proof” theirresults and help achieve a greater level of stability. There is clearly scope forEuropean utilities to make use of weather derivatives in the same way.
The impact of extreme weather events can in many cases by managed by insurancecover. However, increased variability in weather extremes or steady long-termchanges in climate, creates the potential for a range of other risk-related products likeweather derivatives. Other factors are likely to be more important to utilities such asmanagement actions, market developments or technological advancements. Actionstaken by governments or the public in general to make more efficient use of scarceresources may also have an effect in shifting demands.
Changing climate may create further opportunities for alternative energy sources,changing supply. Increased storminess may offer potential for increasing wind andwave as sources of energy. Some European countries such as the Netherlands havealready adopted these environmentally friendly sources of energy. Combined with theestablishment of new energy and water infrastructures (reservoirs, distribution systemsetc.), this may lead to new risks and opportunities for insurers and other providers ofrisk-related products.
Water suppliers and users are likely to be affected to varying degrees by climatechange. In Germany, the water sector considers itself robust to all types of weathervariability and its effects on supply or demand. In the UK, water companies have takenlarge-scale measures to increase efficiency and reduce vulnerability followingencouragement by national regulation and the problems faced in the 90s.
Overall, whilst climate change will change supply and demand for energy and watercompanies, the future of these industries is likely to undergo more rapid changethrough changes in other factors such as technological advancements anddevelopment of new business opportunities outside of their traditional market-places. Itis possible that with increased diversification, and larger companies adopting a moreholistic approach to managing risks, that demand for “balance sheet” protection willincrease.
6.2.4 The construction industry and property insurance
The very nature of the construction industry means that companies must be alert toweather conditions and long term predictions as well as the consequences of climatechange. Construction is susceptible to both hot and cold extremes, and building sitesare susceptible to extreme weather events. European codes of practise must becontinually updated to reflect climate change. Whilst building standards are not alwaysenforced, they are a prime driver of adaptation strategy for construction.
Property insurance is also naturally linked to the consequences of climate change.Increasing frequency and severity of extreme weather events in Europe could have direconsequences for insurers and reinsurers if these events are not predicted and pricedaccurately. Practices of bearing disaster costs vary in different European countries -flood damage is often provided by the state for example. France and Spain providestate guaranteed natural perils reinsurance. In other countries, insurance is not widely

available or affordable, meaning costs are borne by property owners, state aid orcharitable aid.
Changing climate will alter the mix of risks from region to region. Hotter, drier summerswill lead to more subsidence claims – ultimately, if the occurrence of subsidencebecomes more common and predictable, it may become difficult for insurers to providecover in a way that is profitable. Rising sea levels and increasing storm severity couldcreate flooding in new areas. New developments, for example expanding touristhotspots, will compound the costs associated with extreme events or weathervariability. Building materials may need to alter to cope with changing climates possiblyadding unforeseen costs to construction projects.

Climate change, combined with increasing concentrations of people and propertyvalues, makes it more important than ever for the construction industry and propertyinsurers to ensure they are prepared to meet future costs. It is possible thatgovernment intervention could assist, for example by allowing tax effective catastrophereserves to be established. Alternative risk-related financial products could ease theburden of costs – alternatives already exist, such as ART. Weather derivatives may bean option in future for these industries. For example, insurers could make use of themto offset subsidence costs after a particularly hot and dry summer.

7. Weather Derivatives vs other types of risk management
7.1 Personal Lines Hedging Opportunities
7.1.1 Background
Most re-insurance currently used in the personal lines insurance market is to protectagainst one-off big 'hits'. For example, a large weather event affecting property isusually covered by catastrophe re-insurance. For motor, there may be an excess ofloss arrangement that pays out the excess over a set value on a claim.
Such re-insurance arrangements do not cover the medium to longer-term effects. Howare claims affected over a wet summer or an especially cold winter, for instance?
7.1.2 Household Insurance
Subsidence costs are heavily weather related. Not to a single weather event but to acontinuing set of weather conditions which increase the possibility of subsidence orheave.
Using a sample of household subsidence claims over the past 7 years, a reasonablystrong correlation can be found between summer rainfall (May to Sept) in the currentand previous year and the current year subsidence frequencies. Thus it would betheoretically possible to purchase a weather derivative with pay out measured in rainfall- the less rain the more it paid out, hence going some way to covering the higherexpected subsidence claims.
A similar approach could be used to protect against persistent continued rainfall over along period. For example, from autumn 2000 to summer 2001, an exceptional amountof rainfall occurred in southern Britain. This lead to many small flood events (as well asa large event on 31st Oct 2002), all of which were related to the heavy rainfall, butwhere unlikely to invoke catastrophe arrangements due to being spread out over anumber of weeks or months.
7.1.3 Motor Insurance
Collision frequencies are intuitively affected by weather. We all know that it is moredangerous to drive on wet roads than when they are dry, that warm summer morningsare safer than icy mornings etc.
Using a sample of claims data by day and summarised daily weather data, we wereable to do some basic GLIM analysis on several of the weather statistics. The resultingmodel found minimum and maximum temperature, wind speed, rainfall and snow depthto be good indicators of collision frequency.
Once day of the week and hours of daylight were added to the model, we experienceda monthly correlation of around 80% between the predicted collision frequency and theactual frequency over the past 5 years.
Limitations of the model were the unavailability of fog data, the inability to detect whenthe roads were wet rather than when it rained and combinations of factors such as rain
in the evening followed by freezing temperature in the night. However, these wouldonly serve to increase the correlation one would suspect.
On one particular day in December 2000, when there was significant afternoon rainfallfollowed by temperatures well below freezing point, resulted in a collision frequencyaround 2.5 times the average for that time of the year. Hence, persistent differencefrom the norm can build up to a significant deviation in claims costs.
Cost and availability aspects aside, there could be real potential for weather derivativesto reduce the volatility of claims costs. Take a derivative that pays out dependent onthe amount of rainfall over a certain period. The more rain there is the more thederivative pays out. This pay out (partially) covers the extra cost due to the raincausing more motor accidents. Conversely, if the period is very dry, then the cost ofbuying the derivative is offset (or more than offset) by the low collision frequency.
The same principle can be applied to other weather statistics such as temperature,which is especially important in the winter as it can be a good indicator of whether thereis ice on the roads or not. There could also be scope to go one step further and devisecombinations of weather derivatives to hedge against specific insurance portfolios.
7.1.4 Other Insurance
Most other types of personal lines insurance are not directly affected by weather, theobvious exception is event insurance, such as wedding policies which pay out on rainydays.
7.1.5 Inherent Hedging
It is worth noting that for any given insurance portfolio, a degree of hedging alreadyoccurs. For example, if an insurance company writes just motor and householdpolicies, to some extent, dry or wet weather will affect the two lines of business inopposite ways. So a wet summer may reduce the subsidence frequency but increasethe motor collision frequency.
Using weather derivatives to hedge against some of the classes could in fact increasethe claims cost volatility of the whole portfolio.
7.2 Non Insurance Industry Weather Derivative Opportunities
7.2.1 Background
Most industries are affected by weather either directly or indirectly. In fact estimates inthe US have pointed to around 15% of business are affected by weather. This is likelyto be lower in Europe due to less extreme weather, but nevertheless, still a significantfactor.
7.2.2 Profit or Turnover Hedging
If it can be established that a company's profits or turnover are correlated to weatherconditions, then in theory it could purchase a weather derivative to offset the variability.For example, a wine bar may conclude that during the summer its revenue is correlatedto how warm and sunny the weather is - who doesn't like sitting out on a warm

summer's evening sipping a cool glass of wine! The wine bar owner may justifiably beconcerned if the weather is poor. He could purchase a weather derivative that pays outdepending on how warm it has been over the entire summer, the warmer it has been,the less it pays out, up to a point where no pay out is generated.
Thus, on cold summers, the bar takings are down but there is some compensation fromthe derivative pay out. On warm summers, bar takings are good, but the derivativepremium is paid and bears nothing. The derivative has effectively smoothed good andbad years.
There are a number of measures which could be appropriate in this example on whichto base the pay out on, e.g. rainfall or hours of sunshine, either whole days orlunchtimes and evening etc. Most of the possible combinations are not widely availableat present in Europe.
7.2.3 Sales Aids
There's nothing worse than buying a new 'toy' and no being able to use it because ofthe weather! Take for example skidoos (snowmobiles), a company in the US is offeringmoney back on the purchase price if there is less than x numbers of snowy days duringthe next winter. For the salesman, this removes the argument of not being able to useit if the weather is not right and can be financed as a fixed marketing cost bypurchasing a weather derivative.
This principle can be utilised across many products, for example convertible cars,sunglasses and even raincoats. Possibly one of the most popular uses would be onholidays, whereby the holidaymaker gets a refund which depends on the weatherexperienced while they were at their holiday destination. If you booked a week insouthern Spain and it rained all the time you were there, you could claim back, say75% or the original cost!
8. Acknowledgements
Conversations with Geroid Lane, Centrica
WRMA website (& information within)
Entergy-Koch Trading website (& information within)
John Stell (PwC)
GuarateedWeather website (& information within)
European Weather Derivatives…Update (article by William Gebhardt & David Pethick)
LIFFE website
Climetrix website(& information within)
We would like to thank the following brokers for their participation in the survey� MMC/Marsh (Stef Roosenbeek)� AON (Paul Miller, Matthew Eagle)� Benfield Greig (Jean-Paul Conoscente)� Willis (Claire Wilkinson, Warren R Isom, Nick Goulder)� and to Peter Brewer (formerly of Aquila) and Nick Gibson (JPMorgan) for their
personal insights on the role of brokers in the weather derivatives market.

APPENDIX ACLIMATE CHANGE
One of the key reasons that the weather derivatives market may not have taken off in Europeis the fact that the weather has been both relatively stable and similar across Europe. Thishas meant that 1) there has been little demand to protect against volatility of weather-relatedprofits and 2) there has been only a small market to trade risk because all areas haveexperienced relatively similar weather patterns.
However, anticipated climate changes may alter this picture and create a higher demandacross Europe. Therefore, in this section, we look into:
� What has happened already?� What changes are predicted to happen next?� What impacts will this have? (especially on the weather derivatives market)
For each of these sections, we first look at the issues from a global perspective, includingEurope and then more specifically at the UK.
Numerous research bodies have produced reports - which summarise what can be measuredto have occurred already and predictions for the future (based on models they have built).We have summarised information from publicly available reports from the following bodies:
� Intergovernmental Panel On Climate Change (global government sponsored panel whichsummarises various research bodies reports)
� Tyndall Centre for Climate Change Research at the University of East Anglia� Chartered Insurance Institute� Weatheronline.co.uk
Definitions
Before considering the evidence we have that the climate is changing, and how changes arelikely to develop in the future, it is worth stating a few definitions and discussing the causes ofclimate change.
� Climate
Climate describes the average weather experienced in a region over a period of time,typically 30 years. A description of weather will include reference to temperature, windand rainfall. The Earth’s climate is not static; it has changed many times in the past inresponse to a variety of natural causes.
� Climate Change
However, the term “climate change” usually refers to changes in climate that have beenobserved since the early 1900’s.

� What Causes Climate Change?
The Earth’s climate varies naturally as a result of interactions between the ocean andthe atmosphere; changes in the Earth’s orbit; fluctuations in the amount of energyreceived from the sun and volcanic eruptions. Since the industrial revolution, theatmosphere has become increasingly polluted, and there is a large body of evidence tosuggest that some pollutants are accelerating the process of climate change. Forexample, greenhouse gases (e.g. carbon dioxide), that have accumulated in theatmosphere over the last 200 years, are thought to trap the sun’s energy in the loweratmosphere and alter the global climate. The overall picture is complicated becausethe effects of individual causes can cancel each other out or heighten each other’seffects. Feedback mechanisms are thought to mask the effects of individual causes aswell. For example, greenhouse gas emissions will be increased due to warming of thesoil. It is therefore almost impossible to distinguish between the effects caused byindividual factors.
What has happened already?
Evidence For Changes In The Global Climate
Temperature
Many different aspects of climate and its effects on the Earth’s environment have been usedto develop indices that highlight changes in climate. They range from noting changes in thefossil record to measuring changes in the make-up of gases trapped in ice cores dug frompolar ice caps. However, the most useful index to describe the state of the global climate isthe average surface-air temperature of the planet. Measurements are collated from millionsof individual thermometer readings positioned around the world. Climate change indicatorsderived from this source go back to 1860 and show that global temperatures have risen byabout 0.6oC since the beginning of the 20th century. About 0.4oC of this warming hasoccurred since the 1970’s. To put these apparently small changes in temperature in context,the average temperature during the last Ice Age was only 5oC below today’s average. 1998was the warmest year on record, and the 1990’s were the warmest decade in the last 100years. It is likely that the last 100 years were the warmest century in the last millennium. On17th May 2002, the US National Oceanic and Atmospheric Administration (NOAA) reportedthat global temperatures for the month of April 2002 were the second warmest on record, withland and ocean surfaces 0.6oC above the 1880 – 2001 long term average. April 2002continues the recent trend of warmer than average temperature. Already, January and March2002 have been the warmest months on global record.
The graph below shows the global annual surface temperature relative to 1951 – 1980 basedon surface air measurements at meteorological stations and satellite measurements of seasurface temperature.

Source: Hansen, J., Ruedy, R., Sato, Mki., 2002. Global Warming Continues. Science 295,275.The following are direct consequences of a rising global temperature:
The length of the freeze-free season in mid-high latitude areas in many Northern Hemisphereareas has increased.
� Snow cover has decreased by about 10% since the 1960s.
� A near world-wide decrease in mountain glacier extent and ice mass.
� A decrease in Northern Hemisphere sea-ice amounts and a substantial thinning (somestudies mention a reduction of up to 40%) of Arctic sea-ice in late summer.
� A rise of between 10 and 20cm in the global average sea level during the 20th century.
Precipitation
World precipitation patterns have shifted. This has been most marked in the mid and highlatitudes of the Northern Hemisphere where levels of precipitation have been increasing. Thetable below documents the changes that have been observed to date:

Direction of Change Size of Changeper Decade (%)
Region Affected by Change
Increase 0.5 – 1.0 Most mid and high latitudes of theNorthern Hemisphere
Increase 0.2 – 0.3 Tropical regions
Decrease 0.3 Sub-tropical regions in theNorthern Hemisphere
No significant changes Southern Hemisphere
Indeed, during the latter part of the 20th Century, there has been a 2 – 4% increase in thefrequency of heavy precipitation events in the Northern Hemisphere.
Extreme Weather Events
Extreme weather refers to slightly out of the ordinary weather conditions, and therefore doesnot include catastrophic events such as hurricanes. The increasing frequency of extremeweather events has also been cited as an indicator of climate change. Proponents point tothe following to support their hypothesis that the climate is changing:
There has been a reduction in the frequency of extremely low temperatures with acorresponding increase in the frequency of extremely high temperatures.
� Warm episodes of the El Niño-Southern Oscillation phenomenon have been morefrequent, persistent and intense since the mid-1970’s compared with the previous 100years.
� During the 20th century, there has been a small increase in the total land areaexperiencing severe drought or severe wetness.
� The frequency and intensity of droughts have increased in recent decades.
However, there has been no systematic change in the frequency of tornadoes, thunder daysor hail events, and the following region specific indirect climatic change indicators have notchanged by a measurable amount:
� Temperature in the Southern Hemisphere
� The extent of Antarctic sea-ice since 1978

Evidence for Changes in the UK Climate
Records of the UK’s climate, which extend back three and a half centuries, also show ameasurable change in temperature. The 1990s were the warmest decade in central England.This year, in England and Wales, the mean temperature during April was 9.2oC, some 1.3oCabove the 1961 – 1990 long-term average.
The increased over-land temperatures have been accompanied by warming of UK coastalwaters as well. Other indications that the UK’s climate is changing include:
� The thermal growing season for plants in central England has lengthened by about onemonth since 1900. Analysis of data collected over 47 years on 385 plant varietiesshowed that on average, the plants bloomed 5 days earlier during the 1990s than theyhad during the previous 4 decades.
� Heat-waves have become more frequent in summer, with the 1990s experiencing twiceas many days with an average temperature above 20oC than the rest of the 20th Century.
� There are now fewer frosts and winter cold spells.
� Winters over the last 200 years have become much wetter relative to summersthroughout the UK; indeed, the 24-month period up to March 2001 was the wettest inEngland and Wales since records began in 1766.
� A larger proportion of winter precipitation in all regions now fall on heavy rainfall daysthan was the case 50 years ago.
� After adjusting for natural land movements, the average sea level around the UK is nowabout 10cm higher than it was in 1900.
One particularly memorable extreme weather event was the heat-wave during the summer of1976, which lasted nine weeks. It represented the culmination of a prolonged drought thathad begun in April 1975 causing extensive heath and woodland fires in southern England. ADrought bill was rushed through Parliament and a Minister for Drought was appointed to co-ordinate water conservation. Remarkably, temperature climbed to 32oC on 15 successivedays from 23rd June to 7th July inclusive; no previous or subsequent heat-wave has producedmore than 5 consecutive days in which temperatures reached 32oC or more.
A slightly more recent example of extreme weather occurred during December 1981 in whichthe mercury plunged to -18oC across many areas and large parts of the country weresnowbound for more than three weeks. At RAF Shawbury in Shropshire, the temperaturesank to -22.6oC at daybreak on the 12th and rising to only -12.1oC during the afternoon.Whilst most exceptionally cold winters are characterised by long spells of dry and sunnyweather punctuated by occasional snowfalls, December 1981 was different. Widespread andheavy snow fell regularly throughout the month, paralysing the transport system, closingschools and disrupting electricity supply.
What changes are predicted to happen next?
What will Happen in the Future on a Global Scale?
A number of projection models have been evaluated by the IPCC to predict the effect ofglobal warming on the Earth’s climate. These models are based on four different emissionscenarios: low emissions; medium-low emissions; medium-high emissions and highemissions. It is not possible to say which scenario is most likely, because this will depend onthe future choices made by society. The scenarios simply provide alternative views of thefuture.
The results of these studies can be categorised under the general headings:
� Temperature� Precipitation� Sea Level Changes� Snow and Ice� Extreme events
Temperature
The average global surface temperature is projected to increase by between 1.4 and 5.8oCfrom 1990 to 2100. Interestingly, this is significantly higher than the 1.0 to 3.5oC increaseprojected for the same period in a previous IPCC report. This represents an acceleration inthe rate of warming experienced during the 20th Century.
However, this warming will not be uniform across the globe – warming will exceed the globalaverage by more than 40% in North America and North and Central Asia, but will be belowthe global average in South America and South-East Asia.
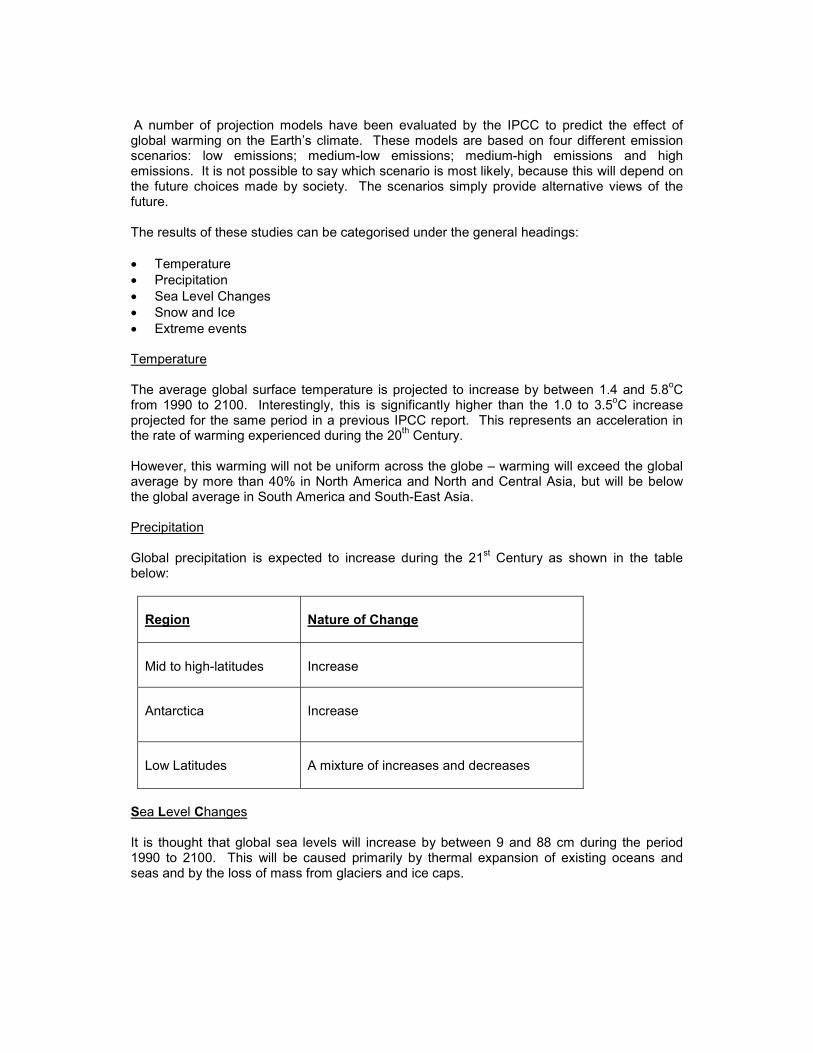
Precipitation
Global precipitation is expected to increase during the 21st Century as shown in the tablebelow:
Region Nature of Change
Mid to high-latitudes Increase
Antarctica Increase
Low Latitudes A mixture of increases and decreases
Sea Level Changes
It is thought that global sea levels will increase by between 9 and 88 cm during the period1990 to 2100. This will be caused primarily by thermal expansion of existing oceans andseas and by the loss of mass from glaciers and ice caps.

Snow and Ice
The extent of snow cover and sea-ice are expected to decrease further in the NorthernHemisphere. Glaciers and ice caps are projected to continue their widespread retreat duringthe 21st Century.
Extreme Events
The table below shows the predicted changes in extreme events along with the degree ofconfidence associated with each change.
Region Affected Change Confidence
All land areas Higher maximum temperatures and more hotdays
Very likely
All land areas Higher minimum temperatures and fewer coldand frosty days
Very likely
Many areas More intense precipitation events Very likely
Most mid-latitudecontinental interiors
Increased summer continental drying andassociated risk of draught
Likely
Some areas Increase in tropical cyclone peak windintensities
Likely
Some areas Increase in tropical cyclone mean and peakprecipitation intensities
Likely
Other studies broadly agree with these findings. The consensus of opinion is that unusuallyhot summers and other climatic extremes relative to current conditions are expected tobecome increasingly frequent in the future. For example, one study suggests that one-third ofall years could have summers as hot as 1997 by 2050 and 12% of these summers could haveless precipitation than 50% of the 1961 - 1990 average. Summer temperatures around theMediterranean basin are expected to increase by more than 3oC by 2050, exacerbating theexisting heat-wave problems.
The trend towards windier winters is expected to continue with some models suggestingincreases of up to 11% b 2080. Summer gales are also expected to increase in frequency. Innorth-western Europe, an increase in the mean and variance of wind speeds from south-eastto north-west is expected, which will be augmented in coastal regions at high latitudes.

What will Happen in the Future in the UK?
One of the most comprehensive studies to date on the possible effects of global warming onthe UK’s climate was carried out by the Tyndall Centre for Climate Change Research at theUniversity of East Anglia. Results were obtained using the latest global climate model fromthe Hadley Centre (one of the most comprehensively validated climate models in the world).It is based on the four different emission scenarios developed by the IPCC mentioned above.
The key findings of the research group at the Tyndall Centre can be grouped under theheadings:
TemperaturePrecipitationSea Level Changes
Temperature
� The UK climate will become warmer.
By the 2080’s, the average annual temperature in the UK may rise by between 2oc forthe low emissions scenario, and 3.50c for the high emissions scenario.
There will be greater warming in the south and east than the north and west, and theremay be more warming in the summer and autumn than in the winter and spring.
The temperature of UK coastal waters will also increase, although not as rapidly as overland.
� High summer temperatures will become more frequent, whilst very cold winters willbecome increasingly rare.
A very hot August, similar to that experienced in 1995 when temperatures in Englandand Wales averaged about 3.4oc above normal, may occur one year in five by the2050’s for the medium-high emissions scenario, and as often as every three years in fiveby the 2080’s. Even for the low emissions scenario, by the 2080’s, about two summersin three may be as hot, or hotter than, the exceptionally warm summer of 1995.
Precipitation
� Winters will become wetter and summers may become drier throughout the UK. Therelative changes will be largest for the high emissions scenario and in the south and eastof the UK, where summer precipitation may decrease by 50% up to 30%. Summer soilmoisture by the 2080’s may be reduced by 40% or more over large parts of England forthe high emissions scenario.
� Snowfall amount will decrease throughout the UK.
The reductions in average snowfall over Scotland might be between 60% and 90%(depending on the region) by the 2080’s for the high emissions scenario.

� Heavy winter precipitation will become more frequent.
By the 2080’s, heavy winter precipitation intensities that are currently experiencedaround once every two years, may become between 5% and (low emissions) and 20%(high emissions) heavier.
Sea Level Changes
� Relative sea level will continue to rise around most of the UK’s shoreline.
The rate of increase will depend on the natural vertical land movements in each regionand on the scenario. By the 2080’s sea level may be between 2 cm below (lowemissions) and 58 cm above (high emissions) the current level in western Scotland, butbetween 26 cm and 86 cm above the current level in south-east England.
� Extreme sea levels will be experienced more frequently
For some east coast locations, extreme sea levels could occur between 10 and 20 timesmore frequently by the 2080s than they do now, under the medium-high scenario.
Summary
Europe will become warmer and wetter than at present. In itself, this will not have a directimpact on the weather derivative demand, but a change in variability could do so.