European Society for Human Reproduction and Embryology ...uterine blood flow to ovulation and...
37
Human Reproduction Update 1997, Vol. 3, No. 5 pp. 467–503 E European Society for Human Reproduction and Embryology Doppler ultrasound investigation of uterine and ovarian blood flow in infertility and early pregnancy Richard P.Dickey 1 Fertility Institute of New Orleans, New Orleans, LA and Division of Reproductive Endocrinology, Department Obstetrics and Gynecology, Louisiana State University School of Medicine, New Orleans, LA, USA TABLE OF CONTENTS Introduction 467 Basis of Doppler ultrasound 468 Methods of analysis 470 Velocity waveform analysis 470 Uterine blood flow 477 Ovarian blood flow 484 Uterine blood flow in the first 16 weeks of normal pregnancy 486 Uterine blood flow in abnormal pregnancy 493 New areas of investigation 494 Conclusions 498 References 499 This review describes the current use of Doppler ultrasound to examine blood flow in the uterus and ovaries in infertile patients and during early pregnancy. The basics of Doppler ultrasound and the different methods of measuring blood flow are discussed from the viewpoint of the clinician who may be unfamiliar with Doppler physics and terminology. Normal values in the menstrual cycle and the relationship of uterine and ovarian blood flow to infertility and to implantation following in-vitro fertilization are presented. Normal values for uterine blood flow in the first 16 weeks of pregnancy and the effect of sex steroids and ovulation induction on their values are described. The possible relationship of defective uterine blood flow to recurrent abortion is examined. New areas of investigation, such as the effect of standing on blood flow, and the effect of drugs are explored. The findings of this review indicate that Doppler blood flow studies may provide significant information about possible causes of some disorders of infertility and early pregnancy and methods of treatment for the same. Key words: abortion (miscarriage)/Doppler ultrasound/pregnancy first trimester/uterine blood flow Introduction Doppler ultrasound analysis has been used in gynaecology primarily to determine blood flow in ovarian tumours with neoplastic characteristics, and in obstetrics to examine the relationship of blood flow in the uterine and umbilical artery to adverse fetal outcome. These topics have been the subject of numerous reports and are extensively covered in a number of excellent text books. The relationship of uterine blood flow to ovulation and implantation and to normal development in early pregnancy has been less extensively studied. Because these events represent a continuum from preovulation to development of the placental circulation, they are subject to many of the same physiological and hormonal influences. The present paper begins with a review of Doppler ultrasound techniques from the viewpoint of the clinician unfamiliar with principles of Doppler physics, and compares methods of describing blood flow results. The seminal article on use of Doppler ultrasound in infertility was that of Goswamy and Steptoe (1988). Those authors were the first to suggest that abnormal uterine artery blood flow might be associated with infertility, and to develop a classification of uterine artery blood flow waveforms. They related specific abnormal waveforms with repeated failure of implantation in in-vitro fertilization (IVF) patients and successfully improved uterine circulation and implantation by use of therapeutic doses of oestrogen (Goswamy et al., 1988). Subsequently, other authors have confirmed a relationship of uterine and 1 Correspondence should be sent to: Fertility Institute of New Orleans, 6020 Bullard Avenue, New Orleans, LA 70128, USA. Telephone: (504) 246–8971; fax: (504) 246–9778
Transcript of European Society for Human Reproduction and Embryology ...uterine blood flow to ovulation and...

Human Reproduction Update 1997, Vol. 3, No. 5 pp. 467–503 � European Society for Human Reproduction and Embryology
Doppler ultrasound investigation of uterine andovarian blood flow in infertility and earlypregnancy
Richard P.Dickey1
Fertility Institute of New Orleans, New Orleans, LA and Division of Reproductive Endocrinology, Department Obstetrics andGynecology, Louisiana State University School of Medicine, New Orleans, LA, USA
TABLE OF CONTENTS
Introduction 467Basis of Doppler ultrasound 468Methods of analysis 470Velocity waveform analysis 470Uterine blood flow 477Ovarian blood flow 484Uterine blood flow in the first
16 weeks of normal pregnancy 486Uterine blood flow in abnormal pregnancy 493New areas of investigation 494Conclusions 498References 499
This review describes the current use of Dopplerultrasound to examine blood flow in the uterus andovaries in infertile patients and during early pregnancy.The basics of Doppler ultrasound and the differentmethods of measuring blood flow are discussed from theviewpoint of the clinician who may be unfamiliar withDoppler physics and terminology. Normal values in themenstrual cycle and the relationship of uterine andovarian blood flow to infertility and to implantationfollowing in-vitro fertilization are presented. Normalvalues for uterine blood flow in the first 16 weeks ofpregnancy and the effect of sex steroids and ovulationinduction on their values are described. The possiblerelationship of defective uterine blood flow to recurrentabortion is examined. New areas of investigation, such asthe effect of standing on blood flow, and the effect ofdrugs are explored. The findings of this review indicatethat Doppler blood flow studies may provide significantinformation about possible causes of some disorders of
infertility and early pregnancy and methods of treatmentfor the same.
Key words: abortion (miscarriage)/Dopplerultrasound/pregnancy first trimester/uterine blood flow
Introduction
Doppler ultrasound analysis has been used in gynaecologyprimarily to determine blood flow in ovarian tumours withneoplastic characteristics, and in obstetrics to examine therelationship of blood flow in the uterine and umbilicalartery to adverse fetal outcome. These topics have been thesubject of numerous reports and are extensively covered ina number of excellent text books. The relationship ofuterine blood flow to ovulation and implantation and tonormal development in early pregnancy has been lessextensively studied. Because these events represent acontinuum from preovulation to development of theplacental circulation, they are subject to many of the samephysiological and hormonal influences. The present paperbegins with a review of Doppler ultrasound techniquesfrom the viewpoint of the clinician unfamiliar withprinciples of Doppler physics, and compares methods ofdescribing blood flow results.
The seminal article on use of Doppler ultrasound ininfertility was that of Goswamy and Steptoe (1988). Thoseauthors were the first to suggest that abnormal uterineartery blood flow might be associated with infertility, andto develop a classification of uterine artery blood flowwaveforms. They related specific abnormal waveformswith repeated failure of implantation in in-vitrofertilization (IVF) patients and successfully improveduterine circulation and implantation by use of therapeuticdoses of oestrogen (Goswamy et al., 1988). Subsequently,other authors have confirmed a relationship of uterine and
1Correspondence should be sent to: Fertility Institute of New Orleans, 6020 Bullard Avenue, New Orleans, LA 70128, USA. Telephone: (504) 246–8971;
fax: (504) 246–9778
468 R.P.Dickey
ovarian blood flow to unexplained infertility (Kurjak et al.,1991; Steer et al., 1994) and to successful implantationfollowing IVF (Sterzik et al., 1989; Steer et al., 1992;Favre et al., 1993; Balakier and Stronell, 1994; Coulamet al., 1994; Serafini et al., 1994; Tekay et al., 1995a;Cacciatore et al., 1996; Zaidi et al., 1996a,c).
This review continues with an examination of uterineblood flow in normal and abnormal early pregnancy,because by understanding uterine blood flow requirementsof early pregnancy, we may eventually be able to learnmore about the causes of early pregnancy loss andabnormal placental development associated withcomplications of late pregnancy. This section begins with areview of the development of the placental circulation.Also considered is the relationship of sex steroids(Jauniaux et al., 1992a, 1994; Dickey and Hower, 1996)and ovulation induction (Dickey and Hower, 1995c) touterine blood flow in pregnancy. Lastly, two new areas arereviewed: the effect of standing on uterine blood flow andthe effect of drugs on uterine blood flow.
Basis of Doppler ultrasound
Doppler ultrasound is based on the Doppler principle,named after Christian Andreas Doppler (died 1853), thatsound and light waves change in frequency or wavelengthwhen either the source or the receiver is moving.Doppler-shifted echoes are generated when vessel walls orblood are in motion. These waveforms are familiar assounds of heart motion on fetal ultrasound and of pulsatileflow of blood through vessels. The frequency of soundwaves is expressed in Hertz, named after Heinvich RudolfHertz (died 1894). One Hertz (Hz) is one sound wave cycleor pulse occurring in 1 s. Pulse repetition frequency isusually given in kilohertz (kHz); 1000 Hz/s are equal to 1kHz and 1 × 10⁶ Hz/s are equal to 1 megahertz (MHz).Sound with a frequency ≥20 000 Hz is called ultrasound,because it is beyond the frequency range of human hearing.
Ultrasound transducers operate on the principle ofpiezoelectricity, by which certain materials produce avoltage when deformed by applied pressure and produce apressure when voltage is applied. Various formulations oflead zirconate titante (PZT) are commonly used intransducers. Source transducers operating in a continuousmode are driven by an alternating voltage and produce analternating pressure that propagates as a sound wave. Thefrequency of sound, called resonance frequency, is equal tothe frequency of the driving voltage. For each pulse ofultrasound, a series of echoes are returned as the ultrasoundpulse is reflected off objects at a greater or lesser distance.These echoes are received by the transducer and converted
into electrical energy, which is processed electronicallyand displayed as a series of dots in a single scan line on thedisplay. Additional pulses travelling along the same pathresult in the same scan line being displayed, but if thestarting point for each subsequent pulse is different whilethe direction of the path is unchanged, a cross-sectionalimage builds up. The rectangular display that results iscalled a linear scan. If each pulse originates from the samestarting point but the direction of the path is slightlydifferent from the previous point, the result is a pie-shapedsector scan. The terms ‘B scan’ and ‘grey scale’ are oftenused to describe linear and sector scans, because thestrength of each returning echo is represented by itsbrightness on the display (‘B’ for brightness and ‘grey’because the resulting image is grey). These B or grey scaleimages are refreshed with current data at a rate of 30frames/s.
Colour flow Doppler instruments provide two-dimensional, colour-coded Doppler informationsuperimposed on the real time anatomical display. InDoppler ultrasound, the change in frequency of thereturning echoes, with respect to the emitted frequency,results in the so-called Doppler shift. Doppler shifts areusually in the range of 100 Hz to 11 kHz. The Doppler shiftis dependent on the speed of blood flow (blood circulates ata speed of 10–100 cm/s), the angle between the source ofsound (the transducer), the direction of the blood vesselbeing measured and the operating frequency of theDoppler. Higher operating frequencies, greater flowspeeds and smaller Doppler angles produce larger Dopplershifts. At the operating frequency of 5 MHz typically foundin vaginal transducers, blood flowing through the uterineartery at a velocity of 50 cm/s produces a Doppler shift of6.5 kHz at an angle of 0°, 5.6 kHz at 30° and 4.6 kHz at 60°.Blood flowing through spiral arteries or in ovarian stromaat 10 cm/s produces Doppler shifts of 0.65 kHz at an angleof 0°, 0.56 kHz at 30° and 0.32 kHz at 60° (Kremkau,1990).
Continuous wave Doppler utilizes separate voltagegenerators and receivers to create a picture of the Dopplershifts in the area being scanned similar to the grey scale,except that moving objects, e.g. blood flow, appear as redor blue against a black background. Slow movements, suchas bowel peristalsis and vessel walls are scanned out by‘wall’ (also called ‘wall thump’) filters which rejectselected ultrasound frequencies, usually between 50 and3200 Hz. Continuous wave systems provide motion andflow information without depth information or selectioncapability.
Pulsed-Doppler systems have the ability to select thedepth from which Doppler information is received, thus

Doppler ultrasound study of uterine and ovarian blood flow 469
allowing analysis of blood flow within a single vessel. To dothis, the vessel to be studied is first located with continuouswave ultrasound. Next, a gate is placed over the vessel whichpasses only signals that are returned within a defined time.For example, a gate that passes echoes averaging 13–15 µsafter pulse generation is listening at a depth range of10.0–11.6 mm. The width of the gate (also called the volumebox) is adjusted to the diameter of the vessel. The returningDoppler frequency shift echoes are converted electronicallyby a mathematical technique called fast Fouriertransformation and displayed as the Doppler shift versustime waveform. The Doppler waveform represents changesin the velocity of blood flow during the cardiac cycle. Flowconditions at the site of measurement are indicated by thewidth of the velocity spectrum, with spectral broadeningindicative of disturbed and turbulent flow. Flow conditiondownstream, particularly distal flow impedance, is indicatedby the relationship between peak systolic and end diastolicflow speeds. Continuous forward blood flow is possiblebecause of vessel wall elasticity, also called the windkesseleffect. When pulse pressure forces fluid into a compliantvessel, it expands and increases the volume within it. Later,when the pressure is reduced, it contracts, producingextended flow later in the cycle. In the aorta and large vesselswith valves, and also in small vessels with little distalimpedance, the windkessel effect produces continuousforward blood flow. In the iliac arteries with no valves,reversal of flow occurs in early diastole (triphasic flow) aspulse pressure decreases and distended vessels contract. Inthe ascending uterine artery, early diastolic flow is usuallyabsent or reversed in non-pregnant patients during mensesand the early proliferative phase of the cycle. Absence offlow at any time during diastole on the day of humanchorionic gonadotrophin (HCG) administration in IVFcycles is associated with failure of implantation. Inpregnancy, absence of early diastolic flow or a sharpdecrease in early diastolic flow, also called a protodiastolicnotch, is usually due to increased impedance in distal vessels,and is associated with poor pregnancy outcome if it persists.Lack of diastolic flow that occurs only at the end of diastolemay be due to low pulse pressure or to a prolonged intervalbetween heart beats, and is considered less important thanabsence of early diastolic flow.
There is an upper limit to the Doppler shift that can bedetected by pulse instruments. If the Doppler shiftfrequency exceeds one half the pulse repetition frequency,a phenomenon called aliasing occurs, in which the peak ofthe velocity waveform appears below the base line.Aliasing is the most common artefact encountered inDoppler ultrasound. Aliasing can be eliminated byincreasing pulse repetition frequency, by increasing the
Doppler angle, which decreases the Doppler shift for agiven flow, or by baseline shifting. As frequency isincreased, imaging depth decreases and ambiguity occursbecause of attenuation, and because the next pulse isemitted before all the echoes from the previous pulse havebeen returned. Attenuation is the decrease in amplitude andintensity which occurs due to absorption (conversion toheat), reflection and scattering as sound travels throughtissue. For soft tissue, attenuation in decibels (dB) is ~0.5dB of attenuation per cm for each MHz of frequency. Pulserepetition frequencies are usually in the range 5–20 kHz. Ata pulse repetition frequency of 5 kHz, ambiguity occurs at adepth beyond 15 cm, and aliasing occurs with Doppler shiftabove 2.5 kHz. At a pulse repetition frequency of 20 kHz,ambiguity occurs at a depth beyond 4 cm and aliasingoccurs with Doppler shifts above 10.0 kHz.
Increasing the Doppler angle to eliminate aliasingincreases the chance of error in detecting flow velocity.Flow velocity and flow volume can only be determinedaccurately if the angle of insonation is accurate.Measurement of the angle of insonation is usually done bythe operator orienting a line on the anatomic display, so thatit is parallel to the direction of blood flow. The resultingangle between the transducer and vessel may be included inthe mathematical calculation of velocity by the ultrasoundcomputer program. A 5° error by the operator in placing thedirectional line causes error in measurement of velocity of<2.0% when the real angle is <10%. This increases to 5.4%if the real angle is 30°, and to 12% when the angle is 60°.Accurate determination of velocity is not necessary whenratios of systolic to diastolic velocity are used to interpretblood flow, but these ratios themselves become inaccuratewhen blood flow is not continuous through the cardiac cycle.It is important, therefore, to keep the angle of insonation assmall as possible, consistent with determination ofcontinuous waveforms. Moving the baseline is successful ineliminating aliasing only if there are no legitimate Dopplershifts in the region of aliasing.
The width of the Doppler ultrasound volume box,compared to the width of the vessel wall, may also affectvelocity estimation. In small vessels, the average velocitymay be only one half the velocity at the centre of thestream, because of turbulence caused by friction from thevessel wall. Volume box widths which are too small inrelation to vessel size and which are aimed at the centre ofthe stream may result in overestimation of velocity. Theascending uterine artery diameter width ranges from 0.2 to0.5 cm in non-pregnant patients and becomes much largerin pregnant patients. Spiral arteries are closer to 1–2 mm indiameter. Volume box widths that are available usuallystart at 1 mm and increase to 10 mm in 1 mm increments.

470 R.P.Dickey
Table I. Waveform classification
Original Revised Description Presentclassificationa classificationb classification
Type C Type C Diastolic component continuous with previoussystolic component and present throughoutthe cardiac cycle
Type C
Type B Type D-I Diastolic component continuous with theprevious systolic component but not presentat the end of the cardiac cycle
Type B
Type A Type D-II Diastolic component present at the end of thecardiac cycle, but not continuous with thesystolic component
Type A
None Type D-III Diastolic component present, but neithercontinuous with the systolic component norpresent at the end of the cardiac cycle
Type D
Type 0 Type D-IV No diastolic component present Type 0
None Type N No systolic or diastolic component present Type N
aReprinted with permission from Goswamy and Steptoe (1988).bFrom Dickey et al. (1994).
Visual and mathematical analyses of pulse waveformsusing velocity ratios and measurement of flow volume,obtained by multiplying average velocity by vesselcross-sectional area, are the tools used to determine bloodflow status of vessels. Analysis of waveforms in largervessels can be used to determine blood flow in smallerdistal vessels, even when the distal (downstream) vesselsare too small to be visualized individually, as in the case ofspiral arterioles in the myometrium or stroma of the ovary.
Methods of analysis
Doppler blood flow may be analysed in three ways by: (i)waveform, (ii) resistance indices and (iii) flow volume orvelocity. There are situations in which each of thesemethods of analysis is best and should be used, andsituations in which each is unreliable. Flow volumeanalysis is the closest to true blood flow, but the mostdifficult to perform, because it is dependent on the angle ofinsonation, accurate measurement of vessel diameter, thetortuosity of the vessel and the analytical power of theinstrumentation. Flow volume analysis can only be usedfor larger vessels, such as the ascending uterine arteries, butmay sometimes be used for ovarian arteries and umbilicalvessels. Resistance indices measure downstream impe-dance to blood flow and are independent of the angle ofinsonation, but are only indirect estimates of flow volume.They are most useful for estimating blood flow in vesselsdistal to the point of examination. Despite claims to thecontrary, resistance indices may be highly inaccurate whenblood flow in the vessel being measured is not continuousthroughout the cardiac cycle. Waveform analysis providesthe most accurate estimate of blood flow in conditions
when blood flow is not continuous throughout the cardiaccycle, as occurs in the uterine and, sometimes spiral,arteries in the proliferative phase of the cycle.Non-continuous flow may persist into the luteal phase andearly weeks of pregnancy. Waveform analysis utilizesdescriptive terms, but because it is not subject to computeranalysis, it is too often omitted in clinical publications ofstudies of infertility and early pregnancy.
Velocity waveform analysis
Velocity waveform analysis of the umbilical and uterinearteries is the gold standard for evaluating normal andabnormal blood flow in the second and third trimesters(Fleischer et al., 1986; Harrington et al., 1991, 1996; Northet al., 1994). A deflection or ‘notch’ in late systolic or earlydiastolic flow is characteristic of normal uterine arteryblood flow waveforms until the end of the second trimester.Persistence of an early diastolic notch into the 24thpost-menstrual week, especially if it occurs in both uterinearteries, is associated with maternal hypertension andintrauterine growth retardation (IUGR; Harrington et al.,1996). Absence or reversal of early diastolic flow in theumbilical artery is associated with IUGR in 84% ofpregnancies in cumulative series and perinatal mortality in36% of pregnancies (Farin et al., 1995).
Goswamy and Steptoe (1988) developed a highlyvaluable classification of flow velocity waveforms for usein non-pregnant patients (Table I). In their classification,the term type C was used for waveforms in which diastolicflow was continuous with systolic flow and present throughthe cardiac cycle (Figure 1). Type A was used to designatewaveforms in which the diastolic component was present in

Doppler ultrasound study of uterine and ovarian blood flow 471
Figure 1. Waveform type C. Uterine flow velocity waveform show-ing high systolic flow and diastolic wave extending to the next car-diac cycle. This indicates good uterine perfusion. Reprinted withpermission from Goswamy and Steptoe (1988).
Figure 2. Waveform type A. Uterine flow velocity waveform show-ing high systolic flow and absence of early diastolic flow. This indi-cates poor uterine perfusion. Reprinted with permission from Go-swamy and Steptoe (1988).
mid diastole, but was absent in early diastole, and might ormight not be present in later diastole (Figure 2). Theyconsidered this to indicate poor perfusion and to be the resultof distal impedance to blood flow. Type B waveforms werethose in which the diastolic component was continuous withthe preceding systolic component, but did not extend to thesystolic component in the next cardiac cycle (Figure 3). Theyconsidered this type of waveform to indicate low impedanceand adequate perfusion. Type 0 waveforms were those inwhich no diastolic component was present at any time and
Figure 3. Waveform type B. Uterine flow velocity waveform show-ing diastolic wave continuous with systole, but not extending to thenext cardiac cycle. This indicates good uterine perfusion. Reprintedwith permission from Goswamy and Steptoe (1988).
indicated high distal impedance and low perfusion (Figure4). Dickey et al. (1994) revised this classification bysubstituting the terms D-I, D-II and D-IV (D fordiscontinuous) for waveforms B, A and 0 respectively, andby adding two additional types: D-III for the combination oftype A and type B when flow was present in mid diastole, butabsent in both early and late diastole, and type N, when bloodflow was undetectable in both systole and diastole. Thisproved too cumbersome and, as a result, they subsequentlyused Goswamy and Steptoe’s original classification with twoadditions: type D to represent the combination of type A andtype B, i.e. absence of both early and end diastolic flow, withsome flow in between, and type N for undetectable bloodflow in systole, as well as in diastole. In Goswamy andSteptoe’s original (1988) classification, type D would stillhave been classified as type A.
Goswamy and Steptoe (1988) developed their waveformclassification because they believed that resistance indices,such as the pulsatility index of Gosling et al. (1971) and theresistance index of Plainiol et al. (1972), inaccuratelyestimated uterine artery blood flow when diastolic flow wasabsent during any part of the cardiac cycle. Theysubsequently proved the validity of their classificationsystem when they demonstrated that total absence ofdiastolic flow (type 0) and absence of early diastolic flow(type A and type D) waveforms were associated withrepeated failure of implantation in IVF patients, whereascontinuous flow (type C) and absence of flow only at the endof diastole (type B) were associated with normalimplantation rates (Goswamy et al., 1988). In this author’s

472 R.P.Dickey
Figure 4. Waveform type O. Uterine flow velocity waveform show-ing absence of any diastolic flow. This indicates very high imped-ance. Reprinted with permission from Goswamy and Steptoe(1988).
experience, undetectable blood flow in both systole anddiastole (type N) in spiral arteries is no more serious thantype A or D, because it is often due to lack of sensitivity ofthe instrumentation.
Waveforms are unequalled for detection of downstreamimpedance. They should be used instead of resistanceindices, flow volume or velocity estimations wheneverblood flow is not continuous throughout the cardiac cycle.
Resistance indices
Resistance indices are preferred for measurement of smalland tortuous vessels, because they are based on the ratio ofpeak systolic flow to some measure of diastolic flow andthus, are independent of the angle of insonance (Figure 5).However, the angle of insonance is of little significance ifblood flow is not continuous, because the true ratio cannot beknown. Resistance indices are necessary when waveformsare continuous to define the magnitude of downstreamresistance.
Resistance indices were developed for use incardiovascular disease and were specifically intended todetect stenosis of distal (downstream) vessels. As such, theymay not be entirely applicable to evaluation of infertility andearly pregnancy. The principle reason for using indices is thatthey cancel out errors caused by the Doppler angle, machinegain, and hypo- or hypertension. They are, however, affectedby the heart rate (Maulik, 1993).
Figure 5. Common resistance indices: (S) peak systolic velocity, (D)end diastolic velocity, (A) time averaged maximum velocity. RI = re-sistance index, (S – D)/S;, PI = pulsatility index, S – D/A; S/D ratio,S/D. TAMV = time averaged maximum velocity.
Fourier pulsatility index (PIF)
This index is considered most accurate for detectingdownstream resistance, but is too complicated to becalculated automatically by present day software packages.It is expressed by:
PIF = N = 1[Vn2/Vo2]
where Vo is the mean forward velocity of the waveform, Nis the harmonic number from 1 to infinity, and Vn is theharmonic of the velocity waveform (Powis and Schwartz,1991).
Peak to peak pulsatility index (PPI)
This index is used in cardiovascular disease formeasurement of high resistance vascular beds where flowis reversed in early diastole (triphasic flow), and is rarelycalculated in obstetric or infertility studies. The PPImeasures the total distance from the top to the bottom of thesystolic peak and divides this by the mean velocity over thecardiac cycle. It is expressed by:
PPI = S/velocitym
where S is the peak systolic velocity and velocitym is the timeaveraged maximum velocity over the cardiac cycle. Resultsare closely similar to the Fourier pulsatility index. The PPInormally increases as increasingly distal vessels areexamined (Baker et al., 1986). The presence of long-termocclusive disease proximal to the site of measurementdecreases the index as a result of distal vasculative dilation tocompensate for the proximal stenosis.

Doppler ultrasound study of uterine and ovarian blood flow 473
Resistance index (RI)
This index, also known as Pourcelot’s ratio (Pourcelot,1974), examines the difference between the peak systolicand end diastolic velocity and is expressed by:
RI = (S – D)/S
where S is the peak systolic velocity and D is the minimumor end diastolic velocity. The RI is suitable for lowresistance vascular beds with continuous flow throughoutdiastole. If the end diastole value (D) goes to zero, the ratioconverges to 1.
Pulsatility index (PI)
This index, also known as the mean pulsatility index todistinguish it from the peak to peak pulsatility index, isexpressed by:
PI = (S – D)/velocitym
where S is the peak systolic velocity, D is the end diastolicvelocity and velocitym is the time averaged maximumvelocity over the cardiac cycle (Gosling et al., 1971).Velocitym is calculated from the average of three or fourcardiac cycles. No correction for heart rate is required(Gosling et al., 1991). Because it does not go to 1.0 if earlyor end diastolic flow goes to 0, the PI is often used forvessels where flow is absent during all or part of diastole. Ina comment made 20 years after first describing the PI,Gosling stated, ‘When blood flow sonograms are studiedjust proximal to a vascular bed of low impedance, it islikely that small changes in something itself already smallwill make little difference to the waveform shape, whichwill mostly be affected by changes in pressure drop acrossthe vascular bed and not the impedance per se (Goslinget al., 1991). The PI is not as accurate as RI because of thevariability inherent in measurement of mean velocity withpresent day software programs. Trudinger (1991) states,‘In determining the PI, it is most unlikely that the true meanvelocity can be calculated entirely accurately.’
Systolic/diastolic ratio (S/D)
The systolic/diastolic ratio is the simplest of all indices andis expressed by S/D, where S is the peak systolic frequencyand D is the end diastolic frequency. It is less frequentlyused, now that the PI and RI can be readily calculated bybuilt-in software programs. Errors in the S/D ratio increaseas diastolic velocity becomes small. Spencer et al. (1991),using an in-vitro flow model, found that when flow wasreduced in a stepwise fashion, PI and RI increased in linearfashion, whereas the S/D ratio increased exponentially.
Other ratios
Goswamy and Steptoe (1988) modified the S/D ratio andRI by substituting the peak diastolic frequency for the enddiastolic frequency, but these modified ratios have not beenused by others. The (A – B)/A ratio tests for the presence ofthe late systolic inflection in the carotid artery waveform.In this ratio, A is the peak systolic velocity and B is thelowest velocity at the inflection in late systole. Designedspecifically for use in the common carotid artery, it has not,as yet, been used for the uterine, spiral, or umbilicalarteries, but could conceivably be used for vessels, such asthe uterine artery prior to the 20th week of gestation, wherean early systolic notch is present.
Blood flow volume and velocity
By far the most direct way to describe blood flow is toreport blood flow volume or average velocity. Either flowvolume or average velocity plus a resistance index orwaveform (when diastolic flow is not continuous) arenecessary to analyse uterine blood flow satisfactorily. Flowvolume and mean velocity describe the actual volume orvelocity of blood utilized by an organ, while resistanceindices and waveforms indicate the state of smaller vesselsdownstream from the vessel being analysed.
Flow volume
Flow volume is the only true measurement of blood flow. Itis expressed by:
Vol = Vel × A
where Vol = flow volume (ml/min), Vel = time averagedmean velocity throughout the cardiac cycle and A =cross-sectional area of the vessel, derived from the diameter(A = π × r2). Note: Time averaged mean velocity as used hereis not the same as time averaged maximum velocitysometimes reported independently, and used in calculatingPI and RI. Blood flow volume through vessels of ≥2 mm canbe measured by Doppler ultrasound. Velocity should becalculated from the average of three or four cardiac cyclewaveforms. Diameter should be calculated from the mean ofat least four measurements of vessel diameter made fromfrozen two-dimensional grey-scale images. Flow volumemeasurements are dependent on the operator’s accuracy inaligning the angle of insonation and in measuring diameter,plus the instrument’s ability to calculate the average velocity.It is difficult to measure accurately in tortuous vessels.
Time averaged maximum velocity (TAMV)
Time averaged maximum velocity (TAMV) is frequentlyused when analysing blood flow through small vessels withno collateral circulation, such as the umbilical and ovarian
474 R.P.Dickey
arteries, when diameter is not or cannot be measured. It isdetermined by measuring the average maximum velocityover a minimum of three cardiac cycles. In many cases,TAMV mirrors flow volume; however, velocity isdependent on the angle of isonation and, at points of vesselnarrowing, increases to compensate for decrease in vesseldiameter. Therefore, TAMV may give a false impression ofblood flow in vessels narrowed by disease or stretching.
Other measurements of velocity
Maximum peak systolic velocity (MPSV), or simply peaksystolic velocity (PSV) and minimum diastolic velocity(MDV), are sometimes reported. These expressions ofvelocity are highly unreliable, since they are dependent onthe angle of insonation, display a high degree of variabilityon repeat examination (Tekay and Jouppila, 1996), andcannot describe blood flow over the entire cardiac cycle.Common abbreviations used for blood flow measurementsare shown in Table II.
Table II. Common abbreviations used when reporting bloodflow measurement
PI Pulsatility index
RI Resistance index, Pourcelot’s index
S/D ratio Systolic/diastolic ratio
Vmax Velocity maximum (same as PSV and MPSV)
MDV Minimum diastolic velocity
PPI Peak to peak pulsatility index
PSV Peak systolic velocity (same as MPSV and Vmax)
MPSV Maximum peak systolic velocity (same as PSV and Vmax)
TAMV Time averaged maximum velocity (same as TAMX and TAPV)
TAMX Time averaged maximum velocity (same as TAMV and TAPV)
TAPV Time averaged peak velocity (same as TAMV and TAMX)
Sources of error in measurement
All blood flow measurements, whether they are of theuterus and ovary or the aorta and carotid artery, are subjectto many potential sources of error. Certainly, the mostimportant source in the uterus and ovary is the operator’sjudgement in selecting the vessel to be examined and theparticular part of the vessel on which to focus the Doppler.Selection of the particular waveform or waveforms toanalyse, out of the many available, is an equally importantoperator decision. It must be decided whether to select oneswith the highest peak systolic or diastolic velocity, leastvelocity, or an ‘average example’. Doppler blood flowstudies of the uterus and umbilical circulation have beenpublished which use each of these choices. Dopplerultrasound operators may cause errors in PI and RI if theymistake brief gaps in diastolic flow as absence in diastolicflow. Analysis of flow volume or resistance indices in a
single uterine artery, instead of both arteries, can lead to afalse interpretation of uterine blood flow because of theconsiderable cross circulation in the uterus. Analysis of therelationship between uterine artery flow volume or RI andspiral artery waveforms or RI show that spiral artery bloodflow is not affected by a marked decrease of flow in a singleuterine artery, but is affected by lesser decreases in flow inboth uterine arteries (Dickey et al., 1994). The reader mustdetermine from the ‘Methods’ section of a paper whichmethods have been used to select vessels, in order tointerpret the results and the relationship of the author’sfindings to other studies.
The angle of insonation is of greatest concern whenmeasuring velocity and volume. The importance of angle ofinsonation is obviated for resistance indices which do notincorporate velocity in their calculations (e.g. RI, but not PI).For angles <20°, the maximum error in calculating velocityand volume caused by a 5% error in estimating the angle ofinsonation is ≤1.5% and is entirely obviated when angleadjustment is incorporated in the analytical software.
Another potential source of error in determining flowvolume is measurement of vessel diameter, both because thediameter changes during cardiac pulsation and because anyerrors in measurement are magnified when squared.However, the normal distensibility of arteries in adults is<5% for a 40 mm Hg pulse pressure (Gosling et al., 1991).Errors due to measurement become less important as vesseldiameter increases. For example, a 1 mm error in measuringa 20 mm artery diameter results in ±10% error in flowvolume, but if the diameter is 50 mm, a 1 mm error causesonly a ±4% error. At least four separate measurements ofdiameter taken from sequential cardiac cycles must be made.The actual difference found in vessel diameter whenrepetitive measurements of diameter were made by the sameobserver was ±3%, and when measurements were made bydifferent observers was ±5.6% (Dickey et al., 1994).
The relative importance of different sources of variabilityon blood flow volume measurement is illustrated in Table III,where interoperator variability was determined in 10subjects using the paired t-test, as described by Bewley et al.(1993). After determining that waveforms were continuousin all vessels, the right and left ascending uterine arterieswere examined in 10 non-pregnant volunteers during themid-luteal phase by one of two experienced ultrasono-graphers and immediately afterward by the second operator,with the order reversed in half of the patients. Mean velocitywas measured with the transducer held in the position whichresulted in the highest PSV, and the average of three cardiaccycles was determined by 64 point algorithm. The angle ofinsonation was corrected by software. The least correlationbetween operators was found for flow volume (r = 0.88),
Doppler ultrasound study of uterine and ovarian blood flow 475
followed by mean velocity (r = 0.90), with much lessvariability found for vessel diameter (r = 0.94). The bestcorrelation between operators was for RI (r = 0.97). Othercomparisons of intra-observer variability have yieldedsimilar results (Pearce et al., 1988; Bewley et al., 1993).
Tekay and Jouppila (1996) assessed intra-observervariability for three sources of variation (beat to beat,between frame, and temporal variability) in measurementsof PI and MPSV in uterine arteries and PI, RI and MPSV ofintra-ovarian arteries in 10 normally cycling women withtransvaginal Doppler ultrasound using a 6 MHz transducer.The intraclass correlation coefficients of temporal variabilityfor uterine artery PI and MPSV were 0.99 and 0.88respectively. In contrast, correlation coefficients forintra-ovarian PI, RI and MPSV were 0.78–0.86, 0.76–0.89and 0.63–0.68. They concluded that intra-ovarian velocitymeasurements were too inconsistent to be reliable.
An important source of error for measurements of flowvolume, TAMV and PI is the instrument’s ability todetermine average velocity. It is impossible to measureactual velocity of all Doppler signals over even a singlecardiac cycle with present technology. The number ofdiscrete velocity points or columns which each instrumentactually analyses varies from approximately 60 to 540,depending on pulse frequency and software. A 60 pointanalysis may overestimate or underestimate velocity,compared to a 120 or 240 point analysis, depending onwhere the measurement points fall over the cardiac cycle.Errors due to infrequent point analyses decrease whendownstream resistance is low and the difference betweensystole and diastole is small. The number of points analysedover a cardiac cycle varies with scroll speed and heart rate. Afaster scroll speed or slower heart rate will result in morepoints being analysed per cardiac cycle. For example, whenusing the ATL Ultramark 9-HDI Doppler Ultrasound, if the
scroll speed is increased from slow (20 ms/Doppler column)to fast (5 ms/Doppler column) and the heart rate remainsconstant (100 bpm), then the number of columns or pointsanalysed in one cardiac cycle would increase from 30 to 120.At a medium scroll speed (10 ms/Doppler column), 60Doppler columns are analysed per cardiac cycle when theheart rate is 100 bpm. A decrease in heart rate from 100 to60 bpm at a medium scroll speed would increase the numberof Doppler columns or points analysed in one cardiac cyclefrom 60 to 100. As a consequence, three or more cardiaccycles should be analysed whenever blood flow volume,mean velocity, or PI is determined.
Relationship of flow volume and resistance indicesto waveforms
The relationship of uterine artery waveforms to a modifica-tion of RI and S/D ratio was initially reported by Goswamyand Steptoe (1988). More recently, the relationship ofascending uterine artery and spiral artery waveforms touterine artery flow volume, PI and RI was investigated byDickey et al. (1994) (Table IV). Uterine artery flow volumewas significantly lower and PI was significantly higher whenwaveforms were not continuous. Recumbent flow volume insingle (right or left) uterine arteries averaged 40.8 ml/minwhen waveforms were continuous, compared to 27.0 ml/minwhen only end diastole flow was absent (type B, D-I) and to19.7–22.0 ml/min when flow was absent in early diastolicflow (A and D, D-II and D-III). Uterine artery PI wassignificantly higher for all non-continuous waveforms,compared to continuous waveforms, and did not distinguishwaveforms of less clinical significance with absent enddiastolic flow only (type B, D-I) from waveforms of greaterclinical significance (A and D, D-II and D-III). Tekay et al.(1996b) also reported on the relationship between waveformtype and PI.
Table III. Interobserver variability, showing the mean difference between observers 1 and 2, the correlation coefficient (r), stan-dard error (SE) and standard deviation (SD). Reprinted with permission from Dickey et al. (1994)
Measurement n Mean difference r SE of mean SD of meanbetween 1 & 2 difference difference
Uterine artery
diameter (cm) 20 0.056 0.94 0.067 0.300
time averaged maximum velocity 20 1.070 0.90 2.180 0.470
flow volume (ml/min) 20 4.500 0.88 2.398 10.721
pulsatility index 20 0.067 0.95 0.066 0.296
resistance index 20 0.004 0.97 0.006 0.027
Spiral artery
pulsatility index 10 0.208 0.87 0.061 0.193
resistance index 10 0.052 0.85 0.009 0.028

476 R.P.Dickey
Table IV. Relationship of ascending uterine artery blood flow volume per minute (UA-VOL, ml/min), pulsatility index (PI) andresistance index (RI) to uterine artery waveforms and spiral artery waveforms while subjects were recumbent and while theywere standing. Values in each column for UA-VOL, UA-PI and UA-RI are mean and SE respectively. Reprinted with permissionfrom Dickey et al. (1994)
Waveform Recumbent Standing
classification* n UA-VOL UA-PI UA-RI n UA-VOL UA-PI UA-RI
Uterine artery waveforms ( n = 148)
C 115 40.8, 2.3 2.47, 0.05 0.86, 0.01 98 37.9, 2.6 2.47, 0.05 0.87, 0.01
D-I (B) 9 27.0, 4.8a 3.47, 0.17b — 0 — — —
D-II (A) 7 19.7, 3.3b 3.59, 0.13b — 31 19.4, 1.9b 3.59, 0.13b —
D-III (D) 17 22.0, 1.6b 3.36, 0.09b — 17 15.2, 2.8b 4.45, 0.41b —
D-IV (0) 0 — — — 2 3.0, 0.90b 9.95, 0.05b —
Spiral artery waveforms ( n = 74)
C 59 74.4, 5.8 2.63, 0.08 0.88, 0.01 59 65.4, 6.1 2.67, 0.15 0.87, 0.01
D-I (B) 14 72.8, 11.6 2.90, 0.11 0.92, 0.02 5 80.4, 13.9 2.77, 0.18 0.93, 0.02
D-II (A) 0 — — — 1 45.0, — 3.31, — 0.92, —
D-III (D) 1 46.0, — 2.79, — 0.88, — 3 22.3, 3.0b 4.30, 64.0 1.00, 0.015
D-IV (0) 0 — — — 0 — — —
D-V (N) 0 — — — 6 40.0, 15.8 4.24, 1.18c 0.94, 0.04
*See Table I for waveform classification.a,b,cSignificance, compared to C (continuous flow) (t-test): aP < 0.05, bP < 0.001, cP < 0.01.
Table V. Relationship between individual ascending uterine artery blood flow volume per minute and uterine artery pulsatilityindex and resistance index, and between total uterine artery blood flow volume per minute, average uterine artery pulsatility orresistance index, and spiral artery pulsatility index and resistance index while subjects were recumbent and while they werestanding for 9–14 min. Reprinted with permission from Dickey et al. (1994)
Recumbent Standing (9–14 min)
r Significance r Significance
Uterine artery blood flow volume per minute
Uterine artery pulsatility index –0.49 P < 0.001 –0.46 P < 0.001
Uterine artery resistance index –0.46 P < 0.001 –0.66 P < 0.001
Spiral artery pulsatility index –0.08 NS –0.28 P = 0.010
Spiral artery resistance index –0.09 NS –0.21 P = 0.042
Uterine artery pulsatility index
Spiral artery pulsatility index 0.24 P = 0.019 0.31 P = 0.005
Spiral artery resistance index 0.26 P = 0.013 0.30 P = 0.006
Uterine artery resistance index
Spiral artery pulsatility index 0.24 P = 0.017 0.54 P < 0.001
Spiral artery resistance index 0.33 P = 0.002 0.54 P < 0.001
r = Pearson’s correlation coefficient; NS = not significant.
Absence of end diastolic flow in spiral artery waveforms(type V, D-I) was not associated with changes in total (rightplus left) uterine artery flow volume or change in uterineartery PI or RI, compared to continuous flow (C). However,absence of early diastolic flow (A and D, D-II and III) andabsence of any visible flow (N) in spiral arteries wereassociated with notably lower total uterine artery flowvolume and higher uterine artery mean PI. Non-continuousspiral artery waveforms were not seen in any subjects, unlessflow volume was notably decreased in both uterine arteries.
Relationship of flow volume to resistance indices
Relationships of uterine and spiral artery RI to uterineartery flow volume are shown in Table V (reprinted fromDickey et al., 1994). Only cases in which blood flow wascontinuous were analysed. Slightly less than 50% ofuterine artery PI and RI was related to flow volume. Thisshould not be surprising, since PI and RI are significantlyinfluenced by downstream resistance. Spiral artery PI andRI were unrelated to the uterine artery blood flow volume
Doppler ultrasound study of uterine and ovarian blood flow 477
in the recumbent position and only marginally related toflow volume when standing. Spiral artery PI and RI wereweakly related to uterine artery PI and RI while recumbent,but were strongly related to uterine artery RI (r = 0.54;P < 0.001) while standing.
In in-vitro Doppler ultrasound studies in which waterwas driven through rubber tubing by a Harvard pulsatilepump, measured flow volume was closely related toDoppler flow volume (r = 0.991), lowest systolic velocity(r = 0.987), peak systolic velocity (r = 0.972), PI(r = –0.940) and RI (r = –0.940). However, this studydiffered significantly from clinical assessment of bloodflow, because the angle of insonation was fixed and couldbe entered into the calculation (Miles et al., 1987).
Safety
The effects of Doppler ultrasound on embryonic and fetaldevelopment are not known with certainty. Bioeffects ofDoppler ultrasound are related to the spatial peak time averageintensity (ISPTA) and duration of exposure. The AmericanInstitute of Ultrasound in Medicine (1993) has recommendedthat Doppler ultrasound during early pregnancy be limited to500 s (8.3 min) at an ISPTA <94 mW/cm2.
Uterine blood flow
Uterine blood flow in the normal cycle
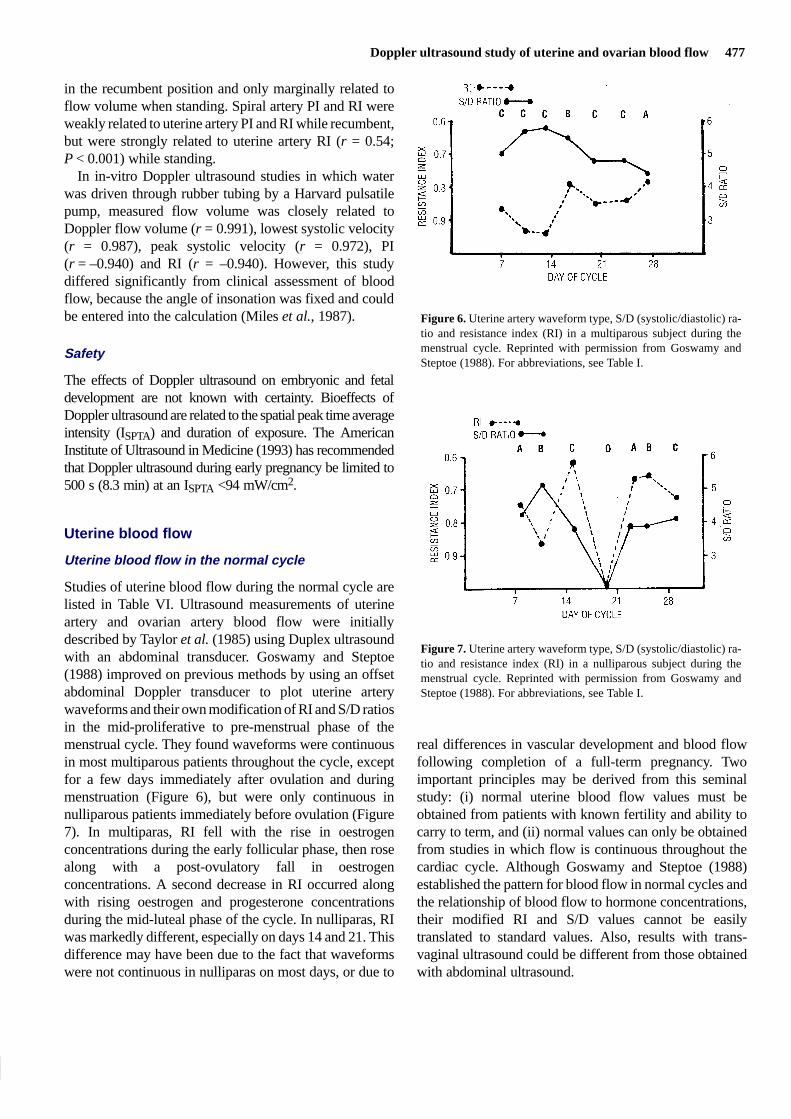
Studies of uterine blood flow during the normal cycle arelisted in Table VI. Ultrasound measurements of uterineartery and ovarian artery blood flow were initiallydescribed by Taylor et al. (1985) using Duplex ultrasoundwith an abdominal transducer. Goswamy and Steptoe(1988) improved on previous methods by using an offsetabdominal Doppler transducer to plot uterine arterywaveforms and their own modification of RI and S/D ratiosin the mid-proliferative to pre-menstrual phase of themenstrual cycle. They found waveforms were continuousin most multiparous patients throughout the cycle, exceptfor a few days immediately after ovulation and duringmenstruation (Figure 6), but were only continuous innulliparous patients immediately before ovulation (Figure7). In multiparas, RI fell with the rise in oestrogenconcentrations during the early follicular phase, then rosealong with a post-ovulatory fall in oestrogenconcentrations. A second decrease in RI occurred alongwith rising oestrogen and progesterone concentrationsduring the mid-luteal phase of the cycle. In nulliparas, RIwas markedly different, especially on days 14 and 21. Thisdifference may have been due to the fact that waveformswere not continuous in nulliparas on most days, or due to
Figure 6. Uterine artery waveform type, S/D (systolic/diastolic) ra-tio and resistance index (RI) in a multiparous subject during themenstrual cycle. Reprinted with permission from Goswamy andSteptoe (1988). For abbreviations, see Table I.
Figure 7. Uterine artery waveform type, S/D (systolic/diastolic) ra-tio and resistance index (RI) in a nulliparous subject during themenstrual cycle. Reprinted with permission from Goswamy andSteptoe (1988). For abbreviations, see Table I.
real differences in vascular development and blood flowfollowing completion of a full-term pregnancy. Twoimportant principles may be derived from this seminalstudy: (i) normal uterine blood flow values must beobtained from patients with known fertility and ability tocarry to term, and (ii) normal values can only be obtainedfrom studies in which flow is continuous throughout thecardiac cycle. Although Goswamy and Steptoe (1988)established the pattern for blood flow in normal cycles andthe relationship of blood flow to hormone concentrations,their modified RI and S/D values cannot be easilytranslated to standard values. Also, results with trans-vaginal ultrasound could be different from those obtainedwith abdominal ultrasound.

478 R.P.Dickey
Steer et al. (1995a) found that uterine artery PI and S/Dratio values differed significantly between abdominalultrasound and vaginal ultrasound during the normal cycle.Mean PI values during the mid-luteal phase in non-pregnantpatients for a 3 MHz abdominal transducer, a 5 MHzabdominal transducer with full bladder and a 5 MHz vaginaltransducer were respectively 4.08, 3.24 and 1.97. Moreover,intra-observer variability in measurement of PI decreasedfrom a coefficient of variation of 11.3 and 7.4% respectivelywith a 3 MHz and 5 MHz abdominal transducer to 4.1% witha 5 MHz vaginal transducer. Zaidi et al. (1995c) studiedcircadian rhythm in uterine artery blood flow. They found anadir in PI and a peak in TAMV at 0600 h, following sleep,which was unrelated to changes in oestradiol, progesterone,luteinizing hormone (LH), or follicle stimulating hormone(FSH). The increased blood flow which they foundfollowing sleep may have been the result of overnight bedrest, since a similar improvement is seen in pregnant patientswho have been at bed rest continuously for several days(R.P.Dickey, unpublished data).
Authors other than Goswamy and Steptoe (1988), whoused abdominal ultrasound to measure uterine blood flow,found no differences in blood flow at different phases of thecycle (Thompson et al., 1988; Long et al., 1989). Scholtes
et al. (1989), using a 4.25 MHz vaginal transducer, foundlittle variation in PI in the phases of the cycle andadditionally found no difference in PI on the side of thedominant follicle or corpus luteum. However, Steer et al.(1990), using vaginal ultrasound with a 6 MHz transducer,found marked variation in uterine artery PI during the cyclein 23 patients, 20 of whom were nulliparous, which wassimilar to that reported by Goswamy and Steptoe (1988)for multiparous patients. Values for PI in cycle days 1–6,when diastolic flow was frequently absent, ranged from 2.0to 5.6, with an average of 3.8. Values were lowest 6 daysbefore the LH peak (average 2.6) and 9 days after the LHpeak (average 1.9). The highest values occurred at themid-cycle plasma oestradiol peak (3.7) and 3 days after theLH peak (3.9). These authors found no difference in PI onthe side of the dominant follicle. Tan et al. (1996) found thePI significantly lower (3.05 versus 2.34) and TAMV higher(16.3 versus 13.2 cm) in the uterine artery on the side of thedominant follicle during the mid-luteal phase, but nosignificant changes in either measurement during thefollicular phase of the cycle. However, the lack ofsignificance may have been due to studying only sevenpatients, all with unproven fertility.
Table VI. Studies of uterine blood flow in the normal cycle
Investigation Wave Flow TAMV, Vmax, PSV, MDV PI RI S/Dform volume TAMX MPSV ratio
Taylor et al. (1985) (A,O) x x
Goswamy and Steptoe (1988) (A,E) x x x
Thompson et al. (1988) (A) x x x x
Long et al. (1989) (A)
Scholtes et al. (1989) (A) x
Steer et al. (1990) (E) x
Kupesic & Kurjak (1993) (O,S) x x x
Sladkevicius et al. (1993) (S) x x
Weiner et al. (1993) (E,O) x
Dickey et al. (1994) (S) x x x x x
Deichert & Buurman (1995) (IA) x x x
Steer et al. (1995a) (A/V) x x
Strigini et al. (1995) (E,O) x
Tekay et al. (1996b) (E) x x
Zaidi et al. (1995c) (C) x x
Tan et al. (1996) (E) x x
A = abdominal ultrasound; A/V = abdominal and vaginal ultrasound; C = circadian rhythm also studied; E = relationship tooestrogen, progesterone and ovulation induction studied; IA = common, external and internal iliac arteries also measured; O =ovarian blood flow also measured; S = spiral arteries also measured; STD = standing blood flow also measured. See Table II forother abbreviations.
Doppler ultrasound study of uterine and ovarian blood flow 479
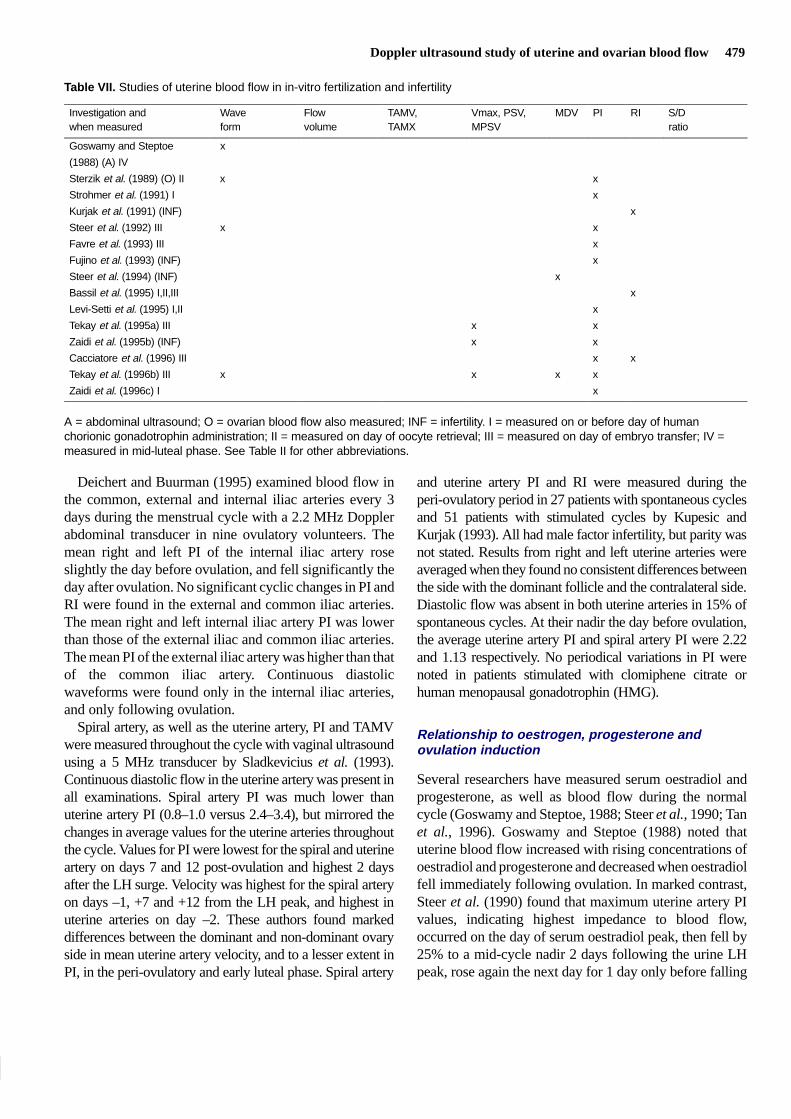
Table VII. Studies of uterine blood flow in in-vitro fertilization and infertility
Investigation and Wave Flow TAMV, Vmax, PSV, MDV PI RI S/Dwhen measured form volume TAMX MPSV ratio
Goswamy and Steptoe x
(1988) (A) IV
Sterzik et al. (1989) (O) II x x
Strohmer et al. (1991) I x
Kurjak et al. (1991) (INF) x
Steer et al. (1992) III x x
Favre et al. (1993) III x
Fujino et al. (1993) (INF) x
Steer et al. (1994) (INF) x
Bassil et al. (1995) I,II,III x
Levi-Setti et al. (1995) I,II x
Tekay et al. (1995a) III x x
Zaidi et al. (1995b) (INF) x x
Cacciatore et al. (1996) III x x
Tekay et al. (1996b) III x x x x
Zaidi et al. (1996c) I x
A = abdominal ultrasound; O = ovarian blood flow also measured; INF = infertility. I = measured on or before day of humanchorionic gonadotrophin administration; II = measured on day of oocyte retrieval; III = measured on day of embryo transfer; IV =measured in mid-luteal phase. See Table II for other abbreviations.
Deichert and Buurman (1995) examined blood flow inthe common, external and internal iliac arteries every 3days during the menstrual cycle with a 2.2 MHz Dopplerabdominal transducer in nine ovulatory volunteers. Themean right and left PI of the internal iliac artery roseslightly the day before ovulation, and fell significantly theday after ovulation. No significant cyclic changes in PI andRI were found in the external and common iliac arteries.The mean right and left internal iliac artery PI was lowerthan those of the external iliac and common iliac arteries.The mean PI of the external iliac artery was higher than thatof the common iliac artery. Continuous diastolicwaveforms were found only in the internal iliac arteries,and only following ovulation.
Spiral artery, as well as the uterine artery, PI and TAMVwere measured throughout the cycle with vaginal ultrasoundusing a 5 MHz transducer by Sladkevicius et al. (1993).Continuous diastolic flow in the uterine artery was present inall examinations. Spiral artery PI was much lower thanuterine artery PI (0.8–1.0 versus 2.4–3.4), but mirrored thechanges in average values for the uterine arteries throughoutthe cycle. Values for PI were lowest for the spiral and uterineartery on days 7 and 12 post-ovulation and highest 2 daysafter the LH surge. Velocity was highest for the spiral arteryon days –1, +7 and +12 from the LH peak, and highest inuterine arteries on day –2. These authors found markeddifferences between the dominant and non-dominant ovaryside in mean uterine artery velocity, and to a lesser extent inPI, in the peri-ovulatory and early luteal phase. Spiral artery
and uterine artery PI and RI were measured during theperi-ovulatory period in 27 patients with spontaneous cyclesand 51 patients with stimulated cycles by Kupesic andKurjak (1993). All had male factor infertility, but parity wasnot stated. Results from right and left uterine arteries wereaveraged when they found no consistent differences betweenthe side with the dominant follicle and the contralateral side.Diastolic flow was absent in both uterine arteries in 15% ofspontaneous cycles. At their nadir the day before ovulation,the average uterine artery PI and spiral artery PI were 2.22and 1.13 respectively. No periodical variations in PI werenoted in patients stimulated with clomiphene citrate orhuman menopausal gonadotrophin (HMG).
Relationship to oestrogen, progesterone andovulation induction
Several researchers have measured serum oestradiol andprogesterone, as well as blood flow during the normalcycle (Goswamy and Steptoe, 1988; Steer et al., 1990; Tanet al., 1996). Goswamy and Steptoe (1988) noted thatuterine blood flow increased with rising concentrations ofoestradiol and progesterone and decreased when oestradiolfell immediately following ovulation. In marked contrast,Steer et al. (1990) found that maximum uterine artery PIvalues, indicating highest impedance to blood flow,occurred on the day of serum oestradiol peak, then fell by25% to a mid-cycle nadir 2 days following the urine LHpeak, rose again the next day for 1 day only before falling
480 R.P.Dickey
again to an even lower mid-luteal phase nadir 10 days afterthe LH peak, while oestradiol concentrations were stillhigh and progesterone concentrations were high butdeclining. Tan et al. (1996) found that the TAMV of thedominant uterine artery was correlated with the rise inprogesterone concentrations in the luteal phase (r = 0.52)and with oestradiol concentrations throughout the cycle(r = 0.27), but found no relationship between PI andoestradiol or progesterone at any time in the cycle.
The relationship of uterine and ovarian artery PI to numberof follicles >15 mm diameter and to serum oestradiol andprogesterone concentrations was studied in 11 patientsreceiving HMG by Weiner et al. (1993). They found aconsistent decrease in PI from the early follicular to earlyluteal phase of the cycle which was negatively correlatedwith serum oestradiol concentrations (r = –0.51), but notwith progesterone concentrations (r = –0.25) or folliclenumber. However, Kupesic and Kurjak (1993) found nocyclic change in uterine artery PI in patients who hadreceived clomiphene citrate or HMG. Tekay et al. (1995b)found no difference in mean uterine artery PI and MPSVbetween patients with ovarian hyperstimulation syndrome(OHSS) and asymptomatic IVF patients when first measured8–13 days after oocyte retrieval, but found significantlylower PI at gestational week 9 in OHSS patients (1.78 ±0.22), compared to pregnant controls (2.43 ± 0.46). Thedifference may have been due to an 80% multiparity rate inthe OHSS group. Strigini et al. (1995) measured uterineartery and intra-ovarian PI in spontaneous and FSHstimulated cycles and also following administration of 100mg progesterone. Uterine artery PI was significantly lower inFSH cycles than in spontaneous cycles on the day ofoestradiol peak and 5 days later. Progesterone significantlydecreased uterine artery PI further in spontaneous cycles andFSH cycles, but did not affect intra-ovarian PI.
Thus, the relationship between serum hormoneconcentrations and uterine blood flow appears to differ,depending on which authors are consulted and which bloodvessels were sampled. Uterine artery flow volume was notmeasured in any of the studies thus far reported. Spiralarteries were rarely sampled. It may be that factors producedin the ovary, other than oestradiol and progesterone, areresponsible for apparent cyclic changes in uterine vessels.This is discussed below, with regard to pregnancy.
Relationship to IVF outcome
Studies of uterine blood flow in IVF and infertility arelisted in Table VII. The relationship between Dopplerultrasound and IVF outcome has been reviewed by Tekayet al. (1996a). A relationship between failure of
implantation and inadequate uterine blood flow wasestablished by Goswamy et al. (1988). A total of 153patients with three IVF failures, despite transfer of goodquality embryos, was examined with a 3 MHz offsetDoppler abdominal ultrasound in the mid-luteal phase ofspontaneous cycles. All patients had received oestradiolvalerate, 2 mg daily, continuously from the fifth cycle dayduring their last IVF cycle. Abnormal uterine arterywaveforms, in which diastolic flow was absent or notcontinuous with preceding systolic flow (type 0, A, or D,Table I), were present in 43% of the patients with repeatedimplantation failure. Patients with abnormal waveformswere treated with oral oestradiol valerate, 2 mg, andnorgestrel, 0.5 mg, for 21 days from the fifth cycle day forthree cycles; 82% of these patients with abnormalwaveforms responded to this treatment with improvementin waveforms to continuous diastolic flow or absent enddiastolic flow (type C and B). Patients with three previoustransfer failures who had normal waveforms proceededdirectly to another IVF attempt. All patients with initiallynormal waveforms who chose to attempt another IVF cyclereceived 2 mg oestradiol valerate from cycle day 5. Thepregnancy rate for patients with initially normalwaveforms who repeated IVF was 31%. The pregnancyrate for patients with initially abnormal waveforms whichimproved after therapy was 43%. Patients with initiallyabnormal waveforms who did not improve after therapyhad embryos cryopreserved and later received oestradiolvalerate in incremental doses, up to 6 mg daily, beforeembryo thaw and transfer plus i.m. progesterone, 50 mgdaily before and 100 mg daily after transfer, with a resultant50% pregnancy rate.
This study established a role for Doppler ultrasound inassessment of patients undergoing IVF and for twomethods of treatment: hormonal therapy before IVF, andcryopreservation with subsequent hormone therapy andtransfer. It did not determine the parameters of blood flowcompatible with fertility in normal cycles, since blood flowmay have been increased due to the high oestradiol andprogesterone concentrations which occur during ovulationinduction (Robertson et al., 1971; Ghosh et al., 1994;Dickey and Hower 1995c). Furthermore, findings withabdominal ultrasound needed to be repeated withtransvaginal ultrasound utilizing at least a 5 MHztransducer, which could notably improve measurements ofwaveforms, velocity, and RI (Steer et al., 1995a).
Strohmer et al. (1991) investigated uterine artery PI in323 IVF patients on the day of HCG administration usingvaginal Doppler ultrasound with a variable transducer(2.25–4.45 MHz), but examined only one uterine arteryand were unable to measure continuous flow in many

Doppler ultrasound study of uterine and ovarian blood flow 481
patients. They nevertheless found significant differencesbetween PI in 46 pregnant (2.55 ± 0.78 SD) and 277non-pregnant (2.84 ± 1.29 SD) cycles. They declined tosuggest a cut-off value above which HCG should not beadministered, nor IVF attempted. From their SD, that valuewould be >3.33. Zaidi et al. (1996c) measured uterineartery PI the day of HCG injection, using vaginalultrasound with a 5 MHz transducer, in 139 IVF cycles.They found no difference in pregnancy rate or implantationrate for PI values of 1.0–2.0, compared to 2.0–2.9 or ≥3.0.They also found no significant difference in PI for pregnantcycles (2.52 ± 0.50), compared to non-pregnant cycles(2.64 ± 0.80). Furthermore, they found no significantcorrelation between serum oestradiol concentrations andPI.
Sterzik et al. (1989) measured uterine artery and ovarianartery RI by vaginal ultrasound with a 4.5 MHz transduceron the day of follicle aspiration in 45 IVF patients. Theyused only the uterine and ovarian arteries with the lowestRI in their analysis. These authors found a differencebetween uterine artery RI in 12 patients who conceived(0.78 ± 0.06 SE) and 43 who did not conceive (0.84 ± 0.05SE); however, there was considerable overlap. Earlydiastolic flow (type A, D, or 0) was absent in sevenpatients, none of whom conceived.
Steer et al. (1992) measured mean uterine artery PI (rightand left) on the day of embryo transfer, using vaginalultrasound with a 4 MHz transducer, in 82 IVF patients. Nopregnancies occurred when the average PI was ≥3.0. Therewere no differences in pregnancy rate, implantation rate, ormultiple pregnancy rate between patients with PI <2.0 and2.0–3.0. Favre et al. (1993) measured mean right and leftuterine artery PI in 198 IVF patients on the day of embryotransfer using vaginal ultrasound with a 4.5 MHz transducer.In patients treated with gonadotrophin-releasing hormone(GnRH), the PI was significantly lower (2.87) than innon-GnRH-treated patients. The PI was not significantlydifferent in conception and non-conception cycles whenGnRH and non-GnRH patients were analysed separately. Noongoing pregnancies occurred when the PI was >3.55 on theday of embryo transfer. Cacciatore et al. (1996) measureduterine artery PI and RI on the day of embryo transfer in 200patients using a vaginal ultrasound with a 5.0–6.5 MHztransducer. Mean right and left PI and RI were significantlylower in pregnant than in non-pregnant patients, but therewas considerable overlap (2.45 ± 0.54 SD, 0.85 ± 0.04 versus2.66 ± 0.39, 0.87 ± 0.04 respectively). There was nodifference between PI and RI values in pregnancies whichwent to term (2.42 ± 0.95, 0.85 ± 0.05 respectively) and thosewhich aborted (2.45 ± 0.40, 0.85 ± 0.05 respectively). Thepregnancy rate dropped from 41% when the PI was <3.0 to
15% when the PI was ≥3.0 and to 10% when the PI was ≥3.5.The pregnancy rate was 39% when the RI was <0.91,compared to 13% when the RI was ≥0.92. The best cut-offvalues were 3.3 for PI and 0.95 for RI. Absent diastolicvelocity was noted in only six patients, one of whomconceived but aborted. Tekay et al. (1996b) measured flowvelocity waveform type, PI, MPSV and MDV with a 6 MHzvaginal transducer on the day of embryo transfer in 25patients during a GnRH–HMG cycle, and in 32 patientshaving frozen embryo transfer in spontaneous cycles. Therewere no conceptions when both uterine arteries had flowvelocity waveforms with absent end diastolic flow (type Band D or D-II and D-III). The mean PI was significantlylower, and the mean MDV was significantly higher, butmean MPSV was not different in GnRH-HMG cycles,compared to spontaneous cycles. There were no differencesin mean PI, MPSV, or MDV between conception andnon-conception cycles among patients with continuousdiastolic flow. However, individual PI values were always<4.0 in conception cycles.
Bassil et al. (1995) measured mean (right and left) uterineartery RI with a 6.5 MHz vaginal transducer from thebeginning of HMG administration to the day of embryotransfer in 152 patients (196 cycles) after GnRH. Only 102cycles in which three good quality embryos weretransferred and in which endometrial thickness was ≥9 mmwere analysed. A significant increase in RI was seen during7 days of stimulation, which stabilized for 3 days beforedecreasing markedly from day 9 until day 13, when HCGwas given. After HCG administration, the RI increasedsignificantly until the day of oocyte retrieval, thendecreased slightly until embryo transfer. In cycles whichresulted in pregnancy, RI values were initially lower oncycle day 2 before starting HMG (0.775 ± 0.003 versus0.790 ± 0.003), started to decline earlier (cycle day 8 versuscycle day 10), and were significantly lower on the day ofHCG (0.773 ± 0.003 versus 0.790 ± 0.003), compared tonon-pregnant cycles, but were no different on the day ofoocyte retrieval or embryo transfer. Bassil et al. (1995)concluded that an RI value >0.79 before starting HMG wasassociated with a poor uterine response, and suggested thatan increased dose of HMG might improve blood flow anduterine receptability.
Levi-Setti et al. (1995) also measured mean (right and left)uterine artery PI with a 6.5 MHz vaginal transducer, from 5days before HCG administration until oocyte retrieval, in 87IVF patients, 17 of whom had multiple cycles of treatment.Three or more embryos were transferred in all cycles. Thenumber of patients with continuous waveforms was notstated. During the first IVF cycle, the PI was significantlylower from 4 days before HCG through retrieval in patients

482 R.P.Dickey
who conceived. First cycle PI values were also lower inpatients with multiple cycles who conceived after the firstcycle. The greatest difference between pregnant andnon-pregnant cycles was observed on the day after HCGadministration. A PI ≤ 3.0 on the day of HCG administrationwas associated with a 42% pregnancy rate, compared to 24%if the PI was >3.0.
Thus, a consensus of published work indicates thatimplantation in IVF cycles is decreased when uterine arteryPI is ≥3.3–3.5 and when the RI is ≥0.95, or when waveformsshow absence of early or end diastolic flow at the time ofHCG administration, oocyte retrieval, or embryo transfer.Studies of uterine blood flow relationship to IVF outcomeperformed thus far strongly suggest that the uterine bloodflow can help to define which patients will become pregnant.More longitudinal studies like those of Bassil et al. (1995)and Levi-Setti et al. (1995) are needed. An importantelement missing from all previous studies is that they wereperformed only while patients were recumbent. Standingupright may markedly change blood flow in some patients(see the section on postural changes). Also, the effect ofblood flow on the ovary and on oocyte development must beconsidered (see the section on the ovary).
Relationship to infertility
Following the pioneer work of Goswamy et al. (1988),Kurjak et al. (1991), Fujino et al. (1993) and Steer et al.(1994) investigated uterine blood flow in women with ahistory of infertility who were not undergoing IVF cyclestimulation.
Kurjak et al. (1991) measured waveforms and RI byvaginal ultrasound with a 6 MHz transducer in 100 infertilewomen. They noted infertility in 11 of 12 women wholacked end diastolic flow during both the proliferative andluteal phases of the cycle, but no difference in mean rightand left uterine artery RI between infertile and fertilewomen.
Fujino et al. (1993) measured uterine artery PI byvaginal ultrasound with a 5.0 MHz transducer throughoutthe cycle in 60 infertile women. The mean right and left PIwas low in pregnant, compared to non-pregnant cycles,during the follicular phase (1.67 ± 0.22 SD versus 2.30 ±0.78 SD) and mid-luteal phase (2.33 ± 0.69 versus 2.50 ±0.97), but not during the ovulatory phase (1.89 ± 0.41versus 2.5 ± 0.51). Fujino et al. (1993) did not suggest acut-off point. They also did not mention whetherwaveforms were continuous during diastole.
Steer et al. (1994) measured mid-luteal phase mean rightand left uterine artery PI by vaginal ultrasound with a 4 MHztransducer in 161 patients with various infertility diagnoses
and in 23 presumably fertile women with azoospermichusbands. Supposedly normal patients had an average PI of1.9 (range 0.8–2.7). Among patients with various causes ofinfertility, the values and ranges were: unexplained (n = 35)2.45 (range 1.0–7.0), tubal damage (n = 92) 2.65 (1.3–8.0),endometriosis (n = 8) 2.32 (2.1–5.1) and anovulation (n =22) 3.03 (1.6–7.0). The PI was higher than the normal rangein 50% of patients with endometriosis and anovulation, in35% with tubal damage and in 23% with unexplainedinfertility. Significant numbers of patients with infertility hadabsence or reverse of flow during diastole. Right and leftuterine artery PI were similar, except in cases where aFallopian tube had been removed. There was no correlationbetween PI and age, number of years of infertility, serumoestradiol, or serum progesterone. The authors concludedthat decreased uterine blood flow may be an important factorin upwards of 23% of infertility patients. Right and leftuterine artery PSV and RI, as well as perifollicular PSI andPI, were measured throughout the cycle, with multiplemeasurements on the day of expected ovulation in onepatient with luteinized unruptured follicle syndrome (Zaidiet al., 1995b). No significant difference was found betweenuterine arteries at any time during the cycle.
Many questions remain to be answered about the role ofuterine blood flow in infertility, not the least of which ishow much blood flow is enough. None of the studies ofinfertility and very few of IVF cycles have measuredvelocity, and none have measured flow volume, eventhough these might be as important as impedance to flow asrepresented by PI and RI. Moreover, according toGoswamy and Steptoe (1988), the only parametermeasured in these three studies, PI, is unreliable when flowis absent at any part of diastole, and waveforms must bereported instead. Finally, the important effect of standingon blood flow in infertility remains to be addressed(Dickey et al., 1994).
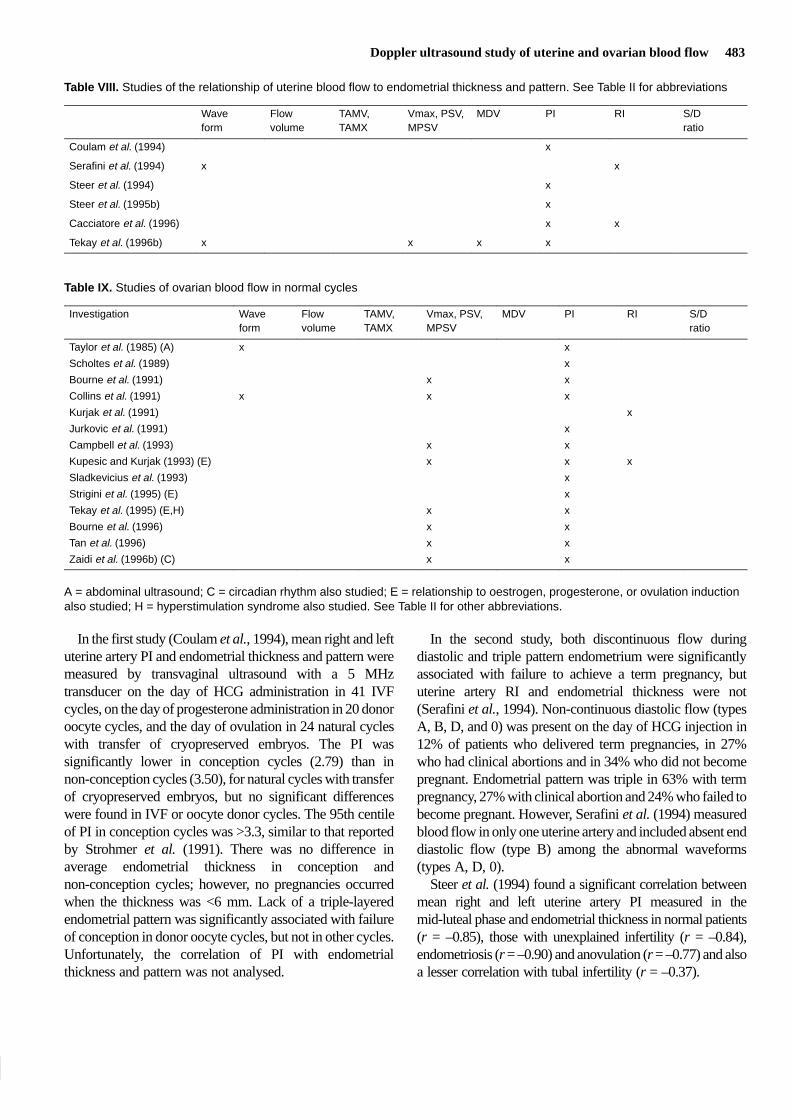
Relationship to endometrial thickness and pattern
Studies of the relationship of uterine blood flow toendometrial thickness are listed in Table VIII. The relativeimportance of uterine blood flow and endometrialthickness or pattern as predictors of implantation wasinvestigated by Coulam et al. (1994) and Serafini et al.(1994) on the day of HCG injection, by Cacciatore et al.(1996) and Tekay et al. (1996b) on the day of embryotransfer in IVF cycles, and by Steer et al. (1995b) in frozenembryo transfer cycles. Steer et al. (1994) investigated therelationship of uterine blood flow to endometrial thicknessin non-IVF infertility patients.
Doppler ultrasound study of uterine and ovarian blood flow 483
Table VIII. Studies of the relationship of uterine blood flow to endometrial thickness and pattern. See Table II for abbreviations
Wave Flow TAMV, Vmax, PSV, MDV PI RI S/Dform volume TAMX MPSV ratio
Coulam et al. (1994) x
Serafini et al. (1994) x x
Steer et al. (1994) x
Steer et al. (1995b) x
Cacciatore et al. (1996) x x
Tekay et al. (1996b) x x x x
Table IX. Studies of ovarian blood flow in normal cycles
Investigation Wave Flow TAMV, Vmax, PSV, MDV PI RI S/Dform volume TAMX MPSV ratio
Taylor et al. (1985) (A) x x
Scholtes et al. (1989) x
Bourne et al. (1991) x x
Collins et al. (1991) x x x
Kurjak et al. (1991) x
Jurkovic et al. (1991) x
Campbell et al. (1993) x x
Kupesic and Kurjak (1993) (E) x x x
Sladkevicius et al. (1993) x
Strigini et al. (1995) (E) x
Tekay et al. (1995) (E,H) x x
Bourne et al. (1996) x x
Tan et al. (1996) x x
Zaidi et al. (1996b) (C) x x
A = abdominal ultrasound; C = circadian rhythm also studied; E = relationship to oestrogen, progesterone, or ovulation inductionalso studied; H = hyperstimulation syndrome also studied. See Table II for other abbreviations.
In the first study (Coulam et al., 1994), mean right and leftuterine artery PI and endometrial thickness and pattern weremeasured by transvaginal ultrasound with a 5 MHztransducer on the day of HCG administration in 41 IVFcycles, on the day of progesterone administration in 20 donoroocyte cycles, and the day of ovulation in 24 natural cycleswith transfer of cryopreserved embryos. The PI wassignificantly lower in conception cycles (2.79) than innon-conception cycles (3.50), for natural cycles with transferof cryopreserved embryos, but no significant differenceswere found in IVF or oocyte donor cycles. The 95th centileof PI in conception cycles was >3.3, similar to that reportedby Strohmer et al. (1991). There was no difference inaverage endometrial thickness in conception andnon-conception cycles; however, no pregnancies occurredwhen the thickness was <6 mm. Lack of a triple-layeredendometrial pattern was significantly associated with failureof conception in donor oocyte cycles, but not in other cycles.Unfortunately, the correlation of PI with endometrialthickness and pattern was not analysed.
In the second study, both discontinuous flow duringdiastolic and triple pattern endometrium were significantlyassociated with failure to achieve a term pregnancy, bututerine artery RI and endometrial thickness were not(Serafini et al., 1994). Non-continuous diastolic flow (typesA, B, D, and 0) was present on the day of HCG injection in12% of patients who delivered term pregnancies, in 27%who had clinical abortions and in 34% who did not becomepregnant. Endometrial pattern was triple in 63% with termpregnancy, 27% with clinical abortion and 24% who failed tobecome pregnant. However, Serafini et al. (1994) measuredblood flow in only one uterine artery and included absent enddiastolic flow (type B) among the abnormal waveforms(types A, D, 0).
Steer et al. (1994) found a significant correlation betweenmean right and left uterine artery PI measured in themid-luteal phase and endometrial thickness in normal patients(r = –0.85), those with unexplained infertility (r = –0.84),endometriosis (r = –0.90) and anovulation (r = –0.77) and alsoa lesser correlation with tubal infertility (r = –0.37).

484 R.P.Dickey
Steer et al. (1995b) subsequently reported that uterineartery PI was significantly lower on the day of startingprogesterone before frozen embryo transfer in 19 patientswho became pregnant, compared to 57 who did notconceive; however, there was significant overlap: 2.85(range 1.4–3.6) versus 4.15 (range 2.1–6.8). There was asignificant correlation between PI and a 24-kDa protein (r =–0.58), oestradiol receptor (r = –0.71) and endometrialhistological dating (r = 0.43), but not endometrial thickness,on the same day in a trial cycle consisting of GnRH andoestrogen preceding the cycle of transfer. Cacciatore et al.(1996) found a significant correlation between mean rightand left uterine artery PI and both oestradiol (r = 0.37) andprogesterone (r = –0.32), but not endometrial thickness onthe day of embryo transfer. None of these authors speculatedabout methods of treatment to increase uterine blood flow.
Ovarian blood flow
Studies of ovarian blood flow in normal cycles are listed inTable IX. Ovarian blood flow has been studied extensivelyin recent years, in the hope that knowledge of normal andabnormal blood flow would provide an explanation forsome cases of infertility and for failure of ovarian responseto gonadotrophic stimulation. The majority of studies havecome from a single laboratory: Kings College, London(Bourne et al., 1991, 1996; Collins et al., 1991; Jurkovic etal., 1991; Campbell et al., 1993; Zaidi et al., 1995a,b,1996a,b; Tan et al., 1996).
Taylor et al. (1985), in a classic study, measured ovarianartery blood flow by Doppler ultrasound, using anabdominal transducer, and by an invasive techniqueemploying a 10 MHz directional continuous wave flowmeter applied directly to the ovarian, iliac, and uterinearteries. They demonstrated that ovarian and uterinearteries, waveforms and PI were identical for bothtechniques, and that the PI was lower on the side with thedominant follicle. They also performed longitudinalstudies during the menstrual cycle which demonstrated thatincreased blood flow on the side of the dominant follicleoccurred by day 5, before the dominant follicle could bedistinguished by ultrasound, and continued into earlypregnancy. Continuous diastolic flow was present on theside of the dominant follicle and corpus luteum, whereasno diastolic flow could be found on the side of thequiescent ovary. They proposed that Doppler ultrasoundcould be used to study luteal phase defect.
Subsequently, Scholtes et al. (1989), using vaginalultrasound with a 4.25 MHz transducer, were able to detectcontinuous diastolic flow in 74% of ovarian arteries. Theyconfirmed a significantly lower PI in the ovarian artery on
the side of the ovary bearing the dominant follicle, fromcycle day 13 preceding ovulation through day 21, butfound no difference on cycle day 7. Sladkevicius et al.(1993) observed similar changes in the dominant follicles’peak velocity and PI, with less changes in the ovarian hilumand stroma during the preovulatory period. Increasedblood flow on the side of the dominant follicle was alsodemonstrated by decreased RI (Kurjak et al., 1991),decreased PI (Weiner et al., 1993) and increased PSV (Tanet al., 1996). Bourne et al. (1996) noted that PSV of corpusluteum vessels rose following ovulation and was correlatedwith serum progesterone (r = 0.77). In studies of corpusluteum blood flow during the first trimester of pregnancy,the peak velocity and TAMV did not change, and the PIwas decreased in some reports (Valentin et al., 1996) butnot in others (Jurkovic et al., 1992).
Bourne et al. (1991) first measured intra-ovarian bloodflow changes during the hours preceding and immediatelyfollowing ovulation in a single patient. Collins et al. (1991)and Campbell et al. (1993) subsequently measuredintrafollicular flow in the peri-ovulatory period in largernumbers of normal women. They observed a markedincrease in PSV in the presence of a relatively constant PI,beginning 12 h after the LH surge or 29 h before follicularrupture, with a peak velocity immediately followingovulation.
Unlike uterine artery blood flow (Zaidi et al., 1995c), nosignificant circadian rhythm was found in ovarianfollicular or stromal PI or PSV (Zaidi et al., 1996b). Tekayand Jouppila (1996) found that, while intra-observerreproducibility of transvaginal Doppler measurement ofintra-ovarian artery PI and RI was satisfactory, repeatedmeasurements of PSV showed too much variability to bereliable.
Relationship to oestrogen, progesterone andovulation induction
In patients stimulated with HMG, the PI of the ovarianvessels supplying the dominant follicle and corpus luteumwas positively correlated with the number of follicles ≥15mm and with serum oestradiol concentrations, but not withserum progesterone in one study whose authors suggestedthat oestradiol increased stromal blood flow, but not corpusluteum blood flow (Weiner et al., 1993). However, inanother study, no difference was seen in ovarian PI or RI inHMG stimulated cycles, compared to spontaneous cycles,but a relationship was seen between follicular response andstromal PSV in HMG-stimulated patients (Kupesic andKurjak, 1993). Strigini et al. (1995) measured intra-ovarian and uterine artery PI on the day of oestradiol peakand 5 and 10 days later in spontaneous cycles and in

Doppler ultrasound study of uterine and ovarian blood flow 485
FSH-stimulated cycles. Intra-ovarian PI was significantlylower in FSH-stimulated cycles than in spontaneous cycleson the day of oestradiol peak, but did not show anysignificant change after ovulation. Moreover, during theluteal phase, the PI of intra-ovarian arteries was notsignificantly different in FSH-treated cycles than inspontaneous cycles, whereas uterine artery PI was lower inFSH cycles. Administration of 100 mg progesterone i.m.during the luteal phase significantly suppressed uterineartery PI further, but did not affect intra-ovarian artery PI.A strong negative correlation (r = –0.80) was notedbetween serum progesterone and intra-ovarian vessel RIduring the mid-luteal phase of the cycle by Glock andBrumsted (1995). Tekay et al. (1995b) could find nodifference in intra-ovarian arterial PI or MPSV betweenOHSS patients and asymptomatic IVF patients 8–13 daysafter oocyte retrieval.
Relationship to IVF outcome
Studies of ovarian blood flow in IVF and infertility arelisted in Table X. Barber et al. (1988), using transvaginalultrasound to measure blood flow to the corpus luteumafter embryo transfer, found that no pregnancies occurredwhen the RI was >0.5 on day 3 after embryo transfer.Weiner et al. (1993) reported that failure of the stromal PIto fall during HMG stimulation was associated with lessthan three follicles at retrieval. In the same study, theovarian artery PI remained low in the late luteal phase inpatients who became pregnant. The relationship of ovarianstromal blood flow on the second or third cycle day tofollicular development in response to HMG was studied in105 IVF patients by Zaidi et al. (1996a). They defined poorresponse as fewer than six follicles aspirated at retrieval.PSV was, but PI was not, related to subsequent follicularresponse, suggesting to Zaidi et al. (1996a) that peakvelocity could be used to screen for poor responders priorto initiating HMG. The mean peak velocity prior to HMGwas 10.2 cm/s in the good response groups and 5.2 cm/s inpoor responders. Only 10 patients met the criteria for poorresponse, and two of these were cancelled because ofdetection of only a single follicle. The pregnancy rate in theeight who went to retrieval, despite poor response, was nodifferent than in the 95 normal responders. Oyesanya et al.(1996) noted that recovery of oocytes at IVF retrieval wasrelated to the presence of a detectable velocity waveform,but not to the size of follicles. However, they did notindicate the size of the follicles that they measured. Theirrecovery rate was low; only 17% of patients had oocytesrecovered from 75% of follicles, and the correlation
between the number of follicles with pulsatility andnumber of oocytes recovered was modest (r = 0.47).
Nargund et al. (1996) attempted to establish a relationshipbetween Doppler ultrasound indices of follicular quality andoocyte or embryo quality. They measured PI and PSV in 126follicles from 27 patients immediately before aspiration. Theabsence of follicular blood flow was highly correlated withfailure to retrieve an oocyte. PSV was significantly higher infollicles associated with a good-quality preimplantationembryo, compared with follicles which yielded oocytes thatdid not fertilize or produced inferior embryos (19.7 ± 10.8versus 9.9 ± 5.3 cm/s). When PSV was ≥10 cm/s, there was a70% chance of producing a good-quality embryo, comparedto a 14% chance if PSV was ≤10 cm/s. There was nocorresponding relationship to PI. There were only six clinicalpregnancies, so that they were unable to associate blood flowwith whether or not pregnancy ended in abortion. Nargund etal. suggested that use of Doppler ultrasound might help todetermine which embryos to transfer.
Thus, investigations of ovarian and follicular blood flowhave so far failed to realize the hope that they would yieldinformation that could be used to predict or alter theoutcome of IVF. Because oxygen availability may affectmeiotic division during the peri-ovulatory period, bloodflow studies may yet reveal significant information aboutthe quality or even the genetic makeup of human embryos.
Ovarian blood flow in polycystic ovarian syndromeand luteal insufficiency
PSV, TAMV and PI of ovarian stroma were measured oncycle day 2 or 3 in 25 patients with polycystic ovariansyndrome (PCOS) (Zaidi et al., 1995a). Mean PSV andTAMV were significantly higher in patients with PCOwithout elevated LH or anovulation (16.9 and 10.5respectively) and PCO with elevated LH or anovulation(16.9 and 10.9), than in patients with normal ovaries (8.7 and5.4). There was no difference in PI. Zaidi et al. (1995a)speculated that the increased stromal blood flow may explainthe excessive response seen in PCO patients during HMGstimulation. Aleem and Predanic (1996) studied 40 PCOpatients throughout the cycle. Blood flow in the stroma wasvisualized in 88% of PCO versus 50% of normal ovariesfrom cycle day 3 to 8 and in all ovaries after ovulation when acorpus luteum was present. Significantly lower PI and RIwere seen in PCO patients on days 3–8, compared to normalovaries. Values for PI and RI in normal ovaries on days15–22 equalled those seen in PCO patients on days 3–8. PSVwas not significantly different between PCO and normalpatients on days 3–8, but was markedly higher in normalpatients on days 15–22. Vascular impedance was notinfluenced by ovarian volume or the number of follicles. No

486 R.P.Dickey
correlation was found between serum oestradiol,progesterone, or testosterone and RI, but a positivecorrelation was present between LH and PSV. Additionally,there was a trend towards lower PI and RI with higher LH.Aleem and Predanic (1996) speculated that LH acts toincrease blood flow by stimulating prostaglandin synthesis.
Intra-ovarian RI, PSV and TAMV were measured byvaginal ultrasound with a 5 MHz transducer five timesduring the cycle in patients with presumptive luteal phasedefect by Glock and Brumsted (1995). Women with lutealphase defect by histological dating were found to havehigher RI and lower TAMV during the late proliferative tomid-luteal phase, but no difference in PSV, compared towomen with in-phase endometrium.
Perifollicular blood flow, as well as uterine artery bloodflow, was measured throughout the cycle, with multiplemeasurements near the time of expected ovulation, in onepatient with a luteinized unruptured follicle (Zaidi et al.,1995b). PSV was low before and after the LH surge,compared to the dominant follicle in normal cycles,suggesting to Zaidi et al. (1995b) that the primary defectwas deficient follicular development during theproliferative phase.
Uterine blood flow in the first 16 weeks ofnormal pregnancy
Development of placental circulation
Doppler ultrasound has greatly enhanced understanding ofuteroplacental circulation. The ascending uterine arteriesgive rise to approximately eight arcuate arteries that run inparallel to the surface of the uterus and form anastomoses
with the contralateral ascending uterine arteries. Thearcuate arteries, in turn, give rise to centripedal radialarteries, which penetrate the middle third of themyometrium and, in turn, give rise to ~200 spiral arteries.After implantation, trophoblastic cells spread out from theends of anchoring villi penetrating the lumina of theintradecidual portion of the spiral arteries, replacing themusculoelastic architecture, thereby converting the spiralarteries into low resistance uteroplacental arteries.
Recent anatomical and ultrasonographic studies suggestthat infiltration of the decidua down to the superficialmyometrium by columns of extravillous trophoblasticcells and the transformation of spiral arteries is notcompleted until mid-gestation in normal pregnancies.Before the 10th week of gestation, the trophoblastic shell iscontinuous and forms plugs inside the lumens of spiralarteries, allowing only filtered plasma to penetrate theplacenta. During the 10th week, these plugs begin to breakup, so that limited circulation of maternal blood aroundvilli begins. This process is not completed, and fullmaternal circulation within the whole intervillous chamberis not established until the 12th week in normal pregnancy(Hustin and Schaaps, 1987; Hustin et al., 1988, 1995;Jauniaux et al., 1991a,b, 1992b; Jaffe and Woods, 1993).Recently, Jauniaux (1996) reported that limited areas ofintervillous blood flow can sometimes be detected beforethe 10th week in normal pregnancy. Merce et al. (1996),however, using Doppler ultrasound, found intervillousblood flow from 6 weeks onward, in accord with classicalembryological studies which reported the establishment ofintervillous blood flow around day 14 or 15 of embryoniclife (Wilken, 1958).
Table X. Studies of ovarian blood flow in in-vitro fertilization and infertility
Investigation Wave Flow TAMV, Vmax, PSV, MDV PI RI S/Dform volume TAMX MPSV ratio
Barber et al. (1988) x
Kurjak et al. (1991) x x
Weiner et al. (1993) (E) x
Glock & Brumsted (1995) x x x x
(INF,LI,N,E)
Zaidi et al. (1995a) (INF,PCO) x x x
Zaidi et al. (1995b) (INF,LI) x x
Aleem & Predanic (1996) x x x
(E,N,PCO)
Nargund et al. (1996) x x
Oyesanya et al. (1996) x x x
Zaidi et al. (1996a) x x
E = relationship to oestrogen, progesterone and ovulation induction also studied; INF = infertility LI = luteal insufficiency; N = normalcycle also studied; PCO = polycystic ovaries. See Table II for other abbreviations.
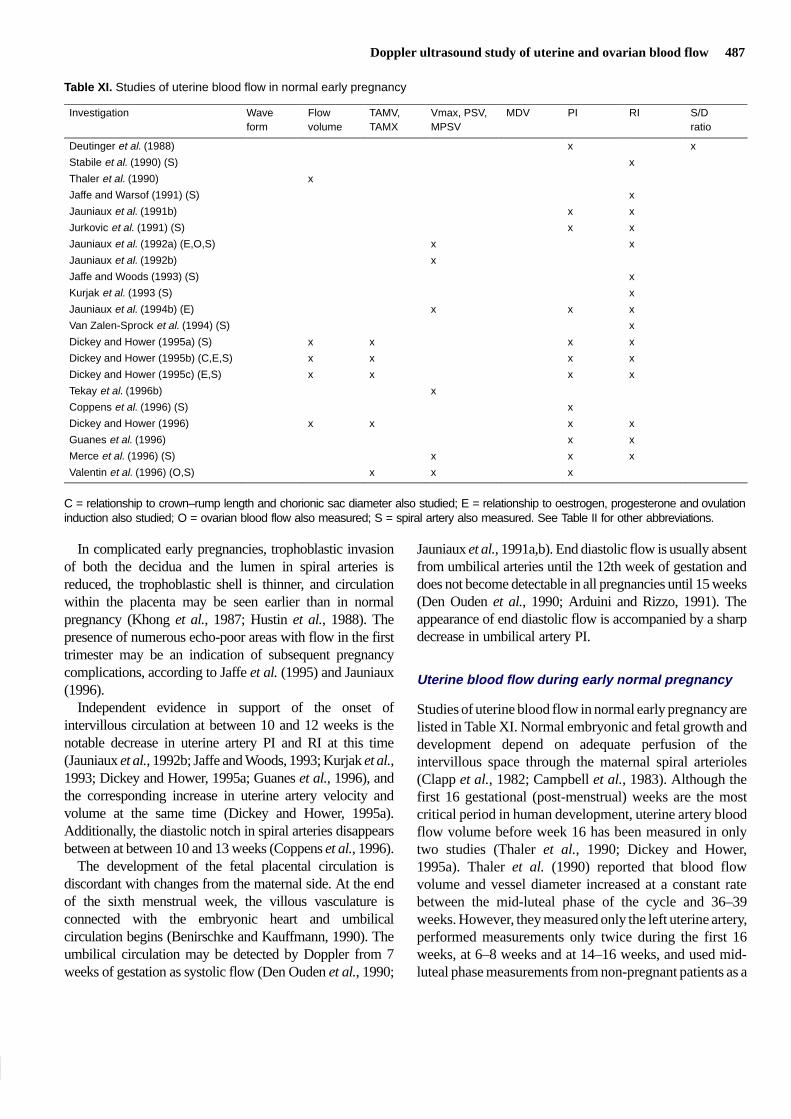
Doppler ultrasound study of uterine and ovarian blood flow 487
Table XI. Studies of uterine blood flow in normal early pregnancy
Investigation Wave Flow TAMV, Vmax, PSV, MDV PI RI S/Dform volume TAMX MPSV ratio
Deutinger et al. (1988) x x
Stabile et al. (1990) (S) x
Thaler et al. (1990) x
Jaffe and Warsof (1991) (S) x
Jauniaux et al. (1991b) x x
Jurkovic et al. (1991) (S) x x
Jauniaux et al. (1992a) (E,O,S) x x
Jauniaux et al. (1992b) x
Jaffe and Woods (1993) (S) x
Kurjak et al. (1993 (S) x
Jauniaux et al. (1994b) (E) x x x
Van Zalen-Sprock et al. (1994) (S) x
Dickey and Hower (1995a) (S) x x x x
Dickey and Hower (1995b) (C,E,S) x x x x
Dickey and Hower (1995c) (E,S) x x x x
Tekay et al. (1996b) x
Coppens et al. (1996) (S) x
Dickey and Hower (1996) x x x x
Guanes et al. (1996) x x
Merce et al. (1996) (S) x x x
Valentin et al. (1996) (O,S) x x x
C = relationship to crown–rump length and chorionic sac diameter also studied; E = relationship to oestrogen, progesterone and ovulationinduction also studied; O = ovarian blood flow also measured; S = spiral artery also measured. See Table II for other abbreviations.
In complicated early pregnancies, trophoblastic invasionof both the decidua and the lumen in spiral arteries isreduced, the trophoblastic shell is thinner, and circulationwithin the placenta may be seen earlier than in normalpregnancy (Khong et al., 1987; Hustin et al., 1988). Thepresence of numerous echo-poor areas with flow in the firsttrimester may be an indication of subsequent pregnancycomplications, according to Jaffe et al. (1995) and Jauniaux(1996).
Independent evidence in support of the onset ofintervillous circulation at between 10 and 12 weeks is thenotable decrease in uterine artery PI and RI at this time(Jauniaux et al., 1992b; Jaffe and Woods, 1993; Kurjak et al.,1993; Dickey and Hower, 1995a; Guanes et al., 1996), andthe corresponding increase in uterine artery velocity andvolume at the same time (Dickey and Hower, 1995a).Additionally, the diastolic notch in spiral arteries disappearsbetween at between 10 and 13 weeks (Coppens et al., 1996).
The development of the fetal placental circulation isdiscordant with changes from the maternal side. At the endof the sixth menstrual week, the villous vasculature isconnected with the embryonic heart and umbilicalcirculation begins (Benirschke and Kauffmann, 1990). Theumbilical circulation may be detected by Doppler from 7weeks of gestation as systolic flow (Den Ouden et al., 1990;
Jauniaux et al., 1991a,b). End diastolic flow is usually absentfrom umbilical arteries until the 12th week of gestation anddoes not become detectable in all pregnancies until 15 weeks(Den Ouden et al., 1990; Arduini and Rizzo, 1991). Theappearance of end diastolic flow is accompanied by a sharpdecrease in umbilical artery PI.
Uterine blood flow during early normal pregnancy
Studies of uterine blood flow in normal early pregnancy arelisted in Table XI. Normal embryonic and fetal growth anddevelopment depend on adequate perfusion of theintervillous space through the maternal spiral arterioles(Clapp et al., 1982; Campbell et al., 1983). Although thefirst 16 gestational (post-menstrual) weeks are the mostcritical period in human development, uterine artery bloodflow volume before week 16 has been measured in onlytwo studies (Thaler et al., 1990; Dickey and Hower,1995a). Thaler et al. (1990) reported that blood flowvolume and vessel diameter increased at a constant ratebetween the mid-luteal phase of the cycle and 36–39weeks. However, they measured only the left uterine artery,performed measurements only twice during the first 16weeks, at 6–8 weeks and at 14–16 weeks, and used mid-luteal phase measurements from non-pregnant patients as a

488 R.P.Dickey
Figure 8. Uterine artery; total (right plus left) flow volume (A), mean cross-sectional area (B), mean time averaged maximum velocity (C), heartrate (D), mean resistance index (E), and spiral artery resistance index (F). Mean (SE) filled symbols, smoothed curve open symbols. Reprintedwith permission from Dickey and Hower (1995a).
starting point. A linear increase in uterine artery MPSVbetween weeks 4 and 5 and weeks 13 through 16 wasreported by Jauniaux et al. (1992a) and Tekay et al.(1995a). However, Jauniaux et al. (1992b) reportedelsewhere that peak uterine artery velocity doubledbetween weeks 13 and 14. Valentin et al. (1996) found thatTAMV and PSV, measured from the fifth to the 11th
gestational week, increased exponentially in both thedominant and non-dominant uterine artery, and in thesubchorionic (spiral) arteries, in contrast to PI, whichdecreased linearly in both vessels.
Dickey and Hower (1995a) measured uterine blood flowwith transvaginal Doppler ultrasound at 1–3 week intervalsin 44 patients with primary or secondary infertility during

Doppler ultrasound study of uterine and ovarian blood flow 489
the first 16 weeks of pregnancy. They found that total (rightplus left) uterine artery flow volume increased verygradually, an average of 16 ml/min per week from 77ml/min at post-menstrual week 5 to 159 ml/min atpost-menstrual week 10, and then more rapidly to reach665 ml/min at week 16 (Figure 8A). Uterine arterycross-sectional area increased linearly through the first 16weeks (Figure 8B), while TAMV remained level orincreased slowly until week 8, then rapidly until week 16,with a tendency to plateau from week 12 to 15 (Figure 8C).
Studies of indices of resistance begun before the eighthweek are rare because of the infrequency with whichpatients are referred for scanning in early pregnancy.Linear decreases in uterine artery PI and RI in earlypregnancy between weeks 4–6 and weeks 16–32 have beenreported by several authors (Deutinger et al., 1988;Jauniaux et al., 1991a,b; Jurkovic et al., 1991; VanZalen-Sprock et al., 1994; Coppens et al., 1996; Valentin etal., 1996), but others (Jauniaux et al., 1992b; Jaffe andWoods, 1993; Kurjak et al., 1993; Guanes et al., 1996)have reported no change in PI and RI until week 8–12 (theonset of intervillous circulation), with a rapid decreasethereafter. Dickey and Hower (1995a) found that uterineartery RI (Figure 8E) and PI (not shown) were thereciprocal of velocity, and decreased slowly from week 5 toweek 10, then rapidly from week 10 to week 16.
A linear decrease in spiral artery indices of resistancebetween post-menstrual weeks 4–6 and weeks 15–16 hasbeen consistently reported by all authors [Stabile et al.,1990; Jurkovic et al., 1991; Jaffe and Warsof, 1991;Jauniaux et al., 1992b; Jaffe and Woods, 1993; Kurjaket al., 1993; VanZalen-Sprock et al., 1994; Dickey andHower, 1995a (Figure 8F); Coppens et al., 1996; Merceet al., 1996; Valentin et al., 1996].
Analysis of covariance performed before and after week10, the putative onset of intravillous flow, by Dickey andHower (1995a), revealed that cross-sectional area of theuterine artery was the most important factor in determininguterine artery flow volume before week 10, while TAMVwas the most important factor after week 10 (Table XII).Uterine artery PI and RI were related more closely tovelocity than to flow volume for all weeks. Spiral artery PIand RI were positively related to flow volume, that is spiralartery impedance decreased and flow increased whenuterine artery flow volume decreased before week 10, butnot from week 10 to 16. This may be due to the ability ofmyometrial vessels, but not placental vessels, to respond todecreased uterine artery volume by vasodilatation(Kauppila et al., 1980).
The total flow volume from both uterine arteries,measured during the fifth to sixth gestational weeks by
Dickey and Hower (1995a) (Figure 8) was equal to thatreported by Thaler et al. (1990) for a single artery ofnon-pregnant patients during the mid-luteal phase. By the16th week, however, total flow volume in Figure 8 wastwice that reported by Thaler et al. (1990) for a single arteryduring the 31st to the 33rd weeks, but was similar to the 500ml/min reported by Maini et al. (1985) for the same weeksof gestation using an invasive radioisotope method.
The most obvious explanation for the marked decreasein uterine artery RI and PI and consequent increase invelocity, which began at 8 weeks, is the onset ofintervillous circulation. The linear decrease in spiral arteryRI and PI from week 4 or 5 is consistent with the finding ofJaffe and Woods (1993) that trophoblastic invasion of thespiral artery musculo-elastic architecture begins soon afterimplantation.
According to Duvekot et al. (1993), a decrease insystemic vascular tone, lowering both afterload andpreload, begins early in pregnancy between post-menstrualweeks 5 and 8 (Duvekot et al., 1993; Duvekot and Peeters,1994). Cardiac output increases in response to an increasein heart rate in early pregnancy. Later, increases in thestroke volume are more important as ventricular fillingstatus normalizes. According to Duvekot and Peeters(1994), 60% of all of the systemic and cardiac changeshave occurred by mid-pregnancy. In the study by Dickeyand Hower (1995a), however, uterine artery flow volumeshowed no relationship to maternal heart rate and, after the10th week, 80% of the difference in uterine artery flowvolume between patients could be explained by velocityand vessel size alone.
In a review of recent developments in understandinguteroplacental circulation in early pregnancy, Jauniaux(1996) stated, ‘Longitudinal evaluation of placental bloodflow is the only possible approach for future study of invivo early pregnancy.’ He could have added that studiesshould be started in the fourth week of gestation, should becarried out weekly, should include either flow volume orTAMV in addition to indices of resistance, and shouldinclude only pregnancies delivered of normal babies atterm.
A longitudinal study of uterine artery and spiral arteryblood flow in patients with normal outcome is underway inthe our clinic, with results reported as centiles. Preliminaryresults indicate that normal flow volumes for the 10th and50th centiles are approximately 30 ml/min and 100 ml/minrespectively from the mid-luteal phase of the cycle throughthe fifth post-menstrual week, rise slowly until the 10th or12th post-menstrual week, and then increase rapidlythereafter until the end of study at week 16.
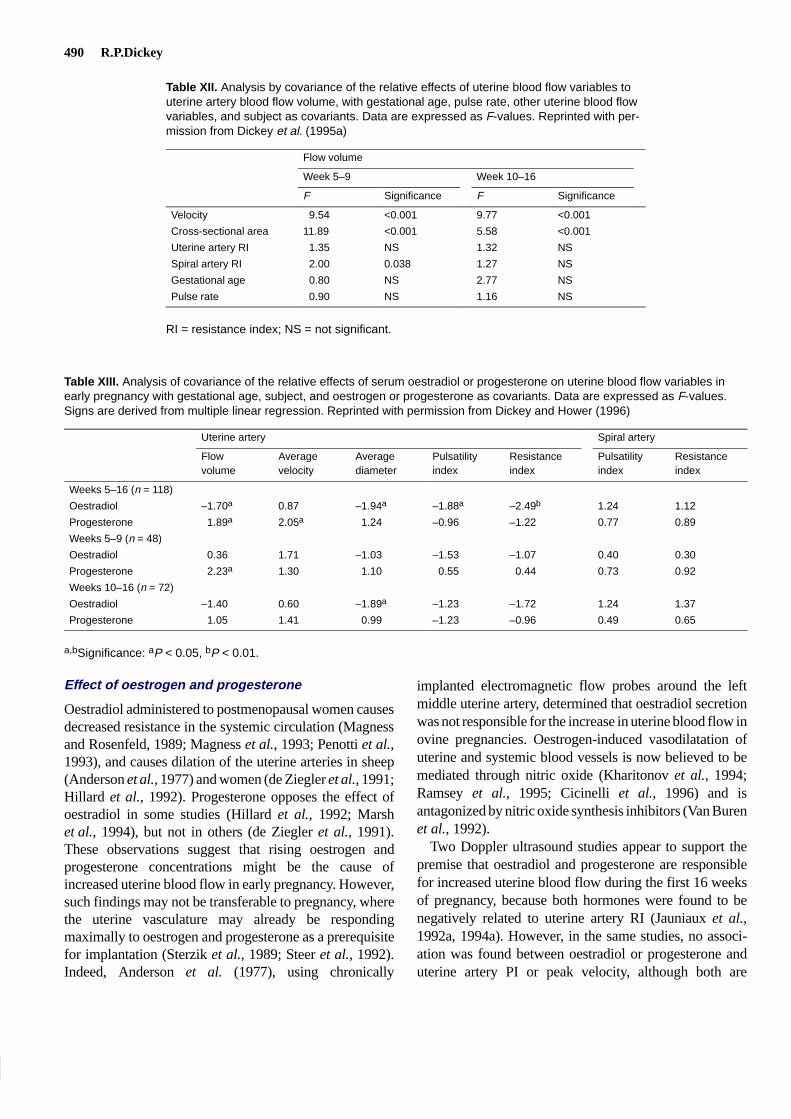
490 R.P.Dickey
Table XII. Analysis by covariance of the relative effects of uterine blood flow variables touterine artery blood flow volume, with gestational age, pulse rate, other uterine blood flowvariables, and subject as covariants. Data are expressed as F-values. Reprinted with per-mission from Dickey et al. (1995a)
Flow volume
Week 5–9 Week 10–16
F Significance F Significance
Velocity 9.54 <0.001 9.77 <0.001
Cross-sectional area 11.89 <0.001 5.58 <0.001
Uterine artery RI 1.35 NS 1.32 NS
Spiral artery RI 2.00 0.038 1.27 NS
Gestational age 0.80 NS 2.77 NS
Pulse rate 0.90 NS 1.16 NS
RI = resistance index; NS = not significant.
Table XIII. Analysis of covariance of the relative effects of serum oestradiol or progesterone on uterine blood flow variables inearly pregnancy with gestational age, subject, and oestrogen or progesterone as covariants. Data are expressed as F-values.Signs are derived from multiple linear regression. Reprinted with permission from Dickey and Hower (1996)
Uterine artery Spiral artery
Flow Average Average Pulsatility Resistance Pulsatility Resistancevolume velocity diameter index index index index
Weeks 5–16 (n = 118)
Oestradiol –1.70a 0.87 –1.94a –1.88a –2.49b 1.24 1.12
Progesterone 1.89a 2.05a 1.24 –0.96 –1.22 0.77 0.89
Weeks 5–9 (n = 48)
Oestradiol 0.36 1.71 –1.03 –1.53 –1.07 0.40 0.30
Progesterone 2.23a 1.30 1.10 0.55 0.44 0.73 0.92
Weeks 10–16 (n = 72)
Oestradiol –1.40 0.60 –1.89a –1.23 –1.72 1.24 1.37
Progesterone 1.05 1.41 0.99 –1.23 –0.96 0.49 0.65
a,bSignificance: aP < 0.05, bP < 0.01.
Effect of oestrogen and progesterone
Oestradiol administered to postmenopausal women causesdecreased resistance in the systemic circulation (Magnessand Rosenfeld, 1989; Magness et al., 1993; Penotti et al.,1993), and causes dilation of the uterine arteries in sheep(Anderson et al., 1977) and women (de Ziegler et al., 1991;Hillard et al., 1992). Progesterone opposes the effect ofoestradiol in some studies (Hillard et al., 1992; Marshet al., 1994), but not in others (de Ziegler et al., 1991).These observations suggest that rising oestrogen andprogesterone concentrations might be the cause ofincreased uterine blood flow in early pregnancy. However,such findings may not be transferable to pregnancy, wherethe uterine vasculature may already be respondingmaximally to oestrogen and progesterone as a prerequisitefor implantation (Sterzik et al., 1989; Steer et al., 1992).Indeed, Anderson et al. (1977), using chronically
implanted electromagnetic flow probes around the leftmiddle uterine artery, determined that oestradiol secretionwas not responsible for the increase in uterine blood flow inovine pregnancies. Oestrogen-induced vasodilatation ofuterine and systemic blood vessels is now believed to bemediated through nitric oxide (Kharitonov et al., 1994;Ramsey et al., 1995; Cicinelli et al., 1996) and isantagonized by nitric oxide synthesis inhibitors (Van Burenet al., 1992).
Two Doppler ultrasound studies appear to support thepremise that oestradiol and progesterone are responsiblefor increased uterine blood flow during the first 16 weeksof pregnancy, because both hormones were found to benegatively related to uterine artery RI (Jauniaux et al.,1992a, 1994a). However, in the same studies, no associ-ation was found between oestradiol or progesterone anduterine artery PI or peak velocity, although both are

Doppler ultrasound study of uterine and ovarian blood flow 491
ordinarily closely associated with RI. Also, uterine arteryblood flow volume, a more direct indication of uterineperfusion, was not measured. Multiple linear regressionanalysis, which was performed for the entire period ofweeks 5 through 16 in these studies, may have missedimportant changes in uterine blood flow that occur after thebeginning of intervillous circulation during the 10th weekof gestation. Dickey and Hower (1996) analysed therelationship between uterine blood flow and serumoestradiol and progesterone, first for weeks 5 through 16inclusive, and then separately before and after 10 weeks.They used analysis of covariance to adjust for gestationalage, effect of sex steroids not in the primary analysis, andrepeat analysis of the same subjects (Bland and Altman,1995). When studies with non-continuous uterine arterywaveforms were excluded from analysis, both PI and RIwere negatively related to oestradiol for weeks 5–16 (TableXIII). Uterine artery flow volume and diameter were alsonegatively related to oestradiol for weeks 5–16, despite thedecrease in downstream resistance represented by thenegative relationships of oestradiol to PI and RI.Progesterone concentrations were positively related toboth total flow volume and average velocity for weeks5–16. When ultrasound examinations with non-continuouswaveforms were included in the analysis, uterine artery RIwas negatively related to oestradiol, but uterine artery PIwas unrelated to oestradiol for weeks 5–16 (data notshown), as previously reported by Jauniaux et al. (1994b).When relationships were reanalysed separately before andafter week 10, oestradiol concentrations were negativelyrelated to diameter, but not to flow volume, PI, or RI forweeks 10–16. Progesterone was positively related to flowvolume during weeks 5–9 and was unrelated to volume orvelocity during weeks 10–16. Thus, during the first 10weeks of pregnancy, the net effect of progesterone was toincrease uterine blood flow, while the effect of oestradiolwas nil, a decrease in uterine artery diameter beingcancelled by a decrease in distal vessel impedance. Afterthe 10th week, the effect of progesterone was negligible,while oestradiol had an adverse effect on uterine arterydiameter and flow volume.
The paradoxical finding that oestradiol is associated withboth decreased uterine artery blood flow volume anddecreased downstream resistance can be explained ifoestradiol affects uterine blood flow by two differentmechanisms, one acting on the uterine arteries and the otheracting on smaller vessels. Vasodilatation mediated throughnitric oxide is now a well-known effect of oestrogen(Kharitonov et al., 1994; Ramsey et al., 1995; Cicinelli et al.,1996). The negative association between oestradiol anduterine artery diameter found in spontaneous cycles could be
explained by the finding that oestrogens can potentiateα-adrenergic vasoconstriction in response to prostaglandins(Colucci et al., 1982; Miller and Vanhoutte, 1990). On theother hand, apparent relationships between oestradiol orprogesterone and increased uterine blood flow during earlypregnancy may be due to nothing more than colinearity.Duvekot et al. (1993), in a study of cardiovascular, renal andendocrine changes throughout pregnancy, concluded thatcardiovascular changes in pregnancy were not the result ofincreased oestradiol, progesterone, or plasma reninconcentrations. Anderson et al. (1977) also concluded thatoestrogen was not responsible for the increase in uterineblood flow volume in ovine pregnancy.
The premise that oestradiol and progesterone have a directeffect on uterine blood flow during pregnancy is supportedby the findings that receptors for these hormones are presentin the muscle cells of non-pregnant uterine arteries(Perrot-Applanat et al., 1988), that oestradiol may have adirect, smooth muscle relaxing effect, mediated by acalcium-channelled blockage mechanism (Jiang et al.,1991), and that oestradiol may potentiate vasodilatation, viaendothelial-derived relaxin factor and endothelial-independent vasodilators (Gilligan et al., 1994; Kharitonovet al., 1994; Ramsey et al., 1995; Cicinelli et al., 1996).
Irrespective of the relationship to uterine blood flow,oestrogen apparently has no role in the maintenance ofearly pregnancy, since oestradiol replacement withoutprogesterone replacement is unable to prevent abortion inpatients lutectomized in early pregnancy (Csapo et al.,1973) or in ovariectomized primates (Ghosh et al., 1994).
The relationship between uterine blood flow, hormoneconcentrations and embryo development during the first 16weeks of pregnancy is difficult to assess and to analyse, dueto the rapid changes which occur, problems of colinearity,and the onset of intervillous circulation. Studies on uterineartery blood flow and steroid measurements summarizedin Table VI were performed in patients with a history ofinfertility or previous pregnancy loss and, therefore, resultsof similar studies in an entirely normal population may bedifferent.
Effect of ovulation induction drugs
Ovulation induction with HMG and clomiphene citrateresults in marked increases in oestradiol and progesteronewhich continue into early pregnancy (Robertson et al., 1971;Dickey et al., 1991, 1992a, 1993c; Ghosh et al., 1994).Uterine blood flow was previously measured duringovulation induction with HMG (Weiner et al., 1993) and atthe time of embryo transfer (Sterzik et al., 1989; Steer et al.,1992), but such studies were not continued into pregnancy.
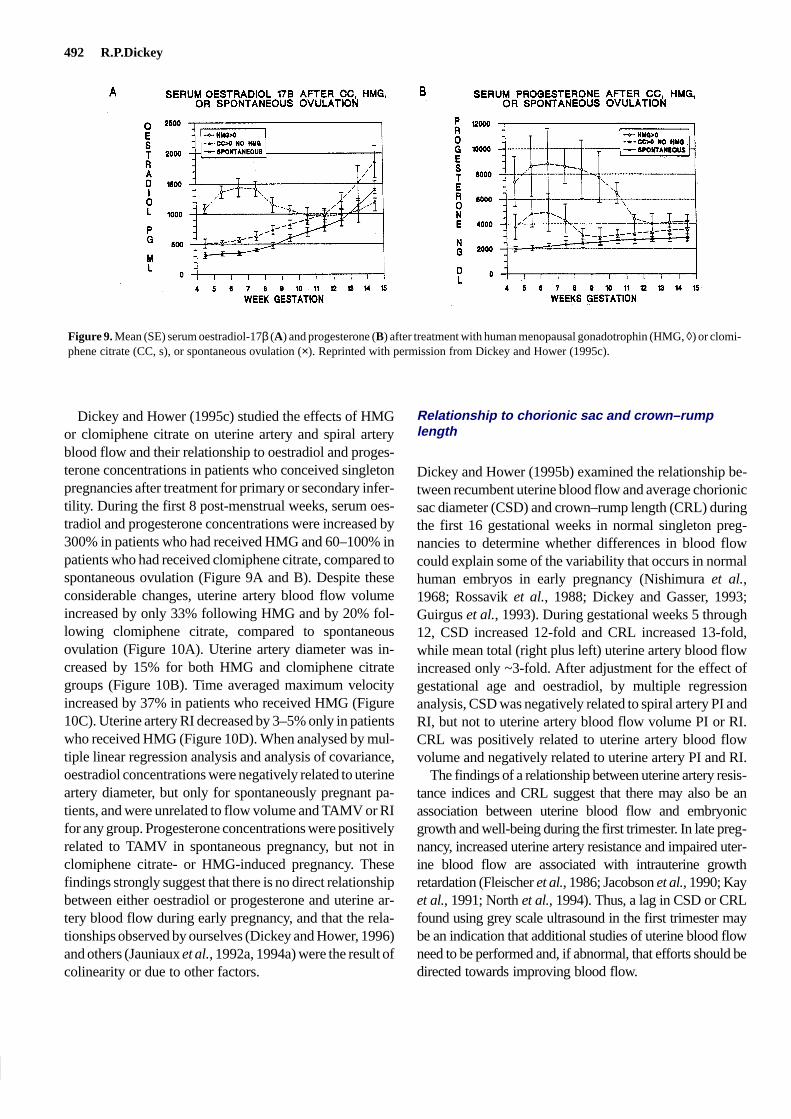
492 R.P.Dickey
Figure 9. Mean (SE) serum oestradiol-17β (A) and progesterone (B) after treatment with human menopausal gonadotrophin (HMG, ◊) or clomi-phene citrate (CC, s), or spontaneous ovulation (×). Reprinted with permission from Dickey and Hower (1995c).
Dickey and Hower (1995c) studied the effects of HMGor clomiphene citrate on uterine artery and spiral arteryblood flow and their relationship to oestradiol and proges-terone concentrations in patients who conceived singletonpregnancies after treatment for primary or secondary infer-tility. During the first 8 post-menstrual weeks, serum oes-tradiol and progesterone concentrations were increased by300% in patients who had received HMG and 60–100% inpatients who had received clomiphene citrate, compared tospontaneous ovulation (Figure 9A and B). Despite theseconsiderable changes, uterine artery blood flow volumeincreased by only 33% following HMG and by 20% fol-lowing clomiphene citrate, compared to spontaneousovulation (Figure 10A). Uterine artery diameter was in-creased by 15% for both HMG and clomiphene citrategroups (Figure 10B). Time averaged maximum velocityincreased by 37% in patients who received HMG (Figure10C). Uterine artery RI decreased by 3–5% only in patientswho received HMG (Figure 10D). When analysed by mul-tiple linear regression analysis and analysis of covariance,oestradiol concentrations were negatively related to uterineartery diameter, but only for spontaneously pregnant pa-tients, and were unrelated to flow volume and TAMV or RIfor any group. Progesterone concentrations were positivelyrelated to TAMV in spontaneous pregnancy, but not inclomiphene citrate- or HMG-induced pregnancy. Thesefindings strongly suggest that there is no direct relationshipbetween either oestradiol or progesterone and uterine ar-tery blood flow during early pregnancy, and that the rela-tionships observed by ourselves (Dickey and Hower, 1996)and others (Jauniaux et al., 1992a, 1994a) were the result ofcolinearity or due to other factors.
Relationship to chorionic sac and crown–rumplength
Dickey and Hower (1995b) examined the relationship be-tween recumbent uterine blood flow and average chorionicsac diameter (CSD) and crown–rump length (CRL) duringthe first 16 gestational weeks in normal singleton preg-nancies to determine whether differences in blood flowcould explain some of the variability that occurs in normalhuman embryos in early pregnancy (Nishimura et al.,1968; Rossavik et al., 1988; Dickey and Gasser, 1993;Guirgus et al., 1993). During gestational weeks 5 through12, CSD increased 12-fold and CRL increased 13-fold,while mean total (right plus left) uterine artery blood flowincreased only ~3-fold. After adjustment for the effect ofgestational age and oestradiol, by multiple regressionanalysis, CSD was negatively related to spiral artery PI andRI, but not to uterine artery blood flow volume PI or RI.CRL was positively related to uterine artery blood flowvolume and negatively related to uterine artery PI and RI.
The findings of a relationship between uterine artery resis-tance indices and CRL suggest that there may also be anassociation between uterine blood flow and embryonicgrowth and well-being during the first trimester. In late preg-nancy, increased uterine artery resistance and impaired uter-ine blood flow are associated with intrauterine growthretardation (Fleischer et al., 1986; Jacobson et al., 1990; Kayet al., 1991; North et al., 1994). Thus, a lag in CSD or CRLfound using grey scale ultrasound in the first trimester maybe an indication that additional studies of uterine blood flowneed to be performed and, if abnormal, that efforts should bedirected towards improving blood flow.
Doppler ultrasound study of uterine and ovarian blood flow 493
Figure 10. Mean (SE) uterine artery total (right plus left) flow volume (A), mean diameter (B), mean time averaged maximum velocity (C) andmean resistance index (D), following treatment with human menopausal gonadotrophin (HMG, ◊) or clomiphene citrate (CC, s), or spontaneousovulation (×). Reprinted with permission from Dickey and Hower (1995c).
Uterine blood flow in abnormal pregnancy
Increased impedance of uterine and umbilical artery bloodflow, presenting as elevated RI and PI ratios and persistenceof the early diastolic notch into the third trimester is asso-ciated with intrauterine growth retardation (IUGR), prema-ture delivery, maternal hypertension and in severe cases, fetaldeath (Gerretsen et al., 1981; Trudinger et al., 1985;Fleischer et al., 1986; Jacobson et al., 1990; Harrington etal., 1991; Meekins et al., 1994; Murakoshi et al., 1996). Thefirst 12 weeks of gestation are the period of most rapidembryonic development (O’Rahilly and Muller, 1987). Im-pairment of subplacental blood flow at this time by vasoac-tive drugs has been shown to result in birth defects(Danielsson et al., 1989) and may be the mechanism bywhich diabetes results in birth defects associated with a lag inembryo growth (Pedersen and Moldsted-Pedersen, 1981).
Jaffe et al. (1995) noted that 50% of complicated preg-nancies demonstrated abnormal first trimester Dopplercharacteristics. They later followed up 32 patients who hadspiral artery RI above 2 SD and blood flow in the intervillous
space before 12 weeks. They found that when theintraplacental RI was greater than the umbilical RI between22 and 25 weeks, 80% of pregnancies had an abnormaloutcome (Jaffe and Woods, 1996). Chianchianco et al.(1991) found an association with abnormal uteroplacentalblood flow, pregnancy related hypertension and a history ofrecurrent abortion. However, most uterine blood flowstudies have failed to show significant differences inresistance indices between pregnancies with normaloutcomes and pregnancies which subsequently ended inabortion (Alfirevic and Kurjak, 1990; Arduini et al., 1991;Jaffe and Warsof, 1992). Jauniaux et al. (1994b) found thatmean uterine artery PI was elevated in missed abortions,but that mean uterine artery RI and spiral artery PI and RIwere within normal limits. Pathological examination of themissed abortion specimens in their study showed afragmented or absent trophoblastic shell in 53%, reducedor absent trophoblastic infiltration in 43%, and absent orreduced physiological changes in spiral arteries in 63% ofcases. Other histological studies of spontaneous abortion

494 R.P.Dickey
have also demonstrated defective transformation of thespiral arteries and a reduced trophoblastic infiltration of thedecidua (Khong et al., 1987; Hustin et al., 1990). None ofthe studies of the relationship of uterine blood flow toabortion have reported the karyotype of the aborti. As aresult, given the high degree of variability in individualvalues in these studies, it is impossible to know whetherabnormal blood flow was responsible for abortion of akaryotypically normal embryo, was the result ofinadequate trophoblastic invasion of a karyotypicallyabnormal embryo, or was the end result of embryo demiseirrespective of whether the karyotype was normal or not.
In an ongoing study in our clinic, in which recumbent andstanding uterine artery flow volume and uterine and spiralartery PI and RI are recorded at the time of the first positivequantitative pregnancy test and at each subsequent visit,patients are encouraged to undergo a dilatation and curettageprocedure to obtain tissue for karyotype diagnosis whenevera diagnosis of inevitable abortion is made by ultrasound.Recumbent blood flow volume prior to loss of viability wasbelow the 50th centile in 8/10 subsequent pregnancy losseswith normal karyotype (46XX = 5, 46XY = 5), in 5/5biochemical pregnancies, and in 1/3 with an abnormalkaryotype. A 50% decrease in blood flow volume duringstanding occurred in 5/10 losses with normal karyotype(46XY = 4, 46XX = 1) and 1/3 with an abnormal karyotype.Uterine RI was ≥0.80 in 6/10 pregnancy losses with normalkaryotypes, 4/5 biochemical pregnancies, and 1/3 withabnormal karyotypes. Uterine artery PI was ≥2.50 in 3/10with normal karyotypes (all 46XY), in 3/5 biochemicalpregnancies, and in 0/3 with abnormal karyotypes. Spiralartery RI was ≥0.80 in 7/10 with normal karyotypes, 5/5biochemical pregnancies, and 2/3 with abnormal karyotypes.
In preliminary studies of uterine blood flow in the smallsac syndrome, where the difference between meangestational sac diameter and embryo crown–rump length is<5 mm before gestational day 65 (Bromely et al., 1988;Nazari et al., 1991) and most embryos are karyotypicallynormal (Dickey et al., 1992c), small gestational sac size wasassociated with higher than normal spiral artery PI and RI(R.P.Dickey, unpublished observations). Administration oforal micronized progesterone or i.m. progestin was followedby significant decreases in spiral artery PI and RI and bysignificant increases in gestational sac diameter (R.P.Dickey,unpublished observations).
New areas of investigation
Postural studies
A consistent limitation of Doppler ultrasound studies ofuterine blood flow is that measurements have been obtained
only in the recumbent position. Blood flow measurementswhile standing may be equally or more importantphysiologically, and may differ significantly from recumbentmeasurements. Standing causes a change in position and/ordownward movement of the uterus, which may result inacute angulation or stretching of the uterine arteries,especially in patients with poor uterine support. As aconsequence, arterial diameter may be decreased, and ifuncompensated for by increased pulse rate or decreaseddownstream resistance, can result in a decrease in blood flowvolume.
Dickey et al. (1994) measured blood flow by Dopplerultrasound during the mid-luteal phase in 74 non-pregnantpatients, first while recumbent and then twice whilestanding: once immediately, and again after 9–14 min ofstanding, without removal of the vaginal probe. Bloodpressure and pulse rate were recorded during eachmeasurement period (Table XIV). Total right plus left uterineartery blood flow volume fell progressively while standingin 70% of patients by an average 11% after 3–8 min and byan average 34% after 9–14 min (Figure 11). Decreases inblood flow volume while standing were accompanied bysignificant decreases in mean uterine artery diameter andsignificant increases in mean uterine artery PI, with nochange in uterine artery RI nor in spiral artery PI and RI. Insubjects with unchanged or increased blood flow volumewhile standing, there was no change in mean diameter, butmean uterine artery PI and RI were decreased. Pulse rate andmean blood pressure were increased equally in patients bothwith decreased and with increased flow volume.
Decreases in blood flow volume at 3–8 min and at 9–14min of standing could be entirely accounted for by decreasesin cross-sectional area, which averaged 22% at 3–8 min and34% at 9–14 min. Increased flow volume while standing wasdue to both an increase in pulse rate, which resulted inincreased end diastolic flow, and to a decrease indownstream vessel impedance.
Waveforms became worse in 16% of individual uterinearteries (right or left) while standing (Table IV). Uterineartery waveforms with absent end diastolic flow only whilerecumbent (B or D-I) became continuous in seven of ninecases while standing, due to increased pulse rate, anddegraded to absence of early diastolic flow (A or D, D-II orD-III) in two cases (22%). Twelve percent of patientsdemonstrated either absent early diastolic flow (A or D, D-IIor D-III) or no visible flow (N) for the first time whilestanding. Poor uterine support was associated with increaseduterine artery PI (r = 0.33) while standing, but not whilerecumbent. A history of previous spontaneous abortion wasassociated with decreased uterine blood flow and increased

Doppler ultrasound study of uterine and ovarian blood flow 495
Figure 11. Effect of standing (percentage change), mean (SE) on (A) ascending uterine artery [flow volume (UA-VOL, unbroken line), pulsatilityindex (dashed line), resistance index (dotted line)] and (B) spiral artery [pulsatility index (dashed line), resistance index (dotted line)] in all subjects(a), subjects with increased UA-VOL, (b), and subjects with decreased UA-VOL (c). Reprinted with permission from Dickey et al. (1994).
uterine artery PI or RI while recumbent, but not whilestanding.
Spiral artery PI initially rose in all subjects upon standingand then decreased at 9–14 min in subjects with increaseduterine artery flow volume, but remained elevated in subjectswith decreased flow volume (Figure 11). This suggested thatthese two groups respond differently to the challenge ofchanging from a recumbent to a standing position. Spiralartery flow which had indicated absence of end diastolicflow (B or D-I) while recumbent converted to continuousflow in 13 of 14 cases and degraded to A or D-II in one casewhile standing (Table IV). Spiral artery PI and RI wererelated to uterine artery blood flow volume while standing,but not while recumbent, and were more strongly related to
uterine artery PI and RI while standing than while recumbent(Table V).
Possible explanations for the initial rise in spiral artery PIin all subjects, followed by a fall only in those withunchanged or increased uterine artery flow volume, includeindividual differences in endothelium-dependent relaxingfactor (Meyer et al., 1993), prostaglandins (Greiss, 1972), oradrenergic innervation (Ford et al., 1984). Alternatively, afall in uterine artery blood flow may be the normal responseto standing, and the increase in blood flow may be aberrant.This possibility is suggested by the finding that averagerecumbent uterine blood flow volume was initially lower insubjects who experienced a rise in flow volume whilestanding (Table XIV).

496 R.P.Dickey
Table XIV. Effect of standing on ascending uterine artery (UA) and spiral artery (SA) blood flow volume per minute (VOL), diame-ter (DIA), pulsatility index (PI) and resistance index (RI). Values are mean ± SE. Modified and reprinted with permission fromDickey et al. (1994)
Recumbent Standing (3–8 min) Standing (9–14 min)
Value Value % Change Value % Change
Subjects with increased or unchange UA-VOL (n = 22)
UA-VOL (ml) 61.6 ± 6.6 80. ± 10.9 126.2 ± 6.6b 90.0 ± 12.8 142.8 ± 9.1c
UA-DIA (mm) 2.78 ± 0.06 2.70 ± 0.05 97.6 ± 2.0 2.76 ± 0.05 100.0 ± 2.5
UA-PI 2.76 ± 0.14 2.50 ± 0.11 89.8 ± 3.4b 2.40 ± 0.13 86.6 ± 2.5c
UA-RI 0.90 ± 0.02 0.86 ± 0.02 96.3 ± 1.6a 0.85 ± 0.02 94.8 ± 1.4c
SA-PI 2.10 ± 0.10 2.07 ± 0.11 102.5 ± 6.7 0.95 ± 0.08 96.4 ± 5.8
SA-RI 0.84 ± 0.02 0.80 ± 0.02 96.2 ± 2.8 0.81 ± 0.02 97.4 ± 4.3
Pulse rate 72.4 ± 2.4 89.4 ± 4.2 124.2 ± 4.6c 91.1 ± 5.0 126.4 ± 6.0c
Mean BP 89.4 ± 1.9 92.8 ± 2.1 104.2 ± 2.4 94.3 ± 1.8 105.2 ± 1.6+
Subjects with decreased UA-VOL ( n = 52)
UA-VOL (ml) 78.9 ± 6.6 57.6 ± 4.5 78.5 ± 4.3c 50.5 ± 4.4 65.8 ± 2.8c
UA-DIA (mm) 2.88 ± 0.05 2.69 ± 0.05 94.1 ± 1.5c 2.65 ± 0.04 92.8 ± 1.5c
UA-PI 2.65 ± 0.08 2.73 ± 0.11 103.5 ± 2.9 3.08 ± 0.22 115.2 ± 6.7a
UA-RI 0.89 ± 0.01 0.90 ± 0.01 101.5 ± 1.1 0.90 ± 0.06 102.0 ± 1.2
SA-PI 1.95 ± 0.08 2.05 ± 0.09 108.2 ± 4.8 2.06 ± 0.09 109.0 ± 5.2
SA-RI 0.83 ± 0.02 0.82 ± 0.02 99.6 ± 2.4 0.81 ± 0.02 98.4 ± 2.4c
Pulse rate 75.4 ± 1.5 91.1 ± 2.2 122.3 ± 2.7c 94.0 ± 2.6 125.0 ± 3.6c
Mean BP 91.4 ± 1.0 93.5 ± 1.3 102.7 ± 1.4 96.1 ± 1.6 105.3 ± 1.6b
BP = blood pressure.a,b,cPaired t-test, standing versus recumbent, 3–8 min versus 9–14 min: aP < 0.05, bP < 0.01, cP < 0.001.
Studies of the effect of standing in pregnant patients arenow underway in our clinic. Pregnant patients are allowed tostand for no more than 5–6 min while repeating blood flowmeasurements. Early results indicate that 70% of pregnantpatients experience a decrease in blood flow volume whilestanding during the fourth and fifth gestational weeks, thesame proportion as for non-pregnant patients.Approximately 4% of pregnant patients experience a fall inuterine blood flow of ≥50% while standing during the first10 weeks of gestation. Both the percentage of patients whoexperience a decrease in blood flow while standing and theextent of the decrease appear to decline as pregnancyprogresses. This may be an important adaptation to the needfor increased blood flow and oxygenation. The reasons forthis adaptation may be entirely mechanical, due toenlargement of the uterus and its vessels and to changes in itsposition within the pelvis, or may be due to maturation oradaptation of humeral or neurological factors or acombination of these. Vasodilation has been shown to occurin response to reduced uterine perfusion during the secondand third trimesters of normal pregnancy, presumably due torelease of endogenous nitrous oxide in the vascularepithelium (Cameron et al., 1993; Ramsey et al., 1994).Improvement in the response to decreased uterine artery
blood flow volume caused by postural changes may be anecessary physiological adaptation, because the placentalvessels are unable to increase perfusion by vasodilation(Kauppila et al., 1980).
Although previous ultrasound studies of systemic(Duvekot et al., 1993) and uterine (Thaler et al., 1990;Jurkovic et al., 1991; Jauniaux et al., 1992b; Jaffe andWoods, 1993) blood flow in early pregnancy have failed toconsider the effect of posture, assessment of the effect ofposture on cardiac and uterine blood flow is not new.Lindhard (1913) reported a decrease in cardiac output in menupon changing from the recumbent to the standing position.In 1956, Morris et al., using the 24NA clearance method,found increased uterine blood flow during bed rest,compared with exercise during pregnancy. Suonio et al.(1976) noted a 23% decrease in placental blood flow in latepregnancy when moving from the left lateral recumbent to astanding position. Dickey et al. (1966) reported an 80%decrease in urinary oestriol excretion when changing from arecumbent to a standing position during the third trimester,which they attributed to a change in placental perfusion.Schiff et al. (1991) studied the use of Doppler ultrasound ofuterine arteries to increase the sensitivity of the rollover testof Gant et al. (1974) to predict patients at increased risk of
Doppler ultrasound study of uterine and ovarian blood flow 497
pregnancy-induced hypertension. Indeed, this new evidenceof the effect of standing on uterine blood flow may explainwhy bed rest has been traditionally considered to bebeneficial in preventing recurrent or threatened abortion(Hertig and Livingstone, 1944).
Standing studies are not without difficulty. Transvaginalscanning of both ascending uterine arteries and ofmyometrial spiral arteries while the subjects are standing isnot possible in very obese subjects, in subjects with verylarge ovaries due to hyperstimulation, and when the uterusis greatly enlarged by fibroids. Some subjects became faintwhile standing, especially in early pregnancy.Measurement of flow volume requires more time thanmeasurement of uterine and spiral artery indices, so thatacute changes may be missed. More precise assessment oftime-related uterine blood flow changes after standing,with instrumentation which allows instantaneous andmeasurement of minute blood flow volume, PI and RI, isneeded. However, the findings of standing studies to dateindicate that, when possible, measurements of uterineblood flow should be performed both with patientsstanding and recumbent.
Non-steroidal drugs
At the present time, not enough is known about the effect ofdrugs, other than oestrogen and progesterone, on humanuterine and ovarian blood flow in infertility and earlypregnancy. This situation should change because of theease with which blood flow may be measured with vaginalDoppler ultrasound under physiological conditions.Investigation of drug effects on uterine blood flow ininfertility and early pregnancy can be ranked in order ofsignificance as (i) studies performed during late pregnancy,(ii) studies of non-pregnant reproductive age women, (iii)inferences from animal studies during pregnancy, (iv)inferences from human investigations of the effects ofdrugs on the systemic circulation and (v) anecdotal reports.
The largest number of reports concern late pregnancy, andare concerned with three types of drugs: nitrous oxide,aspirin and vasodilators. It is now known that arterialcirculation is continuously dilated by nitric oxide releasedfrom arterial and arteriole endothelium (Vallance and Collier,1994). The role of nitric oxide in late pregnancy, itsrelationship to pre-eclampsia, and its role as a widespreadbiological mediator have been reviewed recently (Vallanceand Collier, 1994; Morris et al., 1996a). Endothelial-derivedrelaxing factor, discovered by Furchgott and Zawadski(1980), was proven to be nitric oxide by two groups actingindependently (Ignarro et al., 1987; Palmer et al., 1987).Nitric oxide has been shown to mediate oestrogen-induced
vasodilation (Van Buren et al., 1992). Endothelial-derivednitric oxide may be a key regulator of placental blood flowduring pregnancy (Moncada et al., 1991; Chang et al., 1992;Myatt et al., 1992; Hull et al., 1994). Circulatingconcentrations of nitrite, an oxidative metabolite of nitricoxide, are reduced in patients with pre-eclampsia (Seligmanet al., 1994). In non-pregnant women of reproductive age,circulating concentrations of nitric oxide metabolites arehigher in the proliferative phase of the menstrual cycle thanin the luteal phase and they peak at mid cycle (Cicinelli et al.,1996). In patients undergoing IVF, nitrite and nitrate(NO3/NO2) concentrations in follicles ≥4 mm diameter arerelated to ovarian artery PI (Anteby et al., 1996).
In animals, nitric oxide synthesis activity in maternaltissue begins to increase early in pregnancy (Weiner et al.,1994). Prolonged blockage of nitric oxide synthesisproduces a pre-eclampsia-like syndrome in rats (Molnaret al., 1994). Inhibition of nitric oxide synthesis results ingrowth retardation and limb defects in rats (Diket et al.,1994).
Glycerol trinitrate (GTN) is a nitric oxide donor whichpreferentially dilates veins and other vessels that have lowbasal output of nitric oxide. Ramsey et al. (1994) haveshown that administration of intravenous GTN to pregnantpatients with abnormally elevated uterine artery RI (> 0.6)and bilateral notching resulted in lowering of RI and PIwith no change in TAMV and no associated changes inheart rate, systemic blood pressure, or resistance indices inthe umbilical or maternal carotid artery. During GTNinfusion, 50% of uterine artery waveforms withdiscontinuous early diastole flow (A, D or D-II, D-III) wereconverted to continuous flow. Changes due to GTN weregreater than those caused by prostacyclin in the same study.
The use of organic nitrates as active vasodilators inclinical medicine dates back to 1847. Therapeuticallyadministered organic nitrates became the drugs of choicewhen nitrates were indicated. Tolerance is one of the mainproblems of nitrate use. After 12–14 h of continuousadministration, almost complete tolerance occurs. Thedrug must be discontinued for 12 h before the vasodilatoreffect is again observed within the coronary arteries.Tolerance to the vasodilator effect in the uterine arteries isnot as yet known.
Low-dose aspirin (ASA) began to be investigated as ameans of preventing pre-eclampsia in the mid 1980sbecause of its antiplatelet activity and because it decreasedthe synthesis of thromboxane A2 (Beaufils et al., 1985;Benigni et al., 1989; Uzan et al., 1994). The effect of ASAon uterine blood flow in patients with pre-eclampsia wasinvestigated by McParland et al. (1990) and Bower et al.(1996). A large multicentre collaborative study of ASA in

498 R.P.Dickey
pregnancy (CLASP, 1994) reached the conclusion thatthere was no significant reduction in the incidence ofpre-eclampsia, intrauterine growth retardation, stillbirth,or neonatal death. However, some centres with expertise inDoppler ultrasound diagnosis of pre-eclampsia reached theopposite conclusion. Bower et al. (1996), who participatedin the CLASP study, found that ASA reduced the incidenceof pre-eclampsia and severe eclampsia by ~50%. Theysuggested that ASA should be started earlier than 24 weeksto achieve maximum results. In a study of nulliparouspatients who had abnormal waveforms, there was nooverall difference in total adverse outcomes between 84patients who were untreated and 102 who were started on100 mg ASA daily beginning at 18 weeks. Although theincidence of pre-eclampsia was 4% in the treatment groupversus 11% in the placebo group, this was offset by a higherincidence of birth weight in the <10th centile (27 versus22%) and antepartum haemorrhage (4 versus 2%) in thetreatment group (Morris et al., 1996b).
In a study of hormone replacement for frozen embryoreplacement, patients with impaired uterine perfusion weregiven ASA, 150 or 300 mg, once daily starting from day13. The cancellation rate was lower (33 versus 48%) andthe pregnancy rate was higher (25 versus 15%) in patientsreceiving 300 mg, compared to 150 mg per day. In a secondphase, patients cancelled initially received ASA from thefirst day of hormonal replacement, with the result that 83%underwent replacement and 47% of these became pregnant(Wada et al., 1994).
None of the studies examined the effect of ASA on thespiral arteries. In a preliminary study from our clinic,Doppler ultrasound screening was performed during themid-luteal phase prior to IVF cycles. Patients withabnormal waveforms and elevated RI and PI were given300 mg ASA orally. Waveforms became continuous and RIand PI were notably reduced in 80% of patients 1–2 h afterASA administration.
Animal studies conducted with electromagnetic flowprobes in the 1970s demonstrated that ovine myometrialvasculature responded to very small doses of theα-adrenergic drugs epinephrine and norepinephrine byvasoconstriction, was resistant to α-adrenergic blockade,and responded to β-adrenergic stimulation with vasodi-lation (Greiss, 1972). The same studies found that ovineplacental vascularization was less sensitive to α-adrenergicstimulation and more sensitive to α blockade than uterinevasculature. They also established that the response ofmyometrial vasculature did not change, even in latepregnancy, indicating that myometrial vasculativeresponse to sympathetic neurohormone stimulation was
unaltered by the high concentrations of sex steroids thatoccur in pregnancy.
The β-adrenergic agents fenoterol and isoxsuprine arecommonly used in pregnancy as uterine relaxants. Theireffect on myometrial and intervillous blood flow wasstudied with intravenous 133Xe before the availability ofDoppler ultrasound (Kauppila et al., 1978). Fenoterol, butnot isoxsuprine, significantly increased myometrial bloodflow. Neither drug increased intervillous blood flow.Doppler ultrasound studies of the vasodilators nifedipine(Lindow et al., 1988) and atenolol (Montane et al., 1987)have shown that these drugs do not increase uterine bloodflow significantly. Vasoconstrictive drugs have beenshown to cause birth defects in animals by causingvasoconstriction of uterine vessels, but vasodilating drugsmay also cause birth defects (Danielsson et al., 1989). Thelatter are believed to act by a decrease in uteroplacentalblood flow caused by excessive hypotension.
In studies of other drugs, no significant changes werefound in uterine or umbilical artery blood flow followingmaternal betamethasone administration (Cohlen et al.,1996) or following methyldopa (Montan et al., 1993).During the oxytocin challenge tests, fetal heart ratedecelerations were associated with rapid and exaggeratedincreases in uterine and umbilical artery PI during uterinecontractions, but returned to resting levels during uterinerelaxation (Olofsson et al., 1996). Growth hormone andinsulin-like growth factor were shown to increase ovarianvascularization by Ryan and Mackis (1987).
Among anecdotal reports is that of Bonilla-Musoleset al. (1995), who reported that 100 mg of Paracetainol, ananti-inflammatory agent, caused immediate disappearanceof ovarian vascular flow, and that 600 mg per day Elorgan,a xanthine-type vasodilator, caused increased uterineartery blood flow in 60% of patients.
Conclusions
Doppler ultrasound measurement of uterine blood flowholds the promise of being as helpful for investigation ofinfertility and early pregnancy loss as Doppler analysis ofuterine and umbilical blood flow has been in the secondand third trimesters of pregnancy. This promise has not yetbeen fulfilled, in part due to the difficulty of interpretingblood flow measurements performed during the menstrualcycle and early pregnancy when diastolic blood flow isoften not continuous in uterine and spiral arteries. Lack offulfilment is also due, in part, to the fact that most studieshave measured only downstream impedance, which iscritical in the second and third trimesters, but may not be as

Doppler ultrasound study of uterine and ovarian blood flow 499
important in infertility and early pregnancy, and to the factthat studies have been performed only in the recumbentposition. Despite these limitations, the majority of studiesagree that implantation cannot occur when the mean (rightand left) uterine artery PI is ≥3.0–4.0 or diastolic flow is notcontinuous in at least one artery on the days of HCGadministration, oocyte retrieval, or embryo transfer in IVFand donor embryo cycles.
Investigation of ovarian blood flow has also provendisappointing, not allowing the predetermination of whichfollicles will produce oocytes capable of fertilization andimplantation, but it may soon help our understanding ofluteal insufficiency and the cause of poor oocyte quality inpolycystic ovaries. Even more intriguing is the possibilitythat ovarian blood flow studies may link intrafollicularhypoxia to errors of nondysjunction during meiosis.
Early pregnancy, insofar as uterine blood flow isconcerned, can be divided into two periods, i.e. before andafter the onset of maternal intervillous circulation, whichbegins, according to the most recent authorities, betweenthe 10th and 12th gestational weeks. Notable changesoccur during the 10th to 12th weeks in uterine artery RI, PI,mean velocity and flow volume. The 10th week coincideswith the end of embryological development, according toclassical embryology studies. Uterine blood flow duringthe earlier period is most like that in the mid to latefollicular phase of non-pregnant fertile women, whileuterine blood flow in the later period is more like that of thesecond or third trimester of pregnancy. It is interesting tospeculate that deficient uterine blood flow in the earlierperiod may lead to infertility and abortion, just as deficientblood flow in the later period can lead to intrauterinegrowth retardation in the baby and to hypertension in themother.
Additional Doppler investigations into physiologicaland pharmacological methods to improve uterine bloodflow in infertility and early pregnancy are clearly needed.Present pharmacological methods are limited to ASA,which has its own inherent side-effects, and to nitric oxidedonors, whose length of use is severely limited by rapiddevelopment of tolerance. Doppler ultrasound mayestablish a scientific basis for use of physiologicalmethods, such as bed rest and progesterone, in preventingabortion.
Doppler ultrasound measurement of uterine and ovarianblood flow is a relatively new technique. Its role in clinicalmedicine has still to be established for infertility and earlypregnancy. As more investigations are performed, asclinicians become familiar with its use, and asinstrumentation is improved, it may yet prove to be an
indispensable tool for clinical investigation of disorders ofoocyte development, implantation and early pregnancy.
References
Aleem, F.A. and Predanic, M. (1996) Transvaginal color Dopplerdetermination of the ovarian and uterine blood flow characteristics inpolycystic ovary disease. Fertil. Steril., 65, 510–516.
Alfirevic, Z. and Kurjak, A. (1990) Transvaginal color Doppler ultrasound innormal and abnormal early pregnancy. J. Perinatal Med., 18, 173–180.
American Institute of Ultrasound in Medicine (1993) Bioeffects and Safety ofDiagnostic Ultrasound. AIUM, Laurel, MD, p. 96.
Anderson, S., Hacksaw, B., Still, G. and Greiss, F. (1977) Uterine blood flowand its distribution after chronic estrogen and progesteroneadministration. Am. J. Obstet. Gynecol., 127, 138–142.
Anteby, E.Y., Hurwitz, A., Korach, O. et al. (1996) Human follicular nitricoxide pathway: relationship to follicular size, estradiol concentrations,and ovarian blood flow. Hum. Reprod., 11, 1947–1951.
Arduini, D. and Rizzo, G. (1991) Umbilical artery velocity waveforms inearly pregnancy: a transvaginal color Doppler study. J. Clin.Ultrasound, 12, 335–339.
Arduini, D., Rizzo, G. and Romanini, C. (1991) Doppler ultrasonography inearly pregnancy does not predict adverse outcome. Ultrasound Obstet.Gynecol., 1, 180–185.
Baker, A.R., Evans, D.H., Prytherch, D.R. et al. (1986) Some failings of thepulsatility index and damping factor. Ultrasound Med. Biol., 12,878–881.
Balakier, H. and Stronell, R.D. (1994) Color Doppler assessment offolliculogenesis in in vitro fertilization patients. Fertil. Steril., 62,1211–1216.
Barber, R.J., McSweeney, M.B., Gill, R.W. et al. (1988) Transvaginal pulsedDoppler ultrasound assessment of blood flow to the corpus luteum inIVF patients following embryo transfer. Br. J. Obstet. Gynaecol., 95,1226–1230.
Bassil, S., Magritte, J.P., Roth, J. et al. (1995) Uterine vascularity duringstimulation and its correlation with implantation in in vitro fertilization.Hum. Reprod., 10, 1497–1501.
Beaufils, M., Uzan, S., Donsimoni, R. and Colau, J.C. (1985) Prevention ofpreeclampsia by early antiplatelet therapy. Lancet, i, 840–842.
Benigni, A., Gregorini, G., Frusca, T. et al. (1989) Effect of low dose aspirinon fetal and maternal generation of thromboxane by platelets in womenat risk for pregnancy-induced hypertension. N. Engl. J. Med., 321,357–362.
Benirschke, K. and Kauffmann, P. (1990) Pathology of the Human Placenta,3rd edn. Springer Verlag, New York.
Bewley, S., Chang, T.C. and Campbell, S. (1993) Uteroplacental resistanceindex: analysis of intra- and interobserver variability. UltrasoundObstet. Gynecol., 3, 417–421.
Bland, J.M. and Altman, D.G. (1995) Calculating correlation coefficientswith repeated observations: Part I: Correlations with subjects. Br. Med.J., 310, 446.
Bonilla-Musoles, F., Ballester, M.J., Raga, R. et al. (1995) Transvaginalcolor Doppler sonography from folliculogensis to implantation: normaland abnormal evolution. Assist. Reprod. Rev., 5, 158–169.
Bourne, T.H., Jurkovic, D., Waterstone, J. et al. (1991) Intrafollicular bloodflow during human ovulation. Ultrasound Obstet. Gynecol., 1, 53–59.
Bourne, T.H., Hagstrom, H.G., Hahlin, M. et al. (1996) Ultrasound studies ofvascular and morphological changes in the human corpus luteum duringthe menstrual cycle. Fertil. Steril., 65, 753–758.
Bower, S.J., Harrington, K.F., Schuchter, K. et al. (1996) Prediction ofpreeclampsia by abnormal uterine Doppler ultrasound and modificationby aspirin. Br. J. Obstet. Gynaecol., 103, 625–629.
Bromely, B., Harlow, B.L., Laboda, L.A. and Benecerraf, B.R. (1988) Smallsac size in the first trimester: a predictor of poor fetal outcome.Radiology, 71, 81–83.
Cacciatore, B., Simberg, N., Fusaro, P. and Titinen, A. (1996) TransvaginalDoppler study of uterine artery blood flow in in vitrofertilization–embryo transfer cycles. Fertil. Steril., 66, 130–134.

500 R.P.Dickey
Cameron, J.T., Van Pependorp, C.L., Palmer, R.M.J. et al. (1993)Relationship between nitric oxide synthesis and increase in systolicblood pressure in women with hypertension in pregnancy. HypertensionPregnancy, 12, 85–92.
Campbell, S., Griffin, D.R., Pearce, J.M. et al. (1983) New Dopplertechnique for assessing uteroplacental blood flow. Lancet, 1, 675–677.
Campbell, S., Bourne, T.H., Waterstone, J. et al. (1993) Transvaginal colorblood flow imaging of the periovulatory follicle. Fertil. Steril., 60,433–438.
Chang, J.K., Roman, C. and Heymann, M.A. (1992) Effect ofendothelium-derived relaxing factor inhibition on the umbilical–placental circulation in fetal limbs in utero. Am. J. Obstet. Gynecol.,166, 727–734.
Chianchiano, N., Rossi, C., Bertolino, G. et al. (1991) Uteroplacental bloodflow in pregnant women with hypertension and recurrent spontaneousabortion. Acta Eur. Fertil., 22, 151–152.
Cicinelli, E., Ignarro, L.J., Lograno, M. et al. (1996) Circulating levels ofnitric oxide in fertility women in relation to the menstrual cycle. Fertil.Steril., 66, 1036–1038.
Clapp, J.F., McLaughlin, M.K., Larrow, R. et al. (1982) The uterinehemodynamic response to repetitive unilateral vascular embolization inthe pregnant ewe. Am. J. Obstet. Gynecol., 144, 309–318.
CLASP (Collaborative Low Dose Aspirin Study in Pregnancy)Collaborative Group (1994) A randomized trial of low-dose aspirin forthe prevention and treatment of preeclampsia among 9364 pregnantwomen. Lancet, 343, 619–629.
Cohlen, B.J., Stigter, R.H., Derks, J.B. et al. (1996) Absence of significanthemodynamic changes in the fetus following maternal betamethasoneadministration. Ultrasound Obstet. Gynecol., 7, 252–255.
Collins, W., Jurkovic, D., Bourne, T. et al. (1991) Ovarian morphology,endocrine function, and intra-follicular blood flow during theperiovulatory period. Hum. Reprod., 6, 319–324.
Colucci, W.S., Gimbrone, M.A., McLaughlin, M.K. et al. (1982) Increasedvascular catecholamine sensitivity and a-adrenergic receptor affinity infemale and estrogen-treated male rats. Circ. Res., 50, 805–811.
Coppens, M., Loquet, P., Kollen, M. et al. (1996) Longitudinal evaluation ofuteroplacental and umbilical blood flow changes in normal earlypregnancy. Ultrasound Obstet. Gynecol., 7, 114–121.
Coulam, C.B., Bustillo, M., Soenksen, D.M. and Britten, S.T. (1994)Ultrasonographic predictors of implantation after assisted reproduction.Fertil. Steril., 62, 1004–1010.
Csapo, A.I., Pulkkinen, M.O. and Kaihola, H.L. (1973) The effect ofestradiol replacement therapy on early pregnant lutectomized patients.Am. J. Obstet. Gynecol., 117, 987–990.
Danielsson, B.R., Reiland, S., Rundqvist, E. and Danielson, M. (1989)Digital defects induced by vasodilating agents: relationship to reductionin uteroplacental blood flow. Teratology, 40, 351–358.
Deichert, U. and Buurman, C. (1995) Transabdominal Doppler sonographicmeasurements of blood flow differences in the main pelvic arteriesduring physiological spontaneous ovarian cycles. Hum. Reprod., 10,1531–1536.
Den Ouden, M., Cohen-Overbeck, T.E. and Waldimiroff, J.W. (1990)Uterine and fetal umbilical artery flow velocity waveforms in normalfirst trimester pregnancies. Br. J. Obstet. Gynaecol., 97, 716–719.
Deutinger, J., Rudelstorfer, R. and Bernaschek, G. (1988)Vaginosonographic velocimetry of both main uterine arteries by visualvessel recognition and pulsed Doppler method during pregnancy. Am. J.Obstet. Gynecol., 159, 1072–1076.
Deutinger, J., Reinthaller, A. and Bernaschek, G. (1989) Transvaginal pulsedDoppler measures of blood flow velocity in the ovarian arteries duringcycle stimulation and after follicle puncture. Fertil. Steril., 51, 466–470.
de Ziegler, D., Bessis, R. and Frydman, R. (1991) Vascular resistance ofuterine arteries: physiological effects of estradiol and progesterone.Fertil. Steril., 55, 775–779.
Dickey, R.P. and Gasser, R.F. (1993) Ultrasound evidence for variability inthe size and development of normal human embryos before the tenthpostinsemination week after assisted reproductive technologies. Hum.Reprod., 8, 331–337.
Dickey, R.P. and Hower, J.F. (1995a) Ultrasonographic features of uterineblood flow during the first sixteen weeks of pregnancy. Hum Reprod,10, 2448–2452.
Dickey, R.P. and Hower, J.F. (1995b) Relationship of uterine blood flow tochorionic sac and embryo growth rates. Hum. Reprod., 10, 2676–2679.
Dickey, R.P. and Hower, J.F. (1995c) Effect of ovulation induction on uterineblood flow and oestradiol and progesterone concentrations in earlypregnancy. Hum. Reprod., 10, 2875–2879.
Dickey, R.P. and Hower, J.F. (1996) Relationship of estradiol andprogesterone levels to uterine blood flow during early pregnancy. EarlyPreg. Biol. Med., 2, 113–120.
Dickey, R.P., Carter, W.T., Besch, P.K. and Vorys, N. (1966) Relationship ofposture to estrogen excretion. Am. J. Obstet. Gynecol., 96, 127–130.
Dickey, R.P., Olar, T.T., Taylor, S.N. et al. (1991) Relationship of folliclenumber, serum estradiol, and other factors to birth rate and multiparity inhuman menopausal gonadotropin-induced intrauterine inseminationcycles. Fertil. Steril., 56, 89–92.
Dickey, R.P., Olar, T.T., Taylor, S.N. et al. (1992a) Relationship of folliclenumber and other factors to fecundability and multiple pregnancy inclomiphene citrate induced intrauterine insemination cycles. Fertil.Steril., 57, 613–619.
Dickey, R.P., Olar, T.T., Curole, D.N. et al. (1992b) Endometrial pattern andthickness associated with pregnancy outcome after assistedreproduction technologies. Hum. Reprod., 7, 418–421.
Dickey, R.P., Olar, T.T., Taylor, S.N. et al. (1992c) Relationship of smallgestational sac-crown rump difference to abortion and abortuskaryotypes. Obstet. Gynecol., 79, 554–557.
Dickey, R.P., Olar, T.T., Taylor, S.N. et al. (1993a) Relationship ofbiochemical pregnancy to preovulatory endometrial thickness andpattern in patients undergoing ovulation induction. Hum. Reprod., 8,327–330.
Dickey, R.P., Olar, T.T., Taylor, S.N. et al. (1993b) Relationship ofendometrial thickness and pattern to fecundity in ovulation inductioncycles: effect of clomiphene citrate alone and with human menopausalgonadotropin. Fertil. Steril., 59, 756–760.
Dickey, R.P., Olar, T.T., Taylor, S.N. et al. (1993c) Sequential clomiphenecitrate and human menopausal gonadotropin for ovulation induction:comparison to clomiphene citrate alone and human menopausalgonadotropin alone. Hum. Reprod., 8, 56–59.
Dickey, R.P., Hower, J.F., Matulich, E.M. and Brown, G.T. (1994) Effect ofstanding on non-pregnant uterine blood flow. Ultrasound Obstet.Gynecol., 4, 480–487.
Diket, A.L., Pierce, M.R., Munshi, U.K. et al. (1994) Nitric oxide inhibitioncauses intrauterine growth retardation and hind-limb disruptions in rats.Am. J. Obstet. Gynecol., 171, 1243–1250.
Duvekot, J.J. and Peeters, L.L.H. (1994) Maternal cardiovascularhemodynamic adaptation to pregnancy. Obstet. Gynecol. Surv. (Suppl.),49, 1–14.
Duvekot, J.J., Cheriex, E.C., Piters, F.A.A. et al. (1993) Early pregnancychanges in hemodynamics and volume homeostasis are consecutiveadjustments triggered by a primary fall in systemic vascular tone. Am. J.Obstet. Gynecol., 169, 1382–1392.
Farin, D., Kelly, N., Ryan, G. et al. (1995) In Copel, J.F. and Reed, K.L. (eds),Doppler Ultrasound in Obstetrics and Gynecology, Chapter 20. RavenPress, New York, pp. 187–197.
Favre, R., Bettahar, K., Grange, G. et al. (1993) Predictive value oftransvaginal uterine Doppler assessment in an in vitro fertilizationprogram. Ultrasound Obstet. Gynecol., 3, 350–353.
Fleischer, A., Schulman, H., Farmakides, G. et al. (1986) Uterine arteryDoppler velocimetry in pregnant women with hypertension. Am. J.Obstet. Gynecol., 154, 806–813.
Ford, S.P., Reynolds, L.P. and Farley, D.B. (1984) Interaction of ovariansteroids and periarterial alpha-1-adrenergic receptors in altering uterineblood flow during the estrous cycle of gilts. Am. J. Obstet. Gynecol.,150, 480–484.
Fujino, Y., Ito, F., Matuoka, I. et al. (1993) Pulsatility index of uterine arteryin pregnancy and non-pregnant women. Hum. Reprod., 8, 1126–1128.
Furchgott, R.F. and Zawadski, J.V. (1980) The obligatory role of endothelialcells in the relaxation of arterial smooth muscle by acetylcholine.Nature, 288, 373–376.
Gant, N.F., Chand, S. and Worley, R.T. (1974) A clinical test useful forpredicting the development of acute hypertension in pregnancy. Am. J.Obstet. Gynecol., 120, 1–7.

Doppler ultrasound study of uterine and ovarian blood flow 501
Gerretsen, G., Huisjes, H.J. and Elema, J.D. (1981) Morphological changesof the spiral arteries in the placental bed in relation to preeclampsia andfetal growth retardation. Br. J. Obstet. Gynaecol., 88, 876–881.
Ghosh, D., De, P. and Sengupta, J. (1994) Luteal phase ovarian oestrogen isnot essential for implantation and maintenance of pregnancy fromsurrogate embryo transfer in the rhesus monkey. Hum. Reprod., 9,629–637.
Gilligan, D.M., Badar, D.M., Panza, J.A. et al. (1994) Acute effects ofestrogen in postmenopausal women. Circulation, 90, 786–791.
Glock, J.L. and Brumsted, J.R. (1995) Color flow pulsed Doppler ultrasoundin diagnosing luteal phase defect. Fertil. Steril., 64, 500–504.
Gosling, R.G., Dunbar, G., King, D.H. et al. (1971) The quantitative analysisof occlusive peripheral arterial disease by a non-intrusive ultrasonictechnique. Angiology, 22, 52–55.
Gosling, R.G., Lo, P.T.S. and Taylor, M.G. (1991) Interpretation ofpulsatility index in feeder arteries to low impedance vascular beds.Ultrasound Obstet. Gynecol., 1, 175–179.
Goswamy, R.K. and Steptoe, R.P. (1988) Doppler ultrasound studies of theuterine artery in spontaneous ovarian cycles. Hum. Reprod., 3, 721–726.
Goswamy, R.K., Williams, G. and Steptoe, P.C. (1988) Decreased uterineperfusion—a cause of infertility. Hum. Reprod., 3, 955–959.
Greiss, F.C. (1972) Differential reactivity of the myoendometrial andplacental vasculatures: adrenergic responses. Am. J. Obstet. Gynecol.,112, 20–30.
Guanes, P.P., Remohi, J., Gallardo, E. et al. (1996) Age does not affectuterine resistance to vascular flow in patients undergoing oocytedonation. Fertil. Steril., 66, 265–270.
Guirgis, R.R., Alshawaf, T., Dave, R. and Craft, I.L. (1993) Transvaginalcrown–rump measurements of 224 successful pregnancies whichresulted from gamete intrafallopian transfer or in vitro fertilization.Hum. Reprod., 8, 1933–1937.
Harrington, K.F., Campbell, S., Bewley, S. and Brower, S. (1991) Dopplervelocimetry studies of the uterine artery in the early prediction ofpreeclampsia and intrauterine growth retardation. Eur. J. Obstet.Gynaecol., Reprod. Biol., 42, S14–S20.
Harrington, K., Cooper, D., Lees, C. et al. (1996) Doppler ultrasound of theuterine artery: the importance of bilateral notching in the prediction ofpreeclampsia, placental abruption, or delivery of a small for gestationalage baby. Ultrasound Obstet. Gynecol., 7, 182–188.
Hertig, A.T. and Livingstone, R.G. (1944) Spontaneous, threatened, andhabitual abortion: their pathogenesis and treatment. N. Engl. J. Med.,230, 797–806.
Hillard, T.C., Bourne, T.H., Whitehead, M.I. et al. (1992) Differential effectsof transdermal estradiol and sequential progestins of impedance to flowwithin the uterine arteries of postmenopausal women. Fertil. Steril., 58,959–963.
Hull, A.D., White, C.R. and Pearce, W.J. (1994) Endothelium-derivedrelaxing factor and cyclic GMP-dependent vasorelaxation in humanchorionic plate arteries. Placenta, 15, 365–375.
Hustin, J. (1995) Vascular physiology and pathophysiology of earlypregnancy. In Vourne, T., Jauniaux, E. and Jurkovic, D. (eds),Transvaginal Colour Doppler, Springer-Verlag, Heidelberg, pp. 47–56.
Hustin, J. and Schaaps, J.P. (1987) Echographic and anatomic studies of thematernotrophoblastic border during the first trimester of pregnancy. Am.J. Obstet. Gynecol., 157, 162–168.
Hustin, J., Schaaps, J.P. and Lambotte, R. (1988) Anatomical studies of theutero-placental vascularization in the first trimester of pregnancy.Trophoblast. Res., 3, 49–60.
Hustin, J., Jauniaux, E. and Schaaps, J.P. (1990) Histological study of thematerno-embryonic interface in spontaneous abortion. Placenta, 11,477–486.
Ignarro, L.J., Buga, G.M., Wood, K.S. et al. (1987) Endothelium-derivedrelaxing factor produced and released from artery and vein is nitricoxide. Proc. Natl. Acad. Sci. USA, 84, 9265–9269.
Jacobson, S.L., Imhof, R., Manning, N. et al. (1990) The value of Dopplerassessment of the uteroplacental circulation in predicting preeclampsiaor intrauterine growth retardation. Am. J. Obstet. Gynecol., 162,110–114.
Jaffe, R. and Warsof, S.L. (1991) Transvaginal color Doppler imaging in theassessment of uteroplacental blood flow in the normal first trimesterpregnancy. Am. J. Obstet. Gynecol., 164, 781–785.
Jaffe, R. and Warsof, S.L. (1992) Color Doppler imaging in the assessmentof the uteroplacental blood flow in abnormal first trimester intrauterinepregnancies: an attempt to define etiologic mechanisms. J. UltrasoundMed., 11, 41–44.
Jaffe, R. and Woods, J.R. (1993) Color Doppler imaging and in vivoassessment of the anatomy and physiology of the early uteroplacentalcirculation. Fertil. Steril., 60, 293–297.
Jaffe, R. and Woods, J.R. (1996) Doppler velocimetry of intraplacental fetalvessels in the second trimester: improving the prediction of pregnancycomplications in high-risk patients. Ultrasound Obstet. Gynecol., n,262–266.
Jaffe, R., Dorgan, A. and Abramowicz, J.S. (1995) Color Doppler imaging ofthe uteroplacental circulation in the first trimester: value in predictingpregnancy failure or complication. Am. J. Roentgenol., 164,1255–1258.
Jauniaux, E. (1996) Intervillous circulation in the first trimester: the phantomof the color Doppler obstetric opera. Ultrasound Obstet. Gynecol., 8,71–76.
Jauniaux, E., Burton, G.J., Moscoso, G.J. and Hustin, J. (1991a)Development of the early human placenta: a morphometric study.Placenta, 12, 269–276.
Jauniaux, E., Jurkovic, D. and Campbell, S. (1991b) In vivo investigations ofanatomy and the physiology of early human placental circulation.Ultrasound Obstet. Gynecol., 1, 435–445.
Jauniaux, E., Jurkovic, D., Delogne-Desnock, J. and Meuris, S. (1992a)Influence of human chorionic gonadotropin, oestradiol andprogesterone on uteroplacental and corpus luteum blood flow in normalearly pregnancy. Hum. Reprod., 7, 1467–1473.
Jauniaux, E., Jurkovic, D., Campbell, S. and Hustin, J. (1992b) Dopplerultrasonographic features of the developing placental circulation:correlation with anatomic findings. Am. J. Obstet. Gynecol., 166,585–587.
Jauniaux, E., Johnson, M.R., Jurkovic, D. et al. (1994a) The role of relaxin inthe development of the uteroplacental circulation in early pregnancy.Obstet. Gynecol., 84, 338–342.
Jauniaux, E., Zaidi, J., Jurkovic, D. et al. (1994b) Comparison of colorDoppler features and pathological findings in complicated earlypregnancy. Hum. Reprod., 12, 2432–2437.
Jiang, C., Sarrel, P.M., Lindsay, D.C. et al. (1991) Endothelium-independentrelaxation of rabbit coronary artery by 17β oestradiol in vitro. Br. J.Pharmacol., 104, 1033–1037.
Jurkovic, D., Jauniaux, E., Kurjak, A. et al. (1991) Transvaginal colorDoppler assessment of the uteroplacental circulation in early pregnancy.Obstet. Gynecol., 77, 365–369.
Kauppila, A., Kuikka, J. and Tuimala, R. (1978) Effect of fenoterol andisoxsuprine on myometrial and intervillous blood flow during latepregnancy. Obstet. Gynecol., 52, 558–562.
Kauppila, A., Koskinem, M., Puolakka, J. et al. (1980) Decreasedintervillous and unchanged myometrial blood flow in supinerecumbancy. Obstet. Gynecol., 55, 203–205.
Kay, H.H., Carroll, B.B., Dahmus, M. and Killam, A.P. (1991) Sonographicmeasurements with umbilical and uterine artery Doppler analysis insuspected intrauterine growth retardation. J. Reprod. Med., 36, 65–68.
Kharitonov, S.A., Logan-Sinclair, R.B., Busset, C.M. and Shinebourne, E.A.(1994) Peal expiratory nitric oxide difference in men and women:relation to the menstrual cycle. Br. Heart J., 72, 243–245.
Khong, T.Y., Liddell, H.S. and Robertson, W.B. (1987) Defectivehaemochorioal placentation as a cause of miscarriage. A preliminarystudy. Br. J. Obstet. Gynaecol., 94, 649–655.
Kremkau, W. (1990) Doppler Ultrasound: Principles and Instruments. W.B.Saunders, Philadelphia, London.
Kupesic, S. and Kurjak, A. (1993) Uterine and ovarian perfusion during theperiovulatory period assessed by transvaginal color Doppler. Fertil.Steril., 60, 439–443.
Kurjak, A., Kupesic-Urek, S., Schulman, H. and Zalud, I. (1991)Transvaginal color flow Doppler in the assessment of ovarian anduterine blood flow in infertile women. Fertil. Steril., 56, 870–873.
Kurjak, A., Crvenkovic, G., Salihagic, A. et al. (1993) The assessment ofnormal early pregnancy by transvaginal color Doppler ultrasonography.J. Clin. Ultrasound, 21, 3–8.

502 R.P.Dickey
Levi-Setti, P.E., Rognoni, G., Bozzo, M. et al. (1995) Color Dopplervelocimetry of uterine arteries in pregnant and nonpregnant patientsduring multiovulation induction for IVF. J. Assist. Reprod. Genet., 12,413–417.
Lindhard, J. (1913) Arch. Physiol., 30, 395–397. Cited in Vorys, N., Ullery, J.and Hanusek, G. (1961) The cardiac output changes in various positionsin pregnancy. Am. J. Obstet. Gynecol., 82, 1312–1321.
Lindow, S.W., Davies, N., Davey, D.A. and Smith, J.A. (1988) The effect ofsublingual nifedipine on uteroplacental blood flow in hypertensivepregnancy. Br. J. Obstet. Gynaecol., 95, 1276–1281.
Long, M.G., Boultbee, J.E., Hanson, M.E. and Begent, R.H.J. (1989)Doppler time velocity waveform studies of the uterine artery and uterus.Br. J. Obstet. Gynaecol., 96, 588–593.
Magness, R.R. and Rosenfeld, C.R. (1989) Local and systemicestradiol-17β: effects on uterine and systemic vasodilation. Am. J.Physiol., 256, 536–542.
Magness, R.R., Parker, C.R. and Rosenfeld, C.R. (1993) Systemic anduterine responses to chronic infusion of estradiol-17β. Am. J. Physiol.,265, E690–E698.
Maini, C.L., Galli, G., Bellati, U. et al. (1985) Non-invasive radioisotopicevaluation of placental blood flow. Obstet. Gynecol. Invest., 19,196–206.
Marsh, M.S., Bourne, T.H., Whitehead, M.I. et al. (1994) The temporaleffect of progesterone on uterine artery pulsatility index inpostmenopausal women receiving sequential hormone replacementtherapy. Fertil. Steril., 62, 771–774.
Maulik, D. (1993) Hemodynamic interpretation of the arterial Dopplerwaveform. Ultrasound Obstet. Gynecol., 3, 219–227.
McParland, P., Pearce, J.M. and Chamberlain, G.V.P. (1990) Dopplerultrasound and aspirin in recognition and prevention of pregnancyinduced hypertension. Lancet, 335, 1552–1555.
Meekins, J.W., Pijnenborg, R., Hanssens, M. et al. (1994) A study ofplacental bed spiral arteries and trophoblast invasion in normal andsevere preeclamptic pregnancies. Br. J. Obstet. Gynecol., 101, 669–674.
Merce, L., Barco, M.J. and Bau, S. (1996) Color Doppler sonographicassessment of placental circulation in the first trimester of normalpregnancy. J. Ultrasound Med., 15, 135–142.
Meyer, M.C., Brayden, J.E. and McLaughlin, M. (1993) Characteristics ofvascular smooth muscle in the maternal resistance circulation duringpregnancy in the rat. Am. J. Obstet. Gynecol., 169, 1510–1516.
Miles, R.D., Menke, J.A., Bashiru, M. and Colliver, J.A. (1987)Relationships of five Doppler measures with flow in an in vitro modeland clinical findings in newborn infants. J. Ultrasound Med., 6,597–599.
Miller, V.M. and Vanhoutte, P.M. (1990) 17β-Estradiol augmentsendothelium-dependent contractions to arachidonic acid in rabbit aorta.Am. J. Physiol., 258, 1502–1507.
Molnar, M., Suto, T., Toth, T. and Hertelendy, F. (1994) Prolonged blockadeof nitric oxide synthesis in gravid rats produces sustained hypertension,proteinuria, thrombocytopenia, and intrauterine growth retardation. Am.J. Obstet. Gynecol., 170, 1458–1466.
Moncada, S., Palmer, R.M.J. and Higgs, E.A. (1991) Nitric oxide:physiology, pathophysiology and pharmacology. Pharmacol. Rev., 43,109–142.
Montan, S., Liedholm, H., Lingman, G. et al. (1987) Fetal and uteroplacentalhaemodynamics during short term atenolol treatment of hypertension inpregnancy. Br. J. Obstet. Gynaecol., 94, 312–317.
Montan, S., Anandakumar, C., Arulkumaran, S. et al. (1993) Effects ofmethyldopa on uteroplacental and fetal hemodynamics in pregnancyinduced hypertension. Am. J. Obstet. Gynecol., 168, 152–156.
Morris, N., Osborn, S.B., Wright, H.P. and Hart, A. (1956) Effective uterineblood flow during exercise in normal and preeclamptic pregnancies.Lancet, ii, 481–484.
Morris, N.H., Eaton, B.M. and Dekker, G. (1996a) Nitric oxide, theendothelium, pregnancy, and preeclampsia. Br. J. Obstet. Gynaecol.,103, 4–15.
Morris, J.M., Fay, R.A., Ellwood, D.A. et al. (1996b) A randomizedcontrolled trial of aspirin in patients with abnormal uterine artery bloodflow. Obstet. Gynecol., 87, 74–78.
Murakoshi, T., Sekizuka, N., Takakuwa, H. et al. (1996) Uterine and spiralartery flow velocity waveforms in pregnancy-induced hypertension
and/or intrauterine growth retardation. Ultrasound Obstet. Gynecol., 7,122–128.
Myatt, L., Brewer, A.S., Langdon, G. and Brockman, D. (1992) Attenuationof the vasoconstrictor effects of the thromboxane and endothelin bynitric oxide in the human fetal placental circulation. Am. J. Obstet.Gynecol., 166, 224–230.
Nargund, G., Bourne, T., Doyle, P. et al. (1996) Associations betweenultrasound indices of follicular blood flow, oocyte recovery, andpreimplantation embryo quality. Hum. Reprod., 11, 109–113.
Nazari, A., Check, J.H., Epstein, R.H. et al. (1991) Relationship of small fordates sac size to crown-rump length and spontaneous abortion inpatients with a known date of ovulation. Obstet. Gynecol., 78, 369–373.
Nishimura, H., Takano, K., Tanimura, T. and Yasuda, M. (1968) Normal andabnormal development of human embryos: first report of the analysis of1,213 intact embryos. Teratology, 1, 281–290.
North, R.A., Ferrier, C., Long, D. et al. (1994) Uterine artery Doppler flowvelocity waveforms in the second trimester for the prediction ofpreeclampsia and fetal growth retardation. Obstet. Gynecol., 83,378–386.
Olofsson, P., Thuring-Jonsson, A. and Marsal, K. (1996) Uterine andumbilical circulation during the oxytocin challenge test. UltrasoundObstet. Gynecol., 7, 247–251.
O’Rahilly, R. and Muller, F. (eds) (1987) Developmental Stages in HumanEmbryos. Meriden-Stienhour Press, Merident, CT.
Oyesanya, O.A., Parsons, J.H., Collins, W.P. and Campbell, S. (1996)Prediction of oocyte recovery rate by transvaginal ultrasonography andcolor Doppler imaging before human chorionic gonadotropinadministration in in vitro fertilization cycles. Fertil. Steril., 65, 806–809.
Palmer, R.M.J., Ferrige, A.G. and Moncada, S. (1987) Nitric oxide releasedaccounts for the biological activity of endothelium-derived relaxingfactor. Nature, 327, 524–526.
Pearce, J.M., Campbell, S., Cohen-Overbeek, T. et al. (1988) Referencesranges and sources of variation for indices of pulsed Doppler flowvelocity waveforms from the uteroplacental and fetal circulation. Br. J.Obstet. Gynaecol., 95, 248–256.
Pedersen, J.F. and Molsted-Pedersen, L. (1981) Early fetal growth delaydetected by ultrasound marks increased risk of congenital malformationin diabetic pregnancy. Br. Med. J., 283, 269–271.
Penotti, M., Memcioni, T., Gabrielli, L. et al. (1993) Blood flow variations ininternal carotid and middle cerebral arteries induced by postmenopausalhormone replacement therapy. Am. J. Obstet. Gynecol., 169,1226–1232.
Perrot-Applanat, M., Groyer-Picard, M.T., Garcia, E. et al. (1988)Immunocytochemical demonstration of estrogen and progesteronereceptors in muscle cells of uterine arteries in rabbits and humans.Endocrinology, 123, 1511–1519.
Planiol, T., Pourcelot, L. and Pottier, J.M. (1972) Etude de la circulationcarotidienne par les methodes ultrasongigues de la thermographie. Rev.Neurol., 126, 127–141.
Pourcelot, L. (1974) Applications clinique de pexamen Dopplertranscutance. In Pourcelot, L. (ed.), Belocimetric Ultrasonore Doppler.INSERM, Paris, p. 213.
Powis, R.L. and Schwartz, R.A. (1991) Practical Doppler Ultrasound forthe Clinician, Williams and Wilkins, Baltimore, MD, p. 187.
Ramsay, B., De Belder, A., Campbell, S. et al. (1994) A nitric oxide donorimproves uterine artery diastolic blood flow in normal early pregnancyand in women at high risk of preeclampsia. Eur. J. Clin. Invest., 24,76–78.
Ramsay, B., Johnson, M.R., Leone, A.M. and Steer, P.J. (1995) The effect ofexogenous oestrogen on nitric oxide production in women: a placebocontrolled crossover study. Br. J. Obstet. Gynaecol., 102, 417–319.
Robertson, D.M., Mester, J. and Kellie, A.E. (1971) The measurement ofoestradiol and progesterone in plasma from normal, infertile, andclomiphene treated women. Acta Endocrinol., 68, 523–533.
Rossavik, I.K., Torjusen, G.O. and Gibbons, W.E. (1988) Conceptual ageand ultrasound measurements of gestational sac and crown-rump lengthin in vitro fertilization pregnancies. Fertil. Steril., 49, 1012–1017.
Ryan, K.J. and Mackis, A. (1987) Significance of angiogenic and growthfactors in ovarian follicle development. Adv. Exp. Med. Biol., 219,203–209.
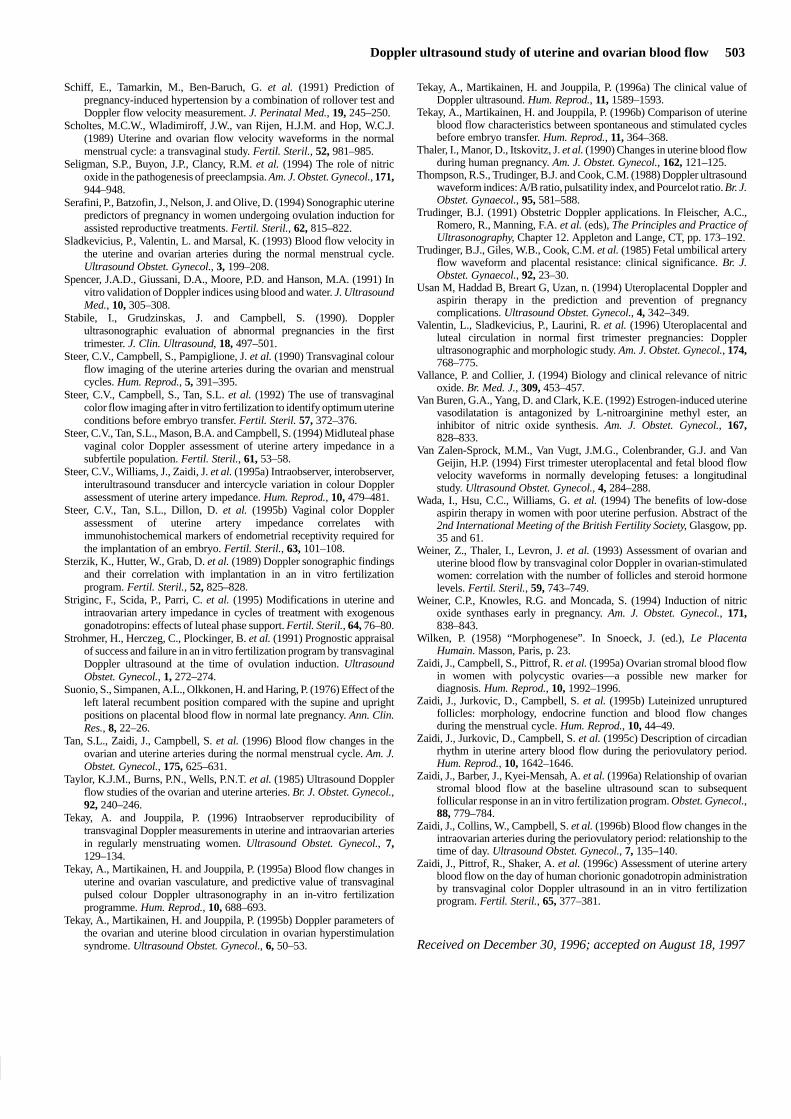
Doppler ultrasound study of uterine and ovarian blood flow 503
Schiff, E., Tamarkin, M., Ben-Baruch, G. et al. (1991) Prediction ofpregnancy-induced hypertension by a combination of rollover test andDoppler flow velocity measurement. J. Perinatal Med., 19, 245–250.
Scholtes, M.C.W., Wladimiroff, J.W., van Rijen, H.J.M. and Hop, W.C.J.(1989) Uterine and ovarian flow velocity waveforms in the normalmenstrual cycle: a transvaginal study. Fertil. Steril., 52, 981–985.
Seligman, S.P., Buyon, J.P., Clancy, R.M. et al. (1994) The role of nitricoxide in the pathogenesis of preeclampsia. Am. J. Obstet. Gynecol., 171,944–948.
Serafini, P., Batzofin, J., Nelson, J. and Olive, D. (1994) Sonographic uterinepredictors of pregnancy in women undergoing ovulation induction forassisted reproductive treatments. Fertil. Steril., 62, 815–822.
Sladkevicius, P., Valentin, L. and Marsal, K. (1993) Blood flow velocity inthe uterine and ovarian arteries during the normal menstrual cycle.Ultrasound Obstet. Gynecol., 3, 199–208.
Spencer, J.A.D., Giussani, D.A., Moore, P.D. and Hanson, M.A. (1991) Invitro validation of Doppler indices using blood and water. J. UltrasoundMed., 10, 305–308.
Stabile, I., Grudzinskas, J. and Campbell, S. (1990). Dopplerultrasonographic evaluation of abnormal pregnancies in the firsttrimester. J. Clin. Ultrasound, 18, 497–501.
Steer, C.V., Campbell, S., Pampiglione, J. et al. (1990) Transvaginal colourflow imaging of the uterine arteries during the ovarian and menstrualcycles. Hum. Reprod., 5, 391–395.
Steer, C.V., Campbell, S., Tan, S.L. et al. (1992) The use of transvaginalcolor flow imaging after in vitro fertilization to identify optimum uterineconditions before embryo transfer. Fertil. Steril. 57, 372–376.
Steer, C.V., Tan, S.L., Mason, B.A. and Campbell, S. (1994) Midluteal phasevaginal color Doppler assessment of uterine artery impedance in asubfertile population. Fertil. Steril., 61, 53–58.
Steer, C.V., Williams, J., Zaidi, J. et al. (1995a) Intraobserver, interobserver,interultrasound transducer and intercycle variation in colour Dopplerassessment of uterine artery impedance. Hum. Reprod., 10, 479–481.
Steer, C.V., Tan, S.L., Dillon, D. et al. (1995b) Vaginal color Dopplerassessment of uterine artery impedance correlates withimmunohistochemical markers of endometrial receptivity required forthe implantation of an embryo. Fertil. Steril., 63, 101–108.
Sterzik, K., Hutter, W., Grab, D. et al. (1989) Doppler sonographic findingsand their correlation with implantation in an in vitro fertilizationprogram. Fertil. Steril., 52, 825–828.
Striginc, F., Scida, P., Parri, C. et al. (1995) Modifications in uterine andintraovarian artery impedance in cycles of treatment with exogenousgonadotropins: effects of luteal phase support. Fertil. Steril., 64, 76–80.
Strohmer, H., Herczeg, C., Plockinger, B. et al. (1991) Prognostic appraisalof success and failure in an in vitro fertilization program by transvaginalDoppler ultrasound at the time of ovulation induction. UltrasoundObstet. Gynecol., 1, 272–274.
Suonio, S., Simpanen, A.L., Olkkonen, H. and Haring, P. (1976) Effect of theleft lateral recumbent position compared with the supine and uprightpositions on placental blood flow in normal late pregnancy. Ann. Clin.Res., 8, 22–26.
Tan, S.L., Zaidi, J., Campbell, S. et al. (1996) Blood flow changes in theovarian and uterine arteries during the normal menstrual cycle. Am. J.Obstet. Gynecol., 175, 625–631.
Taylor, K.J.M., Burns, P.N., Wells, P.N.T. et al. (1985) Ultrasound Dopplerflow studies of the ovarian and uterine arteries. Br. J. Obstet. Gynecol.,92, 240–246.
Tekay, A. and Jouppila, P. (1996) Intraobserver reproducibility oftransvaginal Doppler measurements in uterine and intraovarian arteriesin regularly menstruating women. Ultrasound Obstet. Gynecol., 7,129–134.
Tekay, A., Martikainen, H. and Jouppila, P. (1995a) Blood flow changes inuterine and ovarian vasculature, and predictive value of transvaginalpulsed colour Doppler ultrasonography in an in-vitro fertilizationprogramme. Hum. Reprod., 10, 688–693.
Tekay, A., Martikainen, H. and Jouppila, P. (1995b) Doppler parameters ofthe ovarian and uterine blood circulation in ovarian hyperstimulationsyndrome. Ultrasound Obstet. Gynecol., 6, 50–53.
Tekay, A., Martikainen, H. and Jouppila, P. (1996a) The clinical value ofDoppler ultrasound. Hum. Reprod., 11, 1589–1593.
Tekay, A., Martikainen, H. and Jouppila, P. (1996b) Comparison of uterineblood flow characteristics between spontaneous and stimulated cyclesbefore embryo transfer. Hum. Reprod., 11, 364–368.
Thaler, I., Manor, D., Itskovitz, J. et al. (1990) Changes in uterine blood flowduring human pregnancy. Am. J. Obstet. Gynecol., 162, 121–125.
Thompson, R.S., Trudinger, B.J. and Cook, C.M. (1988) Doppler ultrasoundwaveform indices: A/B ratio, pulsatility index, and Pourcelot ratio. Br. J.Obstet. Gynaecol., 95, 581–588.
Trudinger, B.J. (1991) Obstetric Doppler applications. In Fleischer, A.C.,Romero, R., Manning, F.A. et al. (eds), The Principles and Practice ofUltrasonography, Chapter 12. Appleton and Lange, CT, pp. 173–192.
Trudinger, B.J., Giles, W.B., Cook, C.M. et al. (1985) Fetal umbilical arteryflow waveform and placental resistance: clinical significance. Br. J.Obstet. Gynaecol., 92, 23–30.
Usan M, Haddad B, Breart G, Uzan, n. (1994) Uteroplacental Doppler andaspirin therapy in the prediction and prevention of pregnancycomplications. Ultrasound Obstet. Gynecol., 4, 342–349.
Valentin, L., Sladkevicius, P., Laurini, R. et al. (1996) Uteroplacental andluteal circulation in normal first trimester pregnancies: Dopplerultrasonographic and morphologic study. Am. J. Obstet. Gynecol., 174,768–775.
Vallance, P. and Collier, J. (1994) Biology and clinical relevance of nitricoxide. Br. Med. J., 309, 453–457.
Van Buren, G.A., Yang, D. and Clark, K.E. (1992) Estrogen-induced uterinevasodilatation is antagonized by L-nitroarginine methyl ester, aninhibitor of nitric oxide synthesis. Am. J. Obstet. Gynecol., 167,828–833.
Van Zalen-Sprock, M.M., Van Vugt, J.M.G., Colenbrander, G.J. and VanGeijin, H.P. (1994) First trimester uteroplacental and fetal blood flowvelocity waveforms in normally developing fetuses: a longitudinalstudy. Ultrasound Obstet. Gynecol., 4, 284–288.
Wada, I., Hsu, C.C., Williams, G. et al. (1994) The benefits of low-doseaspirin therapy in women with poor uterine perfusion. Abstract of the2nd International Meeting of the British Fertility Society, Glasgow, pp.35 and 61.
Weiner, Z., Thaler, I., Levron, J. et al. (1993) Assessment of ovarian anduterine blood flow by transvaginal color Doppler in ovarian-stimulatedwomen: correlation with the number of follicles and steroid hormonelevels. Fertil. Steril., 59, 743–749.
Weiner, C.P., Knowles, R.G. and Moncada, S. (1994) Induction of nitricoxide synthases early in pregnancy. Am. J. Obstet. Gynecol., 171,838–843.
Wilken, P. (1958) “Morphogenese”. In Snoeck, J. (ed.), Le PlacentaHumain. Masson, Paris, p. 23.
Zaidi, J., Campbell, S., Pittrof, R. et al. (1995a) Ovarian stromal blood flowin women with polycystic ovaries—a possible new marker fordiagnosis. Hum. Reprod., 10, 1992–1996.
Zaidi, J., Jurkovic, D., Campbell, S. et al. (1995b) Luteinized unrupturedfollicles: morphology, endocrine function and blood flow changesduring the menstrual cycle. Hum. Reprod., 10, 44–49.
Zaidi, J., Jurkovic, D., Campbell, S. et al. (1995c) Description of circadianrhythm in uterine artery blood flow during the periovulatory period.Hum. Reprod., 10, 1642–1646.
Zaidi, J., Barber, J., Kyei-Mensah, A. et al. (1996a) Relationship of ovarianstromal blood flow at the baseline ultrasound scan to subsequentfollicular response in an in vitro fertilization program. Obstet. Gynecol.,88, 779–784.
Zaidi, J., Collins, W., Campbell, S. et al. (1996b) Blood flow changes in theintraovarian arteries during the periovulatory period: relationship to thetime of day. Ultrasound Obstet. Gynecol., 7, 135–140.
Zaidi, J., Pittrof, R., Shaker, A. et al. (1996c) Assessment of uterine arteryblood flow on the day of human chorionic gonadotropin administrationby transvaginal color Doppler ultrasound in an in vitro fertilizationprogram. Fertil. Steril., 65, 377–381.
Received on December 30, 1996; accepted on August 18, 1997