European Interest in US Options
17
European Interest in US Options: Factors Driving Renewed Demand Andy Nybo V11:041 | September 2013 | www.tabbgroup.com
Transcript of European Interest in US Options

European Interest in US Options: Factors Driving Renewed Demand
Andy Nybo V11:041 | September 2013 | www.tabbgroup.com

2013 The Tabb Group, LLC. All Rights Reserved. May not be reproduced by any means without express permission. | 1
European Interest in US Options: Factors Driving Renewed Demand | September 2013
Vision European investors face a number of challenges when using listed options within trading strategies. Liquidity in most European exchange-traded markets remains anemic with little liquidity displayed in public order books. Institutional investors generally trade options using the liquidity in upstairs markets with most institutional trading matched by brokers and brought to exchanges for clearing. European investors are also partial to OTC equity-linked markets to access capital willingly provided by dealers. However, new regulatory initiatives such as MiFID, EMIR and Basel III will force much of this activity to shift to exchange-traded instruments in both European and international markets. Given the regulatory framework and lack of publicly displayed liquidity, European investors are turning to US markets to explore the use of options for hedging and managing exposure. Demand originates from a broad range of investor segments, including traditional asset managers such as mutual funds, pension funds, hedge funds, proprietary trading accounts and private wealth managers. Larger institutional investors find US listed options markets can effectively support broad-based hedging strategies since funds are able to trade in size and enter and exit positions more efficiently with low trading costs and minimal slippage in their execution prices. In its 2011 report “European Demand for US Listed Options,” TABB Group found that European investors accounted for 10% of the total options volume but based on recent conversations with sell side firms, buy side institutions and technology vendors, we believe the proportion will continue to increase as US market performance remains strong and attracts assets from European portfolio managers. There are many reasons that US listed options are attractive to European investors. In addition to demand for an instrument that can allow for efficient hedging and exposure, ease of access is a clear factor driving demand. For most European investors, US options markets are a phone call away, with access through their existing prime broker relationships in Europe or via electronic trading through direct market access platforms provided by many brokers and vendors. Larger European investors with measurable activity will contact US-based options sales and trading desks directly by phone during US market hours. Hedging strategies are seeing particularly strong growth, as large fund managers seek to use US index options to manage risk exposures of underlying holdings. European portfolio managers are not just hedging underlying US equity holdings. Portfolio managers are turning to US options markets to hedge broad portfolios of equity holdings that may include non-US equities. Although the US option may not be perfectly correlated to the underlying position, the ability to use an option with deep liquidity is preferable to using an illiquid European option that may be better correlated to the portfolio.

2013 The Tabb Group, LLC. All Rights Reserved. May not be reproduced by any means without express permission. | 2
European Interest in US Options: Factors Driving Renewed Demand | September 2013
Table of Contents
VISION ......................................................................................................................................................... 1
TABLE OF CONTENTS ............................................................................................................................. 2
INTRODUCTION ........................................................................................................................................ 3
EUROPEAN DEMAND FOR US EQUITY EXPOSURE ......................................... 3 ACCESS AND ORDER CHANNELS ............................................................ 4
APPEAL OF US OPTIONS MARKETS .................................................................................................... 6
SOURCES OF LIQUIDITY ...................................................................... 6
US MARKET STRUCTURE ....................................................................................................................... 8
MARKET STRUCTURE EVOLUTION ........................................................... 8 THE NEED FOR TECHNOLOGY ................................................................ 9 EXCHANGE COMPETITION DRIVING MARKET COMPLEXITY .............................. 9 CUSTOMER PRIORITY IN US MARKETS .................................................... 11
REGULATORY CONSIDERATIONS ..................................................................................................... 13
CONCLUSION .......................................................................................................................................... 14
ABOUT ....................................................................................................................................................... 15
TABB GROUP................................................................................. 15 THE AUTHOR .................................................................................. 15

2013 The Tabb Group, LLC. All Rights Reserved. May not be reproduced by any means without express permission. | 3
European Interest in US Options: Factors Driving Renewed Demand | September 2013
Introduction A broad range of factors drives the use of US options by European investors, including the scope of their assets under management, the strategies they use to manage exposure and the need to quickly and efficiently execute those strategies. Investors are attracted to US options markets for their depth and breadth of liquidity, especially large global investors with diversified portfolios who use derivatives markets to manage risk. Investors generally only need to establish an account relationship with a broker dealer that has a clearing membership with OCC, the central clearing house for the US equity options markets. The ability to use options in hedging strategies around large global portfolios is a key driver for many European institutional investors’ use of options in US markets. Not only are they able to deploy these strategies in size across major index options, but liquidity is also significant across single stock and ETF options. The role of volatility exposure is also increasingly driving the decision to trade in US options markets, especially in VIX futures and options products that provide direct exposure to volatility. Part of the trading decision necessarily revolves around access, as the need to enter and exit a position with minimal slippage and trading costs can dramatically impact returns. These factors oftentimes outweigh the need to directly correlate a hedge or position with underlying portfolios. Portfolio managers seeking to enter or exit large positions are not always able to access liquidity in Europe’s listed options markets and are often unable to use OTC markets to enter a position; instead, they will use US options to create an admittedly imperfect hedge. The depth of liquidity in many US index options products is much greater than comparable broad index options markets in Europe. For example, in 2012, the $24.9 trillion in notional value traded in the S&P 500 index option (SPX) was more than double the $10.8 trillion notional value traded in the Euro Stox 50 Index. And when combined with ease of access, many investors turn to US markets for their activities (see Exhibit 1).
European Demand for US Equity Exposure
European investors are increasing their exposure to US equity markets, especially as market performance and the emergence of the US from the Great Recession have attracted investor attention from around the world. Further, as the level of US equities in portfolios has risen over the past several years, so has their use of options. European investors held $1.9 trillion in US equities as of June 2012, a 75% increase from the $1.1 trillion in assets at mid-year 2009. As
Exhibit 1
Value of Trading in Selected US and European Listed Options
$0.2
$0.9
$1.5
$1.6
$1.9
$2.2
$2.6
$10.8
$24.9
CBOE Volatility Index (VIX)
OTC European Equity Linked Forwards and Swaps
Russell 2000 Index (RUT)
FTSE 100
OTC European Equity Linked Options
NASDAQ 100 Index
DAX
Euro Stox 50
S&P 500 Index Options (SPX)
European Listed Options
OTC Equity Linked Instruments (Outstanding at June 2012)
US Listed Options
$US Trillions
Source: BIS, Exchanges, Futures Industry Association, TABB
Group estimates

2013 The Tabb Group, LLC. All Rights Reserved. May not be reproduced by any means without express permission. | 4
European Interest in US Options: Factors Driving Renewed Demand | September 2013
would be expected, many of these assets are domiciled in larger financial centers, including the United Kingdom, Luxembourg and Switzerland (see Exhibits 2 and 3).
Exhibits 2 and 3 European Holdings of US Equity Assets: 2003 to 2012/Holdings by Country of Domicile
29
11
12
15
21
22
37
70
79
108
120
124
151
263
292
495
All other
Jersey
Finland
Italy
Guernsey
Belgium
Denmark
Sweden
Germany
Ireland
France
Norway
Netherlands
Switzerland
Luxembourg
United Kingdom
Total US Equity Holdings by European CountryTotal = $US 1.9 trillion(as of June 30, 2012)
All amounts in $US billions
Source: US Treasury Department
Access and Order Channels
The options strategies used by European institutional investors are similar to US institutions. Traditional asset managers tend to be more conservative, using options to hedge exposures and manage portfolio risk, while hedge funds are more aggressive, using options to manage exposures around corporate events, to take directional exposures and as part of stock replication strategies. Strategies often dictate how European institutions access US options markets. Although investors face relatively few challenges when trading in those markets, the choice of order channel is dependent on the relative experience of the institution, the types of options traded and the strategies employed by the investor. Institutions trading in smaller sizes using directional strategies are more likely to trade through low touch, electronic channels. Firms looking to hedge large portfolios with large options trades use high touch channels and full service brokers to access capital and facilitate the larger notional value of the trade. European accounts depend on brokers to manage the complexity of US markets. Although they are gradually using more electronic tools to directly access US markets, the nature of their trading activity tends to favor the use of brokers based in New York and Chicago who can provide the support necessary to manage larger orders through the use of capital as well as their expertise in navigating the complexity of the US options market structure (see Exhibit 4).
$0.8
$1.1$1.1
$1.3
$1.6
$1.4
$1.1
$1.3
$1.8$1.9$ US Trillions

2013 The Tabb Group, LLC. All Rights Reserved. May not be reproduced by any means without express permission. | 5
European Interest in US Options: Factors Driving Renewed Demand | September 2013
Exhibit 4 US Options Market Participants and Structure
Voice/Instant MessageFIX
Electronic/DMA
Options Exchanges
InstitutionalInvestors
RetailInvestors
VoiceElectronic/
DMA
Clearing Facility
Broker-Dealer OCC Clearing Member
Floor Brokers
Market Makers
Automated/Black Box
Orders Quotes
Post-TradeReports Matched
Trades
Source: TABB Group

2013 The Tabb Group, LLC. All Rights Reserved. May not be reproduced by any means without express permission. | 6
European Interest in US Options: Factors Driving Renewed Demand | September 2013
Appeal of US Options Markets US options markets are revered worldwide for deep liquidity, broad investor participation and market structures that encourage market makers to provide liquidity. Bid/ask spreads are narrow and the number of contracts available for trading is substantial, especially for more actively traded options with near month expirations. Part of this is due to the broad end-user base contributing to liquidity but trading is also significantly enhanced through the support of options market makers that provide two-sided markets across exchanges. The confluence of order flow has created a marketplace with significant depth of book and liquidity, narrow spreads, and large amounts of open interest (see Exhibit 5).
Sources of Liquidity
Liquidity in US options markets results not only from institutional investors, but also from broker dealers managing risk exposures, proprietary trading accounts and retail investors using options to hedge and take directional views. End users account for most trading in US options markets, with TABB Group estimating that institutions, retail investors and broker dealer firms trading for their own account contribute 52% of total trading activity. It is the presence of options market makers, however, that is the biggest factor contributing to US options market quality. Market Makers. In many US listed options markets, designated market makers provide liquidity through bids/offers to buy/sell securities. Market makers are willing to provide this liquidity due to incentives provided by exchanges that encourage participation. In return for quoting obligations and, in certain instances, membership fees paid to the exchanges, market makers receive lower execution fees, are able to quote using more powerful technology and can be designated as lead market makers in selected products in which they have more opportunity to interact with order flow. Market makers do not represent customer orders on exchanges; instead, they post bids/offers to buy/sell options and trade on their own behalf using firm capital. Market makers pay lower execution fees on exchanges that are often scaled, based on volume. In addition, they have preferential mass quoting capabilities which allow them to quickly disseminate large volumes of quotes into and out of the market. Institutions. Institutional investors such as asset managers and hedge funds account for a growing proportion of options trading in US markets. Although hedge funds have been active participants in US option markets, traditional asset managers represent one of the fastest growing segments of
Exhibit 5 US Options Market Metrics
Source: OCC, Hanweck Associates, TABB Group
US Options Market Metrics
Annual trading volume (2012) 4.1 billion contracts
Average daily trading volume in 2013(as of 8/30/13)
16.4 million contracts
Average Trade Size (as of 8/30/13)
14.8 contracts
Average Trade Value(as of 8/30/13)
$3,966
Open Interest (as of 8/30/13)Equity optionsIndex options
292.0 million contracts269.2 million contracts22.8 million contracts

2013 The Tabb Group, LLC. All Rights Reserved. May not be reproduced by any means without express permission. | 7
European Interest in US Options: Factors Driving Renewed Demand | September 2013
the institutional investment community as they are increasingly using options to improve returns and better manage risk. Retail investors. Retail investors have long been an active participant in US options markets but have been eclipsed by institutional investors as the largest investor component of US options markets. Part of this demand is cultural, as many US investors actively manage their own portfolios of investments. Online brokers have been aggressive in supporting the needs of retail investors and have focused significant resources on developing tools to support options strategies within their front ends and web portals. In addition, the options industry actively promotes the use of options through educational programs targeted at retail investors. Proprietary Trading Firms. There has also been rising participation from proprietary trading firms using their own capital to trade in US options markets. Although they use many of the same strategies and employ technology similar to that of market makers, most exchanges limit their ability to quote and they generally pay higher execution fees on exchanges. They also differ from market makers in that they are not required to provide two-sided markets and can opportunistically quote when they perceive a trading opportunity. Exhibit 6 illustrates participation by segment in US options markets.
Exhibit 6
Participation in US Options Markets by Segment in 2012
Market makers
48%
Hedge funds23%
Retail investors
16%
Asset managers
13%
Source: TABB Group estimates

2013 The Tabb Group, LLC. All Rights Reserved. May not be reproduced by any means without express permission. | 8
European Interest in US Options: Factors Driving Renewed Demand | September 2013
US Market Structure
US listed options markets are among the largest and most liquid derivatives markets in the world, with participation from a broad cross section of domestic and international investors contributing to its deep liquidity and growth. Trading volume averages more than 16 million contracts a day, with total volume on track to reach 4.2 billion contracts in 2013, second only to the record 4.6 billion contracts traded in 2011. Since 2000, options volume has increased at a compound annual growth rate of 18%. Not only has trading volume remained strong over the past decade but, as of the end of August, open interest was close to record levels, exceeded only by 2010 and 2011 year-end levels. Given the continued debate around QE2 and US federal debt levels, open interest is expected to exceed these levels in the fourth quarter of 2013 (see Exhibits 7 and 8). Exhibits 7 and 8 US Listed Options Trading Volume and Open Interest
2000 to 2013:Aug
6882
93
122150
182
219
266
236257
282 277
246269
13 Year CAGR
10%
US Equity Options Open Interest
Millions of contracts
Source: OCC
Market Structure Evolution
The rapid industry growth has not come without challenges. US options market structure is complex, with the US now counting 12 different options exchanges competing for order flow. The diverse exchange landscape provides both benefits and challenges to market participants. Competition has fostered innovation, increased the use of technology, lowered trading costs and promoted the introduction of new products. The result is a highly competitive market with low transaction costs and an efficient, albeit complex, market structure. The basis of the rapid development of US options markets can be primarily attributed to the clearing framework created in 1973 when the Securities and Exchange Commission approved OCC as the clearinghouse for all listed US equity options. This created the framework for exchange competition as all non-proprietary contracts can be traded on any of the 12 exchanges and be cleared through OCC. This fungibility allows exchanges to innovate through market models, trading protocols and pricing, thereby creating significant competition for order flow.
0.7 0.8 0.8 0.91.2
1.5
2.0
2.9
3.6 3.63.9
4.6
4.04.2
13 Year CAGR
18%
US Listed Options Volume
Millions of contracts

2013 The Tabb Group, LLC. All Rights Reserved. May not be reproduced by any means without express permission. | 9
European Interest in US Options: Factors Driving Renewed Demand | September 2013
The Need for Technology
Technology innovation has contributed to intense competition in the exchange landscape. The battle was effectively launched by the International Securities Exchange (ISE) when it rolled out the first all electronic exchange in 2000. The efficiencies in the market model quickly built liquidity and forced competing exchanges to adapt or risk losing market share. The need for technology was reinforced when penny increments were introduced by the SEC under the Penny Pilot program in 2007. Although implemented for 13 symbols in the first phase, the Pilot has since been expanded to include more than 350 of the most actively traded underlying securities. The issues in the Pilot have specified trading increments of 1 cent for options trading under $3 and 5 cents for options priced $3 and over. As pricing increments decreased, the use of technology and faster trading models became critical, especially for market makers that needed to effectively quote across the growing number of exchanges. In 2010, technology became even more critical following the introduction of multi-exchange listed options with weekly expirations. The short expirations and trading volumes accounting for more than 20% of daily volumes required exchanges, market makers and brokers to support the product’s success.
The greater adoption of technology has created its own set of challenges. A number of recent technology failures have led the options industry and regulators to reexamine the underlying technical infrastructure of the industry. As volume and trading velocity increase, the level of quote messaging traffic has seen exponential growth. And with 12 exchanges, trading issues on one exchange can quickly cascade onto competing exchanges. Market participants are also concerned with the level of resiliency within exchange infrastructures, as well as the ability of the industry to continue to manage rising message rates. In September, the SEC directed the options exchanges to identify structural deficiencies and potential points of failures in order to prevent future outages.
Exchange Competition Driving Market Complexity
The downside of increased competition among the exchanges has been the creation of a complex market structure with considerable fragmentation of liquidity. Intense competition for order flow among the 12 options exchanges has contributed to the complexity of the US options market structure landscape. The constantly shifting exchange landscape challenges market participants, who must dedicate significant levels of resources to remain abreast of new trading protocols and mechanisms being introduced on a nearly constant basis. Perhaps the greatest burden lies with market makers who must manage their activity on each respective exchange, a challenge that becomes even greater for market makers active on multiple exchanges. The complexity has reinforced the need for market makers to use technology to support activities, contributing to the automation of markets. Each exchange operates using different market models, fee structures and trading rules. The goal of the exchanges is simple; they are seeking to attract order flow by constantly tweaking fees and rebates for executions on their exchange. There are two fundamental market models used by US options exchanges: pro rata allocation and price-time priority. Although exchanges experiment with and often combine the market models, the general logic within each remains consistent.

2013 The Tabb Group, LLC. All Rights Reserved. May not be reproduced by any means without express permission. | 10
European Interest in US Options: Factors Driving Renewed Demand | September 2013
The pro rata market model incentivizes options market makers to quote larger size at the top of the book in order to receive a greater share of any resulting trade. Although percentage allocations may vary by exchange, traditional pro rata allocations award as much as 40% of an order to the market makers participating at the best bid or offer. These allocations are generally seconded to any customer orders, which typically receive priority allocations under the pro rata market model. The price-time priority market model awards trading interest on a strict price-time basis. The highest price level entered first into the market interacts with any contra-interest. A number of exchanges also allow for price improvement through hidden and discretionary orders that are not displayed in public markets but are executed when contra-orders match the discretionary price. Market share among exchanges tends to fluctuate over time based on these fee and trading rule changes, with significant shifts occurring since 2000 when technology became an integral part of the market (see Exhibit 10).
Exhibit 10 US Options Exchange Market Share: Jan-00 to Aug-13
0%
10%
20%
30%
40%
50%
60%
70%
80%
90%
100%
OMX PHLX
NYSE Arca
NSDQ
NOBO
MIAX
ISE
GEM
C2
CBOE
BOX
BATS
AMEX
Source: OCC/TABB Group
2013 The Tabb Group, LLC. All Rights Reserved. May not be reproduced by any means without express permission. | 11
European Interest in US Options: Factors Driving Renewed Demand | September 2013
Customer Priority in US Markets
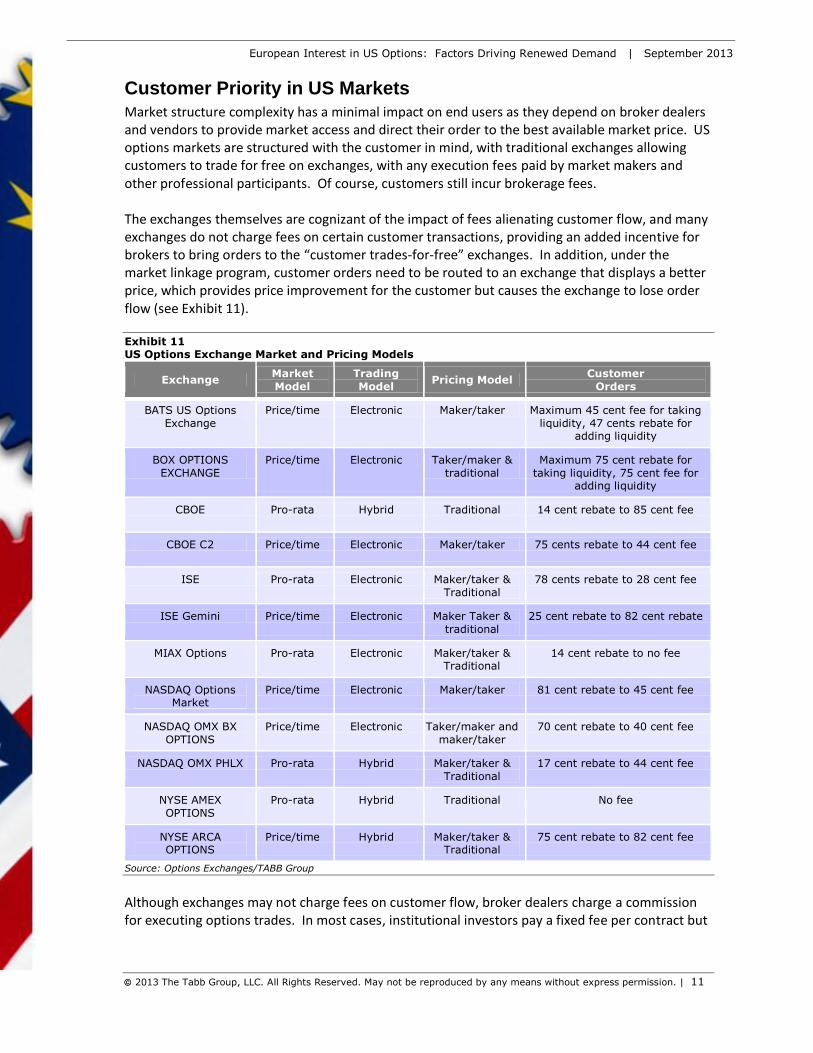
Market structure complexity has a minimal impact on end users as they depend on broker dealers and vendors to provide market access and direct their order to the best available market price. US options markets are structured with the customer in mind, with traditional exchanges allowing customers to trade for free on exchanges, with any execution fees paid by market makers and other professional participants. Of course, customers still incur brokerage fees. The exchanges themselves are cognizant of the impact of fees alienating customer flow, and many exchanges do not charge fees on certain customer transactions, providing an added incentive for brokers to bring orders to the “customer trades-for-free” exchanges. In addition, under the market linkage program, customer orders need to be routed to an exchange that displays a better price, which provides price improvement for the customer but causes the exchange to lose order flow (see Exhibit 11). Exhibit 11 US Options Exchange Market and Pricing Models
Exchange Market
Model
Trading
Model Pricing Model
Customer
Orders
BATS US Options
Exchange
Price/time Electronic Maker/taker Maximum 45 cent fee for taking
liquidity, 47 cents rebate for adding liquidity
BOX OPTIONS
EXCHANGE
Price/time Electronic Taker/maker &
traditional
Maximum 75 cent rebate for
taking liquidity, 75 cent fee for adding liquidity
CBOE Pro-rata Hybrid Traditional 14 cent rebate to 85 cent fee
CBOE C2 Price/time Electronic Maker/taker 75 cents rebate to 44 cent fee
ISE Pro-rata Electronic Maker/taker &
Traditional
78 cents rebate to 28 cent fee
ISE Gemini Price/time Electronic Maker Taker &
traditional
25 cent rebate to 82 cent rebate
MIAX Options Pro-rata Electronic Maker/taker & Traditional
14 cent rebate to no fee
NASDAQ Options Market
Price/time Electronic Maker/taker 81 cent rebate to 45 cent fee
NASDAQ OMX BX
OPTIONS
Price/time Electronic Taker/maker and
maker/taker
70 cent rebate to 40 cent fee
NASDAQ OMX PHLX Pro-rata Hybrid Maker/taker &
Traditional
17 cent rebate to 44 cent fee
NYSE AMEX
OPTIONS
Pro-rata Hybrid Traditional No fee
NYSE ARCA OPTIONS
Price/time Hybrid Maker/taker & Traditional
75 cent rebate to 82 cent fee
Source: Options Exchanges/TABB Group
Although exchanges may not charge fees on customer flow, broker dealers charge a commission for executing options trades. In most cases, institutional investors pay a fixed fee per contract but

2013 The Tabb Group, LLC. All Rights Reserved. May not be reproduced by any means without express permission. | 12
European Interest in US Options: Factors Driving Renewed Demand | September 2013
for certain high volume accounts, brokers will often use a ‘cost plus’ model that charges customers a clearing fee but also passes through exchange rebates and fees to customers. A number of exchanges also categorize customers into professional and public customer segments based on trading activity. Once a customer exceeds a certain number of trades and/or orders a day, they are classified as a professional customer and are subject to higher fees for executions on the exchange. Public customer orders, however, are generally not charged fees by exchanges. They are subject to broker commissions, which are negotiated with brokers and vary considerably by type of option, price of the option contract, volume of trading and whether the trade is conducted electronically or over the phone.
2013 The Tabb Group, LLC. All Rights Reserved. May not be reproduced by any means without express permission. | 13
European Interest in US Options: Factors Driving Renewed Demand | September 2013
Regulatory Considerations There are relatively few regulatory impediments to European investors wishing to access US listed options. Somewhat perversely, it is the regulatory environment in Europe that is contributing to demand for US options as many new regulations are causing investors to look at foreign markets as an alternative to more heavily taxed jurisdictions. The recent introduction of financial transaction taxes (FTT) in Italy and France, as well as new regulations around high frequency trading in Germany, are causing investors to hesitate as they try to better understand the implications of the new regulations on trading activities. The uncertainty surrounding the potential impact has pushed investors to the sidelines as they evaluate the impact on market liquidity, especially on more active trading accounts that will feel the heaviest burden from the tax. As trading volumes have declined in the immediate aftermath of the FTT’s implementation, investors are fearful that market quality will continue to deteriorate and their ability to move into and out of positions in a market with much wider spreads will have untenable costs. For example, although overall European volumes increased in the first half of 2013, France has seen a continued decline in trading volumes. France’s market share of 20.73% ahead of the FTT declined to 12.78% after implementation. Investors will continue to avoid these markets until the dust settles and the full impact of the FTT can be evaluated. In Germany, new rules around high frequency trading (HFT) strategies are increasing costs for more active trading accounts and are causing firms to look outside of domestic markets for more attractive opportunities. The new rules require banks and investment firms employing HFT strategies to be authorized and licensed by the Federal Financial Supervisory Authority (BaFin). The higher costs associated with reporting and registration makes it prohibitive for smaller firms using HFT strategies to comply with the new rules. Firms domiciled in the impacted jurisdictions may have little choice as to where and what they can trade without being subject to the new regulations but investors located in unaffected jurisdictions are quickly turning to other markets with less onerous tax burdens. Investors looking to US options as alternatives face minimal obstacles, with the biggest issues related to internal compliance requirements and having necessary relationships with US broker dealers that are members of the OCC. One regulatory initiative that did threaten to impede demand was the Foreign Account Tax Compliance Act (FATCA) enacted by the US in 2010. The Act was intended to ensure that income earned by US investors in foreign accounts was reported to the US Internal Revenue Service. Although FATCA does not directly impact foreign investors, it does require brokerage firms to collect significant information from clients trading US assets. The concern was that many accounts would be unwilling to share the information and would seek to use non-US alternative investments. These fears have so far proved to be unfounded and have had little impact on demand.

2013 The Tabb Group, LLC. All Rights Reserved. May not be reproduced by any means without express permission. | 14
European Interest in US Options: Factors Driving Renewed Demand | September 2013
Conclusion Demand for US options remains strong from European investors. Although ease of access is one factor contributing to this demand, it is the deep liquidity, transparency and market quality that continues to attract the interest of European portfolio managers. The ability to use options in hedging strategies around large global portfolios is a key driver for many European institutional investors’ use of options in US markets. Not only are they able to deploy these strategies in size across major index options but liquidity is also significant across single stock and ETF options. The rising demand is occurring at the same time investors are adding to their portfolios of US equities. Since 2009, holdings of US equity securities have grown 21% annually to a total $1.9 trillion. And given the continued rise in US equity market valuations, European flows into US equity markets are expected to see continued growth in 2013 as well. The increase in equity assets under management will drive further demand from European investors as they hedge portfolios and use premium strategies to earn additional yield. Although US options markets have seen considerable growth over the past decade, one by-product of that growth has been increased complexity. US options market structure is complex, with the US now counting 12 different options exchanges competing for order flow. Although this competition fosters innovation, it also has created a marketplace with diverse trading rules that can be challenging for market participants, a challenge that is solved through the services of brokers that manage the complexity and provide seamless access to exchanges. The appeal of US options markets remains strong both to US and international investors. The deep liquidity, price transparency and broad investor participation provide considerable appeal to institutional investors. As global equity markets recover from the 2008 financial crisis, US options markets will continue to play an important role in strategies to manage risk and directional exposures.

2013 The Tabb Group, LLC. All Rights Reserved. May not be reproduced by any means without express permission. | 15
European Interest in US Options: Factors Driving Renewed Demand | September 2013
About
TABB Group
TABB Group is a financial markets research and strategic advisory firm focused exclusively on
capital markets. Founded in 2003 and based on the methodology of first-person knowledge, TABB
Group analyzes and quantifies the investing value chain from the fiduciary, investment manager,
broker, exchange and custodian. Our goal is to help senior business leaders gain a truer
understanding of financial markets issues and trends so they can grow their business. TABB Group
members are regularly cited in the press and speak at industry conferences. For more information
about TABB Group, go to www.tabbgroup.com
The Author
Andy Nybo Andy Nybo has more than 25 years of experience in research and technology applications in the
global capital markets, and is a Principal and Head of Derivatives at TABB Group. Currently
focusing his research efforts on the OTC and listed equity derivatives markets, examining how
technology is playing an increasingly integral role on both the buy-side and sell-side desktops, he
has written the following TABB Group studies: “US Options Trading 2013: Looking for the Edge,”
“US Options Market Making 2013: Scale, Scope and Survival,” “US Options Trading 2012: Standing
Out in the Crowd,” “Processing Complexity: Back Office Challenges of Listed Derivatives,”
“Innovations in Accessing Asia: Listed Equity Derivatives & Delta One Products,” and “Accelerated
Expirations: The Growing Relevance of Short Term Options.”

2013 The Tabb Group, LLC. All Rights Reserved. May not be reproduced by any means without express permission. | 16
European Interest in US Options: Factors Driving Renewed Demand | September 2013
www.tabbgroup.com
Westborough, MA
+1.508.836.2031
New York
+1.646.722.7800
London +44 (0) 203 207 9027