European HRC
19
European HRC prices at a 5-year low – factors suppressing a recovery Marina Maliushkina June 18 th , 2015 From US to Europe: 2015 Steel Market Update
-
Upload
marinamaliushkina -
Category
Economy & Finance
-
view
42 -
download
0
Transcript of European HRC
European HRC prices at a 5-year low – factors suppressing a recovery
Marina Maliushkina June 18th, 2015
From US to Europe: 2015 Steel Market Update
This document does not constitute an offer or solicitation to buy or sell any investment product(s). It does not take into account the specific investment objectives, financial situation or particular needs of any person. Investors should seek advice from a financial adviser before investing in any investment products or adopting any investment strategies. In the event that the investor chooses not to seek advice from a financial adviser, he/she should consider whether the product in question is suitable for him/her. The investment product(s) discussed herein are subject to significant investment risks, including the possible loss of the principal amount invested. Past performance of investment products is not necessarily a guide to future performance.
Unless expressly stated, we do not make any representations nor give any warranties in respect of the information contained in this presentation. To the extent permitted by the applicable law, we hereby exclude all warranties, conditions, representations or duties whatsoever and howsoever arising (whether express or implied) including but not limited to any representations or warranties as to the ownership of intellectual property or other rights in the presentation, or the satisfactory quality, merchantability or fitness for a particular purpose of, any goods or services referred to at any time in this presentation, any express or statutory warranties, and any warranties or duties regarding accuracy, timeliness, completeness, performance, availability, lack of negligence or of workmanlike effort.
To the fullest extent allowed by applicable law, you agree that we will not be liable to you or your business under any circumstances whatsoever (whether in contract, negligence or any other tort, breach of statutory duty or otherwise) for any loss of profits, income, business interruption, loss of business information or for increase in any costs, liabilities or expenses or any other loss whatsoever and however arising directly or indirectly out of or in connection with or relating to the information in this presentation and we shall not be liable for any loss, damages, costs, expenses or other liability which you incur or suffer as a result of your use of the information in this presentation.
We take all such steps as are reasonably necessary to provide information that is accurate and reliable, but exclude to the fullest extent permitted by law any liability for the inaccuracy of the information in this report.
The Steel Index (TSI) used all reasonable endeavours to certify the correctness of the information contained in this presentation.
Without limiting the above, you acknowledge and agree that we shall not be liable for matters beyond our reasonable control including but not limited to information gathered during field visits, third party information presented or the acts of third parties.
You understand and expressly agree that use of the information presented here is at your sole risk, that any content, material and/or data presented or verbalised or otherwise obtained through your use of the information in this presentation is at your own discretion and risk and that you will be solely responsible for any damage to you personally or your company or organization or business associates whatsoever which in any way results from the use, reliance or application of such content material and/or data and/or information.
All INFORMATION PRESENTED IN THIS REPORT IS AGREED TO BE CONFIDENTIAL AND CANNOT BE REPRODUCED WITHOUT THE EXPRESSED PERMISSION OF THE STEEL INDEX
Disclaimer

Introduction to TSI
Impartial organisation focused on compiling prices for ferrous metal products
Founded in in 2006 as subsidiary of the Steel Business Briefing (SBB) Group, acquired by Platts in July 2011
Continues to operate under TSI brand as a separate unit within Platts, part of McGraw-Hill Financial
Data-driven methodology using transaction data to calculate volume-weighted price indices
TSI “Data Providers” submit spot transaction data to TSI under confidentiality agreement; physical market participants only (over 600 registered today)
Submission direct to TSI database through secure on-line channel
Data normalised and “cleaned” before volume-weighted averages calculated for the day or week
TSI is a specialist price information service

European HR Coil Prices
Source: TSI
HRC Prices: Downward Trend
EUR/tonne
• Persistent declining price trend
• Affected by weak raw materials prices, subdued demand, pressure from imports
360
380
400
420
440
460
480 N. Europe S. Europe
€415/t €405/t
€391/t €376/t

European HR Coil Prices
Source: TSI
Low Price Volatility
EUR/tonne
94
100
58
24
92
86
57
29
2012 2013 2014 2015 YTD360
380
400
420
440
460
480
500
520
540
560
580 S. Europe HRC N. Europe HRC
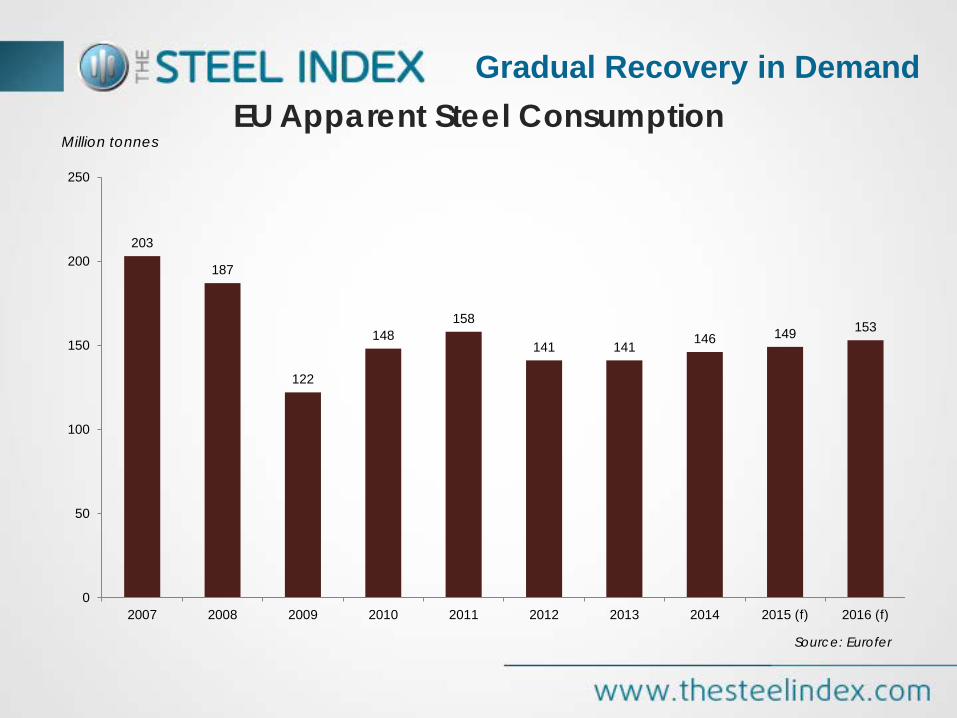
Source: Eurofer
Gradual Recovery in Demand EU Apparent Steel Consumption
Million tonnes
203
187
122
148 158
141 141 146 149 153
0
50
100
150
200
250
2007 2008 2009 2010 2011 2012 2013 2014 2015 (f) 2016 (f)
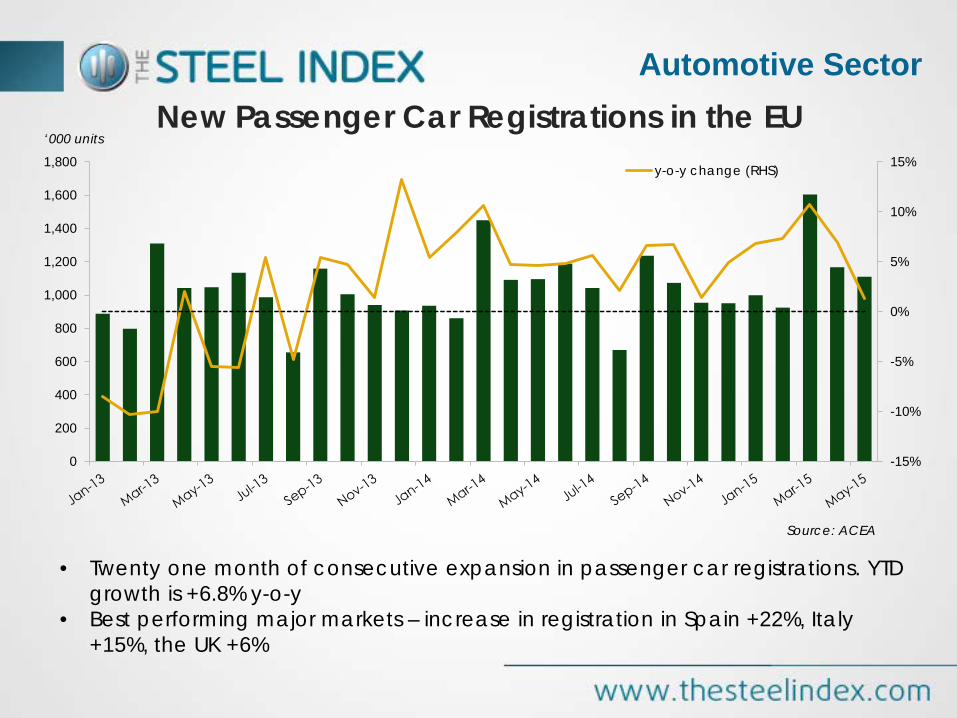
New Passenger Car Registrations in the EU Automotive Sector
Source: ACEA
‘000 units
-15%
-10%
-5%
0%
5%
10%
15%
0
200
400
600
800
1,000
1,200
1,400
1,600
1,800 y-o-y change (RHS)
• Twenty one month of consecutive expansion in passenger car registrations. YTD growth is +6.8% y-o-y
• Best performing major markets – increase in registration in Spain +22%, Italy +15%, the UK +6%
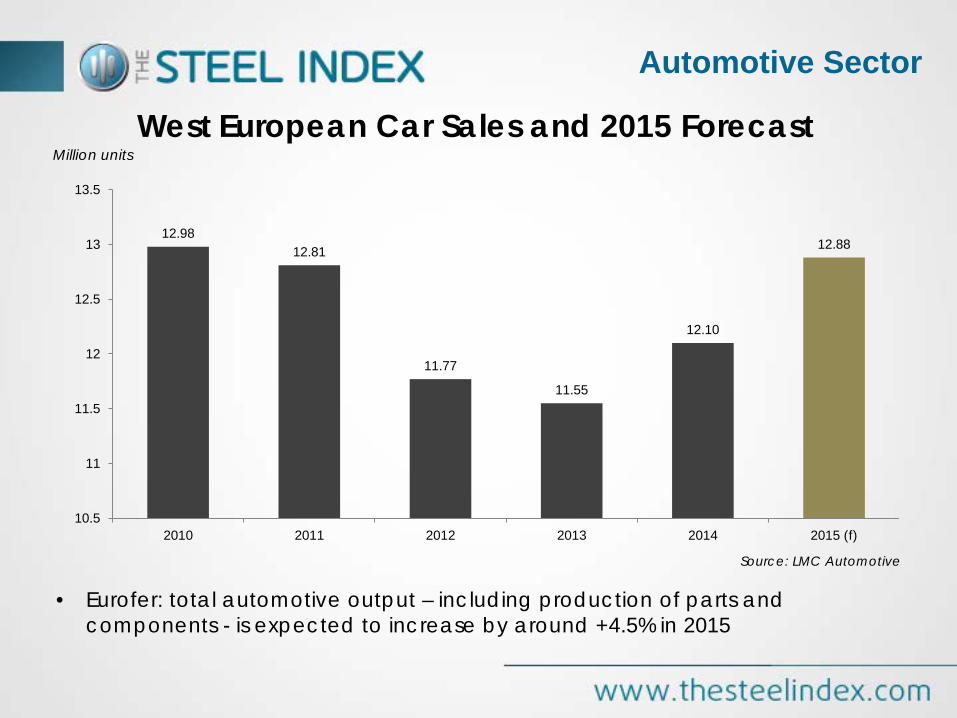
West European Car Sales and 2015 Forecast
Automotive Sector
Source: LMC Automotive
Million units
12.98 12.81
11.77
11.55
12.10
12.88
10.5
11
11.5
12
12.5
13
13.5
2010 2011 2012 2013 2014 2015 (f)
• Eurofer: total automotive output – including production of parts and components - is expected to increase by around +4.5% in 2015
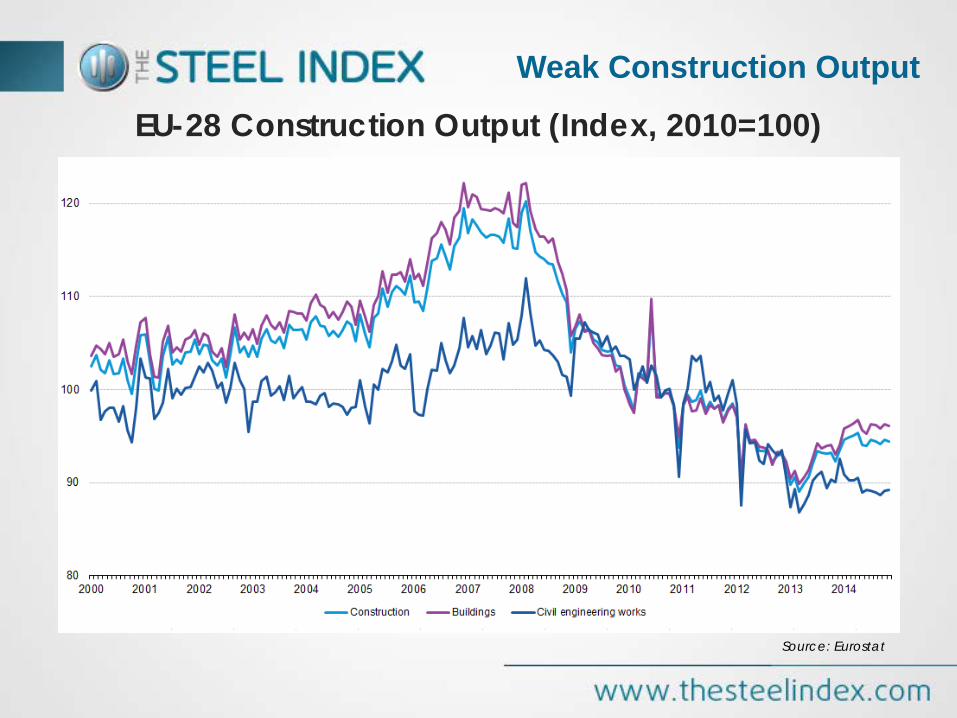
EU-28 Construction Output (Index, 2010=100)
Source: Eurostat
Weak Construction Output
Source: EUROCONSTRUCT
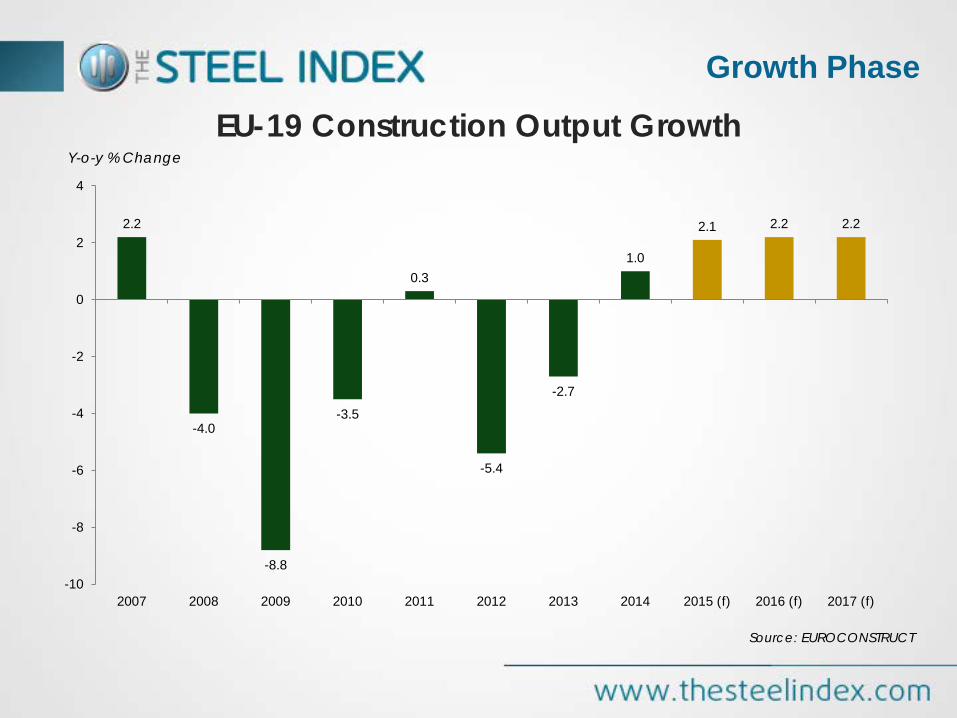
Growth Phase
EU-19 Construction Output Growth Y-o-y % Change
2.2
-4.0
-8.8
-3.5
0.3
-5.4
-2.7
1.0
2.1 2.2 2.2
-10
-8
-6
-4
-2
0
2
4
2007 2008 2009 2010 2011 2012 2013 2014 2015 (f) 2016 (f) 2017 (f)

Source: WSA
Cuts in Steel Production
EU Crude Steel Production ‘000 tonnes
9,000
10,000
11,000
12,000
13,000
14,000
15,000
16,000
Jan Feb Mar Apr May Jun Jul Aug Sep Oct Nov Dec
2013 2014 2015

German Distributors' Steel Inventories
Source: BDS
Lower Stock Levels
‘000 tonnes
2,000
2,100
2,200
2,300
2,400
2,500
2,600
2,700
2,800
• Negative impact of overcapacity on the distribution sector – estimated by Eurometal to be around 30% of the total capacity
• With expectations of stable or lower prices, YTD level of inventories, held by the German distributors, is -6% lower y-o-y
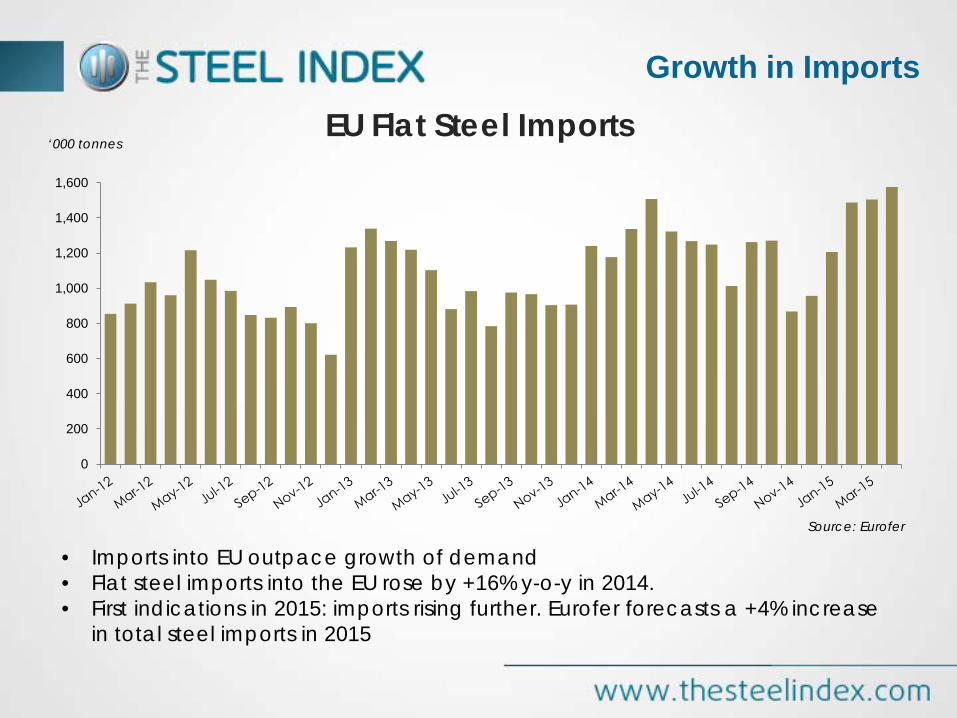
EU Flat Steel Imports
Source: Eurofer
Growth in Imports
‘000 tonnes
• Imports into EU outpace growth of demand • Flat steel imports into the EU rose by +16% y-o-y in 2014. • First indications in 2015: imports rising further. Eurofer forecasts a +4% increase
in total steel imports in 2015
0
200
400
600
800
1,000
1,200
1,400
1,600
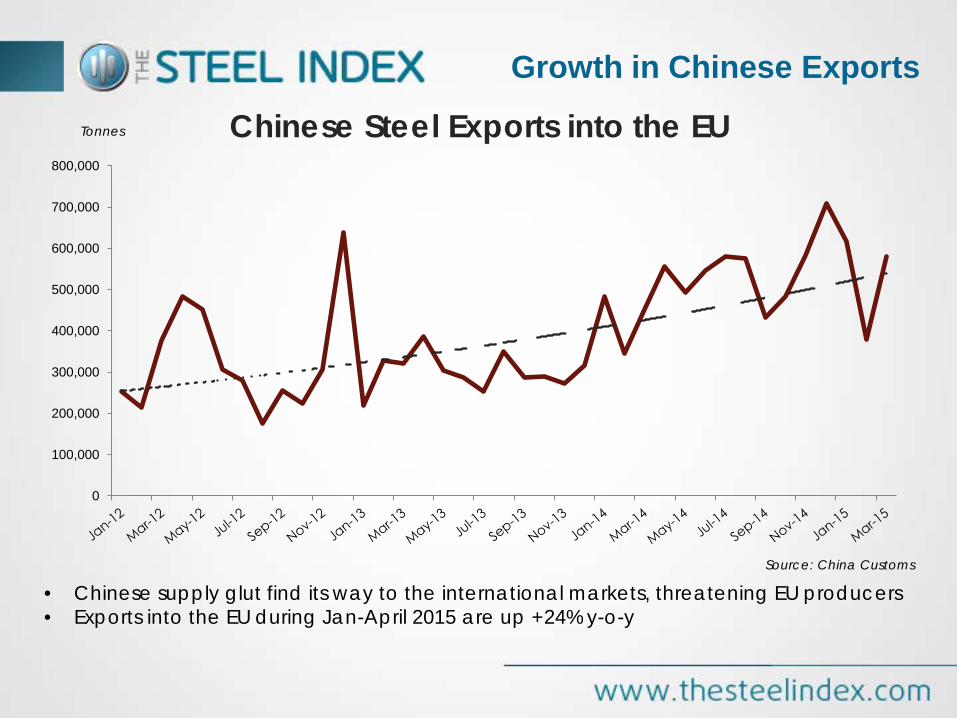
Chinese Steel Exports into the EU
Source: China Customs
Growth in Chinese Exports
Tonnes
0
100,000
200,000
300,000
400,000
500,000
600,000
700,000
800,000
• Chinese supply glut find its way to the international markets, threatening EU producers • Exports into the EU during Jan-April 2015 are up +24% y-o-y

Duties and AD Investigations in 2015
Trade Protectionism
April 2015: • The EC started an AD investigation into imports of ‘high fatigue performance’ rebar
from China. Primarily affected imports of rebar into the UK and Ireland.
May 2015: • Provisional AD measures are introduced against imports of grain-oriented electrical
steel from Russia, USA, Japan, Korea and China; duties are ranging from 21.6% to 35.9%.
• The EC opened an AD investigation into imports of CRC from China and Russia.
March 2015 • The European Commission (EC) imposed provisional
anti-dumping duties of up to 25.2 % on Stainless Steel CR imports from China and up to 12.0 % on imports from Taiwan, following the complaint which was filed by Eurofer in May 2014.
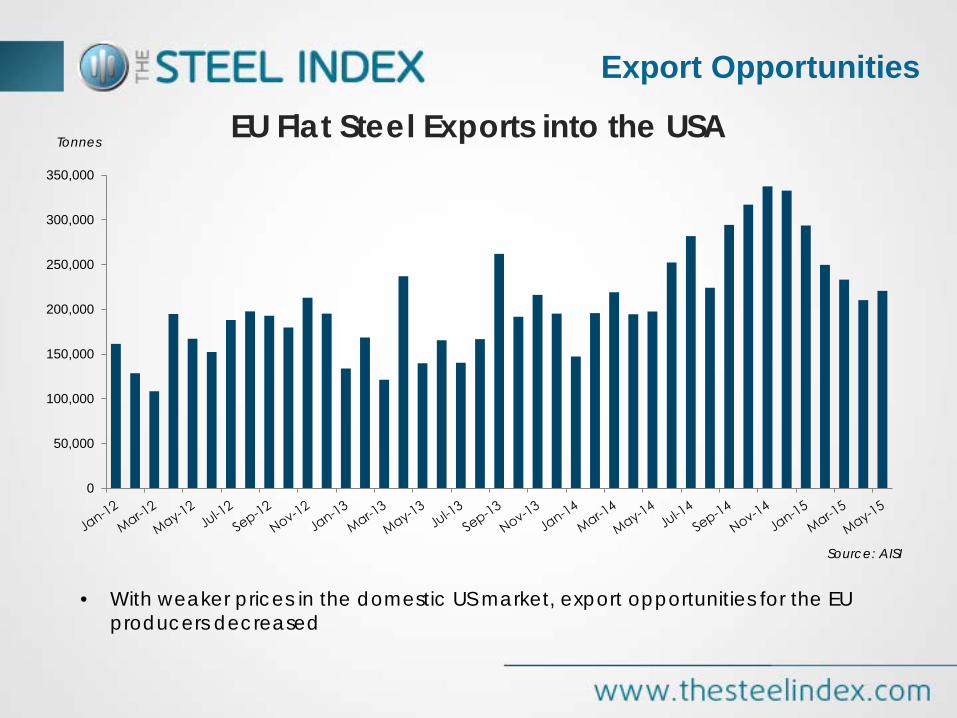
EU Flat Steel Exports into the USA
Source: AISI
Export Opportunities
Tonnes
• With weaker prices in the domestic US market, export opportunities for the EU producers decreased
0
50,000
100,000
150,000
200,000
250,000
300,000
350,000

TSI European Outlook Sentiment Survey
Outlook
Demand Sentiment* Price Sentiment*
* Net sentiment (= % of respondents expecting an increase over next 3 months minus % of respondents expecting a decrease over next 3 months)
-100
-80
-60
-40
-20
0
20
40
60
80
100
-100
-80
-60
-40
-20
0
20
40
60
80
100

North European HRC Swaps – Cumulative Volume Cleared
Steel Derivatives
Sources: LCH.Clearnet, CME Europe
Tonnes
0
50,000
100,000
150,000
200,000
250,000
300,000
• LCH.Clearnet and CME Clearing Europe offer North and South European HR coil steel contracts basis TSI’s daily indices