european Exchange Report - Joseph De La Vega · FESE EUROPEAN EXCHANGE REPORT 2017 Page 2 of 27 The...
27
EUROPEAN EXCHANGE REPORT Published in July 2017 Federation of European Securities Exchanges (FESE) Economics and Statistics Committee (ESC)
Transcript of european Exchange Report - Joseph De La Vega · FESE EUROPEAN EXCHANGE REPORT 2017 Page 2 of 27 The...

EUROPEAN EXCHANGE REPORT
Published in July 2017
Federation of European Securities Exchanges (FESE) Economics and Statistics Committee (ESC)

FESE EUROPEAN EXCHANGE REPORT 2017 Page 2 of 27
The Federation of European Securities Exchanges AISBL (FESE) shall not be liable for any errors or omissions nor for the use of the information contained in this document.
FOREWORD BY FESE PRESIDENT
The European Exchange Report is a valuable source of integrated information on Europe’s exchange industry. It is compiled by the Federation of European Securities Exchanges (FESE) which represents exchanges operating and meeting the standard of European Regulated Markets under EU law. The European Exchange Report includes key figures of each operator of Regulated Markets which are summarised on a one-page statement allowing for easy and transparent comparison of their key financial figures. In particular, the report contains the following detailed information: 1. Company information – Contacts information, company details, services, employees, etc. 2. Trading figures – The best source of comparable securities trading statistics across Europe in line with the FESE Statistics methodology as published on the FESE website. 3. Financial figures – Detailed information on revenues, costs and net income including analysis breakdown of services offered. As in previous years, this information was compiled on the basis of data gathered by the FESE’s Economics and Statistics Committee in cooperation with the financial departments of every member. The FESE Secretariat would like to thank all those that contributed to this study and especially the members of the FESE’s Economics and Statistics Committee. We trust that you will find this information useful.
Deirdre Somers President of the Federation of European Securities Exchanges

FESE EUROPEAN EXCHANGE REPORT 2017 Page 3 of 27
The Federation of European Securities Exchanges AISBL (FESE) shall not be liable for any errors or omissions nor for the use of the information contained in this document.
TABLE OF CONTENTS
FULL MEMBERS ........................................................................................................... 4 ATHENS EXCHANGE .................................................................................................... 5 BOLSAS Y MERCADOS ESPAÑOLES (BME) ............................................................. 6 BÖERSE STUTTGART .................................................................................................. 7 BORSA ISTANBUL ........................................................................................................ 8 BUDAPEST STOCK EXCHANGE ................................................................................. 9 CEESEG – PRAGUE STOCK EXCHANGE ................................................................. 10 CEESEG – VIENNA STOCK EXCHANGE ................................................................... 11 CYPRUS STOCK EXCHANGE .................................................................................... 12 DEUTSCHE BÖRSE GROUP ...................................................................................... 13 EURONEXT .................................................................................................................. 14 ICE FUTURES EUROPE .............................................................................................. 15 THE IRISH STOCK EXCHANGE ................................................................................. 16 LONDON METAL EXCHANGE .................................................................................... 17 LUXEMBOURG STOCK EXCHANGE ......................................................................... 18 MALTA STOCK EXCHANGE ...................................................................................... 19 NASDAQ Group Inc. ................................................................................................... 20 OSLO BØRS ................................................................................................................ 21 SIX GROUP .................................................................................................................. 22 SIX SWISS EXCHANGE .............................................................................................. 22 WARSAW STOCK EXCHANGE (GPW) ...................................................................... 23 AFFILIATE MEMBERS ................................................................................................ 24 TEL AVIV STOCK EXCHANGE (TASE) ...................................................................... 25 Notes on Methodology ............................................................................................... 26 Contact……………....................................................................................................... 27

FESE EUROPEAN EXCHANGE REPORT 2017 Page 4 of 27
The Federation of European Securities Exchanges AISBL (FESE) shall not be liable for any errors or omissions nor for the use of the information contained in this document.
FULL MEMBERS

FESE EUROPEAN EXCHANGE REPORT 2017 Page 5 of 27
The Federation of European Securities Exchanges AISBL (FESE) shall not be liable for any errors or omissions nor for the use of the information contained in this document.
ATHENS EXCHANGE
Name Athens Exchange Type of Company Joint-stock company
For profit
Address 110 Athens Ave, Athens 104 42 Listed On Athens Exchange (Hellenic Exchanges S.A)
Phone +30 210 3366 800 Sectors Cash EU regulated markets
Fax +30 210 3366 607 Cash EU not regulated (exchange regulated) markets
Email [email protected] Derivatives markets
Website www.athexgroup.gr Retail bond markets
Clearing houses / CCP services providers
Year established 1876 Central Securities Depositories / Settlement companies
Year of current legal status 2000 IT infrastructure and software providers / XNET network -
Country of Incorporation Greece Platform for access to internat. securities trading
Active in Greece Number of employees 224 (end of year)
Electronic Order Off Reporting Electronic Order Off Electronic Order Off Electronic Order Off
Book Trades EOB Trades Book Trades EOB Book Trades EOB Book Trades EOB
Turnover (EUR m) 12,879 2,041 659.6 3 0 4 0 78 44
Trades 4,639,181 1,663 149 13,353 1 942 0 39,549 64
Market Cap. (EUR m)
Listed companies
Electronic Order Off Bond
Book Trades EOB Options & Futures Commodities
Turnover (EUR m) 5 2 Notional Turnover (EUR m) - -
Trades 355 26 Contracts Traded - -
Listings
Revenues 26,955
Costs 21,816
EBITDA 8,020
EBIT 5,139
Net Income 3,366
Footnotes
Financial figures are under IAS financial accounting protocol
Net income is calculated before income tax and minority interest.
On Revenue breakdown: other revenues include Auxiliary Fund management revenues, OTC revenues, Xnet/DAC project subsidy revenues and Tax rebates.
On Cost breakdown: other cost include capital market commission fee.
Notes
Figures mentioned include subsidiaries.
Trading figures 2016Equity
Shares Sec. Derivatives ETFs UCITs
15,470,716
35,309 - - 788
218 3 3 3
Bonds Derivatives
Stock/Index
Options and Futures
2,714
31
Financial figures 2016
Main financial results 2016
EUR '000
33
81
47
352724 22 23 22 22
12
61
2615
8
0
20
40
60
80
100
2012 2013 2014 2015 2016
EU
R m
illio
ns
Revenues, Costs and EBITDA2012 - 2016
Revenues Costs EBITDA
44%
5%
33%
13%
5%
Cost Breakdown 2016
Personnel
ICT
Other operating
Depreciation andamortisation
Other costs
19%
15%
2%
31%
5%
0.6%
12%
5%
11%
Revenue Breakdown 2016
Listing (admission +ongoing)
Cash Trading
Derivatives Trading
Clearing / CCP
Settlement
Custody & Banking
Info products & services
ICT services
Other (advert., educat.,properties)
FESE EUROPEAN EXCHANGE REPORT 2017 Page 6 of 27
The Federation of European Securities Exchanges AISBL (FESE) shall not be liable for any errors or omissions nor for the use of the information contained in this document.
BOLSAS Y MERCADOS ESPAÑOLES (BME)
Name Bolsas y Mercados Españoles Type of Company Joint-stock company
For profit
Address Plaza de la Lealtad 1, 28014 Madrid Listed On BME Spanish Exchanges
Phone +34 91 709 50 00 Sectors Cash EU regulated market
Fax +34 91 709 57 09 Cash EU not regulated (exchange regulated) markets
Email [email protected] Derivatives markets
Website www.bolsasymercados.es Wholesale bond markets
Clearing houses / CCP services providers
Year established 1831 Central Securities Depositories / Settlement
Year of current legal status 2006 IT infrastructure and software providers
Country of Incorporation Spain Market data distribution / Consulting Services
Active in Spain Number of employees 762 (average)
Electronic Order Off Reporting Electronic Order Off Electronic Order Off Electronic Order Off
Book Trades EOB Trades Book Trades EOB Book Trades EOB Book Trades EOB
Turnover (EUR m) 618,930 28,337 - 716 - 6,040 - - -
Trades 54,135,344 159,284 - 0 - 0 - - -
Market Cap. (EUR m)
Listed companies
Electronic Order Off Bond
Book Trades EOB Options & Futures Commodities
Turnover (EUR m) 164,472 5,820,532 Notional Turnover (EUR m) 246 -
Trades 15,821 593,475 Contracts Traded 2,455 -
Listings
Revenues 326,834
Costs 110,750
EBITDA 216,084
EBIT 208,433
Net Income 160,260
Footnotes
Financial figures are under International Accounting Standards
On Revenue breakdown, other revenues include corporate unit revenues, capitalization of development costs & consolidation adjustments between segments
Notes
Figures mentioned include subsidiaries.
3,337
45,171,889
Options and Futures
EUR '000
Main financial results 2016
2,984
Financial figures 2016
694,742
3,506 3,993
-669,395 -
21
Stock/Index
DerivativesBonds
Trading figures 2016Equity
Sec. Derivatives UCITsETFsShares
36,762
296 308342
348327
99 99 104 103 111
197 209 239
245 216
050
100150200250300350400
2012 2013 2014 2015 2016
EU
R m
illio
ns
Revenues, Costs and EBITDA2012 - 2016
Revenues Costs EBITDA
58%
35%
7%
Cost Breakdown 2016
Personnel
Other operating
Depreciation and amortisation
6%
38%
3%3%7%
7%
14%
14%
6%2%
Revenue Breakdown 2016
Listing (admission + ongoing)
Cash Trading-Equity
Cash Trading-Fixed Income
Derivatives Trading & Clearing
Clearing / CCP
Settlement
Custody & Banking
Info products & services
ICT services
Other (advert., educat., properties)

FESE EUROPEAN EXCHANGE REPORT 2017 Page 7 of 27
The Federation of European Securities Exchanges AISBL (FESE) shall not be liable for any errors or omissions nor for the use of the information contained in this document.
BÖERSE STUTTGART
Name Boerse Stuttgart GmbH Type of Company Corporation (Association)
For profit
Address Börsenstraße 4, 70174 Stuttgart Listed
Phone +49 (0)711 222 985 0 Sectors Cash EU regulated markets
Fax +49 (0)711 222 985 555 Cash EU not regulated (exchange regulated) markets
Email [email protected] Securitized derivatives markets
Website www.boerse-stuttgart.de Retail bond markets
Year established 1861
Year of current legal status 2015
Country of Incorporation Germany Number of employees 299 (end of year)
Active in Germany, Sweden
Electronic Order Off Reporting Electronic Order Off Electronic Order Off Electronic Order Off
Book Trades EOB Trades Book Trades EOB Book Trades EOB Book Trades EOB
Turnover (EUR m) 16,860 - - 44,800 - 12,224 - 991 -
Trades 1,392,773 - - 6,078,467 - 304,369 - 69,798 -
Market Cap. (EUR m)
Listed companies
Electronic Order Off Bond
Book Trades EOB Options & FuturesCommodities
Turnover (EUR m) 16,271 - Notional Turnover (EUR m) - -
Trades 324,045 - Contracts Traded - -
Listings
Revenues 125,960
Costs 122,254
EBITDA 11,393
EBIT 3,406
Net Income 589
Footnote
Financial figures refer to the consolidated annual statement of Boerse Stuttgart GmbH
Financial figures are under German HGB financial acconting standards
Notes
Figures mentioned include subsidiaries.
1,480
Trading figures 2016
-
Sec. Derivatives UCITsETFs
Equity
Shares
-
-
1,852
-
EUR '000
Main financial results 2016
13,140
Bonds
Financial figures 2016
Stock/Index
-
Options and Futures
Derivatives
-
-
1,331,220
117 116125
145
126111 109 120
134 122
6 8 817 11
020406080
100120140160
2012 2013 2014 2015 2016
EU
R m
illio
ns
Revenues, Costs and EBITDA2012 - 2016
Revenues Costs (ex tax) EBITDA
26%
14%
25%
7%
28%
Cost Breakdown 2016
Personnel
ICT - exchange
Other operating
Depreciation andamortisation
Other costs (incl.interests and other fin.expenses)
1%
84%
1%
5%
5%1%
3%
Revenue Breakdown 2016
Listing (admission + ongoing)
Cash Trading
Clearing / CCP
Custody & Banking (financial revs.)
Info products & services
ICT services
Other (advert., educat., properties)
FESE EUROPEAN EXCHANGE REPORT 2017 Page 8 of 27
The Federation of European Securities Exchanges AISBL (FESE) shall not be liable for any errors or omissions nor for the use of the information contained in this document.
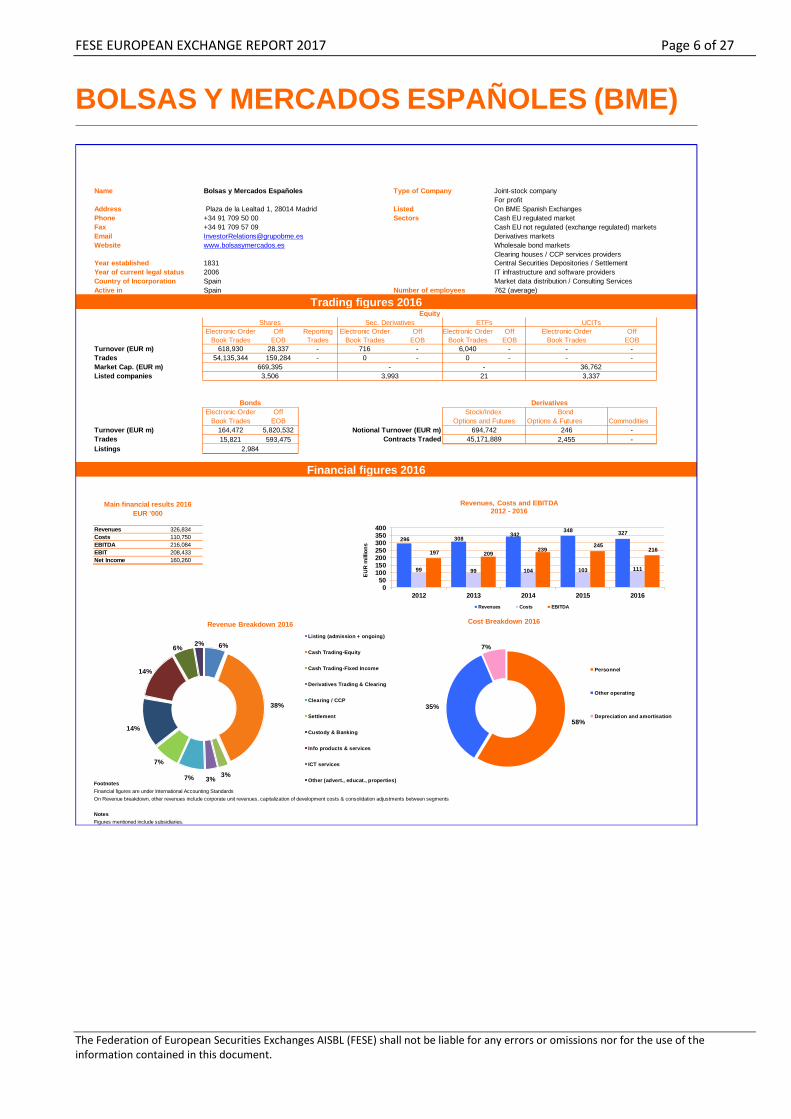
BORSA ISTANBUL
Name Borsa Istanbul Type of Company Joint Stock Company
For profit
Address Reşitpaşa Mah. Tuncay Artun Cd. Emirgan 34467 – İSTANBUL Listed Not listed
Phone +90 (212) 298 21 00 Sectors Cash EU not regulated (exchange regulated) markets
Fax +90 (212) 298 25 00 Derivatives markets
Email [email protected]; [email protected] Wholesale bond markets
Website www.borsaistanbul.com Retail bond markets
Clearing houses / CCP services providers
Year established 1873 Central Securities Depositories
Year of current legal status 2013 Companies managing settlement
Country of Incorporation Turkey
Active in Turkey Number of employees 541 (end of the year)
Electronic Order Off Reporting Electronic Order Off Electronic Order Off Electronic Order Off
Book Trades EOB Trades Book Trades EOB Book Trades EOB Book Trades EOB
Turnover (EUR m) 297,908 3,854 - 1,825 - 719 - 301 7
Trades 106,491,736 1,400 - 2,640,364 - 227,974 - 673,239 4
Market Cap. (EUR m)
Listed companies
Electronic Order Off Bond
Book Trades EOB Options & Futures Commodities
Turnover (EUR m) 106,286 92,518 Notional Turnover (EUR m) - 2,401
Trades 267,066 0 Contracts Traded - 5,195,760
Listings
Revenues 293,232
Costs 181,132
EBITDA 145,839
EBIT 135,982
Net Income 82,530
Footnotes
Financial figures for year 2012 are under GAAP financial accounting protocol.
In 2013 Borsa İstanbul became a joint stock company and the financials accounting protocol changed to IFRS.
Notes
The mentioned figures include subsidiaries.
600
Financial figures 2016
Main financial results 2016
EUR '000
56,459,340
162,781 - - 84
381 1,071 11 9
Bonds Derivatives
Stock/Index
Options and Futures
134,084
Trading figures 2016Equity
Shares Sec. Derivatives ETFs UCITs
113
227 234281
293
78
152 146151
181
22
68 85
128146
0
50
100
150
200
250
300
350
2012 2013 2014 2015 2016
EU
R M
illio
ns
Revenues, Costs and EBITDA2012 - 2016
Revenues Costs EBITDA
36%
24%
5%
35%
Cost Breakdown 2016
Personnel
Other operating
Depreciation andamortisation
Other costs
5%
21%
5%
3%
43%
5%
1%
17%
Revenue Breakdown 2016
Listing (admission +ongoing)
Cash Trading
Derivatives Trading
Settlement
Custody & Banking
Info products & services
ICT services
Other (advert., educat.,properties)
FESE EUROPEAN EXCHANGE REPORT 2017 Page 9 of 27
The Federation of European Securities Exchanges AISBL (FESE) shall not be liable for any errors or omissions nor for the use of the information contained in this document.
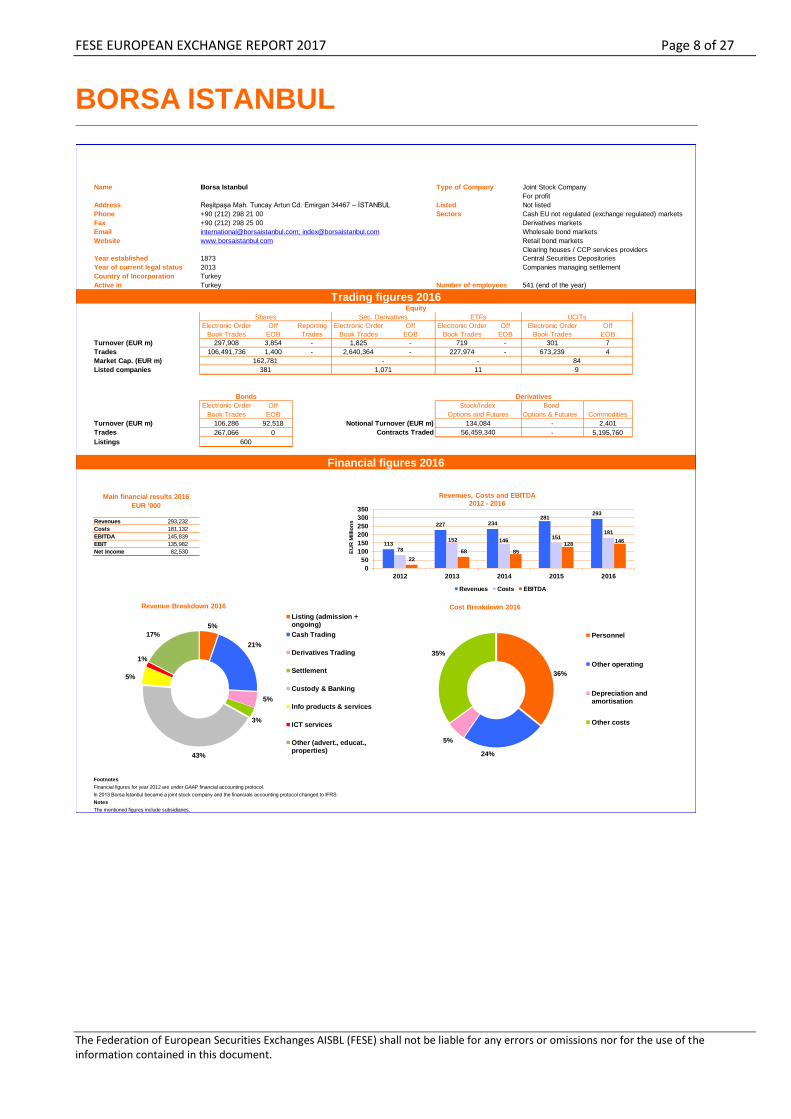
BUDAPEST STOCK EXCHANGE
Name Budapest Stock Exchange Type of Company Joint-stock company
For profit
Address H - 1054 Budapest, Szabadság tér 7. Listed Traded OTC regularly
Phone +36 1 429 6857 Sectors Cash EU regulated market
Fax +36 1429 6899 Derivatives markets
Email [email protected] Wholesale bond markets
Website www.bet.hu IT infrastructure and software providers
Year established 1990
Year of current legal status 2002
Country of Incorporation Hungary Number of employees 61 (end of the year)
Active in Hungary
Electronic Order Off Reporting Electronic Order Off Electronic Order Off Electronic Order Off
Book Trades EOB Trades Book Trades EOB Book Trades EOB Book Trades EOB
Turnover (EUR m) 7,348 20 - 298 - 1 - 40 -
Trades 1,346,828 25 - 258,924 - 386 - 15,044 -
Market Cap. (EUR m)
Listed companies
Electronic Order Off Bond
Book Trades EOB Options & FuturesCommodities
Turnover (EUR m) 5 - Notional Turnover (EUR m) - 56
Trades 250 - Contracts Traded - 2,616
Listings
Revenues 7,092
Costs 6,568
EBITDA 1,235
EBIT 961
Net Income 235
Footnote
Financial figures are under GAAP financial accounting protocol
Financial figures refer to the exchange and not to the parent company owning the exchange
Notes
Figures mentioned include subsidiaries.
EUR '000
Main financial results 2016
101
Financial figures 2016
140
Options and Futures
426,501
991
Stock/Index
Bonds
Trading figures 2016
Sec. Derivatives UCITsETFs
Equity
-
121
-
Derivatives
Shares
3,01121,270
43 1
88
7 7 76 6
5 5
7
3 3 3 3
1
0123456789
2012 2013 2014 2015 2016
EU
R m
illio
ns
Revenues, Costs and EBITDA2012 - 2016
Revenues Costs EBITDA
45%
31%
3%
4%
17%
Cost Breakdown 2016
Personnel
Material
ICT
Depreciation andamortisation
Other costs
18%
37%
5%1%
34%
2%
Revenue Breakdown 2016 Listing (admission + ongoing)
Cash Trading
Derivatives Trading
XETRA and Licence
Info products & services
ICT services
Other (advert., educat.,properties)
2%

FESE EUROPEAN EXCHANGE REPORT 2017 Page 10 of 27
The Federation of European Securities Exchanges AISBL (FESE) shall not be liable for any errors or omissions nor for the use of the information contained in this document.
CEESEG – PRAGUE STOCK EXCHANGE
Name Prague Stock Exchange Type of Company Joint-stock company
For profit
Address Rybna 14 110 05 Prague 1 Listed No
Phone +420 221 831 111 Sectors Cash EU regulated markets
Fax - Cash EU not regulated (exchange regulated) markets
Email [email protected] Derivatives markets
Website www.pse.cz Clearing houses / CCP services providers
Central Securities Depositories
Year established 1993 Companies managing settlement
Year of current legal status 1993
Country of Incorporation Czech Republic Number of employees 75 (end of year)
Active in Czech Republic
Electronic Order Off Reporting Electronic Order Off Electronic Order Off Electronic Order Off
Book Trades EOB Trades Book Trades EOB Book Trades EOB Book Trades EOB
Turnover (EUR m) 6,213 - - 5 - - - 2 -
Trades 895,979 - - 2,253 - - - 29 -
Market Cap. (EUR m)
Listed companies
Electronic Order Off Bond
Book Trades EOB Options & Futures Commodities
Turnover (EUR m) 154 - Notional Turnover (EUR m) - -
Trades 2,979 - Contracts Traded - -
Listings
Revenues 17,132
Costs 9,196
EBITDA 8,928
EBIT 7,936
Net Income 11,288
Notes
Figures mentioned include subsidiaries.
Other (advert., educat., properties ) includes services for issuers by the Central Securities Depository Prague (part of PSE).
115
Financial figures 2016
Main financial results 2016
EUR '000
-
22,195 - - 594
25 71 - 35
Bonds Derivatives
Stock/Index
Options and Futures
-
Trading figures 2016Equity
Shares Sec. Derivatives ETFs UCITs
21 20
18 18 17 15 14
12 12 9 10 9 8 9 9
0
5
10
15
20
25
2012 2013 2014 2015 2016
EU
R m
illio
ns
Revenues, Costs and EBITDA2012-2016
Revenues Costs EBITDA
52%
13%
1%
11%
23%
Costs Breakdown 2016
Personnel
ICT
Other operating
Depreciation andamortisation
Other costs
3%7%
22%
31%
9%
28%
Revenues Breakdown 2016
Listing (admission + ongoing)
Cash Trading
Settlement
Custody & Banking
Info products & services
Other (advert., educat.,properties)

FESE EUROPEAN EXCHANGE REPORT 2017 Page 11 of 27
The Federation of European Securities Exchanges AISBL (FESE) shall not be liable for any errors or omissions nor for the use of the information contained in this document.
CEESEG – VIENNA STOCK EXCHANGE
Name Vienna Stock Exchange Type of Company Joint-stock company
For profit
Address Wallnerstraße 8 Box 192, A-1010 Vienna Listed Traded OTC regularly
Phone +43 1 531 65-0 Sectors Cash EU regulated market
Fax +43 1 532 97 40 Cash EU not regulated (exchange regulated) markets
Email [email protected] Wholesale bond markets
Website www.wienerboerse.at Retail bond markets
Clearing houses / CCP services providers
Year established 1771
Year of current legal status 1997
Country of Incorporation Austria Number of employees 87 (end of year)
Active in Austria
Electronic Order Off Reporting Electronic Order Off Electronic Order Off Electronic Order Off
Book Trades EOB Trades Book Trades EOB Book Trades EOB Book Trades EOB
Turnover (EUR m) 27,976 - - 213 - 1 - 0 -
Trades 6,625,672 - - 19,755 - 104 - 1 -
Market Cap. (EUR m)
Listed companies
Electronic Order Off Bond
Book Trades EOB Options & FuturesCommodities
Turnover (EUR m) 162 - Notional Turnover (EUR m) - -
Trades 9,581 - Contracts Traded - -
Listings 3,159
Revenues 56,212
Costs 24,165
EBITDA 32,860
EBIT 32,047
Net Income 27,320
Footnote
Financial figures are under local GAAP financial acconting standards
* provided by CCP.A; only revenues from services rendered to clearing house included
EUR '000
Main financial results 2016
Bonds
-
6,958
Financial figures 2016
-
-
Stock/Index
Options and Futures
Derivatives
-
Trading figures 2016
-
9
Shares
95,201
Equity
83 1
Sec. Derivatives UCITsETFs
4345 47 49
56
28 30 29 2924
16 17 19 21
33
0
10
20
30
40
50
60
2012 2013 2014 2015 2016
EU
R m
illio
ns
Revenues, Costs and EBITDA2012 - 2016
Revenues Costs EBITDA
43%
38%
15%
3% 1%
Cost Breakdown 2016
Personnel
ICT
Other operating
Depreciation andamortisation
Other costs
8.1%
43.5%
0.2%
28.7%
19.5%
Revenue Breakdown 2016
Listing (admission + ongoing)
Cash Trading
Clearing / CCP*
Info products & services
Other (advert., educat., properties)
FESE EUROPEAN EXCHANGE REPORT 2017 Page 12 of 27
The Federation of European Securities Exchanges AISBL (FESE) shall not be liable for any errors or omissions nor for the use of the information contained in this document.
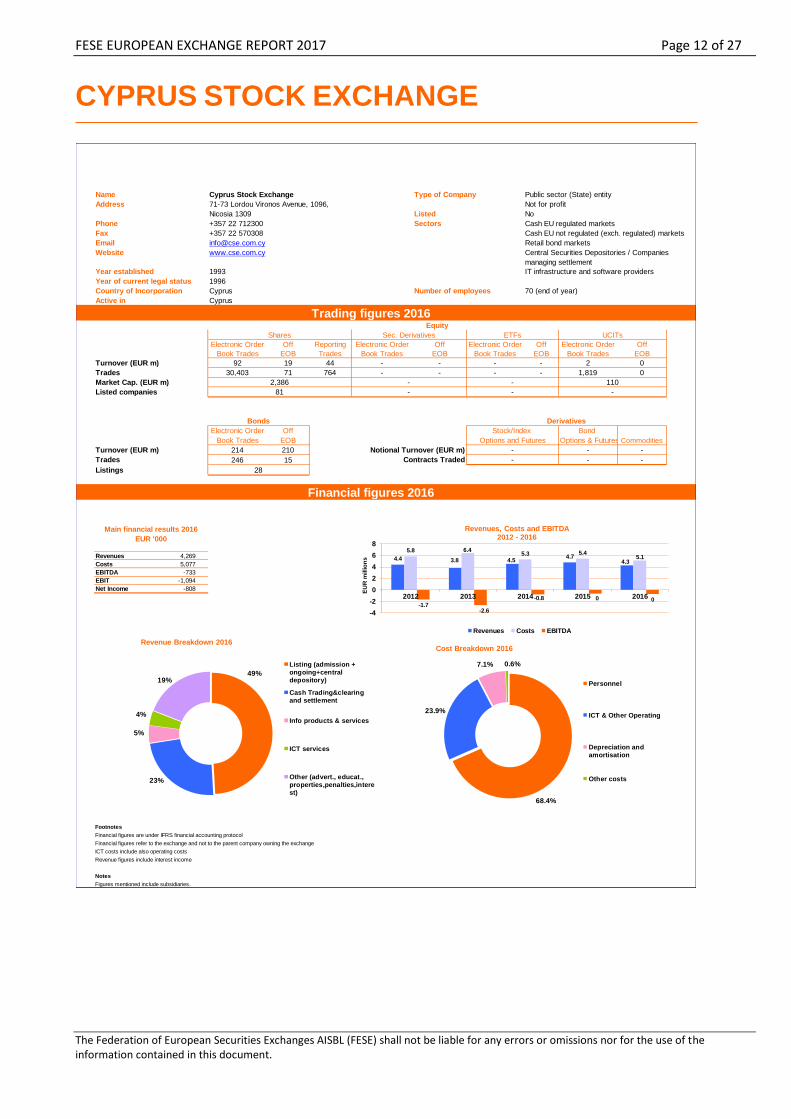
CYPRUS STOCK EXCHANGE
Name Cyprus Stock Exchange Type of Company Public sector (State) entity
Address 71-73 Lordou Vironos Avenue, 1096, Not for profit
Nicosia 1309 Listed No
Phone +357 22 712300 Sectors Cash EU regulated markets
Fax +357 22 570308 Cash EU not regulated (exch. regulated) markets
Email [email protected] Retail bond markets
Website www.cse.com.cy Central Securities Depositories / Companies
managing settlement
Year established 1993 IT infrastructure and software providers
Year of current legal status 1996
Country of Incorporation Cyprus Number of employees 70 (end of year)
Active in Cyprus
Electronic Order Off Reporting Electronic Order Off Electronic Order Off Electronic Order Off
Book Trades EOB Trades Book Trades EOB Book Trades EOB Book Trades EOB
Turnover (EUR m) 92 19 44 - - - - 2 0
Trades 30,403 71 764 - - - - 1,819 0
Market Cap. (EUR m)
Listed companies
Electronic Order Off Bond
Book Trades EOB Options & Futures Commodities
Turnover (EUR m) 214 210 Notional Turnover (EUR m) - -
Trades 246 15 Contracts Traded - -
Listings
Revenues 4,269
Costs 5,077
EBITDA -733
EBIT -1,094
Net Income -808
Footnotes
Financial figures are under IFRS financial accounting protocol
Financial figures refer to the exchange and not to the parent company owning the exchange
ICT costs include also operating costs
Revenue figures include interest income
Notes
Figures mentioned include subsidiaries.
Trading figures 2016
2,386
81
Derivatives
-
110
Equity
Sec. Derivatives UCITsETFs
Bonds
-
Shares
--
-
Options and Futures
-
Stock/Index
EUR '000
Main financial results 2016
28
Financial figures 2016
-
4.4 3.8 4.54.7
4.3
5.8 6.45.3 5.4
5.1
-1.7-2.6
-0.8 0 0
-4
-2
0
2
4
6
8
2012 2013 2014 2015 2016
EU
R m
illio
ns
Revenues, Costs and EBITDA2012 - 2016
Revenues Costs EBITDA
49%
23%
5%
4%
19%
Revenue Breakdown 2016
Listing (admission +
ongoing+centraldepository)
Cash Trading&clearingand settlement
Info products & services
ICT services
Other (advert., educat.,properties,penalties,interest)
68.4%
23.9%
7.1% 0.6%
Cost Breakdown 2016
Personnel
ICT & Other Operating
Depreciation andamortisation
Other costs

FESE EUROPEAN EXCHANGE REPORT 2017 Page 13 of 27
The Federation of European Securities Exchanges AISBL (FESE) shall not be liable for any errors or omissions nor for the use of the information contained in this document.
DEUTSCHE BÖRSE GROUP
Name Deutsche Börse AG Type of Company Joint-stock company
For profit
Address Mergenthalerallee 61, 65760 Eschborn - Germany Listed On Deutsche Börse
Phone +49 (0) 69 2 11 0 Sectors Cash EU regulated market
Fax +49 (0) 69 2 11 0 Cash EU not regulated (exchange regulated) markets
Email [email protected] Derivatives markets
Website www.deutsche-boerse.com Retail bond market; Wholesale bond markets
Clearing houses / CCP services providers
Year established 1585 Central Securities Depositories / Settlement companies
Year of current legal status 1992 IT infrastructure and software providers
Country of Incorporation Germany Info. Services, ICSD, Repo Market, Services for
Markets managed Austria, Bulgaria, Finland, Germany, investment fund industry
(directly or indirectly) Ireland, Switzerland & USA Number of employees 5,176 (end of the year)
Electronic Order Off Reporting Electronic Order Off Electronic Order Off Electronic Order Off
Book Trades EOB Trades Book Trades EOB Book Trades EOB Book Trades EOB
Turnover (EUR m) 1,184,365 16,156 90,402 18,636 18,518 163,585 2,501 1,112 1,260
Trades 137,827,200 189,230 500,299 2,229,428 2,190,281 3,750,925 47,563 107,258 35,547
Market Cap. (EUR m)
Listed companies
Electronic Order Off Bond
Book Trades EOB Options & Futures Commodities
Turnover (EUR m) 7,346 4,464 Notional Turnover (EUR m) 526,896,845 -
Trades 449,899 34,479 Contracts Traded 76,151,440 -
Listings
Revenues 2,388,700
Costs 1,174,200
EBITDA 1,299,700
EBIT 1,220,200
Net Income 810,800
Footnote
Financial figures are under IFRS financial accounting protocol
Notes
Figures mentioned include subsidiaries.
33,591
Financial figures 2016
Main financial results 2016
EUR '000
1,174,512,349
1,630,413 - - -
592 1,617,738 1,128 3,005
Bonds Derivatives
Stock/Index
Options and Futures
33,839,368
Trading figures 2016Equity
Shares Sec. Derivatives ETFs UCITs
1,932 1,9122,043
2,367 2,389
922 968 1,0691,249 1,1741,108 1,067 1,110
1,265 1,300
0
500
1000
1500
2000
2500
3000
2012 2013 2014 2015 2016
EU
R m
illio
ns
Revenues, Costs and EBITDA2012 - 2016
Revenues Costs EBITDA
39%
33%
9%
19%
Cost Breakdown 2016
Personnel
Other operating
Depreciation andamortisation
Volume related costs
5%
34%
1%
5%26%
10%
7%
12%
Revenue Breakdown 2016 Cash Trading
Derivatives Trading
Clearing / CCP
Settlement
Custody & Banking
Info products & services
ICT services
Other (advert., educat.,properties)

FESE EUROPEAN EXCHANGE REPORT 2017 Page 14 of 27
The Federation of European Securities Exchanges AISBL (FESE) shall not be liable for any errors or omissions nor for the use of the information contained in this document.
EURONEXT
Name Euronext N.V. Joint-stock company
For profit
Address Listed On Euronext
(European Corp. Headquarter) 14, place des Reflets 92054 Paris La Défense Cedex Sectors Cash EU regulated markets
Phone +33 (0)1 70 48 24 00 Cash EU not regulated (exchange regulated) markets
Fax Derivatives markets
Email [email protected] IT infrastructure and software providers
Website www.euronext.com
Year of Incorporation 2014
Country of Incorporation The Netherlands Number of employees 574 (end of year)
Active in Belgium, France, Netherlands, Portugal, United Kingdom
Electronic Order Off Reporting Electronic Order Off Electronic Order Off Electronic Order Off
Book Trades EOB Trades EOB Book EOB Book EOB
Turnover (EUR m) 1,601,434 31,997 866,408 9,606 0 82,249 64,152 10,015 0
Trades 222,889,417 144,073 359,313 2,912,364 11 2,267,208 11,005 186,950 2
Market Cap. (EUR m)
Listed Domestic companies
Electronic Order Off Bond
Book EOB Options & Futures Commodities
Turnover (EUR m) 6,647 6 Notional Turnover (EUR m) - 126,564
Trades 376,170 27 Contracts Traded - 13,758,816
Listings
Revenues 496,436
Costs 222,579
EBITDA 273,857
EBIT 258,768
Net Income 197,013
Footnotes
Euronext financial results are limited to 2013 and 2014 due to the separation between Euronext and the ICE group.
Main financial results are based on IFRS converted at correspondent exchange rates.
Notes
Figures mentioned include subsidiaries.
Trading figures 2016Equity
Financial figures 2016
Sec. Derivatives UCITsETFs
-
2,979,320
112,427,736
-
Shares
EUR '000
Main financial results 2016
5,525
-
790
3,287,230
1,051
Stock/Index
Bonds
Options and Futures
54,358
Derivatives
503
482 492 519 496
304 312 263
223 178 181
255 274
0
100
200
300
400
500
600
2013 2014 2015 2016
EU
R m
illio
ns
Revenues, Costs and EBITDA2013 - 2016
Revenues Costs EBITDA
76%
13%
11%
Cost Breakdown 2016
Personnel
ICT
Depreciation and amortisation
14%
36%
8%
10%
4%
21%
7% 0.3%
Revenue Breakdown 2016
Listing (admission + ongoing)
Cash Trading
Derivatives Trading
Clearing / CCP
Settlement and Custody
Info products & services
ICT services
Other (Activity assessment,regulatory and others)

FESE EUROPEAN EXCHANGE REPORT 2017 Page 15 of 27
The Federation of European Securities Exchanges AISBL (FESE) shall not be liable for any errors or omissions nor for the use of the information contained in this document.
ICE FUTURES EUROPE
Name ICE Futures Europe Type of Company For profit
Listed Listed on a regulated market managed by other entities
Address Milton Gate, 60 Chiswell Street, London EC1Y4SA (Intercontinental Exchange Inc on NYSE)
Phone +44 (0)20 7065 7700 Sectors Futures & Options Energy Exchange
Fax +44 (0)20 7638 4964
Email [email protected]
Website www.theice.com
Year established 1980
Year of current legal status 2005
Country of Incorporation England & Wales Number of employees 168 (end of the year)
Active in United Kingdom
Electronic Order Off Reporting Electronic Order Off Electronic Order Off Electronic Order Off
Book Trades EOB Trades Book Trades EOB Book Trades EOB Book Trades EOB
Turnover (EUR m) - - - - - - - - -
Trades - - - - - - - - -
Market Cap. (EUR m)
Listed companies
Electronic Order Off Bond
Book Trades EOB Options & Futures Commodities
Turnover (EUR m) - - Notional Turnover (EUR m) 283,927,852 15,281,281
Trades - - Contracts Traded 411,562,784 402,153,536
Listings
Revenues 87,438
Costs 121,447
EBITDA 90,085
EBIT 86,263
Net Income 69,186
Footnotes
Financial figures are under UK GAAP financial accounting protocol
Main financial results are based on UK Filed statutory accounts (functional currency changed from GBP to USD on 30 June 2006) converted at correspondent exchange rates.
On Revenue Breakdown:
*Fees levied on clearing members for transacting on the exchange have been included in derivatives trading
Notes
Figures mentioned include subsidiaries.
Trading figures 2016Equity
Shares Sec. Derivatives ETFs UCITs
122,752,125
- - - -
- - - -
Bonds Derivatives
Stock/Index
Options & Futures
8,318,660
-
Financial figures 2016
Main financial results 2016
EUR '000178
7489
208
8763
4660
122121133
4859
160
90
0
40
80
120
160
200
240
2012 2013 2014 2015 2016
EU
R m
illio
ns
Revenues, Costs and EBITDA2012 - 2016
Revenues Costs EBITDA
27%
70%
3%
Cost Breakdown 2016
Personnel
Other operating
Depreciation andamortisation
100%
Revenue Breakdown 2016
Derivatives Trading

FESE EUROPEAN EXCHANGE REPORT 2017 Page 16 of 27
The Federation of European Securities Exchanges AISBL (FESE) shall not be liable for any errors or omissions nor for the use of the information contained in this document.
THE IRISH STOCK EXCHANGE
Name The Irish Stock Exchange PLC Type of Company Mutual company (co-operative principle)
For profit
Address 28 Anglesea Street Dublin 2 Listed No
Phone +353 (1) 617 4200 Sectors Cash EU regulated market
Fax +353 (1) 677 6045 Cash EU not regulated (exchange regulated) markets
Email [email protected] Listing of Equity, Debt and Investment Funds
Website www.ise.ie
Year established 1793
Year of current legal status 2014
Country of Incorporation Ireland Number of employees 124 (end of year)
Active in Ireland, Malta
Electronic Order Off Reporting Electronic Order Off Electronic Order Off Electronic Order Off
Book Trades EOB Trades Book Trades EOB Book Trades EOB Book Trades EOB
Turnover (EUR m) 23,543 21,191 - - - 3 1 - -
Trades 3,217,679 72,807 - - - 395 60 - -
Market Cap. (EUR m)
Listed companies
Electronic Order Off Bond
Book Trades EOB Options & FuturesCommodities
Turnover (EUR m) - 102,600 Notional Turnover (EUR m) - -
Trades - 53,485 Contracts Traded - -
Listings
Revenues 29,220
Costs 20,012
EBITDA 9,653
EBIT 9,208
Net Income 7,967
Footnotes
Financial figures are under IFRS financial accounting protocol
Notes
Figures mentioned include subsidiaries.
Trading figures 2016Equity
-
Derivatives
5,765
Sec. Derivatives UCITsETFsShares
EUR '000
Main financial results 2016
-113,849
51
-
Bonds
-
-
Financial figures 2016
-
29,039
215
Stock/Index
Options and Futures
20 23
25 28
29
15 17 1920 20
7 87
810
0
5
10
15
20
25
30
35
2012 2013 2014 2015 2016
EU
R m
illio
ns
Revenues, Costs and EBIT2012 - 2016
Revenues Costs EBITDA
60%
17%
21%
2%
Cost Breakdown 2016
Personnel
ICT 4)
Other operating
Depreciation andamortisation
68%
11%
14%
7%
Revenue Breakdown 2016
Listing (admission +ongoing)
Cash Trading
Info products & services
Other (advert., educat.,properties)

FESE EUROPEAN EXCHANGE REPORT 2017 Page 17 of 27
The Federation of European Securities Exchanges AISBL (FESE) shall not be liable for any errors or omissions nor for the use of the information contained in this document.
LONDON METAL EXCHANGE
Name The London Metal Exchange Type of Company Joint-stock company
Private Limited Company
Address 56 Leadenhall Street, London, EC3A 2DX, UK For profit with explicit profit-cap
Phone +44 (0)20 7264 5555 Listed Parent Company Listed on Hong Kong Stock Exchange
Fax +44 (0)20 7680 0505 Sectors Derivatives markets
Website www.lme.com
Year established 1877
Year of current legal status 1987
Country of Incorporation England Number of employees 229 (end of year)
Active in United Kingdom
Electronic Order Off Reporting Electronic Order Off Electronic Order Off Electronic Order Off
Book Trades EOB Trades Book Trades EOB Book Trades EOB Book Trades EOB
Turnover (EUR m) - - - - - - - - -
Trades - - - - - - - - -
Market Cap. (EUR m)
Listed companies
Electronic Order Off Bond
Book Trades EOB Options & Futures Commodities
Turnover (EUR m) - - Notional Turnover (EUR m) - 8,880,951
Trades - - Contracts Traded - 149,410,176
Listings
Revenues 183,128
Costs 69,793
EBITDA 113,335
EBIT 93,877
Net Income 74,567
Footnotes
Financial figures under IFRS financial accounting protocol
Notes
Figures mentioned include subsidiaries.
Trading figures 2016Equity
Shares Sec. Derivatives ETFs UCITs
-
- - - -
- - - -
Bonds Derivatives
Stock/Index
Options and Futures
-
-
Financial figures 2016
Main financial results 2016
EUR '000
100
143136
223
183
8264
93 8270
18
79
43
141113
0
40
80
120
160
200
240
2012 2013 2014 2015 2016
EU
R M
illio
ns
Revenues, Costs and EBITDA2012- 2016
Revenues Costs EBITDA
37%
20%
22%
21%
Cost Breakdown 2016
Personnel
ICT
Depreciation andamortisation
Other costs
78%
13%
9%
Revenue Breakdown 2016
Derivatives Trading
ICT services
Other (advert., educat.,properties)
FESE EUROPEAN EXCHANGE REPORT 2017 Page 18 of 27
The Federation of European Securities Exchanges AISBL (FESE) shall not be liable for any errors or omissions nor for the use of the information contained in this document.
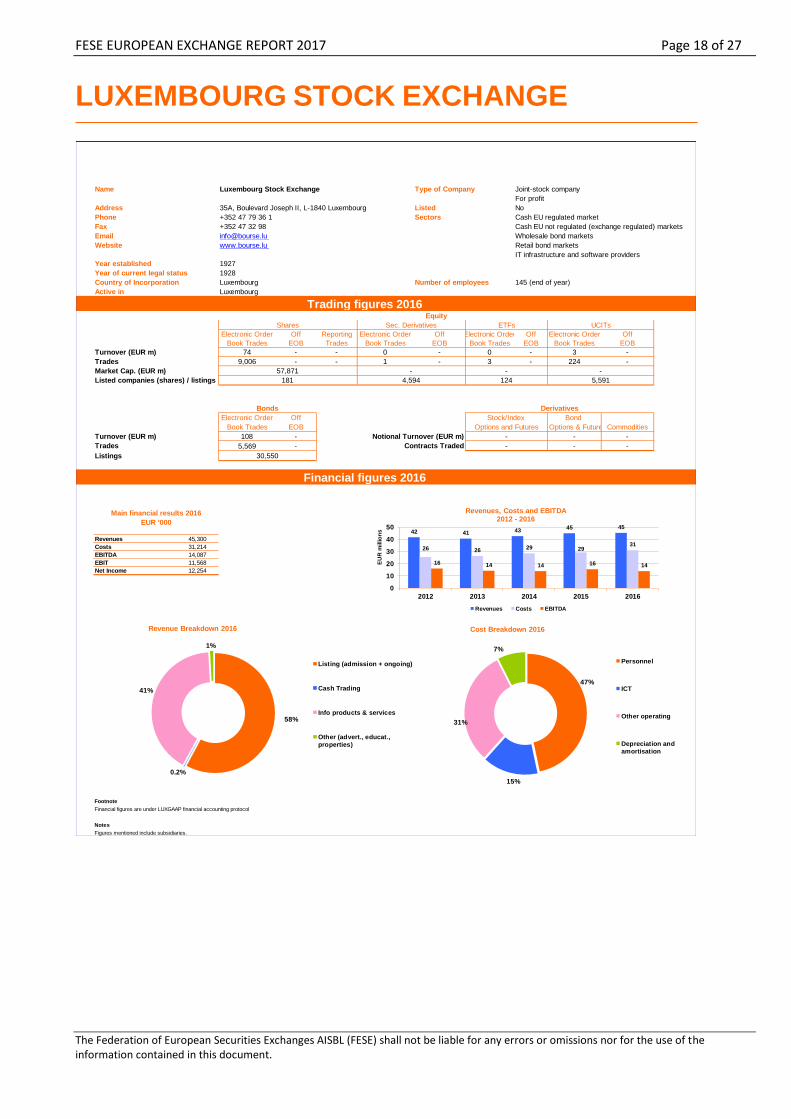
LUXEMBOURG STOCK EXCHANGE
Name Luxembourg Stock Exchange Type of Company Joint-stock company
For profit
Address 35A, Boulevard Joseph II, L-1840 Luxembourg Listed No
Phone +352 47 79 36 1 Sectors Cash EU regulated market
Fax +352 47 32 98 Cash EU not regulated (exchange regulated) markets
Email [email protected] Wholesale bond markets
Website www.bourse.lu Retail bond markets
IT infrastructure and software providers
Year established 1927
Year of current legal status 1928
Country of Incorporation Luxembourg Number of employees 145 (end of year)
Active in Luxembourg
Electronic Order Off Reporting Electronic Order Off Electronic Order Off Electronic Order Off
Book Trades EOB Trades Book Trades EOB Book Trades EOB Book Trades EOB
Turnover (EUR m) 74 - - 0 - 0 - 3 -
Trades 9,006 - - 1 - 3 - 224 -
Market Cap. (EUR m)
Listed companies (shares) / listings
Electronic Order Off Bond
Book Trades EOB Options & FuturesCommodities
Turnover (EUR m) 108 - Notional Turnover (EUR m) - -
Trades 5,569 - Contracts Traded - -
Listings
Revenues 45,300
Costs 31,214
EBITDA 14,087
EBIT 11,568
Net Income 12,254
Footnote
Financial figures are under LUXGAAP financial accounting protocol
Notes
Figures mentioned include subsidiaries.
Stock/Index
EUR '000
Main financial results 2016
30,550
Options and Futures
Financial figures 2016
-
-
DerivativesBonds
Trading figures 2016Equity
181
Shares
57,871 -
5,591
-
UCITsETFs
-
4,594 124
Sec. Derivatives
42 41 4345 45
26 26 29 2931
16 14 14 16 14
0
10
20
30
40
50
2012 2013 2014 2015 2016
EU
R m
illio
ns
Revenues, Costs and EBITDA2012 - 2016
Revenues Costs EBITDA
47%
15%
31%
7%
Cost Breakdown 2016
Personnel
ICT
Other operating
Depreciation andamortisation
58%
0.2%
41%
1%
Revenue Breakdown 2016
Listing (admission + ongoing)
Cash Trading
Info products & services
Other (advert., educat.,properties)

FESE EUROPEAN EXCHANGE REPORT 2017 Page 19 of 27
The Federation of European Securities Exchanges AISBL (FESE) shall not be liable for any errors or omissions nor for the use of the information contained in this document.
MALTA STOCK EXCHANGE
Name Malta Stock Exchange PlC Type of Company Public sector (State) entity - MSE Plc is now a company
For profit
Address Garrison Chapel Castille Place Valetta CMR01 Listed No
Phone +356 21244051 Sectors Cash EU regulated market
Fax +356 25696316 Cash EU not regulated (exchange regulated) markets
Email [email protected] Wholesale bond markets
Website www.borzamalta.com.mt Retail bond market
Central Securities Depositories / Settlement companies
Year established 1990
Year of current legal status 2007
Country of Incorporation Malta Number of employees 59 (end of year)
Active in Malta
Electronic Order Off Reporting Electronic Order Off Electronic Order Off Electronic Order Off
Book Trades EOB Trades Book Trades EOB Book Trades EOB Book Trades EOB
Turnover (EUR m) 78 - - - - - - - -
Trades 10,092 - - - - - - - -
Market Cap. (EUR m)
Listed companies
Electronic Order Off Bond
Book Trades EOB Options & FuturesCommodities
Turnover (EUR m) 610 - Notional Turnover (EUR m) - -
Trades 23,920 - Contracts Traded - -
Listings
Revenues 7,281
Costs 3,760
EBITDA 3,522
EBIT 3,522
Net Income 2,349
Footnote
Financial figures refer to the exchange and not to the parent company owning the exchange
Financial figures are under IFRS financial accounting standards
Notes
Figures mentioned include subsidiaries.
EUR '000
Main financial results 2016
128
Stock/Index
Financial figures 2016
-
-
Trading figures 2016
Sec. Derivatives UCITsETFs
-
Equity
-
Shares
4,212
23
-
-
Options and Futures
Derivatives
-
Bonds
-
4.85.1
6.3 6.47.3
2.93.1 3.5 3.7 3.8
1.9 2.02.8 2.7
3.5
0123456789
10
2012 2013 2014 2015 2016
EU
R m
illio
ns
Revenues, Costs and EBITDA2012 - 2016
Revenues Costs EBITDA
48%
45%
7%
Cost Breakdown 2016
Personnel
Other operating
Depreciationand amortisation
67%
9%
24%
Revenue Breakdown 2016
Listing (admission +ongoing)
Membership
Clearing / Settlement /CSD

FESE EUROPEAN EXCHANGE REPORT 2017 Page 20 of 27
The Federation of European Securities Exchanges AISBL (FESE) shall not be liable for any errors or omissions nor for the use of the information contained in this document.
NASDAQ GROUP INC.
Name NASDAQ Nordic Ltd Type of Company Joint-stock company
Consolidated figures For profit
Address
Listed
(European Corp. Headquarter) Fabianinkatu 14 Sectors Cash EU regulated market
Phone +358 9 616671 Cash EU not regulated (exchange regulated) markets
Fax +358 9 298 2340 Derivatives markets
Email [email protected] Wholesale bond markets
Website http://www.nasdaqomxnordic.com Clearing houses / CCP services providers
Year established 1997 Central Securities Depositories
Year of current legal status 1997 Companies managing settlement
IT infrastructure and software providers
Country of Incorporation Finland Number of employees 381 (average in Europe)
Active in Europe in Denmark, Estonia, Finland, Iceland, Latvia, Lithuania, Norway, Sweden
Electronic Order Off Reporting Electronic Order Off Electronic Order Off Electronic Order Off
Book Trades EOB Trades Book Trades EOB Book Trades EOB Book Trades EOB
Turnover (EUR m) 643,951 62,841 19,381 1,385 - 8,672 2,434 6,183 30,853
Trades 115,437,776 1,257,076 741,348 809,921 - 563,631 3,869 396,857 1,363,921
Market Cap. (EUR m)
Listed companies
Electronic Order Off Bond
Book Trades EOB Options & Futures Commodities
Turnover (EUR m) 6,060 1,545,949 Notional Turnover (EUR m) 2,231,448 -
Trades 95,786 0 Contracts Traded 21,081,809 -
Listings
1452635.8
13450664
Revenues 332,000
Costs 128,000
EBITDA 204,000
EBIT 171,000
Net Income 130,000
Footnotes
Financial figures are under Finnish accounting protocol (quite in line with IFRS)
*Costs do not include depreciation and amortisation
Notes
Figures are NASDAQ Ltd consolidated figures
EUR '000
Main financial results 2016
7,691
Trading figures 2016
Financial figures 2016
Sec. Derivatives UCITsETFs
Bonds
Equity
762,958
Options and Futures
81,337,010
Derivatives
Stock/Index
Shares
1,185,897
938
-
6,361
Listed on a regulated market managed by itself (The
NASDASQ Group, Inc., the ultimate parent)
84,124
443
-
36
282 293 303315
332
124 136140
123 128158 158 163
192 204
0
50
100
150
200
250
300
350
2012 2013 2014 2015 2016
EU
R m
illio
ns
Revenues, Costs and EBITDA2012 - 2016
Revenues Costs excl depriciation and amortization EBITDA
29 %
23 %21 %
28 %
Cost Breakdown 2016
Personnel
ICT
Depreciation andamortisation
Other costs
17 %
58 %
20 %
5 %
Revenue Breakdown 2016
Listing (admission +ongoing)
Cash Trading incl derivativestrading
Info products & services
Other (advert., educat.,properties)
FESE EUROPEAN EXCHANGE REPORT 2017 Page 21 of 27
The Federation of European Securities Exchanges AISBL (FESE) shall not be liable for any errors or omissions nor for the use of the information contained in this document.
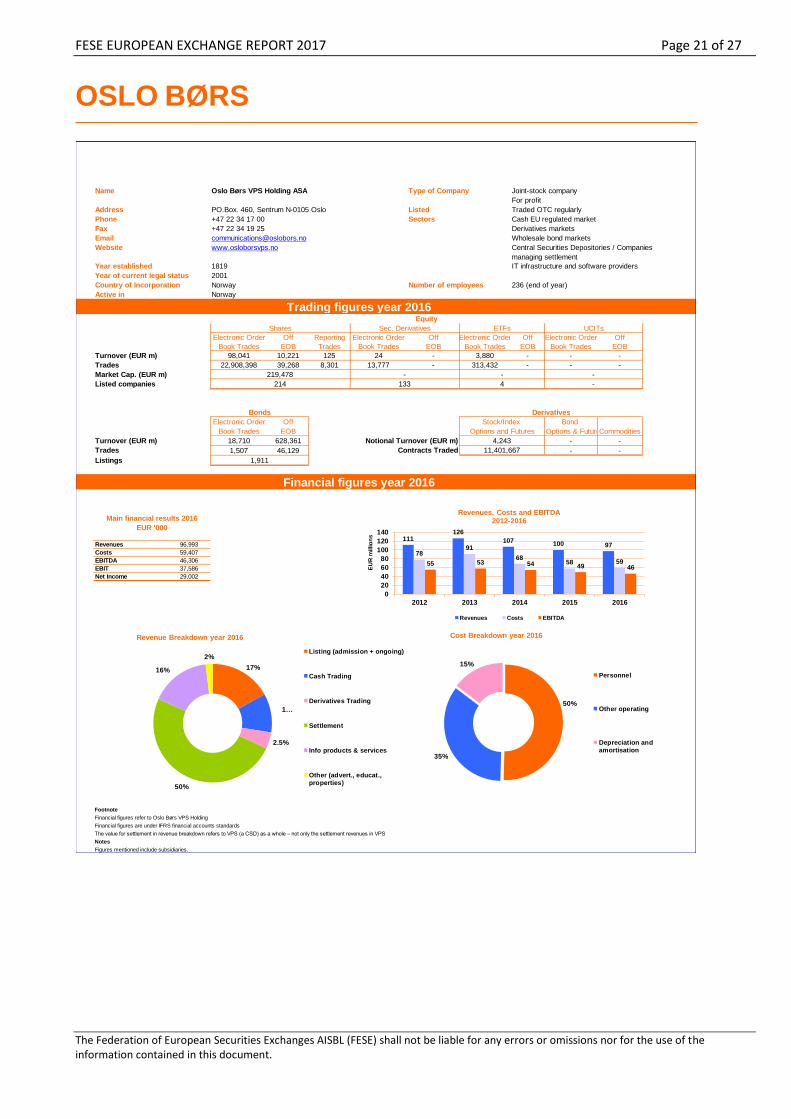
OSLO BØRS
Name Oslo Børs VPS Holding ASA Type of Company Joint-stock company
For profit
Address PO.Box. 460, Sentrum N-0105 Oslo Listed Traded OTC regularly
Phone +47 22 34 17 00 Sectors Cash EU regulated market
Fax +47 22 34 19 25 Derivatives markets
Email [email protected] Wholesale bond markets
Website www.osloborsvps.no Central Securities Depositories / Companies
managing settlement
Year established 1819 IT infrastructure and software providers
Year of current legal status 2001
Country of Incorporation Norway Number of employees 236 (end of year)
Active in Norway
Electronic Order Off Reporting Electronic Order Off Electronic Order Off Electronic Order Off
Book Trades EOB Trades Book Trades EOB Book Trades EOB Book Trades EOB
Turnover (EUR m) 98,041 10,221 125 24 - 3,880 - - -
Trades 22,908,398 39,268 8,301 13,777 - 313,432 - - -
Market Cap. (EUR m)
Listed companies
Electronic Order Off Bond
Book Trades EOB Options & FuturesCommodities
Turnover (EUR m) 18,710 628,361 Notional Turnover (EUR m) - -
Trades 1,507 46,129 Contracts Traded - -
Listings
Revenues 96,993
Costs 59,407
EBITDA 46,306
EBIT 37,586
Net Income 29,002
Footnote
Financial figures refer to Oslo Børs VPS Holding
Financial figures are under IFRS financial accounts standards
The value for settlement in revenue breakdown refers to VPS (a CSD) as a whole – not only the settlement revenues in VPS
Notes
Figures mentioned include subsidiaries.
Stock/Index
214
Bonds
Financial figures year 2016
Sec. Derivatives UCITs
4,243
11,401,667
-
Derivatives
-
EUR '000
Main financial results 2016
1,911
Options and Futures
Trading figures year 2016Equity
-
ETFs
-
133 4
Shares
219,478
111126
107 100 97
7891
6858 5955 53 54 49 46
0
20
40
60
80
100
120
140
2012 2013 2014 2015 2016
EU
R m
illio
ns
Revenues, Costs and EBITDA2012-2016
Revenues Costs EBITDA
50%
35%
15%
Cost Breakdown year 2016
Personnel
Other operating
Depreciation andamortisation
17%
1…
2.5%
50%
16%
2%
Revenue Breakdown year 2016
Listing (admission + ongoing)
Cash Trading
Derivatives Trading
Settlement
Info products & services
Other (advert., educat.,properties)

FESE EUROPEAN EXCHANGE REPORT 2017 Page 22 of 27
The Federation of European Securities Exchanges AISBL (FESE) shall not be liable for any errors or omissions nor for the use of the information contained in this document.
SIX GROUP
SIX SWISS EXCHANGE
Name SIX Group Type of Company Joint-stock company
SIX Swiss Exchange For profit
Listed No
Address Pfingstweidstrasse 110 8021 Zürich Sectors Cash CH regulated market / Cash EU not regulated (exchange regulated) markets
Email [email protected] Derivatives markets (securitised derivatives only)
Websites www.six-swiss-exchange.com Retail bond markets
Year established 1993 CCP, Central Securities Depository and Custodian Services
Year of current legal status 2008 IT infrastructure and software providers (for
Country of Incorporation Switzerland SIX Swiss Exchange and SIX Structured Products Exchange AG)
Active in Switzerland, Germany Data vending, credit card solutions, electronic payment processing
Number of employees 163 (end of the year)
Electronic Order Off Reporting Electronic Order Off Electronic Order Off Electronic Order Off
Book Trades EOB Trades Book Trades EOB Book Trades EOB Book Trades EOB
Turnover (EUR m) 782,501 6,667 120,855 10,659 4,361 53,095 42,158 5,097 941
Trades 44,668,529 2,046 567,350 652,482 14,319 938,489 23,344 244,077 1,501
Market Cap. (EUR m) (Swiss Exch.)
Listed companies (shares) / listings
Electronic Order Off Bond
Book Trades EOB Options & Futures
Turnover (EUR m) 17,914 122,527 Notional Turnover (EUR m) - -
Trades 314,784 86,964 Contracts Traded - -
Listings
Revenues 172,923
Costs 108,634
EBITDA 64,363
EBIT 63,541
Net Income n/a
Footnotes
Figures from 2012 do not include EUREX business.
Trading figures 2016Equity
Sec. DerivativesShares UCITsETFs
Bonds
-
29,047
Options and Futures
Stock/Index
1,331,208
264
Derivatives
Commodities
33
-
1,098
-
-
EUR '000
Main financial results 2016
1'788
Financial figures 2016
158 161 166194
173
113104
98125 109
69 82
88
81 64
0
100
200
300
2012 2013 2014 2015 2016
EU
R m
illio
ns
Revenues, Costs and EBITDA2012 - 2016
Revenues Costs (excl. Depreciation) EBITDA
28%
1%71%
Cost Breakdown 2016
Personnel
Depreciation andamortisation
Other costs
11%
63%
20%
6%
Revenue Breakdown 2016
Listing (admission + ongoing)
Cash Trading
Info products & services
Other (advert., educat., properties)

FESE EUROPEAN EXCHANGE REPORT 2017 Page 23 of 27
The Federation of European Securities Exchanges AISBL (FESE) shall not be liable for any errors or omissions nor for the use of the information contained in this document.
WARSAW STOCK EXCHANGE (GPW)
Name Warsaw Stock Exchange (GPW) Type of Company Joint-stock company
For profit
Address Ksiazeca 4, 00-498 Warsaw Listed Listed on regulated market managed by itself
Phone +48 22 628 32 32 Sectors Cash EU regulated market
Fax +48 22 628 17 54 Cash EU not regulated (exchange regulated) markets
Email [email protected] Derivatives markets
Wholesale bond markets
Website www.gpw.pl Retail bond markets
Clearing houses / CCP services providers
Year established 1991 Commodity exchange / Commodity clearing house
Year of current legal status 1991
Country of Incorporation Poland Number of employees 340 (end of the year)
Active in Poland
Electronic Order Off Reporting Electronic Order Off Electronic Order Off Electronic Order Off
Book Trades EOB Trades Book Trades EOB Book Trades EOB Book Trades EOB
Turnover (EUR m) 43,665 4,315 - 204 - 43 - 14 2
Trades 18,433,084 8,322 - 127,113 - 12,883 - 6,141 8
Market Cap. (EUR m)
Listed companies
Electronic Order Off Bond
Book Trades EOB Options & FuturesCommodities
Turnover (EUR m) 539 176 Notional Turnover (EUR m) 111 -
Trades 68,622 123 Contracts Traded 4,307 -
Listings
Revenues 71,656
Costs 35,463
EBITDA 42,105
EBIT 36,193
Net Income 30,059
Footnotes
Operating revenues and costs (excluding financial revenues and costs)
Figures are under International Financial Reporting Standards (IFRS) protocol
Other Revenues include mainly revenues of TGE (the company operating the commodity exchange) from Certificate of Origin Register and trading of property rights in Certificates of Origin
Notes
Figures mentioned include subsidiaries.
566
Financial figures 2016
Main financial results 2016
EUR '000
6,708,494
130,988 - - 551
893 784 3 37
Bonds Derivatives
Stock/Index
Options and Futures
43,245
Trading figures 2016Equity
Shares Sec. Derivatives ETFs UCITs
68 6876 79
72
38 4045 42
3534 35 3943 42
0
20
40
60
80
100
2012 2013 2014 2015 2016
EU
R m
illio
n
Revenues, Costs and EBITDA2012 - 2016
Revenues Costs EBITDA
39%
44%
17%
Cost Breakdown 2016
Personnel
Other operating
Depreciation andamortisation
8%
34%
4%13%
41%
Revenue Breakdown 2016
Listing (admission +ongoing)
Cash Trading
Derivatives Trading
Info products & services
Other (advert., educat.,properties)

FESE EUROPEAN EXCHANGE REPORT 2017 Page 24 of 27
The Federation of European Securities Exchanges AISBL (FESE) shall not be liable for any errors or omissions nor for the use of the information contained in this document.
AFFILIATE MEMBERS

FESE EUROPEAN EXCHANGE REPORT 2017 Page 25 of 27
The Federation of European Securities Exchanges AISBL (FESE) shall not be liable for any errors or omissions nor for the use of the information contained in this document.
TEL AVIV STOCK EXCHANGE (TASE)
Name Tel-Aviv Stock Exchange Type of Company Mutual company (co-operative principle)
Not for profit
Address 2 Ahuzat Bayit St. Tel Aviv, 6525216 Listed On a regulated market managed by itself
Phone 972-76-8160411 TASE is currently undergoing a demutualisation process
Fax Sectors Derivatives markets
Email [email protected] Wholesale bond markets
Website www.tase.co.il Retail bond markets
4.2495 Central Securities Depositories / Companies
Year established 1953 managing settlement
Year of current legal status 1953 Clearing houses / CCP services providers
Country of Incorporation Israel Number of employees 234 (end of year)
Active in Israel
Electronic Order Off Reporting Electronic Order Off Electronic Order Off Electronic Order Off
Book Trades EOB Trades Book Trades EOB Book Trades EOB Book Trades EOB
Turnover (EUR m) 46,918 6,284 - - - 30,225 1,055 - -
Trades 12,440,273 70,382 - - - 2,058,610 2,671 - -
Market Cap. (EUR m)
Listed companies
Electronic Order Off Bond
Book Trades EOB Options & FuturesCommodities
Turnover (EUR m) 176,802 28,709 Notional Turnover (EUR m) - -
Trades 9,365,842 17,100 Contracts Traded - -
Listings Securities
Revenues 56,995
Costs 55,465
EBITDA 9,789
EBIT 1,530
Net Income 494
Footnote
Financial figures are under IFRS financial accounts standards
Notes
Figures mentioned include subsidiaries.
Bonds
Sec. Derivatives UCITs
1,422,174
52,101,804
-
Derivatives
136,243
Stock/Index
EUR '000
Main financial results 2016
685
Options and Futures
Financial figures year 2016
Trading figures year 2016Equity
-
ETFs
-
- 23
Shares
186,791
451
4650 51
6157
42
66
5055 55
9 9 813 10
0
10
20
30
40
50
60
70
2012 2013 2014 2015 2016
EU
R m
illio
ns
Revenues, Costs and EBITDA2012-2016
Revenues Costs EBITDA
52.9%
12.4%
19.6%
14.9%
0.1%
Cost Breakdown year 2016
Personnel
ICT
Other operating
Depreciation andamortisation
Other costs
17%
12%
2.5%
48%
3%
16%1.5%
Revenue Breakdown year 2016
Listing (admission + ongoing)
Cash Trading
Derivatives Trading
Clearing / CCP
Custody & Banking
Info products & services
Other (advert., educat.,properties)

FESE EUROPEAN EXCHANGE REPORT 2017 Page 26 of 27
The Federation of European Securities Exchanges AISBL (FESE) shall not be liable for any errors or omissions nor for the use of the information contained in this document.
NOTES ON METHODOLOGY Trading figures:
• Trading statistics follow the FESE Statistics Methodology: http://www.fese.eu/statistics-market-research/fese-statistics-methodology .
• Electronic Order Book Trades contain all transfers of ownership by way of trades automatically executed through the Exchanges' electronic order book.
• Off Electronic Order Book Trades include all other transfers of ownership by way of trades executed away from the electronic order book and involving at least one member / intermediary of an Exchange.
• Reporting Trades include trades reported through a Trade Reporting Facility (TRF) when only one counterparty provides information on the trade and offers dissemination services at the request of the reporting trader. Turnover methodology was reviewed in 2015 (FESE Statistics Methodology: http://www.fese.eu/statistics-market-research/fese-statistics-methodology).
• Market Capitalisation (Market Cap.) is the total number of issued shares of the company (including their several classes) multiplied by the respective share price at a given time. The total is the sum of the total market capitalisation of each domestic company admitted to listing included in the Exchange. The market capitalisation figures include:
▪ shares of domestic companies ▪ shares of foreign companies which are exclusively listed on an exchange, i.e. the foreign
company is not listed on any other exchange ▪ common and preferred shares ▪ shares without voting rights when available ▪ investment /participation certificates when available
The market capitalisation figures exclude: ▪ collective investment funds ▪ rights, warrants, convertible instruments ▪ options, futures ▪ foreign listed shares other than exclusively listed ones ▪ companies whose only business goal is to hold shares of other listed companies
• Turnover or share trading value is the total number of shares traded multiplied by their respective prices.
• Notional Turnover is an approximate measure of the value of the number of contracts traded expressed with reference to the underlying asset, enabling comparison between cash and derivatives trading and among different derivatives products. It is computed as the number of contracts traded multiplied by the assets underlying amount and value.
• All trading figures (value and number of transactions) are single counted in order to ensure data comparability.
General information and financial figures according to:
• Figures mentioned include subsidiaries.
• EBIT - Earnings before Interest and Taxes.
• EBITDA - Earnings before Interest, Taxes, Depreciation and Amortisation.
• ICT – Information and Communication Technologies Information sources
• Trading figures for year 2016 are taken from the FESE Statistics Database: http://www.fese.eu/statistics-market-research/historical-data .
• General information and financial figures for year 2016 are provided by FESE members.

FESE EUROPEAN EXCHANGE REPORT 2017 Page 27 of 27
The Federation of European Securities Exchanges AISBL (FESE) shall not be liable for any errors or omissions nor for the use of the information contained in this document.
CONTACT FESE Secretariat Sara Baldi Senior Policy Adviser Tel: +32 2 551 01 86 Email: [email protected]