European Demographic 2000–2019 (%) Data Sheet 2020
2
European Demographic Data Sheet 2020 Years of Good Life (YoGL) is a newly developed indicator that takes a demographic approach to directly measure multi- dimensional human well- being and its change over time. In the longer run, it can also be used as a cri- terion to assess whether societal development can be considered sustainable. In order to enjoy any qual- ity of life, one has to be alive; but since mere survival does not capture well-being, “years of good life” are made conditional on meeting minimum standards as depicted in the circular chart. Years of life are counted as “good” if they are spent above a threshold with respect to objectively observable condi- tions (being out of poverty, being without cognitive limitations, and having no serious physical disabilities), as well as subjective life satisfaction. In Europe, YoGL varies considerably between countries – par- ticularly for older age groups. In 2017, Swiss men aged 50 could expect to live another 33.1 years, of which 28.5 are considered “good” years (86 %). By contrast, Lithuanian men of the same age could only expect to live another 24.8 years, of which only 12.1 years are considered “good” years (49 %). Generally, South- ern and Western European countries such as Spain, Italy, France, and Switzerland have exceptionally high life expectancy at age 50. However, it is mostly Northern European coun- tries, but also Switzerland and Belgium, whose populations are expected to spend their remaining life years to a great extent in good years. Central and Eastern European countries have both low life expectancy and low YoGLs. While male life expectancy is consistently lower than female life expectancy, gender differences in YoGL are less pronounced: YoGL at age 50 for the EU-27 in 2017 was 22.4 for females (life expectancy of 35 years) and 21.4 for males (life expectancy of 30.2 years). References: Lutz W., Lijadi A., Strießnig E., Dimitrova A., and Caldeira Brant de Souza Lima M. (2018). Years of Good Life (YoGL): A new in- dicator for assessing sustainable progress. IIASA Working Paper, WP-18-007. Reiter, C., and Lutz, W. (2020). Survival and Years of Good Life in Finland in the very long run. Finnish Yearbook of Population Research, 54, 1–27. Years of Good Life: A novel indicator to measure well-being Data, rankings, maps, definitions, sources and notes: www.populationeurope.org Authors: Authors: Tomáš Sobotka and Kryštof Zeman (data collection and coordination). Copy editing: Nicholas Gailey. Administrative assistance: Lisa Janisch. Graphic design: Christian Högl, creativbox.at. Authors of thematic boxes and indicators are listed on the reverse side (first box) and in the online version at www.populationeurope.org Suggested citation: Vienna Institute of Demography (VID) and International Institute for Applied Systems Analysis (IIASA). 2020. European Demographic Datasheet 2020. Wittgenstein Centre for Demography and Global Human Capital, Vienna. Available at www.populationeurope.org. Note: The Data Sheet does not cover European countries with population below 100 thousand (Andorra, Liechtenstein, Monaco, and San Marino). Data for Azerbaijan, Cyprus, Georgia, Moldova, and Ukraine exclude territories that are not under government control. For data sources, country-specific definitions and notes see www.populationeurope.org Human life indicator expresses well-being in terms of years of life, similar to life expectancy at birth, taking the inequality in longevity into account. Other non-standard indicators are explained in the specific boxes. More detailed definitions of all indicators are available at www.populationeurope.org Population – Well-being – Human Capital Observed and projected population trends in Europe, 2000–2040 2000–2019 (%) 2019–2040 (%) 8 to 42 4 to 8 0 to 4 -4 to 0 -8 to - 4 -33 to -8 Total population change Natural population change Net migration Percentage change Capable Longevity (out of poverty and no severe cognitive or physical limitations) Years of Good Life (YoGL) Years with positive life satisfaction Years of Life = Being Alive = Life Expectancy Bulgaria Hungary Romania Latvia Slovakia Croatia Lithuania Czechia Poland Estonia Denmark Germany Greece EU-27 Austria Cyprus Slovenia Sweden Belgium Luxembourg Finland Malta Portugal Italy Switzerland France Spain Latvia Bulgaria Lithuania Hungary Romania Slovakia Estonia Poland Croatia Czechia Slovenia EU-27 Portugal Germany Greece Denmark Finland Belgium Austria Cyprus Luxembourg France Spain Malta Italy Sweden Switzerland 0 10 20 30 40 0 10 20 30 40 Years of Life Years of Good Life Women Men Total population change (%) 2000-2019 Proportion of foreign-born population (%) 1.1.2019 Completed cohort fertility women born 1978 Cohort childlessness (%) women born 1978 Life expectancy at birth (years), Women 2018 Human life indicator (years) 2015-2020 European Union Cyprus Malta Iceland Ireland Luxembourg Moldova Lithuania Latvia Bulgaria Ukraine 4 -26 -20 -19 -15 -15 27 27 28 30 42 Bosnia Albania Poland Bulgaria Moldova European Union Austria Malta Cyprus Switzerland Luxembourg 1 2 2 2 3 11 19 20 21 29 47 Spain Italy Romania Greece Poland European Union Norway Ireland France Iceland Albania 1.36 1.43 1.50 1.51 1.51 1.65 1.98 2.03 2.06 2.24 2.29 Iceland Belarus Norway Russia Denmark European Union Finland Germany Italy Greece Spain 9 12 12 12 13 19 21 21 21 24 25 Moldova Russia Ukraine Serbia Bulgaria European Union Cyprus France Italy Switzerland Spain 75.0 77.6 78.0 78.4 78.6 83.8 84.8 85.5 85.6 85.7 86.3 Moldova Ukraine Russia N.Macedonia Bulgaria European Union Sweden Switzerland Italy Iceland Spain 65.3 66.8 67.5 69.9 70.5 78.3 80.3 80.7 80.8 80.9 81.0 Country rankings (top 5 and bottom 5 countries) Remaining years of life at age 50 Note: Ranking plots include European countries only. They exclude countries with population below 100 thousand, Turkey, Armenia, Azerbaijan and Georgia, and countries for which the particular indicator is not available. Country Popu- lation (millions) Popu- lation (millions) Total population change ( %) Natural population change ( %) Net migration ( %) Projected population SSP2 Projected population SSP2 – Zero migration Proportion of foreign- born population ( %) Old-age dependency ratio 65+/20–64 (%) Total fertility rate (TFR) Tempo and parity adjusted TFR Mean age at first birth (years) Completed cohort fertility Cohort childless- ness ( %) Life expectancy at birth (years), Women Life expectancy at birth (years), Men Change in life expectancy (years) Years of good life at age 50, Women Years of good life at age 50, Men Human life indicator (years) Aggregate crude internal migration intensity Mean years of schooling Skills- adjusted mean years of schooling Inequality- adjusted healthy life- time income (M$PC) Equivalised income ( % change), age 20–39 Relative equivalised income ( % change), age 20–39 Country 1.1.2019 1.1.2000 2000–2019 2000–2019 2000–2019 2060 2060 1.1.2019 1.1.2019 2018 2016 2018 Women born 1978 Women born 1978 2018 2018 Change 2014–2018 2017 2017 2015–2020 various years 2015 2015 2016 Change 2008–2017 Change 2008–2017 Albania 2.9 3.1 -6 12 -19 1.9 2.8 2 23 1.73 – 26.4 2.29 – 80.5 77.4 0.7 – – 73.6 13.7 10.6 8.4 0.5 – – Albania Armenia 3.0 3.2 -8 7 -15 2.2 2.9 6 19 1.57 1.72 24.8 2.16 10 79.7 73.4 – – – 68.9 15.3 11.0 10.7 0.3 – – Armenia Austria 8.9 8.0 11 0 10 9.4 7.5 19 30 1.47 1.63 29.5 1.64 20 84.1 79.4 0.2 25.8 24.7 78.5 8.2 12.2 12.5 2.3 3 -3 Austria Azerbaijan 10.0 8.0 25 22 2 10.2 10.7 3 11 1.73 – 23.9 1.87 – 78.3 73.5 1.2 – – 63.6 – 11.0 10.6 0.7 – – Azerbaijan Belarus 9.5 10.0 -5 -6 0 8.3 7.7 11 24 1.45 1.84 25.8 1.66 12 79.5 69.3 1.2 – – 71.4 5.7 11.6 12.3 0.8 – – Belarus Belgium 11.5 10.2 12 3 9 12.8 11.1 17 32 1.62 1.85 29.0 1.90 – 83.9 79.4 0.3 26.1 25.0 78.6 10.3 11.9 12.5 2.3 5 -1 Belgium Bosnia and Herzegovina 3.3 3.8 -12 0 -12 1.7 2.9 1 – – – – 1.77 18 – – – – – 73.2 14.5 11.2 10.9 0.5 – – Bosnia and Herzegovina Bulgaria 7.0 8.2 -15 -9 -5 4.5 5.3 3 36 1.56 1.74 26.2 1.67 – 78.6 71.5 0.5 13.3 14.0 70.5 4.5 11.7 12.3 0.8 12 -6 Bulgaria Croatia 4.1 4.5 -9 -5 -5 3.4 3.4 13 34 1.47 1.76 28.8 1.69 18 81.5 74.9 0.3 15.6 15.5 75.1 2.7 12.0 12.7 1.1 14 4 Croatia Cyprus 0.9 0.7 27 10 17 – – 21 26 1.32 1.50 29.8 1.82 – 84.8 80.9 0.6 19.6 20.6 78.0 3.8 13.0 13.4 1.6 -19 -7 Cyprus Czechia 10.6 10.3 4 0 4 9.7 9.1 5 33 1.71 1.67 28.4 1.71 14 82.0 76.2 0.2 20.2 19.8 76.9 4.2 13.0 13.6 1.6 12 3 Czechia Denmark 5.8 5.3 9 3 6 6.5 5.8 12 34 1.73 1.88 29.5 1.92 13 82.9 79.1 0.3 28.1 26.0 77.9 14.8 12.6 13.0 2.5 3 -5 Denmark Estonia 1.3 1.4 -5 -3 -2 1.2 1.1 15 33 1.67 1.93 27.7 1.87 14 82.7 74.0 1.1 18.7 14.5 75.8 4.8 13.3 13.9 1.3 35 -1 Estonia Finland 5.5 5.2 7 2 4 5.7 5.5 7 38 1.41 1.84 29.2 1.87 21 84.5 79.1 0.5 28.1 25.3 79.3 16.3 13.0 14.3 2.2 -3 -5 Finland France 64.8 60.5 7 7 0 76.2 68.4 13 36 1.88 2.08 28.7 2.06 15 85.5 79.6 0.0 25.9 23.7 79.5 18.8 12.1 12.1 2.0 1 -1 France Georgia 3.7 4.4 -16 3 -19 2.3 3.7 2 25 2.09 – 25.5 1.92 – 78.2 69.7 -0.1 – – 67.9 15.8 12.7 11.8 0.4 – – Georgia Germany 83.0 82.2 1 -4 5 79.6 66.1 16 36 1.57 1.66 29.7 1.61 21 83.3 78.6 -0.2 25.4 23.2 78.2 9.0 13.7 14.1 2.3 7 -1 Germany Greece 10.7 10.8 0 -1 1 10.8 9.5 12 38 1.35 1.49 30.4 1.51 24 84.4 79.3 0.4 20.7 21.5 79.2 8.1 11.8 11.4 1.2 -40 -6 Greece Hungary 9.8 10.2 -4 -7 2 8.0 7.6 6 32 1.49 1.54 28.2 1.60 – 79.6 72.7 0.2 14.9 16.7 73.6 8.6 12.4 12.5 1.2 -7 3 Hungary Iceland 0.4 0.3 28 16 12 0.4 0.4 17 23 1.71 2.09 28.3 2.24 9 84.5 81.3 0.0 – – 80.9 19.1 13.6 12.9 2.6 -13 -1 Iceland Ireland 4.9 3.8 30 18 11 5.7 5.5 17 24 1.75 2.06 30.5 2.03 15 84.1 80.5 0.9 – – 79.4 8.1 12.6 12.8 3.1 -4 -6 Ireland Italy 60.4 56.9 6 -2 8 53.3 48.4 10 39 1.29 1.47 31.2 1.43 21 85.6 81.2 0.2 22.3 23.0 80.8 5.1 11.9 11.3 1.7 -9 -6 Italy Kosovo 1.8 2.0 -10 22 -33 – – – 14 – – 26.9 – – 81.6 75.9 – – – – – – – – – – Kosovo Latvia 1.9 2.4 -19 -8 -12 1.6 1.5 13 34 1.60 1.78 27.2 1.67 18 79.7 70.1 0.6 15.5 13.6 71.5 5.1 12.6 13.6 1.0 24 5 Latvia Lithuania 2.8 3.5 -20 -6 -14 2.1 2.4 5 33 1.63 1.90 27.8 1.79 13 80.7 70.9 1.3 14.5 12.1 71.6 5.5 13.5 13.7 1.2 21 -1 Lithuania Luxembourg 0.6 0.4 42 8 33 0.9 0.6 47 22 1.38 1.74 30.9 1.81 – 84.6 80.1 0.0 24.0 23.6 79.4 – 13.2 12.7 4.9 9 -3 Luxembourg Malta 0.5 0.4 27 4 23 0.4 0.4 20 30 1.23 1.56 29.2 – – 84.6 80.4 0.4 23.2 22.9 78.7 4.7 11.2 9.6 1.9 6 6 Malta Moldova 2.7 3.6 -26 -2 -25 – – 3 22 1.82 – – – – 75.0 66.2 – – – 65.3 – 11.1 10.2 0.3 – – Moldova Montenegro 0.6 0.6 3 6 -3 0.6 0.6 11 25 1.76 – – 1.95 19 79.3 74.5 0.4 – – 74.0 14.4 12.0 12.0 0.8 – – Montenegro Netherlands 17.3 15.9 9 5 4 18.4 16.6 13 33 1.59 1.85 30.0 1.78 16 83.4 80.3 0.1 – – 79.7 8.8 12.4 13.4 2.5 5 1 Netherlands North Macedonia 2.1 2.0 3 5 -2 1.6 1.9 6 22 1.42 1.57 26.9 1.91 – 78.8 74.6 1.2 – – 69.9 1.0 10.6 9.6 0.6 – – North Macedonia Norway 5.3 4.5 19 7 12 6.7 5.8 16 29 1.56 1.97 29.5 1.98 12 84.5 81.1 0.6 – – 79.9 13.1 13.1 13.9 3.5 -6 -4 Norway Poland 38.0 38.3 -1 0 -1 31.9 33.3 2 28 1.46 1.45 27.4 1.51 – 81.7 73.7 -0.1 17.7 16.0 75.2 1.3 13.0 13.2 1.3 10 1 Poland Portugal 10.3 10.2 0 -1 2 8.3 8.6 9 37 1.42 1.62 29.8 1.57 – 84.5 78.3 0.2 19.1 21.4 79.0 11.2 9.3 8.3 1.3 -1 -1 Portugal Romania 19.4 22.5 -14 -4 -9 12.9 15.7 3 31 1.76 1.87 26.7 1.50 – 79.2 71.7 0.3 14.6 14.4 71.3 1.7 11.7 11.5 1.0 22 3 Romania Russia 146.8 146.9 0 -5 5 131.7 117.5 8 24 1.58 1.86 25.9 1.67 12 77.6 67.6 1.0 – – 67.5 2.0 10.9 11.4 1.0 – – Russia Serbia 7.0 7.5 -7 -8 1 – – 9 34 1.49 1.64 28.1 1.72 – 78.4 73.5 0.5 – – 72.2 – 12.1 12.2 0.7 – – Serbia Slovakia 5.5 5.4 1 1 0 4.7 4.9 4 25 1.54 1.50 27.1 1.64 17 80.8 73.9 0.4 18.9 18.5 73.6 2.7 13.2 13.8 1.5 11 -5 Slovakia Slovenia 2.1 2.0 5 1 4 2.1 1.8 13 33 1.60 1.62 28.8 1.64 17 84.4 78.5 0.3 21.3 19.9 78.8 2.5 12.2 11.9 1.6 -2 -2 Slovenia Spain 46.9 40.5 16 3 13 47.6 40.2 14 32 1.26 1.43 31.0 1.36 25 86.3 80.7 0.2 21.7 20.7 81.0 3.1 11.5 11.0 1.6 -14 -4 Spain Sweden 10.2 8.9 15 3 12 12.4 10.5 19 35 1.76 1.99 29.3 1.94 14 84.3 80.9 0.3 28.6 27.0 80.3 13.9 12.8 13.6 2.5 8 -4 Sweden Switzerland 8.5 7.2 19 4 15 10.4 8.0 29 30 1.52 1.64 30.9 1.65 18 85.7 81.9 0.5 30.1 28.5 80.7 10.7 13.4 14.0 3.0 44 -3 Switzerland Turkey 82.0 66.9 23 25 -2 95.8 95.1 7 15 1.99 – 26.3 – – 81.6 76.2 0.8 – – 71.4 7.1 9.2 7.9 0.9 – – Turkey Ukraine 42.0 49.1 -15 -10 -5 36.2 33.9 11 26 1.30 1.50 25.4 1.57 14 78.0 68.1 1.4 – – 66.8 2.6 11.0 11.3 0.4 – – Ukraine United Kingdom 66.6 58.8 13 5 8 76.8 69.4 14 32 1.68 1.99 29.0 1.94 18 83.1 79.5 -0.1 – – 78.0 10.6 13.3 13.8 1.9 7 -2 United Kingdom European Union (27) 444.7 428.6 4 0 4 430.1 390.8 11 34 1.54 1.69 29.4 1.65 19 83.8 78.3 0.1 22.4 21.4 78.3 8.2 12.4 12.5 1.8 1 -2 European Union (27) United States 328.2 282.2 16 10 6 411.6 349.5 15 28 1.73 2.16 27.3 2.21 11 81.1 76.1 -0.4 – – 74.1 14.7 12.9 13.3 2.3 – – United States Japan 126.3 125.6 1 -1 2 100.4 97.4 2 51 1.42 1.54 30.1 1.47 27 87.3 81.2 0.6 – – 82.2 7.9 13.8 15.6 1.9 – – Japan
Transcript of European Demographic 2000–2019 (%) Data Sheet 2020

European DemographicData Sheet2020
Years of Good Life (YoGL) is a newly developed indicator that takes a demographic approach to directly measure multi-dimensional human well-being and its change over time. In the longer run, it can also be used as a cri-terion to assess whether societal development can be considered sustainable. In order to enjoy any qual-ity of life, one has to be alive; but since mere survival does not capture well-being, “years of good life” are made conditional on meeting minimum standards as depicted in the circular chart. Years of life are counted as “good” if they are spent above a threshold with respect to objectively observable condi-tions (being out of poverty, being without cognitive limitations, and having no serious physical disabilities), as well as subjective life satisfaction.
In Europe, YoGL varies considerably between countries – par-ticularly for older age groups. In 2017, Swiss men aged 50 could expect to live another 33.1 years, of which 28.5 are considered “good” years (86 %). By contrast, Lithuanian men of the same age could only expect to live another 24.8 years, of which only 12.1 years are considered “good” years (49 %). Generally, South-
ern and Western European countries such as Spain, Italy, France, and
Switzerland have exceptionally high life expectancy at age
50. However, it is mostly Northern European coun-tries, but also Switzerland and Belgium, whose populations are expected to spend their remaining
life years to a great extent in good years. Central and
Eastern European countries have both low life expectancy
and low YoGLs. While male life expectancy is consistently lower than
female life expectancy, gender differences in YoGL are less pronounced: YoGL at age 50 for the EU-27
in 2017 was 22.4 for females (life expectancy of 35 years) and 21.4 for males (life expectancy of 30.2 years).
References:Lutz W., Lijadi A., Strießnig E., Dimitrova A., and Caldeira Brant de Souza Lima M. (2018). Years of Good Life (YoGL): A new in-dicator for assessing sustainable progress. IIASA Working Paper, WP-18-007.Reiter, C., and Lutz, W. (2020). Survival and Years of Good Life in Finland in the very long run. Finnish Yearbook of Population Research, 54, 1–27.
Years of Good Life: A novel indicator to measure well-being
Data, rankings, maps, definitions, sources and notes:
www.populationeurope.orgAuthors:Authors: Tomáš Sobotka and Kryštof Zeman (data collection and coordination). Copy editing: Nicholas Gailey. Administrative assistance: Lisa Janisch. Graphic design: Christian Högl, creativbox.at. Authors of thematic boxes and indicators are listed on the reverse side (first box) and in the online version at www.populationeurope.org
Suggested citation: Vienna Institute of Demography (VID) and International Institute for Applied Systems Analysis (IIASA). 2020. European Demographic Datasheet 2020. Wittgenstein Centre for Demography and Global Human Capital, Vienna. Available at www.populationeurope.org.
Note: The Data Sheet does not cover European countries with population below 100 thousand (Andorra, Liechtenstein, Monaco, and San Marino). Data for Azerbaijan, Cyprus, Georgia, Moldova, and Ukraine exclude territories that are not under government control. For data sources, country-specific definitions and notes see www.populationeurope.org Human life indicator expresses well-being in terms of years of life, similar to life expectancy at birth, taking the inequality in longevity into account. Other non-standard indicators are explained in the specific boxes. More detailed definitions of all indicators are available at www.populationeurope.org
Population – Well-being – Human Capital
Observed and projected population trends in Europe, 2000–2040
2000
–201
9 (%
)20
19–2
040 (
%)
8 to 424 to 80 to 4-4 to 0-8 to -4-33 to -8
Total population change Natural population change Net migration
Percentagechange
Capable Longevity
(out of povertyand no severecognitive or
physicallimitations)
Years ofGood Life
(YoGL)
Years withpositive lifesatisfaction
Years of Life =Being Alive =
Life Expectancy BulgariaHungaryRomania
LatviaSlovakia
CroatiaLithuania
CzechiaPolandEstonia
DenmarkGermany
GreeceEU-27
AustriaCyprus
SloveniaSwedenBelgium
LuxembourgFinland
MaltaPortugal
ItalySwitzerland
FranceSpain
LatviaBulgaria
LithuaniaHungaryRomaniaSlovakiaEstoniaPolandCroatiaCzechia
SloveniaEU-27
PortugalGermany
GreeceDenmark
FinlandBelgium
AustriaCyprus
LuxembourgFranceSpainMalta
ItalySweden
Switzerland
0 10 20 30 40 0 10 20 30 40
Years of Life Years of Good Life
Women Men
Total population change (%)2000−2019
Proportion of foreign-born population (%)1.1.2019
Completed cohort fertilitywomen born 1978
Cohort childlessness (%)women born 1978
Life expectancy at birth (years), Women2018
Human life indicator (years)2015−2020
European Union
Cyprus
Malta
Iceland
Ireland
Luxembourg
Moldova
Lithuania
Latvia
Bulgaria
Ukraine
4
-26
-20
-19
-15
-15
27
27
28
30
42
Bosnia
Albania
Poland
Bulgaria
Moldova
European Union
Austria
Malta
Cyprus
Switzerland
Luxembourg
1
2
2
2
3
11
19
20
21
29
47
Spain
Italy
Romania
Greece
Poland
European Union
Norway
Ireland
France
Iceland
Albania
1.36
1.43
1.50
1.51
1.51
1.65
1.98
2.03
2.06
2.24
2.29
Iceland
Belarus
Norway
Russia
Denmark
European Union
Finland
Germany
Italy
Greece
Spain
9
12
12
12
13
19
21
21
21
24
25
Moldova
Russia
Ukraine
Serbia
Bulgaria
European Union
Cyprus
France
Italy
Switzerland
Spain
75.0
77.6
78.0
78.4
78.6
83.8
84.8
85.5
85.6
85.7
86.3
Moldova
Ukraine
Russia
N.Macedonia
Bulgaria
European Union
Sweden
Switzerland
Italy
Iceland
Spain
65.3
66.8
67.5
69.9
70.5
78.3
80.3
80.7
80.8
80.9
81.0
Country rankings (top 5 and bottom 5 countries)
Remaining years of life at age 50Note: Ranking plots include European countries only. They exclude countries with population below 100 thousand, Turkey, Armenia, Azerbaijan and Georgia, and countries for which the particular indicator is not available.
Country Popu-lation
(millions)
Popu-lation
(millions)
Total population change ( %)
Natural population change ( %)
Net migration
( %)
Projected population
SSP2
Projected population SSP2 – Zero migration
Proportion of foreign-
born population
( %)
Old-age dependency
ratio 65+/20–64
( %)
Total fertility
rate (TFR)
Tempo and parity adjusted
TFR
Mean age at
first birth (years)
Completed cohort
fertility
Cohort childless-ness ( %)
Life expectancy
at birth (years), Women
Life expectancy
at birth (years),
Men
Change in life
expectancy (years)
Years of good life
at age 50, Women
Years of good life at age 50,
Men
Human life
indicator (years)
Aggregate crude
internal migration intensity
Mean years of
schooling
Skills- adjusted
mean years of
schooling
Inequality-adjusted
healthy life-time income
(M$PC)
Equivalised income
( % change), age 20–39
Relative equivalised
income ( % change), age 20–39
Country
1.1.2019 1.1.2000 2000–2019 2000–2019 2000–2019 2060 2060 1.1.2019 1.1.2019 2018 2016 2018 Women born 1978
Women born 1978 2018 2018 Change
2014–2018 2017 2017 2015–2020 various years 2015 2015 2016 Change
2008–2017Change
2008–2017
Albania 2.9 3.1 -6 12 -19 1.9 2.8 2 23 1.73 – 26.4 2.29 – 80.5 77.4 0.7 – – 73.6 13.7 10.6 8.4 0.5 – – AlbaniaArmenia 3.0 3.2 -8 7 -15 2.2 2.9 6 19 1.57 1.72 24.8 2.16 10 79.7 73.4 – – – 68.9 15.3 11.0 10.7 0.3 – – ArmeniaAustria 8.9 8.0 11 0 10 9.4 7.5 19 30 1.47 1.63 29.5 1.64 20 84.1 79.4 0.2 25.8 24.7 78.5 8.2 12.2 12.5 2.3 3 -3 AustriaAzerbaijan 10.0 8.0 25 22 2 10.2 10.7 3 11 1.73 – 23.9 1.87 – 78.3 73.5 1.2 – – 63.6 – 11.0 10.6 0.7 – – AzerbaijanBelarus 9.5 10.0 -5 -6 0 8.3 7.7 11 24 1.45 1.84 25.8 1.66 12 79.5 69.3 1.2 – – 71.4 5.7 11.6 12.3 0.8 – – BelarusBelgium 11.5 10.2 12 3 9 12.8 11.1 17 32 1.62 1.85 29.0 1.90 – 83.9 79.4 0.3 26.1 25.0 78.6 10.3 11.9 12.5 2.3 5 -1 BelgiumBosnia and Herzegovina 3.3 3.8 -12 0 -12 1.7 2.9 1 – – – – 1.77 18 – – – – – 73.2 14.5 11.2 10.9 0.5 – – Bosnia and HerzegovinaBulgaria 7.0 8.2 -15 -9 -5 4.5 5.3 3 36 1.56 1.74 26.2 1.67 – 78.6 71.5 0.5 13.3 14.0 70.5 4.5 11.7 12.3 0.8 12 -6 BulgariaCroatia 4.1 4.5 -9 -5 -5 3.4 3.4 13 34 1.47 1.76 28.8 1.69 18 81.5 74.9 0.3 15.6 15.5 75.1 2.7 12.0 12.7 1.1 14 4 CroatiaCyprus 0.9 0.7 27 10 17 – – 21 26 1.32 1.50 29.8 1.82 – 84.8 80.9 0.6 19.6 20.6 78.0 3.8 13.0 13.4 1.6 -19 -7 CyprusCzechia 10.6 10.3 4 0 4 9.7 9.1 5 33 1.71 1.67 28.4 1.71 14 82.0 76.2 0.2 20.2 19.8 76.9 4.2 13.0 13.6 1.6 12 3 CzechiaDenmark 5.8 5.3 9 3 6 6.5 5.8 12 34 1.73 1.88 29.5 1.92 13 82.9 79.1 0.3 28.1 26.0 77.9 14.8 12.6 13.0 2.5 3 -5 DenmarkEstonia 1.3 1.4 -5 -3 -2 1.2 1.1 15 33 1.67 1.93 27.7 1.87 14 82.7 74.0 1.1 18.7 14.5 75.8 4.8 13.3 13.9 1.3 35 -1 EstoniaFinland 5.5 5.2 7 2 4 5.7 5.5 7 38 1.41 1.84 29.2 1.87 21 84.5 79.1 0.5 28.1 25.3 79.3 16.3 13.0 14.3 2.2 -3 -5 FinlandFrance 64.8 60.5 7 7 0 76.2 68.4 13 36 1.88 2.08 28.7 2.06 15 85.5 79.6 0.0 25.9 23.7 79.5 18.8 12.1 12.1 2.0 1 -1 FranceGeorgia 3.7 4.4 -16 3 -19 2.3 3.7 2 25 2.09 – 25.5 1.92 – 78.2 69.7 -0.1 – – 67.9 15.8 12.7 11.8 0.4 – – GeorgiaGermany 83.0 82.2 1 -4 5 79.6 66.1 16 36 1.57 1.66 29.7 1.61 21 83.3 78.6 -0.2 25.4 23.2 78.2 9.0 13.7 14.1 2.3 7 -1 GermanyGreece 10.7 10.8 0 -1 1 10.8 9.5 12 38 1.35 1.49 30.4 1.51 24 84.4 79.3 0.4 20.7 21.5 79.2 8.1 11.8 11.4 1.2 -40 -6 GreeceHungary 9.8 10.2 -4 -7 2 8.0 7.6 6 32 1.49 1.54 28.2 1.60 – 79.6 72.7 0.2 14.9 16.7 73.6 8.6 12.4 12.5 1.2 -7 3 HungaryIceland 0.4 0.3 28 16 12 0.4 0.4 17 23 1.71 2.09 28.3 2.24 9 84.5 81.3 0.0 – – 80.9 19.1 13.6 12.9 2.6 -13 -1 IcelandIreland 4.9 3.8 30 18 11 5.7 5.5 17 24 1.75 2.06 30.5 2.03 15 84.1 80.5 0.9 – – 79.4 8.1 12.6 12.8 3.1 -4 -6 IrelandItaly 60.4 56.9 6 -2 8 53.3 48.4 10 39 1.29 1.47 31.2 1.43 21 85.6 81.2 0.2 22.3 23.0 80.8 5.1 11.9 11.3 1.7 -9 -6 ItalyKosovo 1.8 2.0 -10 22 -33 – – – 14 – – 26.9 – – 81.6 75.9 – – – – – – – – – – KosovoLatvia 1.9 2.4 -19 -8 -12 1.6 1.5 13 34 1.60 1.78 27.2 1.67 18 79.7 70.1 0.6 15.5 13.6 71.5 5.1 12.6 13.6 1.0 24 5 LatviaLithuania 2.8 3.5 -20 -6 -14 2.1 2.4 5 33 1.63 1.90 27.8 1.79 13 80.7 70.9 1.3 14.5 12.1 71.6 5.5 13.5 13.7 1.2 21 -1 LithuaniaLuxembourg 0.6 0.4 42 8 33 0.9 0.6 47 22 1.38 1.74 30.9 1.81 – 84.6 80.1 0.0 24.0 23.6 79.4 – 13.2 12.7 4.9 9 -3 LuxembourgMalta 0.5 0.4 27 4 23 0.4 0.4 20 30 1.23 1.56 29.2 – – 84.6 80.4 0.4 23.2 22.9 78.7 4.7 11.2 9.6 1.9 6 6 MaltaMoldova 2.7 3.6 -26 -2 -25 – – 3 22 1.82 – – – – 75.0 66.2 – – – 65.3 – 11.1 10.2 0.3 – – MoldovaMontenegro 0.6 0.6 3 6 -3 0.6 0.6 11 25 1.76 – – 1.95 19 79.3 74.5 0.4 – – 74.0 14.4 12.0 12.0 0.8 – – MontenegroNetherlands 17.3 15.9 9 5 4 18.4 16.6 13 33 1.59 1.85 30.0 1.78 16 83.4 80.3 0.1 – – 79.7 8.8 12.4 13.4 2.5 5 1 NetherlandsNorth Macedonia 2.1 2.0 3 5 -2 1.6 1.9 6 22 1.42 1.57 26.9 1.91 – 78.8 74.6 1.2 – – 69.9 1.0 10.6 9.6 0.6 – – North MacedoniaNorway 5.3 4.5 19 7 12 6.7 5.8 16 29 1.56 1.97 29.5 1.98 12 84.5 81.1 0.6 – – 79.9 13.1 13.1 13.9 3.5 -6 -4 NorwayPoland 38.0 38.3 -1 0 -1 31.9 33.3 2 28 1.46 1.45 27.4 1.51 – 81.7 73.7 -0.1 17.7 16.0 75.2 1.3 13.0 13.2 1.3 10 1 PolandPortugal 10.3 10.2 0 -1 2 8.3 8.6 9 37 1.42 1.62 29.8 1.57 – 84.5 78.3 0.2 19.1 21.4 79.0 11.2 9.3 8.3 1.3 -1 -1 PortugalRomania 19.4 22.5 -14 -4 -9 12.9 15.7 3 31 1.76 1.87 26.7 1.50 – 79.2 71.7 0.3 14.6 14.4 71.3 1.7 11.7 11.5 1.0 22 3 RomaniaRussia 146.8 146.9 0 -5 5 131.7 117.5 8 24 1.58 1.86 25.9 1.67 12 77.6 67.6 1.0 – – 67.5 2.0 10.9 11.4 1.0 – – RussiaSerbia 7.0 7.5 -7 -8 1 – – 9 34 1.49 1.64 28.1 1.72 – 78.4 73.5 0.5 – – 72.2 – 12.1 12.2 0.7 – – SerbiaSlovakia 5.5 5.4 1 1 0 4.7 4.9 4 25 1.54 1.50 27.1 1.64 17 80.8 73.9 0.4 18.9 18.5 73.6 2.7 13.2 13.8 1.5 11 -5 SlovakiaSlovenia 2.1 2.0 5 1 4 2.1 1.8 13 33 1.60 1.62 28.8 1.64 17 84.4 78.5 0.3 21.3 19.9 78.8 2.5 12.2 11.9 1.6 -2 -2 SloveniaSpain 46.9 40.5 16 3 13 47.6 40.2 14 32 1.26 1.43 31.0 1.36 25 86.3 80.7 0.2 21.7 20.7 81.0 3.1 11.5 11.0 1.6 -14 -4 SpainSweden 10.2 8.9 15 3 12 12.4 10.5 19 35 1.76 1.99 29.3 1.94 14 84.3 80.9 0.3 28.6 27.0 80.3 13.9 12.8 13.6 2.5 8 -4 SwedenSwitzerland 8.5 7.2 19 4 15 10.4 8.0 29 30 1.52 1.64 30.9 1.65 18 85.7 81.9 0.5 30.1 28.5 80.7 10.7 13.4 14.0 3.0 44 -3 SwitzerlandTurkey 82.0 66.9 23 25 -2 95.8 95.1 7 15 1.99 – 26.3 – – 81.6 76.2 0.8 – – 71.4 7.1 9.2 7.9 0.9 – – TurkeyUkraine 42.0 49.1 -15 -10 -5 36.2 33.9 11 26 1.30 1.50 25.4 1.57 14 78.0 68.1 1.4 – – 66.8 2.6 11.0 11.3 0.4 – – UkraineUnited Kingdom 66.6 58.8 13 5 8 76.8 69.4 14 32 1.68 1.99 29.0 1.94 18 83.1 79.5 -0.1 – – 78.0 10.6 13.3 13.8 1.9 7 -2 United KingdomEuropean Union (27) 444.7 428.6 4 0 4 430.1 390.8 11 34 1.54 1.69 29.4 1.65 19 83.8 78.3 0.1 22.4 21.4 78.3 8.2 12.4 12.5 1.8 1 -2 European Union (27)United States 328.2 282.2 16 10 6 411.6 349.5 15 28 1.73 2.16 27.3 2.21 11 81.1 76.1 -0.4 – – 74.1 14.7 12.9 13.3 2.3 – – United StatesJapan 126.3 125.6 1 -1 2 100.4 97.4 2 51 1.42 1.54 30.1 1.47 27 87.3 81.2 0.6 – – 82.2 7.9 13.8 15.6 1.9 – – Japan
Fertility over a given time is commonly measured by the Total Fertility Rate (TFR). However, TFR is sensitive to changes in the average age of childbearing, which has been rising in Europe for several decades. As births shift to later ages, they are both postponed into the future and spread over a longer period of time. This “stretching” of reproduction results in a depressed period TFR, even if the number of children that women have over their lifetimes does not change.
Alternative indicators to TFR have been developed to provide a more accurate measure of the mean number of children per woman in a calendar year. Here we use Tempo- and Parity-adjusted Total Fertility (TFRp*; Bongaarts and Sobotka 2012), which is based on age- and parity-specific fertility rates, as well as changes in mean ages at birth. When available, this data sheet displays the TFRp* of 2016. For coun-tries lacking the required data, we use Tempo-adjusted TFR (TFR-BF) proposed by Bongaarts and Feeney (1998), averaged over the 3-year period of 2015–2017.
The graphs compare conventional TFR and TFRp* from 1980–2019 in four countries with different fertility patterns: Czechia, Norway, Russia and Spain. They also show the rise in the mean age at first birth. In some cases fertility postponement has resulted in unstable (“roller-coaster”) TFR trends and a huge gap between conventional and tempo-adjusted fertility, especially in Czechia in the late 1990s when the TFR fell below 1.2, while the TFRp* stayed above 1.8. This decrease in TFR was followed by a robust recovery in the last two decades, when it converged with the TFRp* at 1.7 in 2017. For Russia, data suggest that pro-natalist policies introduced in 2006 had a strong effect, although more on conventional TFR (and thus also on the timing of births) than on the tempo- and parity-adjusted TFRp*. The fertility boost given by pro-natalist policies has recently lost its steam, with the TFR and TFRp* plummeting after 2015.
By contrast, the TFR in Spain and Norway started falling earlier, soon after the start of the Great Recession in 2008. In Spain, this slide was briefly interrupted around 2013–2015, but in Norway it continued until 2019, resulting in a lowest-TFR on record. The TFRp* also followed a downward trend, albeit milder than the conventional TFR. This suggests that the TFR declines have reflected a renewed postponement of fertility (especially of first births), as well as a fall in family size. A similar trend
has taken place in many other countries across Europe, especially in Southern Europe, Nordic countries, and parts of Western Europe.
References:Bongaarts, J., and Feeney, G. (1998). On the quantum and tempo of fertility. Popu-lation and Development Review 24(2): 271–291.
Bongaarts, J., and Sobotka, T. (2012). A demographic explanation for the recent rise in European fertility. Population and Development Review 38(1): 83–120.
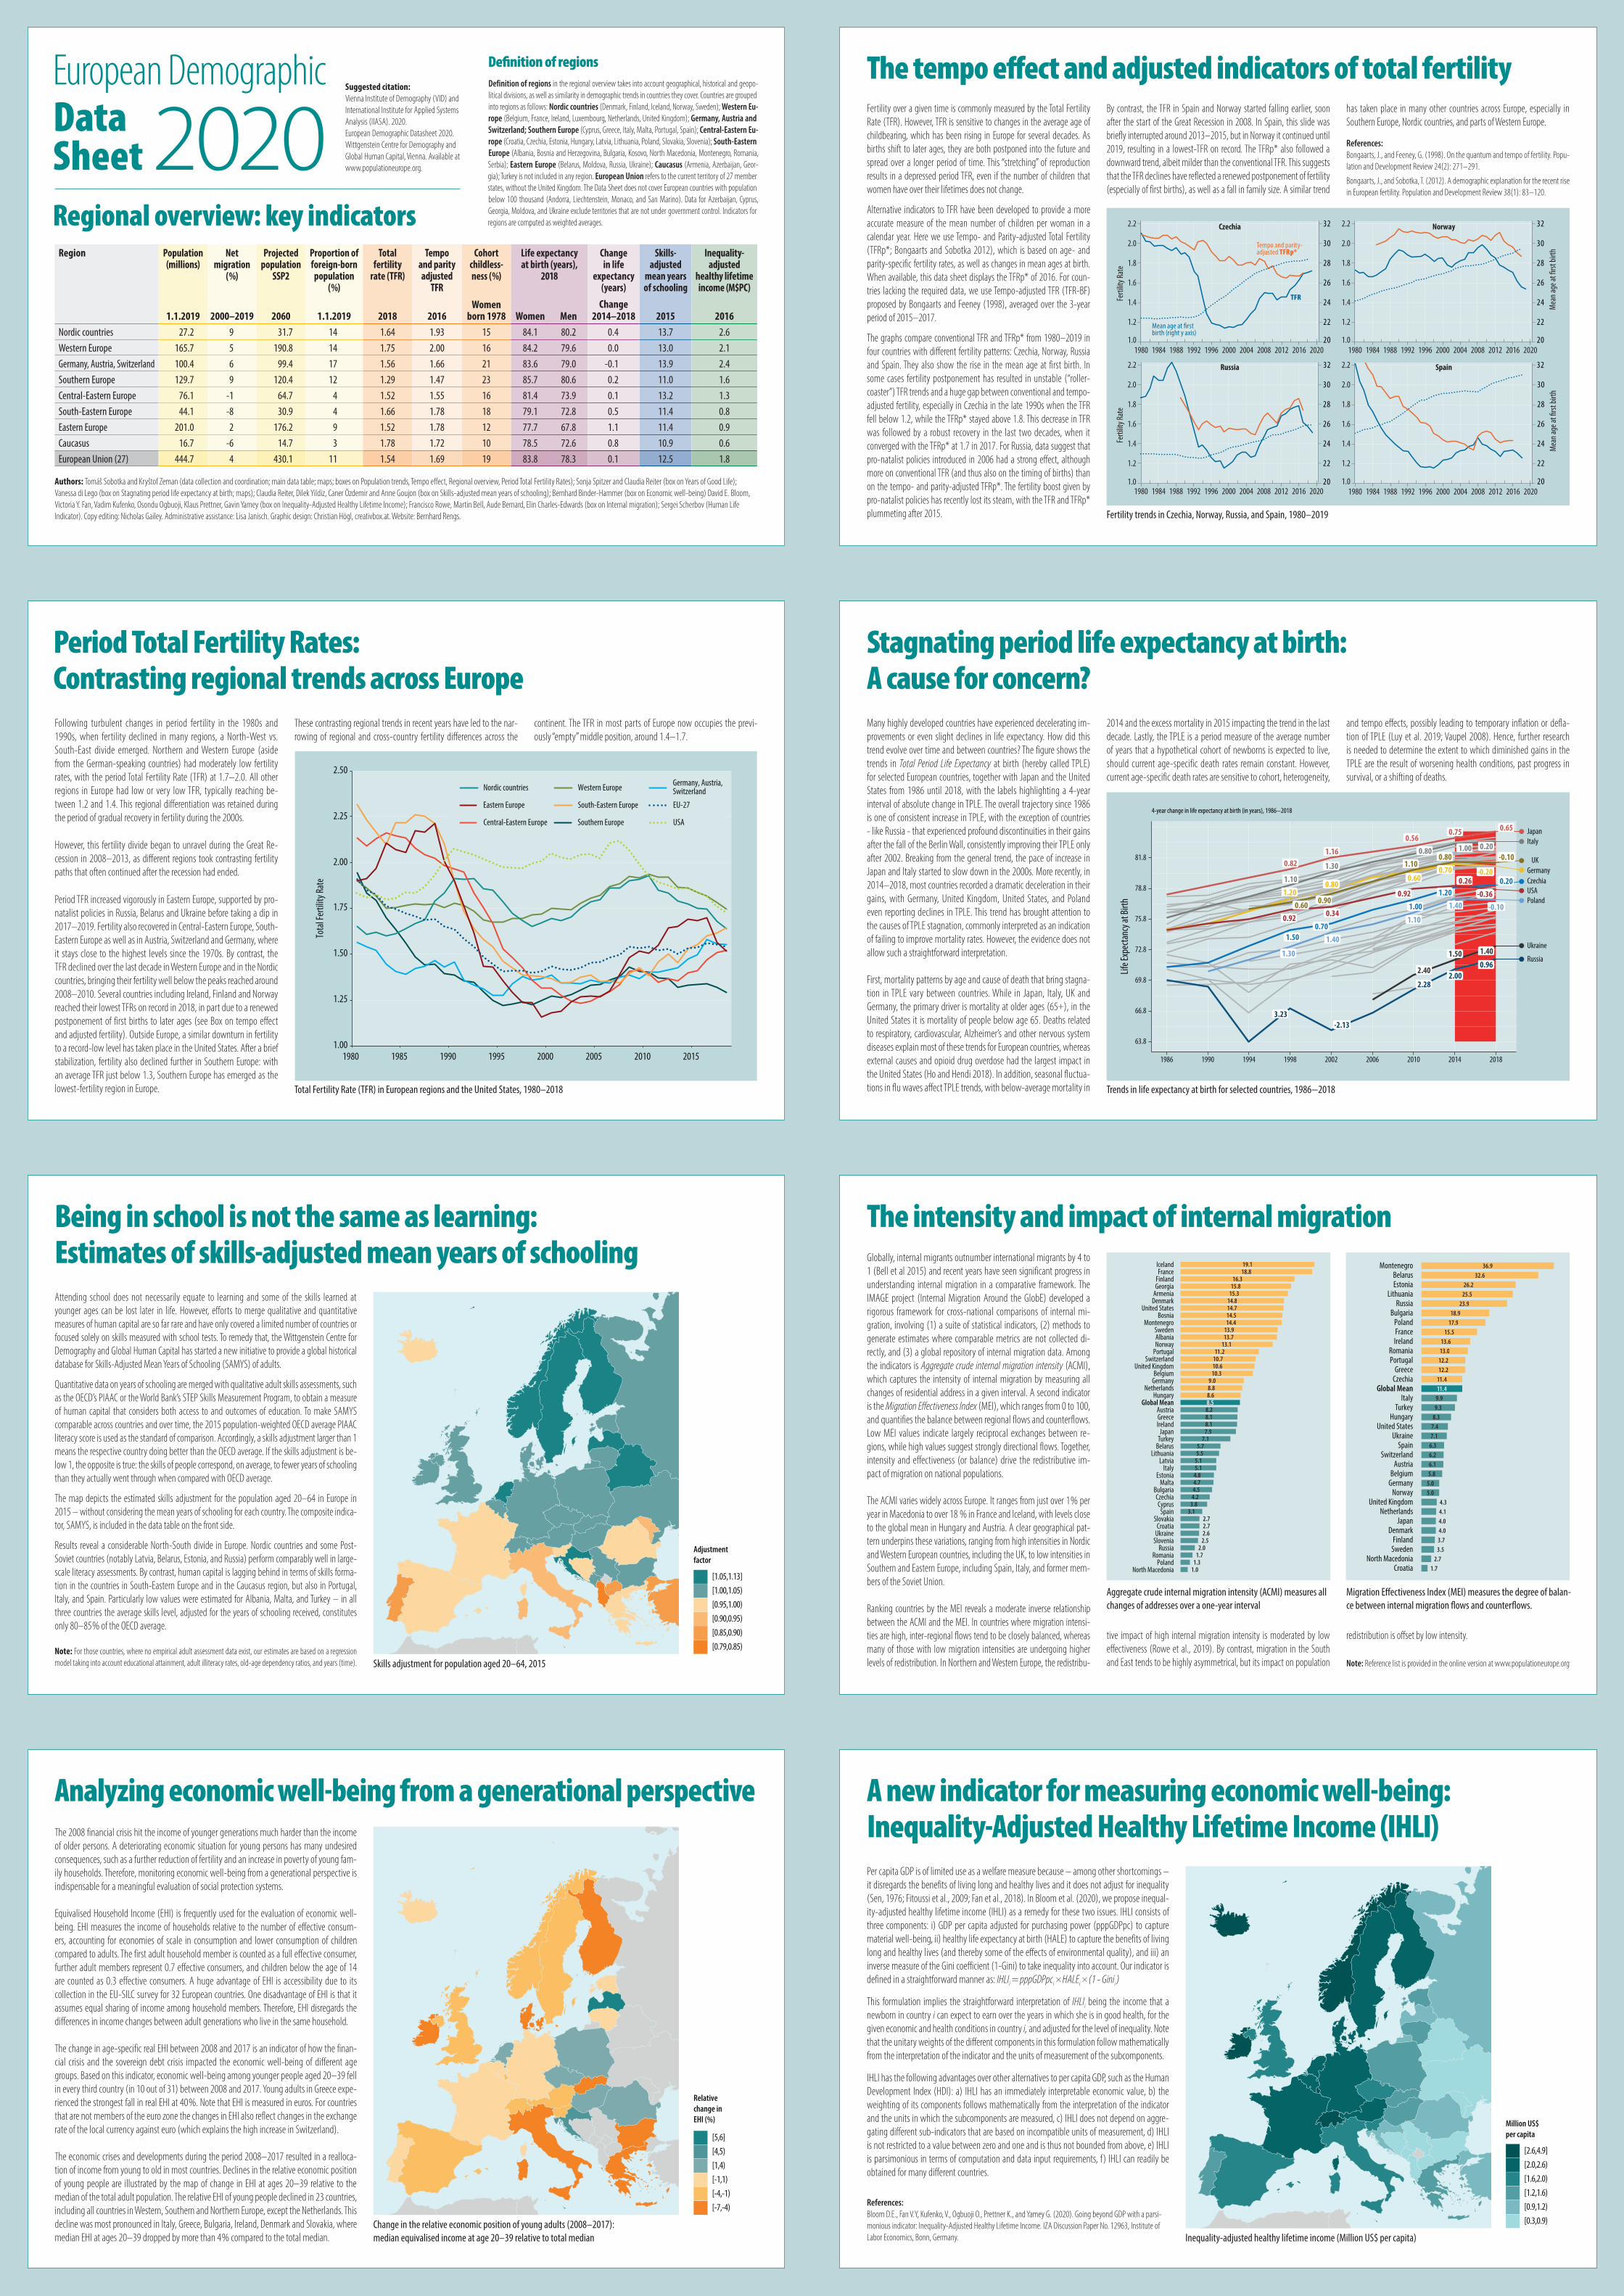
Many highly developed countries have experienced decelerating im-provements or even slight declines in life expectancy. How did this trend evolve over time and between countries? The figure shows the trends in Total Period Life Expectancy at birth (hereby called TPLE) for selected European countries, together with Japan and the United States from 1986 until 2018, with the labels highlighting a 4-year interval of absolute change in TPLE. The overall trajectory since 1986 is one of consistent increase in TPLE, with the exception of countries - like Russia - that experienced profound discontinuities in their gains after the fall of the Berlin Wall, consistently improving their TPLE only after 2002. Breaking from the general trend, the pace of increase in Japan and Italy started to slow down in the 2000s. More recently, in 2014–2018, most countries recorded a dramatic deceleration in their gains, with Germany, United Kingdom, United States, and Poland even reporting declines in TPLE. This trend has brought attention to the causes of TPLE stagnation, commonly interpreted as an indication of failing to improve mortality rates. However, the evidence does not allow such a straightforward interpretation.
First, mortality patterns by age and cause of death that bring stagna-tion in TPLE vary between countries. While in Japan, Italy, UK and Germany, the primary driver is mortality at older ages (65+), in the United States it is mortality of people below age 65. Deaths related to respiratory, cardiovascular, Alzheimer’s and other nervous system diseases explain most of these trends for European countries, whereas external causes and opioid drug overdose had the largest impact in the United States (Ho and Hendi 2018). In addition, seasonal fluctua-tions in flu waves affect TPLE trends, with below-average mortality in
2014 and the excess mortality in 2015 impacting the trend in the last decade. Lastly, the TPLE is a period measure of the average number of years that a hypothetical cohort of newborns is expected to live, should current age-specific death rates remain constant. However, current age-specific death rates are sensitive to cohort, heterogeneity,
and tempo effects, possibly leading to temporary inflation or defla-tion of TPLE (Luy et al. 2019; Vaupel 2008). Hence, further research is needed to determine the extent to which diminished gains in the TPLE are the result of worsening health conditions, past progress in survival, or a shifting of deaths.
Following turbulent changes in period fertility in the 1980s and 1990s, when fertility declined in many regions, a North-West vs. South-East divide emerged. Northern and Western Europe (aside from the German-speaking countries) had moderately low fertility rates, with the period Total Fertility Rate (TFR) at 1.7–2.0. All other regions in Europe had low or very low TFR, typically reaching be-tween 1.2 and 1.4. This regional differentiation was retained during the period of gradual recovery in fertility during the 2000s.
However, this fertility divide began to unravel during the Great Re-cession in 2008–2013, as different regions took contrasting fertility paths that often continued after the recession had ended.
Period TFR increased vigorously in Eastern Europe, supported by pro-natalist policies in Russia, Belarus and Ukraine before taking a dip in 2017–2019. Fertility also recovered in Central-Eastern Europe, South-Eastern Europe as well as in Austria, Switzerland and Germany, where it stays close to the highest levels since the 1970s. By contrast, the TFR declined over the last decade in Western Europe and in the Nordic countries, bringing their fertility well below the peaks reached around 2008–2010. Several countries including Ireland, Finland and Norway reached their lowest TFRs on record in 2018, in part due to a renewed postponement of first births to later ages (see Box on tempo effect and adjusted fertility). Outside Europe, a similar downturn in fertility to a record-low level has taken place in the United States. After a brief stabilization, fertility also declined further in Southern Europe: with an average TFR just below 1.3, Southern Europe has emerged as the lowest-fertility region in Europe.
These contrasting regional trends in recent years have led to the nar-rowing of regional and cross-country fertility differences across the
continent. The TFR in most parts of Europe now occupies the previ-ously “empty” middle position, around 1.4–1.7.
Attending school does not necessarily equate to learning and some of the skills learned at younger ages can be lost later in life. However, efforts to merge qualitative and quantitative measures of human capital are so far rare and have only covered a limited number of countries or focused solely on skills measured with school tests. To remedy that, the Wittgenstein Centre for Demography and Global Human Capital has started a new initiative to provide a global historical database for Skills-Adjusted Mean Years of Schooling (SAMYS) of adults.
Quantitative data on years of schooling are merged with qualitative adult skills assessments, such as the OECD’s PIAAC or the World Bank’s STEP Skills Measurement Program, to obtain a measure of human capital that considers both access to and outcomes of education. To make SAMYS comparable across countries and over time, the 2015 population-weighted OECD average PIAAC literacy score is used as the standard of comparison. Accordingly, a skills adjustment larger than 1 means the respective country doing better than the OECD average. If the skills adjustment is be-low 1, the opposite is true: the skills of people correspond, on average, to fewer years of schooling than they actually went through when compared with OECD average.
The map depicts the estimated skills adjustment for the population aged 20–64 in Europe in 2015 – without considering the mean years of schooling for each country. The composite indica-tor, SAMYS, is included in the data table on the front side.
Results reveal a considerable North-South divide in Europe. Nordic countries and some Post-Soviet countries (notably Latvia, Belarus, Estonia, and Russia) perform comparably well in large-scale literacy assessments. By contrast, human capital is lagging behind in terms of skills forma-tion in the countries in South-Eastern Europe and in the Caucasus region, but also in Portugal, Italy, and Spain. Particularly low values were estimated for Albania, Malta, and Turkey – in all three countries the average skills level, adjusted for the years of schooling received, constitutes only 80–85 % of the OECD average.
Note: For those countries, where no empirical adult assessment data exist, our estimates are based on a regression model taking into account educational attainment, adult illiteracy rates, old-age dependency ratios, and years (time).
Globally, internal migrants outnumber international migrants by 4 to 1 (Bell et al 2015) and recent years have seen significant progress in understanding internal migration in a comparative framework. The IMAGE project (Internal Migration Around the GlobE) developed a rigorous framework for cross-national comparisons of internal mi-gration, involving (1) a suite of statistical indicators, (2) methods to generate estimates where comparable metrics are not collected di-rectly, and (3) a global repository of internal migration data. Among the indicators is Aggregate crude internal migration intensity (ACMI), which captures the intensity of internal migration by measuring all changes of residential address in a given interval. A second indicator is the Migration Effectiveness Index (MEI), which ranges from 0 to 100, and quantifies the balance between regional flows and counterflows. Low MEI values indicate largely reciprocal exchanges between re-gions, while high values suggest strongly directional flows. Together, intensity and effectiveness (or balance) drive the redistributive im-pact of migration on national populations.
The ACMI varies widely across Europe. It ranges from just over 1 % per year in Macedonia to over 18 % in France and Iceland, with levels close to the global mean in Hungary and Austria. A clear geographical pat-tern underpins these variations, ranging from high intensities in Nordic and Western European countries, including the UK, to low intensities in Southern and Eastern Europe, including Spain, Italy, and former mem-bers of the Soviet Union.
Ranking countries by the MEI reveals a moderate inverse relationship between the ACMI and the MEI. In countries where migration intensi-ties are high, inter-regional flows tend to be closely balanced, whereas many of those with low migration intensities are undergoing higher levels of redistribution. In Northern and Western Europe, the redistribu-
tive impact of high internal migration intensity is moderated by low effectiveness (Rowe et al., 2019). By contrast, migration in the South and East tends to be highly asymmetrical, but its impact on population
redistribution is offset by low intensity.
Note: Reference list is provided in the online version at www.populationeurope.org
Per capita GDP is of limited use as a welfare measure because – among other shortcomings – it disregards the benefits of living long and healthy lives and it does not adjust for inequality (Sen, 1976; Fitoussi et al., 2009; Fan et al., 2018). In Bloom et al. (2020), we propose inequal-ity-adjusted healthy lifetime income (IHLI) as a remedy for these two issues. IHLI consists of three components: i) GDP per capita adjusted for purchasing power (pppGDPpc) to capture material well-being, ii) healthy life expectancy at birth (HALE) to capture the benefits of living long and healthy lives (and thereby some of the effects of environmental quality), and iii) an inverse measure of the Gini coefficient (1-Gini) to take inequality into account. Our indicator is defined in a straightforward manner as: IHLIi = pppGDPpci × HALEi × (1 - Ginii )
This formulation implies the straightforward interpretation of IHLIi being the income that a newborn in country i can expect to earn over the years in which she is in good health, for the given economic and health conditions in country i, and adjusted for the level of inequality. Note that the unitary weights of the different components in this formulation follow mathematically from the interpretation of the indicator and the units of measurement of the subcomponents.
IHLI has the following advantages over other alternatives to per capita GDP, such as the Human Development Index (HDI): a) IHLI has an immediately interpretable economic value, b) the weighting of its components follows mathematically from the interpretation of the indicator and the units in which the subcomponents are measured, c) IHLI does not depend on aggre-gating different sub-indicators that are based on incompatible units of measurement, d) IHLI is not restricted to a value between zero and one and is thus not bounded from above, e) IHLI is parsimonious in terms of computation and data input requirements, f ) IHLI can readily be obtained for many different countries.
References:Bloom D.E., Fan V.Y, Kufenko, V., Ogbuoji O., Prettner K., and Yamey G. (2020). Going beyond GDP with a parsi-monious indicator: Inequality-Adjusted Healthy Lifetime Income. IZA Discussion Paper No. 12963, Institute of Labor Economics, Bonn, Germany.
The 2008 financial crisis hit the income of younger generations much harder than the income of older persons. A deteriorating economic situation for young persons has many undesired consequences, such as a further reduction of fertility and an increase in poverty of young fam-ily households. Therefore, monitoring economic well-being from a generational perspective is indispensable for a meaningful evaluation of social protection systems.
Equivalised Household Income (EHI) is frequently used for the evaluation of economic well-being. EHI measures the income of households relative to the number of effective consum-ers, accounting for economies of scale in consumption and lower consumption of children compared to adults. The first adult household member is counted as a full effective consumer, further adult members represent 0.7 effective consumers, and children below the age of 14 are counted as 0.3 effective consumers. A huge advantage of EHI is accessibility due to its collection in the EU-SILC survey for 32 European countries. One disadvantage of EHI is that it assumes equal sharing of income among household members. Therefore, EHI disregards the differences in income changes between adult generations who live in the same household.
The change in age-specific real EHI between 2008 and 2017 is an indicator of how the finan-cial crisis and the sovereign debt crisis impacted the economic well-being of different age groups. Based on this indicator, economic well-being among younger people aged 20–39 fell in every third country (in 10 out of 31) between 2008 and 2017. Young adults in Greece expe-rienced the strongest fall in real EHI at 40 %. Note that EHI is measured in euros. For countries that are not members of the euro zone the changes in EHI also reflect changes in the exchange rate of the local currency against euro (which explains the high increase in Switzerland).
The economic crises and developments during the period 2008–2017 resulted in a realloca-tion of income from young to old in most countries. Declines in the relative economic position of young people are illustrated by the map of change in EHI at ages 20–39 relative to the median of the total adult population. The relative EHI of young people declined in 23 countries, including all countries in Western, Southern and Northern Europe, except the Netherlands. This decline was most pronounced in Italy, Greece, Bulgaria, Ireland, Denmark and Slovakia, where median EHI at ages 20–39 dropped by more than 4 % compared to the total median.
Definition of regionsDefinition of regions in the regional overview takes into account geographical, historical and geopo-litical divisions, as well as similarity in demographic trends in countries they cover. Countries are grouped into regions as follows: Nordic countries (Denmark, Finland, Iceland, Norway, Sweden); Western Eu-rope (Belgium, France, Ireland, Luxembourg, Netherlands, United Kingdom); Germany, Austria and Switzerland; Southern Europe (Cyprus, Greece, Italy, Malta, Portugal, Spain); Central-Eastern Eu-rope (Croatia, Czechia, Estonia, Hungary, Latvia, Lithuania, Poland, Slovakia, Slovenia); South-Eastern Europe (Albania, Bosnia and Herzegovina, Bulgaria, Kosovo, North Macedonia, Montenegro, Romania, Serbia); Eastern Europe (Belarus, Moldova, Russia, Ukraine); Caucasus (Armenia, Azerbaijan, Geor-gia); Turkey is not included in any region. European Union refers to the current territory of 27 member states, without the United Kingdom. The Data Sheet does not cover European countries with population below 100 thousand (Andorra, Liechtenstein, Monaco, and San Marino). Data for Azerbaijan, Cyprus, Georgia, Moldova, and Ukraine exclude territories that are not under government control. Indicators for regions are computed as weighted averages.
The tempo effect and adjusted indicators of total fertility
Regional overview: key indicators
Period Total Fertility Rates: Contrasting regional trends across Europe
Being in school is not the same as learning: Estimates of skills-adjusted mean years of schooling
The intensity and impact of internal migration
A new indicator for measuring economic well-being: Inequality-Adjusted Healthy Lifetime Income (IHLI)
Analyzing economic well-being from a generational perspective
Stagnating period life expectancy at birth: A cause for concern?
European DemographicData Sheet2020
Region Population (millions)
Net migration
( %)
Projected population
SSP2
Proportion of foreign-born population
( %)
Total fertility
rate (TFR)
Tempo and parity adjusted
TFR
Cohort childless-ness ( %)
Life expectancy at birth (years),
2018
Change in life
expectancy (years)
Skills-adjusted
mean years of schooling
Inequality- adjusted
healthy lifetime income (M$PC)
1.1.2019 2000–2019 2060 1.1.2019 2018 2016Women
born 1978 Women MenChange
2014–2018 2015 2016Nordic countries 27.2 9 31.7 14 1.64 1.93 15 84.1 80.2 0.4 13.7 2.6Western Europe 165.7 5 190.8 14 1.75 2.00 16 84.2 79.6 0.0 13.0 2.1Germany, Austria, Switzerland 100.4 6 99.4 17 1.56 1.66 21 83.6 79.0 -0.1 13.9 2.4Southern Europe 129.7 9 120.4 12 1.29 1.47 23 85.7 80.6 0.2 11.0 1.6Central-Eastern Europe 76.1 -1 64.7 4 1.52 1.55 16 81.4 73.9 0.1 13.2 1.3South-Eastern Europe 44.1 -8 30.9 4 1.66 1.78 18 79.1 72.8 0.5 11.4 0.8Eastern Europe 201.0 2 176.2 9 1.52 1.78 12 77.7 67.8 1.1 11.4 0.9Caucasus 16.7 -6 14.7 3 1.78 1.72 10 78.5 72.6 0.8 10.9 0.6European Union (27) 444.7 4 430.1 11 1.54 1.69 19 83.8 78.3 0.1 12.5 1.8
Suggested citation: Vienna Institute of Demography (VID) and International Institute for Applied Systems Analysis (IIASA). 2020. European Demographic Datasheet 2020. Wittgenstein Centre for Demography and Global Human Capital, Vienna. Available at www.populationeurope.org.
Authors: Tomáš Sobotka and Kryštof Zeman (data collection and coordination; main data table; maps; boxes on Population trends, Tempo effect, Regional overview, Period Total Fertility Rates); Sonja Spitzer and Claudia Reiter (box on Years of Good Life); Vanessa di Lego (box on Stagnating period life expectancy at birth; maps); Claudia Reiter, Dilek Yildiz, Caner Özdemir and Anne Goujon (box on Skills-adjusted mean years of schooling); Bernhard Binder-Hammer (box on Economic well-being) David E. Bloom, Victoria Y. Fan, Vadim Kufenko, Osondu Ogbuoji, Klaus Prettner, Gavin Yamey (box on Inequality-Adjusted Healthy Lifetime Income); Francisco Rowe, Martin Bell, Aude Bernard, Elin Charles-Edwards (box on Internal migration); Sergei Scherbov (Human Life Indicator). Copy editing: Nicholas Gailey. Administrative assistance: Lisa Janisch. Graphic design: Christian Högl, creativbox.at. Website: Bernhard Rengs.
13.7
15.3
8.2
5.7
10.3
14.5
4.5
3.84.2
14.8
4.8
16.318.8
15.8
9.0
8.1
8.6
19.1
8.1
5.15.15.5
4.7
14.4
8.8
13.111.2
3.1
13.9
10.7
7.1
10.6
14.7
7.9
8.5
2.7
1.01.31.72.0
2.7
2.52.6
IcelandFrance
FinlandGeorgia
ArmeniaDenmark
United StatesBosnia
MontenegroSwedenAlbaniaNorway
PortugalSwitzerland
United KingdomBelgium
GermanyNetherlands
HungaryGlobal Mean
AustriaGreeceIreland
JapanTurkey
BelarusLithuania
LatviaItaly
EstoniaMalta
BulgariaCzechiaCyprus
SpainSlovakia
CroatiaUkraine
SloveniaRussia
RomaniaPoland
North Macedonia
6.1
32.6
5.8
18.9
11.411.4
26.2
15.5
5.0
12.2
8.3
13.6
9.9
25.5
36.9
5.0
17.9
12.213.0
23.9
6.36.2
9.3
7.17.4
1.7
4.03.7
2.7
4.1
3.5
4.3
4.0
MontenegroBelarusEstonia
LithuaniaRussia
BulgariaPolandFranceIreland
RomaniaPortugal
GreeceCzechia
Global MeanItaly
TurkeyHungary
United StatesUkraine
SpainSwitzerland
AustriaBelgium
GermanyNorway
United KingdomNetherlands
JapanDenmark
FinlandSweden
North MacedoniaCroatia
1980 1985 1990 1995 2000 2005 2010 2015
Southern Europe
Western Europe Germany, Austria, SwitzerlandNordic countries
Central-Eastern Europe
South-Eastern EuropeEastern Europe EU-27
USA
1.00
1.25
1.50
1.75
2.00
2.25
2.50
Tota
l Fer
tility
Rate Czechia
Germany
ItalyJapan
Poland
Russia
Ukraine
UK
USA
63.8
66.8
69.8
72.8
75.8
78.8
81.8
1986 1990 1994 1998 2002 2006 2010 2014 2018
Life E
xpec
tanc
y at B
irth
4-year change in life expectancy at birth (in years), 1986−2018
1.50 0.70
1.00
1.20 0.20
1.20 0.80
0.60 0.70 -0.20
1.10
1.30
0.80 1.00 0.20
0.82 1.16
0.56 0.75 0.65
1.30
1.40
1.10
1.40
3.23-2.13
2.28 2.00
2.40
1.50 1.40
0.60 0.90
1.10 0.80 -0.10
0.92 0.34
0.92 0.26
-0.36-0.10
0.96
Adjustment factor
[1.05,1.13][1.00,1.05)[0.95,1.00)[0.90,0.95)[0.85,0.90)[0.79,0.85)
Total Fertility Rate (TFR) in European regions and the United States, 1980–2018 Trends in life expectancy at birth for selected countries, 1986−2018
Aggregate crude internal migration intensity (ACMI) measures all changes of addresses over a one-year interval
Migration Effectiveness Index (MEI) measures the degree of balan-ce between internal migration flows and counterflows.
Skills adjustment for population aged 20–64, 2015
20
22
24
26
28
30
32
1.0
1.2
1.4
1.6
1.8
2.0
2.2
1980 1984 1988 1992 1996 2000 2004 2008 2012 2016 2020
Ferti
lity R
ate
20
22
24
26
28
30
1.0
1.2
1.4
1.6
1.8
2.0
1980 1984 1988 1992 1996 2000 2004 2008 2012 2016 2020
Mea
n age
at �r
st bir
th
20
22
24
26
28
30
1.0
1.2
1.4
1.6
1.8
2.0
1980 1984 1988 1992 1996 2000 2004 2008 2012 2016 2020
Ferti
lity R
ate
20
22
24
26
28
30
32
1.0
1.2
1.4
1.6
1.8
2.0
2.2
322.2 322.2
1980 1984 1988 1992 1996 2000 2004 2008 2012 2016 2020
Mea
n age
at �r
st bir
th
TFR
Tempo and parity-adjusted TFRp*
Mean age at �rstbirth (right y axis)
Czechia Norway
Russia Spain
Fertility trends in Czechia, Norway, Russia, and Spain, 1980–2019
Million US$ per capita
[2.6,4.9][2.0,2.6)[1.6,2.0)[1.2,1.6)[0.9,1.2)[0.3,0.9)
Inequality-adjusted healthy lifetime income (Million US$ per capita)
Relative change in EHI (%)
[5,6][4,5)[1,4)[-1,1)[-4,-1)[-7,-4)
Change in the relative economic position of young adults (2008–2017): median equivalised income at age 20–39 relative to total median