
European Commission nuclear science and technology
70
European Commission nuclear science and technology Full-Scale Testing of the KBS-3V Concept for the Geological Disposal of High-Level Radioactive Waste PROTOTYPE REPOSITORY C. Andersson 1 , I. Bárcena 2 , N. Bono 3 , L. Boergesson 4 , P. Cleall 5 , T. Forsmark 6 , D. Gunnarsson 4 , L.-E. Johannesson 4 , A. Ledesma 7 , L. Liedtke 8 , A. Luukkonen 9 , K. Pedersen 10 , I. Puigdomenech 1 , R. Pusch 11 , I. Rhén 6 , T. Rothfuchs 12 , T. Sandén 4 , J.-L. Sineriz 2 , Y. Sugita 13 , C. Svemar 1 , H. Thomas 5 1 Svensk Kärnbränslehantering AB - SKB (SE) 2 Asociación para la Investigación y Desarrollo Industrial de los Recursos Naturales - AITEMIN (ES) 3 BergByggKonsult AB - BBK (SE) 4 Clay Technology AB (SE) 5 University of Wales Cardiff - UWC (UK) 6 Sweco VIAK AB (SE) 7 International Centre for Numerical Methods in Engineering - CIMNE (ES) 8 Bundesanstalt für Geowissenschaften und Rohstoffe - BGR (DE) 9 Technical Research Centre of Finland - VTT (FI) 10 Göteborg University (SE) 11 Geodevelopment AB (SE) 12 Gesellschaft für Anlagen- und Reaktorsicherheit - GRS (DE) 13 Japan Nuclear Cycle Development Institute - JNC (JP) Contract N o FIKW-CT-2000-00055 Final report Work performed as part of the European Atomic Energy Community's R&T Specific Programme “Nuclear Energy, Key Action: Nuclear Fission Safety 1998-2002” Area: Safety of the Fuel Cycle Directorate-General for Research 2005 Euratom EUR 21924
Transcript of European Commission nuclear science and technology

European Commission
nuclear science and technology
Full-Scale Testing of the KBS-3V Concept for the
Geological Disposal of High-Level Radioactive Waste
PROTOTYPE REPOSITORY
C. Andersson1, I. Bárcena2, N. Bono3, L. Boergesson4, P. Cleall5, T. Forsmark6, D.
Gunnarsson4, L.-E. Johannesson4, A. Ledesma7, L. Liedtke8, A. Luukkonen9, K. Pedersen10, I. Puigdomenech1, R. Pusch11, I. Rhén6, T. Rothfuchs12, T. Sandén4, J.-L.
Sineriz2, Y. Sugita13, C. Svemar1, H. Thomas5
1 Svensk Kärnbränslehantering AB - SKB (SE)
2 Asociación para la Investigación y Desarrollo Industrial de los Recursos Naturales - AITEMIN (ES) 3 BergByggKonsult AB - BBK (SE)
4 Clay Technology AB (SE) 5 University of Wales Cardiff - UWC (UK)
6 Sweco VIAK AB (SE) 7 International Centre for Numerical Methods in Engineering - CIMNE (ES)
8 Bundesanstalt für Geowissenschaften und Rohstoffe - BGR (DE) 9 Technical Research Centre of Finland - VTT (FI)
10 Göteborg University (SE) 11 Geodevelopment AB (SE)
12 Gesellschaft für Anlagen- und Reaktorsicherheit - GRS (DE) 13 Japan Nuclear Cycle Development Institute - JNC (JP)
Contract No FIKW-CT-2000-00055
Final report
Work performed as part of the European Atomic Energy Community's R&T Specific Programme “Nuclear Energy, Key Action: Nuclear Fission Safety 1998-2002”
Area: Safety of the Fuel Cycle Directorate-General for Research 2005 Euratom EUR 21924

iii
Executive Summary The Prototype Repository project comprises a large-scale field test in the AEspoe URL and a number of supporting field and laboratory tests for getting basic data for thermo-hydro-mechanical-chemical-biological (THMCB) modelling. The major aims of the project were to collect information and experience in designing and constructing a repository in crystalline rock, to test engineered barriers in representative rock and work out theoretical models for predicting and evaluating their function. The project includes characterization of the hydraulic regime in the rock, instrumentation of rock and engineered barriers, design and construction of engineered barriers, and modelling of the performance of these barriers, primarily buffer, backfill and plugs.
The planning of the project started in 1998 and the installation was completed in 2003. Some of the tests will continue for 10-20 years while others will be terminated much earlier. Current evaluation and upgrading of the models by comparison with recorded data have been made.
I) Background and Scope
The need for systematic investigation of the performance of individual repository components and of the integrated system of components in representative crystalline rock requires full-scale field testing and this was achieved by constructing SKB’s URL at AEspoe in the early nineties. The great international interest in the field laboratory and the benefit of having a full-scale repository for common testing of conceptual and theoretical models led to international engagement, which has yielded very valuable results in the form of data from SKB’s main experiment and from installations made by the co-operating organizations. Comparison of predicted and actual THMC data using several theoretical models has given very good information on their applicability.
The overall scope was:
• To simulate part of a future KBS-3 Deep Repository to the extent possible with respect to geometry, materials and rock environment except that radioactive waste is simulated by electrical heaters.
• To test and demonstrate the integrated function of repository components and to compare results with predictive calculations based on conceptual and theoretical models.
• To develop, test and demonstrate appropriate engineering standards and quality assurance methods.
• To simulate appropriate parts of the repository design and construction process.

iv
An important objective was also to build confidence into the capability to predict engineered barrier systems (EBS) performance with models that are developed also for somewhat different conditions than those in the AEspoe HRL.
The main part of the project represents a full-scale version of the Swedish KBS-3V concept for HLW disposal (KBS is the Swedish acronym for “nuclear fuel safety” and “V” denotes “vertical”) and has incorporated all major activities that are necessary for design, construction and testing of a real repository except that it was conducted in a “deposition drift” with only 65 m length and had copper canisters with electrical heaters instead of spent fuel. The most important work comprised:
• Characterization of the hydraulic regime in the rock mass and measurement of changes occurring in the course of the various activities.
• Manufacturing and placement of EBS, i.e. canisters, clay buffer for embedding the canisters, backfill of the deposition drift, and plugs.
• Instrumentation of the rock and EBS for recording processes like heat evolution and hydration and maturation of buffer and backfill.
• Modelling of the most important processes, particularly the hydraulic performance of the rock and the maturation of the buffer and backfill. Figure 1 shows an artist’s view of the Prototype Repository.
Figure 1. The Prototype Repository simulating a part of a future KBS-3V repository. Six full scale copper-shielded iron canisters with electrical heaters are placed in bentonite buffer. The drift is backfilled and a plug separates the inner section - Section I - from the outer section - Section II. A second plug separates the Prototype Repository from the rest of the AEspoe HRL. All cables are led in lead-throughs to the neighbouring drift.

v
The part of the test drift located to the left of the central plug (Section I) is planned to be in operation for 10-20 years, while the testing of the outer part, Section II, will be terminated earlier.
The various phases of the project related to the EC-supported project are as follows:
• Planning and scoping calculations as design basis prior to the main field test (1998-2000).
• Manufacturing of components for engineered barriers, i.e. canisters, buffers and backfills (2000-2003).
• Installation and instrumentation of engineered barriers (2001-2003). • Running of the field experiment (2001-2004). • Supporting field and laboratory experiments (2001-2004). • Theoretical modelling (2001-2004).
II) The Test Site The hydraulic regime in the rock The basis of defining and determining the hydraulic regime in the rock is the structural constitution and this requires comprehensive field investigations and modelling on different scales. A large number of short and long boreholes have been drilled to characterize the rock mass. They are used for long-time monitoring of water pressure and sampling for chemical analysis and temperature and deformation sensors have been installed in some of the boreholes sections. Tubing and cables from the borehole sections are led to a nearby drift where most of the monitoring and controlling equipments are located and water is sampled.
Cored boreholes were made for characterisation of the rock around the test area and most of them are equipped with packer systems for:
• Monitoring the chemical/microbial conditions.
• Water sampling.
• Dilution measurement.
• Interference tests.
• Hydro mechanical measurements (HM) and tests.
Among the most important activities were measurements of the inflow of water into the test drift and into the deposition holes. These data were necessary for taking decisions on practical issues like the need for drainage of the drift in and after application of the backfill, and for assessing the models used for predicting groundwater flow in the near-field.

vi
Instrumentation of the rock and EBS The major objective of the instrumentation of the rock was for hydraulic characterization of the near- and far-field and for performing rock mechanical investigations in the construction and operation phases of the simulated repository. Instruments have been installed to allow measurement of the stress redistribution due to excavation and temperature increase in the host rock around the deposition holes. Monitoring of strain and deformations takes place both within intact rock and in discrete fractures and fractures zones.
The most important issues in the maturation of buffer and backfill are the hydration rates and development of swelling pressures. Most of the deposition holes are equipped with thermal and moisture sensors, pressure and strain gauges. Equipment for measuring canister movement is installed in two of the holes. A principle adopted in selecting suitable instrumentation was to use at least two different measuring principles for each variable. This turned out to be very valuable since some of the sensors were sufficiently sensitive only within certain ranges and some were less reliable than others.
A comprehensive hydro-chemical sampling program has been defined and followed, the objectives being:
• Monitoring the chemical/microbial function.
• Testing of chemical/microbiological models & hypotheses.
• Investigating the effect of temperature on groundwater-rock interactions.
• Investigating the buffer clay redox chemistry.
• Investigating possible presence of microbes and colloids.
All these studies required that contamination had to be avoided and great care was taken to prevent atmospheric oxygen gas from diffusing into the sampling systems, and to use bentonite packers enclosed in rubber sealing for avoiding contamination by colloidal mineral particles.
Manufacturing and placement of engineered barriers (EBS) The six deposition holes with 8 m depth and 1.75 m diameter had been bored prior to the field experiment by using a new method that gave very accurate dimensions and orientation. The buffer consisted of MX-80 bentonite blocks with 1.65 m diameter and a height of 0.5 meters and bentonite pellets filling of the gap between the blocks and the rock. The blocks were prepared by compacting bentonite granulate under pressures up to 100 MPa yielding an average dry density of 1.67 Mg/m3 and a block weight of around 2 Mg. They were put in place by use of a gantry-crane in which the blocks were hung and lowered to form a column in the centre of the holes in which the respective canister was placed. These activities were successful and demonstrate that a number of practical problems related to waste application have been solved.

vii
The drift was backfilled with clayey soil in 200 mm layers inclined by 35°. The innermost 10 m long part of the drift was backfilled with coarse, self-draining soil in 400 mm thick layers for discharging water from the very wet rock. Bentonite blocks were placed in the gap at the roof. The rest of the drift was backfilled with a mixture of 30% MX-80 bentonite and 70% crushed rock (30/70).
When the backfilling had progressed to the position of the plugs the first step was to insert prefabricated concrete beams behind which the backfilling continued until the roof was approached. The remaining volume was filled with blocks containing 20 % bentonite and 80 % sand. Bentonite pellets were used for adjusting the density and hence the swelling pressure. When the last beam was in place the backfilling was completed and the construction of the plug could start. It comprised application of a prefabricated form and reinforcement, followed by casting of concrete, which was cooled for avoiding too high temperatures and fracturing.
The strong inflow of water into the inner part of the drift required drainage during the entire installation period. It was made by filling the inner part of the drift with permeable crushed rock and by attaching tight mats to the walls for discharging water to a sump excavated in the floor of the drift and further to the drain system of the AEspoe HRL.
Modelling of the performance of rock and EBS Rock The rock between major water-bearing features on all scales has a low hydraulic conductivity and the concept of “porous medium” water flow is believed to be applicable. However, the large-scale hydraulic performance of the rock mass is assumed to be determined by the conductive fracture zones in combination with a stochastic network of finer discontinuities. As an average, the hydraulic conductivity in the interval 300-500 m depth is predicted to range between E-11 and E-9 m/s, while the average transmissivity of major fracture zones in the numerical model varies between E-5 and E-8 m2/s. The groundwater pressure has been calculated by use of the code DarcyTools. Modelling of groundwater pressure in the near-field using the same code as for the large-scale hydrological modelling has given a water pressure at 2 m distance from the drained drift wall between 100 kPa and 1.5 MPa after completing the backfilling. The project has not yet been conducted sufficiently long to make it possible to compare actual data with the theoretical predictions.
Buffer and backfill The predictions were at least partly “blind” and comparison with actually recorded data was hence of great interest. The major conclusions were the following:
• The development of the temperature regime is captured well and the results illustrate that the temperature regime is well understood and represented by the codes.
• The simulated hydration rates in the buffer for the “wet hole” (hole 1, innermost hole in Figure 1) show reasonable agreement with the experimental results

viii
although there is some over-prediction of drying in the initial stages, i.e. the first 100 days.
• The recorded data seem to exaggerate the hydration rate, as all the theoretical predictions indicated too quick hydration of the buffer. One explanation to this may be water leakage along cables and tubing.
III) General Conclusions
The various Work Package activities have followed the original plan with some delay but the outcome is very valuable in several respects:
Preparation, installation, instrumentation, prediction • The instrumentation of rock, buffer and backfill has been successful and the
large majority of the gauges and recording units have operated without failure and with expected accuracy. One problem appears to be that water has leaked along cables leading into the interior of the buffer and backfill thereby causing more rapid moistening than where there are no instruments. This seems to have caused certain false indication of the hydration rate of the buffer and backfill, which can have misled the modellers somewhat.
• The preparation of deposition holes and installation of canisters, buffer and backfill has followed the plans and caused no major problem except that the inflow of water in the inner part of the test drift (Section I) has required continuous drainage in a way that can not be made in a true repository. Hence, in the future, research and development are needed for sealing of deposition drifts or one has to select a backfill method that can be applied also when the inflow is this high.
• Prediction of the performance of the rock, buffer and backfill by applying the proposed conceptual and theoretical models has illustrated their applicability and shortcomings. As to the hydraulic performance of the near-field rock and its relation to the rock structure it has not been possible to work out and apply reliable models. However, it is an obvious fact that the models used for predicting the maturation of buffer and backfill give data that are sufficiently good for practical use, if the considered period is short and the rock gives off rather much water, while it is not clear if they can provide reliable predictions if the rock gives off only very little water to the deposition holes. Since delay in maturation may have a substantial impact on the long-term performance and chemical stability of the buffer, research and development are required for improving the knowledge and modelling ability. For this purpose continuation of the project to cover a period of 20 years would be very valuable.

ix
Scientific achievements The major scientific achievements refer to the hydraulic performance of the rock in the sense that large-scale modelling of groundwater flow can be made with fair accuracy, and that the hydration of clay buffer can be predicted fairly well under certain hydraulic conditions in the rock. However, as discussed and debated in workshops at Sitges and Lund in 2003 and 2004 that were arranged in conjunction with the modelling activities of the project, it seems that the true nature of the hydration and homogenization of the buffer is not sufficiently well known. Thus, the hydration of the buffer may be controlled rather by molecular diffusion of water than by suction-generated flow through the partly saturated clay matrix. More research and development of this issue would be needed in order to verify this assumption.
Technological achievements The Prototype Repository project has yielded a number of innovative techniques and very valuable practical experience. This includes the manufacturing of canisters and mega-sized buffer blocks and placement of these objects on site on a full scale. Other achievements of great value in future disposal of HLW are:
• Preparation of large-diameter deposition holes with required straightness and steepness at reasonable cost.
• Development of practically useful tools and techniques for placement of canisters and buffer blocks.
x
Table of Contents
1 Objectives and strategic aspects ............................................................................... 1 1.1 KBS-3 method .......................................................................................................... 1
2 Description of the test arrangement.......................................................................... 3 2.1 General ..................................................................................................................... 3 2.2 Design of instrumentation and manufacturing of sensors (WP1) ............................ 4
2.2.1 General ........................................................................................................ 4 2.2.2 Measurement of thermo-hydro-mechanical (THM) processes in the buffer
and backfill................................................................................................... 4 2.2.3 Geochemistry ............................................................................................. 13 2.2.4 Electrical resistivity.................................................................................... 14 2.2.5 Displacement of canisters........................................................................... 16
2.3 Emplacement of bentonite buffer, disposal of canisters with heaters, backfilling of drift and construction of plugs (WP2). ................................................................... 17 2.3.1 General ....................................................................................................... 17 2.3.2 Preparative work and installation of sensors.............................................. 18 2.3.3 Emplacement of buffer and disposal of canisters....................................... 19 2.3.4 Emplacement of backfill ............................................................................ 23
3 Conceptual modelling of the function of EBS and application and development of mathematical models for describing important processes in the integrated EBS performance (WP3) ................................................................................................ 28
3.1 General ................................................................................................................... 28 3.2 Hydraulic conditions .............................................................................................. 28
3.2.1 Geochemistry ............................................................................................. 28 3.2.2 Hydraulic performance of the rock ............................................................ 29
3.3 Laboratory tests on buffer and backfill properties ................................................. 32 3.4 Laboratory tests on mechanical properties of rock and THM processes in rock ... 33 3.5 Laboratory investigation of cracks in EDZ ............................................................ 34 3.6 T, TM, HM and THM rock modelling ................................................................... 35 3.7 THM modelling of buffer, backfill and their interaction with near-field rock....... 36
3.7.1 Major processes.......................................................................................... 36 3.7.2 Conceptual modelling ................................................................................ 36 3.7.3 Theoretical modelling of THM processes.................................................. 37 3.7.4 Recording of THM..................................................................................... 41 3.7.5 Prediction of THM evolution for comparison with actual recordings ....... 43 3.7.6 Comparison between predictions and recordings....................................... 45 3.7.7 Extrapolation of the THM evolution over longer periods of time ............. 49 3.7.8 Application of theoretical models to the Prototype Repository project –
the backfill.................................................................................................. 49 3.8 C modelling of buffer, backfill and groundwater ................................................... 50
3.8.1 Prediction of the chemical constitution of the groundwater in the near- field rock and the porewater of backfill and buffer.................................... 50
3.8.2 Comparison of predictions of water geochemical data with other observations................................................................................................ 50

xi
4 Assessment of results and conclusions................................................................... 51 4.1 General .................................................................................................................. 51 4.2 Scientific achievements .......................................................................................... 51 4.3 Technological achievements .................................................................................. 52
5 Acknowledgements ................................................................................................ 53
6 References .............................................................................................................. 54
Appendix 1 .................................................................................................................... 56
Appendix 2 .................................................................................................................... 59

1
1 Objectives and strategic aspects The objectives of the Prototype Repository project are to simulate part of a future KBS-3V deep repository to the extent possible with respect to geometry, design, materials, construction and rock environment except that radioactive waste is simulated by electrical heaters, and to test and demonstrate the integrated function of the repository components. Additional objectives of the Prototype Repository, which will be operated for up to 20 years, is to develop and demonstrate appropriate engineering standards and quality assurance methods like definition and determination of the geometry of bored deposition holes and of the mineral and grain size compositions and densities of buffers and backfills, as well as to accomplish confidence building as to the capability of modelling EBS (engineered barrier systems) performance. The latter is effected by providing data for predicting the performance of the system by use of models that are available or will be developed.
1.1 KBS-3 method The KBS-3 method was initially developed in Sweden and the acronym ”KBS” is short for “spent nuclear fuel safety” in Swedish. The main characteristics of this method are:
• Copper canister with insert of cast steel
• Buffer of bentonite clay surrounding the canisters.
• Emplacement in vertical bore holes.
• Repository depth of 400-700 m in crystalline rock.
• Backfilling of deposition drifts with bentonite-based material.
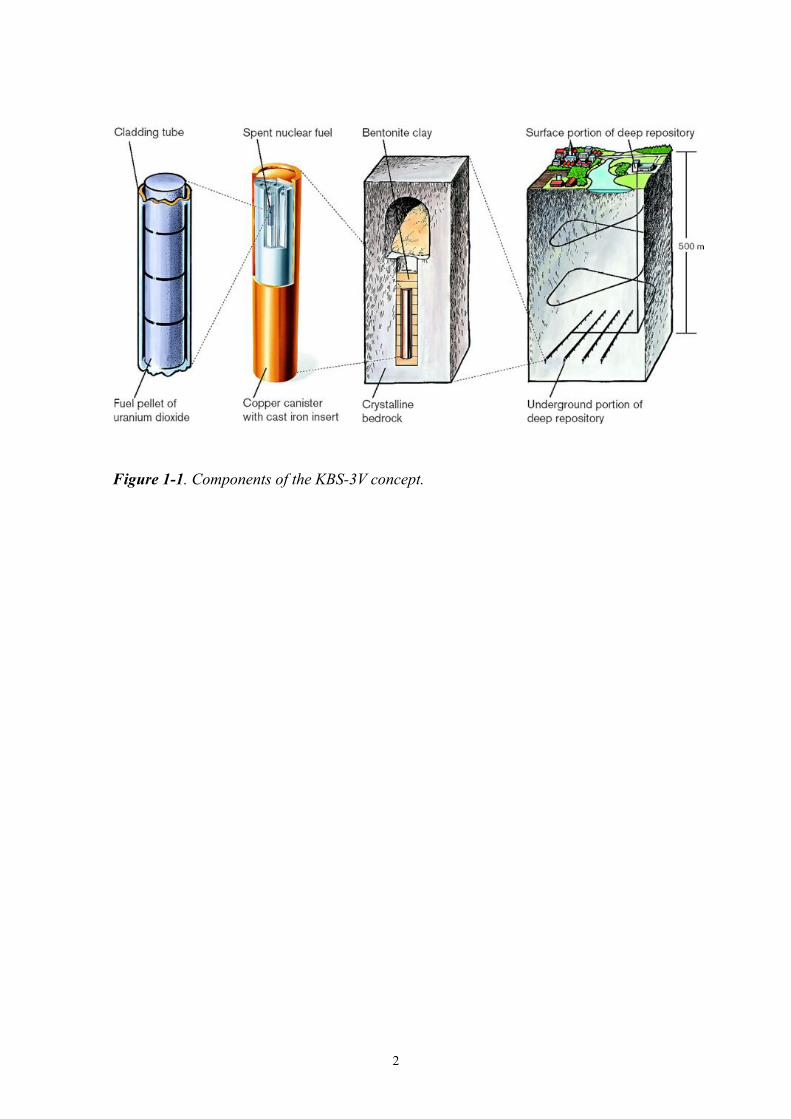
The KBS-3V concept is illustrated in Figure 1-1.
The Prototype Repository project is set up to simulate a part of the KBS-3V repository under realistic conditions regarding geometry, materials and rock environment. In one respect is this, however, not possible; the spent fuel is replaced by electrical heaters for simulation of the heat generation.
The objectives of the Prototype Repository project are:
• Test and demonstrate the integrated function of repository components and compare results with predictive calculations.
• Develop, test and demonstrate appropriate engineering standards and QA methods.
• Simulate appropriate parts of repository design and construction.
• Operate the Prototype Repository for up to 20 years.
2
Figure 1-1. Components of the KBS-3V concept.

3
2 Description of the test arrangement 2.1 General The project consists of two sections, one with four canister positions and one with two, see Figure 2-1 /D1/. The two sections are separated by a plug cast with self-compacting concrete. A second plug separates the test from the other parts of the AEspoe HRL.
8 m6 m9 m9 m6 m13 m 6 m 6 m
Section I
Backfill 30/70
Section II
Backfill 30/70
Section I Section II
H ole 1 2 3 4 5 68 m6 m9 m9 m6 m13 m 6 m 6 m
Section I
Backfill 30/70
Section II
Backfill 30/70
Section I Section II
H ole 1 2 3 4 5 6
Figure 2-1. Schematic view of the Prototype Repository. The drift front is to the left, and the numbering of canister positions starts from the left, i.e. Hole 1 is located innermost.
All work that has been carried out in the frame of the European Commission (EC) project was grouped into three Work Packages in a way that was judged practical from the execution point of view. These Work Packages are:
WP1 Design of instrumentation and manufacturing of sensors.
WP2. Emplacement of bentonite buffer, disposal of canisters with heaters, backfilling of drift and construction of plugs.
WP3. Conceptual modelling of the function of engineered barrier systems EBS and application and development of mathematical models for describing important processes in the integrated EBS performance. Supporting laboratory and field experiments.
Several main preparation steps had already been taken when the EC project started, like excavation of the drift, boring of the deposition holes and substantial geo-scientific characterisation of the rock in the area. In conjunction with this a number of machines and other equipments had been manufactured and tested for practical use. In the course of the project several other activities were carried out outside the EC contract such as development and construction of utilities for remote handling and emplacement of full-size canisters, and manufacturing of vibratory equipments for in situ placement and compaction of clayey backfills.

4
The following describes the result of the work with focus on the three mentioned Work Packages. Results are also presented from other activities in the project where such information is judged to make the presentation more clear.
2.2 Design of instrumentation and manufacturing of sensors (WP1)
2.2.1 General The prime principle in selecting sensors for the buffer, backfill and near-field rock was to choose among those that have been found to operate well in other projects and which could be manufactured with high quality. The final selection was based on the experience of the respective project participants. Special circumstances in the Prototype Repository are the geochemical conditions and the long time during which the test will be conducted and the related requirements that the sensor design and manufacturing will have to meet.
The required number of sensors became a compromise between the wish for complete instrumentation of the entire test set-up, and the number that actually could be put in with respect to the number and size of cables, and to the risk of interference of adjacent gauges.
2.2.2 Measurement of thermo-hydro-mechanical (THM) processes in the buffer and backfill
The objectives of performing measurements was to determine the actual rate of heating and wetting and the build-up of hydraulic and swelling pressures, which are all of fundamental importance to the function of the engineered barriers.
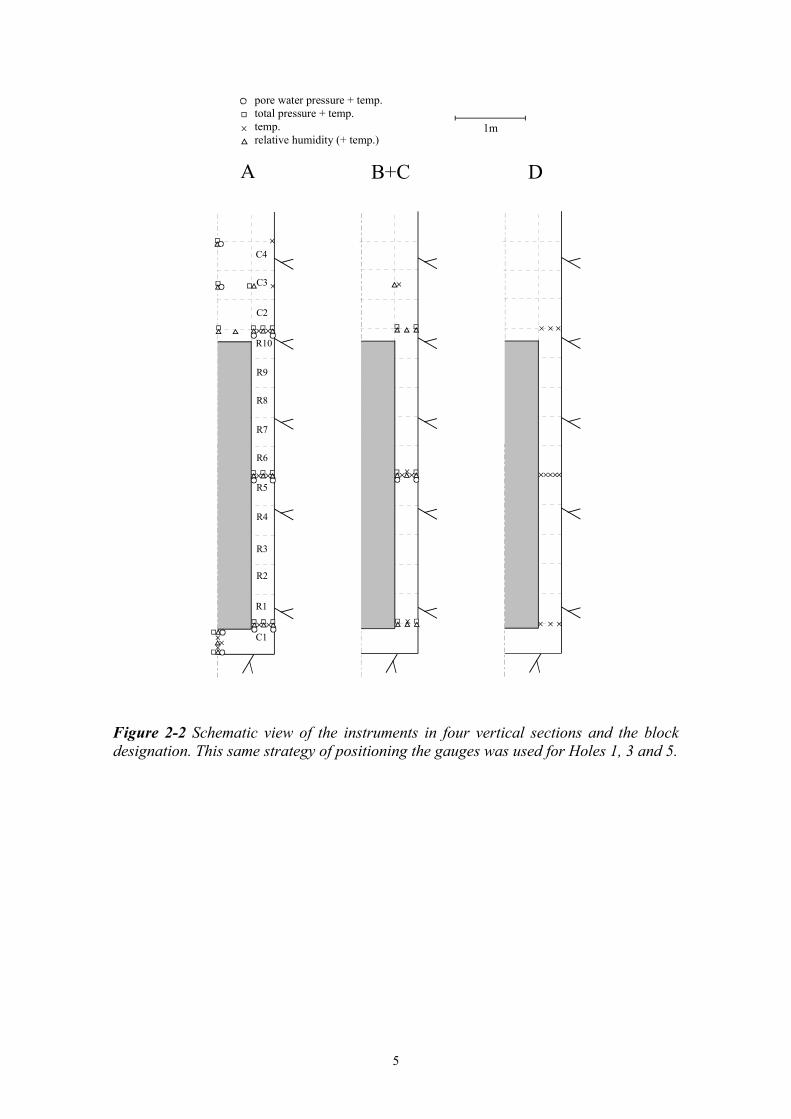
Four of the six deposition holes are instrumented, namely Holes 1 and 3 in Section I and Holes 5 and 6 in Section II. Holes 1, 3 and 5 are instrumented in the same way, i.e. the instruments are placed in four vertical sections according to Figure 2-2 with the exception of Hole 6 which was instrumented according to Figure 2-3, i.e. with the gauges placed in eight directions (four directions in each instrumented block) in order to avoid influence of instruments located between the measurement point and the rock /D2, D3 and D18/.
5
pore water pressure + temp.total pressure + temp.temp.relative humidity (+ temp.)
A B+C D
1m
C1
R1
R2
R3
R4
R5
R6
R7
R8
R9
R10
C2
C3
C4
Figure 2-2 Schematic view of the instruments in four vertical sections and the block designation. This same strategy of positioning the gauges was used for Holes 1, 3 and 5.

6
Hydrochemical sample collector, 50 mm under block surface
Total pressure, Geocon
Total pressure, Kulite
Pore pressure, Geocon and Kulite
Relative humidity, Vaisala and Rotronic
Relative humidity, Wescor
Temperature
W
W
W
W
W W
W
W
1
2
3
4
5
6
Figure 2-3. Schematic view of the instrument positions in Hole 6.
Measuring principles and instruments A desire when choosing instruments for the experiment was to use at least two different measuring principles for each of the THM parameters.
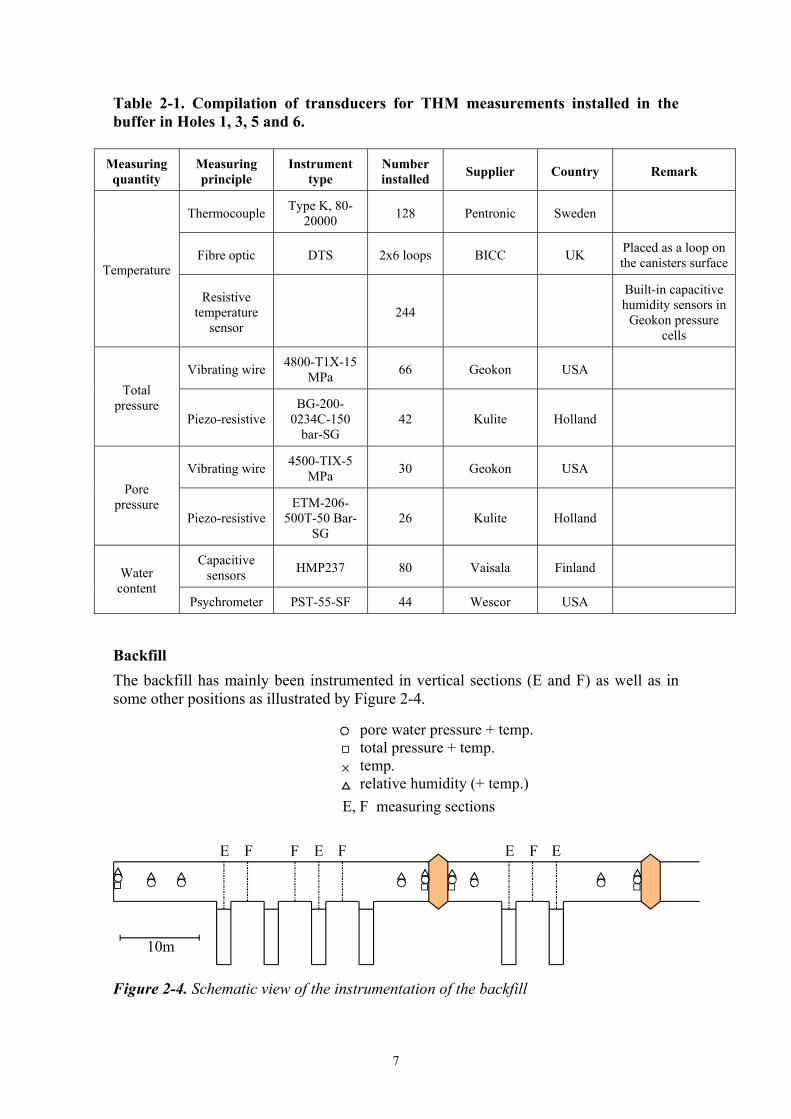
Buffer Table 2-1 shows a compilation of the most important equipment installed for recording the processes in the buffer related to temperature, wetting rate and pressure build-up.
7
Table 2-1. Compilation of transducers for THM measurements installed in the buffer in Holes 1, 3, 5 and 6.
Measuring quantity
Measuring principle
Instrument type
Number installed Supplier Country Remark
Thermocouple Type K, 80-20000 128 Pentronic Sweden
Fibre optic DTS 2x6 loops BICC UK Placed as a loop on the canisters surface Temperature
Resistive temperature
sensor 244
Built-in capacitive humidity sensors in
Geokon pressure cells
Vibrating wire 4800-T1X-15 MPa 66 Geokon USA
Total pressure
Piezo-resistive BG-200-
0234C-150 bar-SG
42 Kulite Holland
Vibrating wire 4500-TIX-5 MPa 30 Geokon USA
Pore pressure
Piezo-resistive ETM-206-
500T-50 Bar-SG
26 Kulite Holland
Capacitive sensors HMP237 80 Vaisala Finland Water
content Psychrometer PST-55-SF 44 Wescor USA
Backfill The backfill has mainly been instrumented in vertical sections (E and F) as well as in some other positions as illustrated by Figure 2-4.
10m
pore water pressure + temp.total pressure + temp.temp.relative humidity (+ temp.)
E F EF F E F E
E, F measuring sections
Figure 2-4. Schematic view of the instrumentation of the backfill

8
Rock Hydraulic conditions
A large number of boreholes have been made for characterizing the rock mass. These boreholes were used for the long-time monitoring of the Prototype Repository /D4 and D5/. One to five packers in each borehole have been installed for monitoring of the water pressure and water chemistry in defined and isolated parts of the boreholes. Temperature and deformation gauges have been mounted in some of the boreholes sections. Tubes and cables from the borehole sections are led to the nearby drift with equipment for recording pressure, deformation and temperature and with utilities for water sampling. Hydraulic tests have been performed from the neighbouring drift by pressurizing individual borehole sections and measuring water flow and pressure response.
Characterisation of the rock around the Prototype Repository involved boring of a large number of cored holes. Most of these boreholes were equipped with packer systems for:
• Pressure measurements.
• Water sampling.
• Dilution measurements.
• Interference tests.
• Hydro- mechanical measurements (HM) and TM tests.
In some of the boreholes temperature measurements were executed. An overview of the instrumentation is given below:
Section I number
Bentonite packers (1-2 m long, 2-5 packers in each 8-50 m borehole): 49
Mechanical packers (one in each 2 m borehole, stainless): 16
Pressure measurement sections: 65
Circulation sections (two tubes) 5
Flow sections (one-two tubes) 7
Hydrochemical sections 6
Temperature 37
Section II
Inflatable packers (1m long, 1-5 in each 3-30 m borehole): 46
Mechanical packers (one in each 2 m borehole, stainless steel): 6

9
Pressure measurement sections 52
Circulation sections 10
Flow (one tube): 3
HM sections (Deformation+temperature. Same as circulation sections) 10
Nearby drift and investigation hole from this drift (core hole KA3510A01 )
Inflatable packers (1m long, 5 in each 49-150 m borehole) 15
Pressure measurements sections (5 in each borehole) 15
Circulation sections (holes from nearby drift) 2
Flow (one tube, KA3510A01) 1
Hydrochemical sections (holes from nearby drift) 2
HM sections (reference in nearby drift, the north drift wall) 1
Outer plug
Inflatable (1 m long, 3 in each 15 m borehole) 12
Pressure measurement sections (including measurements around plug): 12
The boreholes with hydro-monitoring sections in the Prototype Repository are shown in Figure 2-5.

10
Figure 2-5. Boreholes with hydro monitoring sections in the Prototype Repository in Section I (upper) and Section II (lower). Packers are marked with a wide cylinder. Measurement sections are (each type not specifically marked on the figures): pressure sections (P), hydro-chemical sections (HC) + P, flow sections (F) + P, circulation sections (C) + P and hydro- mechanical sections (HM) +C+P.

11
Mechanical conditions
The major objective of the rock mechanical studies was to verify rock mechanical processes in the construction and operation phases of the Prototype Repository project. Instruments have been installed to measure the stress redistribution due to excavation and temperature increase in the host rock around the deposition holes /D6/. Monitoring of strain and displacements takes place within intact rock as well as in and along single fractures and fractures zones (Holes 5 and 6). The test arrangement was such that disturbance of the engineered barriers and of the interaction with surrounding rock were minimized.
The instruments for monitoring rock mechanical response were installed at two stages. The instruments used to monitor the effect of the drilling of the canister boreholes were installed within vertical boreholes located 0.3 m from the periphery of the deposition hole. After completing the deposition holes complementary instruments were installed within boreholes drilled from the inside of the deposition holes.
Tables 2-2 and 2-3 show numbers and types of instruments selected for installation to allow monitoring of stresses and strains within the host rock surrounding the deposition holes. Figure 2-6 shows the location of gauges making up the majority of the instrumentation.
Table 2-2. Summary of major instruments Parameter measured Instrument type Total number installed
Compressive stress change in intact rock
Geokon model 4350 biaxial stress meter 8
Compressive and tensile stress change in intact rock
Geokon model 4360-1 Soft stress cell 8
Vertical movements in intact rock, over single fractures and within fracture zones
Geokon model 4430 deformation meter 17
Vertical strain measurements in intact rock and over single fractures
Geokon model 4200 strain gauge 7

12
Table 2-3. Summary of accessory instruments Parameter measured Instrument type Total number installed
Horizontal deformation perpendicular to the axis of the deposition hole
Geokon model 4430 displacement transducer 32
Vertical strains beneath the deposition hole
Geokon model 4200 strain gauge 8
Biaxial Stressmeter
Legend:
Soft Inclusion SressCell (SSR/SST)
8 m
A5G5
C5
E5
A6
E6
G6
C6
Periphery of boreholes
Deformation Meter(DM)
Strain Gage (T)
D5:SSRD5:SST
H5:SSRH5:SSTD6:SSR
D6:SST
H6:SSR
H6:SST
A5:DM1
A5:DM2
A5:T1A5:T2
C5:DM1
C5:DM2
C5:DM3
C5:T1
E5:DM1
E5:DM2
E5:DM3
E5:DM4
G5:DM1
G5:T1
G5:DM2G5:T2
A6:T1
C6:DM1
C6:DM2
C6:DM3
E6:DM1
E6:DM2
E6:DM3
E6:T1
A A
Figure 2-6. Primary instrument locations in elevation view. Hole 6 is to the left and Hole 5 is to the right in the figure.

13
2.2.3 Geochemistry Water and gas sampling The objectives of the hydrochemical sampling program were:
• Monitoring of the chemical/microbial function of the Prototype Repository.
• Verification of chemical/microbiological Models & Hypotheses.
• Effect of temperature on groundwater-rock interactions.
• Determination of buffer bentonite redox chemistry.
• Investigations of the presence of microbes and colloids.
To meet these requirements it was important to avoid chemical and microbial contamination of the samples. To study the redox conditions it was also important to prevent atmospheric oxygen gas from diffusing into the sampling system. By using PEEK in the tubes, the system is expected to be diffusion-tight. Bentonite packers in boreholes could possibly induce massive contamination of the Prototype Repository near field with bentonite colloids, and this would jeopardize the chemical monitoring. Therefore, boreholes have been instrumented with bentonite packers with the bentonite enclosed in rubber containers.
Overview of instrumentation Two types of sample collectors have been installed /D7and D8/.
In total, 12 sample collectors have been placed in the bentonite in each of Holes 1, 5 and 6. The sample collectors consist of a titanium cup with a titanium filter on the top. Pore water from the bentonite will, after saturation of the material, flow through the filter and into the cup. When the test is terminated and the excavation of the bentonite starts, the cups will be located and the water analyzed.
Fifteen additional samplers were installed: 9 in the backfill, 1 on top of Holes 1 and 3 and 2 on top of Holes 5 and 6.
Test of cellulose and concrete stability Cellulose is degraded by contact with cement porewater. A major reaction product is isosaccharinic acid (ISA), which can form strong complexes with polyvalent cations at high pH. This can increase their solubility but ISA has itself a tendency to be sorbed in concrete making it less harmful to the concrete as a barrier to radionuclide migration. Bacterial degradation of ISA has also been postulated. Cellulose is a normal component in low level radioactive waste. In a repository for spent fuel there is no cellulose present if not left as stray materials, for example debris of wood, paper etc. So far the degradation of cellulose and sorption of ISA in concrete has only been demonstrated by laboratory experiments and is therefore investigated in the Prototype Repository.
14
Samples of concrete and cellulose have been installed in the backfill near the floor so that groundwater can enter the samples /D 15/. The samples consist of tissues of paper, cloth and wood and are placed separately between slabs of concrete. The cellulose/concrete-sandwich was placed in and covered with sand for protection and to ensure fluid saturation. Some of the cellulose samples have been separated from the concrete slabs by a few mm of bentonite to see if this stops concrete-porewater from migrating and degrading the cellulose.
Cellulose samples were obtained from OKG (Oskarshamns Kaernkraftsaktiebolag). They consist of;
1. Wood.
2. Masonite.
3. Cardboard.
4. Coverall clothes made of
• Tyvek Pro.Teck (Du Pont).
• Cotton (Bicapa-Bjoernklaeder AB).
1. Shoe covers (slippers) from Bicapa-Bjoernklaeder AB.
Concrete samples were prepared by Vattenfall Utveckling AB. Five different cement compositions have been used,
Cement used at SFR (Final repository for LLW and MLW) without additives:
• “Kringgjutningsbruk” (Concrete cast around waste packages).
• “Konstruktionsbetong” (Construction concrete) with 0.5 water/cement ratio.
Cement used at SFR (“konstruktionsbetong” with 0.5 water/cement ratio) with additives:
• Melanin.
• Naphthalene.
• Modern polymer additives used in self-compacting concrete.
During dismantling of the Prototype Repository the concrete and cellulose samples will be collected, brushed to remove excess of backfill material, left to dry, and sent for analysis of cellulose degradation.
2.2.4 Electrical resistivity Within the framework of research in the project, GRS, Germany, made measurements of the electrical resistivity in the backfill and buffer for monitoring the water uptake in the backfill, in the buffer, and in the rock between two of the deposition holes for

15
recording changes in water saturation /D9-D10/, see Figure 2-7. The electrical resistivity in the buffer was determined by use of multi-electrode arrays consisting of electrode chains. The resistivity distribution in the areas between the chains was determined by means of tomographic dipole-dipole measurements. The recording unit for these arrays was controlled remotely from Braunschweig in Germany through a telephone connection, which allowed daily data transfer of the in situ resistivity distribution. From the measured apparent resistivity values the "true" resistivity distributions in the different parts were computed applying appropriate software. By geoelectric measurements advantage is taken of the dependence of the electrical resistivity of the porewater (solution) content. In order to interpret the resistivity values in terms of water content the data are compared with those from laboratory calibration.
18 m 6 m
40 m 25 m
5 m
double cross aray in the backfill
3 chains in the rock between boreholes 5 and 63 chains in buffer at top of borehole 5, 1 chain in the rock
8 m
Backfill
Canister
Buffer
Section IILead ThroughBorehole
1 GISMA socket, 37 Pins
ELOCAB Cable
Lead ThroughBorehole
4 GISMA socket, each 37 Pins
1 GISMA socket, 37 Pins
Lead ThroughBorehole
Section I
Figure 2-7. Overview of electrode arrangements in the Prototype Repository
A double cross array consisting of 36 single electrodes each with a spacing of 0.5 m has been installed on a 35° inclined backfill ramp above Hole 3 in Section I and above Hole 6 in Section II. These arrays monitor the resistivity distribution in the backfill. The array in Section I was installed in October 2001 and the one in Section II in June 2003.
The resistivity in the buffer at top of Hole 5 was determined by dipole-dipole measurements between one horizontal electrode chain at the surface of the buffer and three vertical chains installed in the centre of the buffer, about 100 mm from the borehole wall, and in boreholes located 300 mm outside the deposition hole. The electrode spacing was 100 mm for the horizontal chain and 150 mm for the vertical

16
chains. The resistivity distribution was determined in the plane enclosed by the buffer electrodes. The installation took place in April 2003.
The resistivity distribution in the rock in the immediate vicinity of two of the deposition boreholes was monitored with electrode chains installed in three vertical boreholes in the rock between deposition Holes 5 and 6. This installation was made in January/February 2002.
2.2.5 Displacement of canisters Displacement of canisters can be of great practical importance and steps were taken to record canister movements in the field experiment. Gauges were installed in Hole 3 in Section I and in Hole 6 in Section II by AITEMIN /D11/. Their location is shown in Figure 2-8.
The function of the selected instruments is based on the use of fibre optics so the gauges contain no electronics inside. The major component is a Thin Film Fizeau Interferometer that receives a broadband white light and returns wavelength-modulated light. Hence, it was assured that no electromagnetic interference would affect the readings. It is claimed and believed that the use of fibre optics gauges provides an innovative component to the project.
The chosen model was FOD 25 from Roctest (Canada). Because of the harsh working conditions a rugged version was constructed in Incaloy 825 by the manufacturer for assuring water tightness and corrosion resistance. The dimensions of the gauges are fairly small, which reduces disturbance of the buffer. The cables consist of 4 mm outer diameter reinforced kevlar fibre optics tubing sheathed with ¼ inch outer diameter Incaloy 825 tubing in the buffer, and of polyamide tubing with ¼ inch outer diameter over the rest of their length. A compression-fitting assures water tightness of the connection of the tubings.
canister
bentoniteblocks
sectionmeasuring
bentoniteblocks
measuringsection 2
canister
section 1measuring
Figure 2-8. Location of measuring sections in Hole No. 3 (left) and Hole No. 6 (right) In Hole 3 three gauges were placed in vertical position into holes drilled into the bentonite block. They determine the vertical displacement of the canister and thereby
17
also possible tilting. The spots where the gauges were attached to the canister were the same as for the ones measuring horizontal displacements at this level. Additional gauges in Hole 3 were placed horizontally at the top of the lower bentonite block, close to the bottom end of the canister and attached to the canister with 120º radial disposition. Horizontal displacement of the canister can hence be measured.
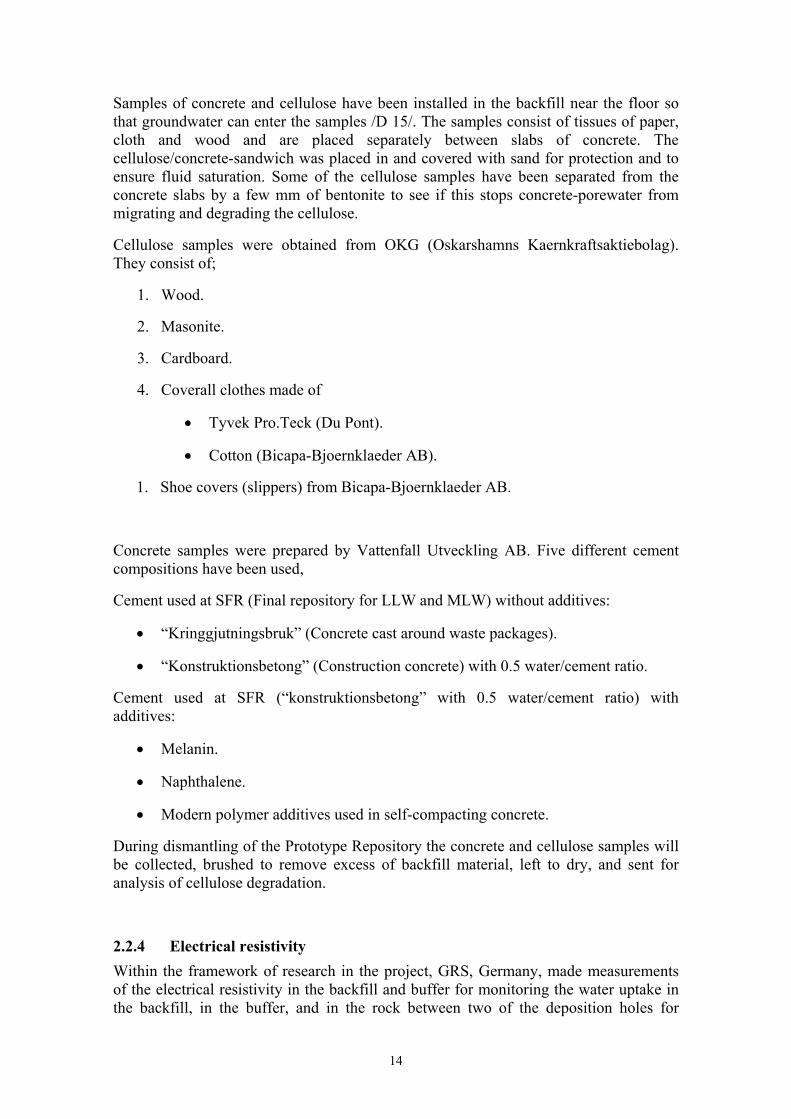
In Hole 6 three sensors were placed in vertical position in the same way as in Hole 3. Gauges for measuring horizontal displacements could not be placed in the lower bottom block but were attached to the tenth bentonite ring, i.e. at the upper end of the canister after its insertion. Figure 2-9 illustrates the location of the six gauges in Hole 6.
Figure 2-9. General view of vertical (left) and horizontal (right) gauges in Hole. 6
2.3 Emplacement of bentonite buffer, disposal of canisters with heaters, backfilling of drift and construction of plugs (WP2).
2.3.1 General
The EBS and canister emplacement procedures in a real repository are described in detail in various SKB reports and papers but the Prototype Repository offered the first opportunity to test them on a full scale in a TBM bored drift at 450-m depth.
The equipment for handling the bentonite blocks, and for deposition of the canisters as well as for emplacement and compaction of the backfill had been manufactured and tested in two other AEspoe HRL projects - the Canister Retrieval Test / Svemar, 1999/ and the Backfill and Plug Test / Boergesson, 1995a/ - before being used in the Prototype Repository Project.
MCA6001
MCA6002
MCA6003
MCA6004MCA6005
MCA6006
upper lid of canister

18
2.3.2 Preparative work and installation of sensors
Before emplacement of the bentonite buffer could be made extensive preparation of the deposition holes and the surrounding rock had to be executed /D12 and D13/. The major ones are:
• Pump pits have been made at the bottom of the deposition holes close to the eastern walls. They were drilled by overlapping of six 100-mm diameter core drillings in two rows to a depth of 200 mm. Before installation of the buffer and canister drainage was made by use of suction pumps located on the drift floor and connected to the pump pits through hoses.
• The bottom of each hole was covered by concrete for levelling. A copper mesh was placed between the base of the hole and the concrete to prevent water pressure build-up.
• In Holes 3 and 4 cores with 95 mm diameter and 350-500 mm length have been taken for examination of the excavation-disturbed zone.
• In Holes 5 and 6, sub-horizontal core drilling has been made in the hole walls to 2.3 m distance from the wall for installation of thermocouples and instruments for rock mechanical measurements. Sub-vertical core drillings were made to 1 m depth in the centre of the bottom of each deposition hole for installation of thermocouples.
The total inflows into the deposition holes were measured by using an ultrasonic transducer logger for recording the rise of the water table in the holes during a week after emptying them. Since the hole geometry was well known the total net inflow could easily be calculated. Table 2-4 shows the results of these measurements.
The location of the inflow spots were identified by measuring the inflow from the hole walls by use of water-absorbing diapers during defined periods of time. The diapers were pressed against the hole wall with wooden boards. These measurements were only performed in Holes 2 and 3.
Table 2-4. Inflow measurements in the deposition holes. Section Hole Inflow, litres per minute
1 Hole 1 DA3587G01 0,08
1 Hole 2 DA3581G01 0,002
1 Hole 3 DA3575G01 0,003
1 Hole 4 DA3569G01 0,0007
2 Hole 5 DA3551G01 0,002
2 Hole 6 DA3545G01 0,003
19
2.3.3 Emplacement of buffer and disposal of canisters
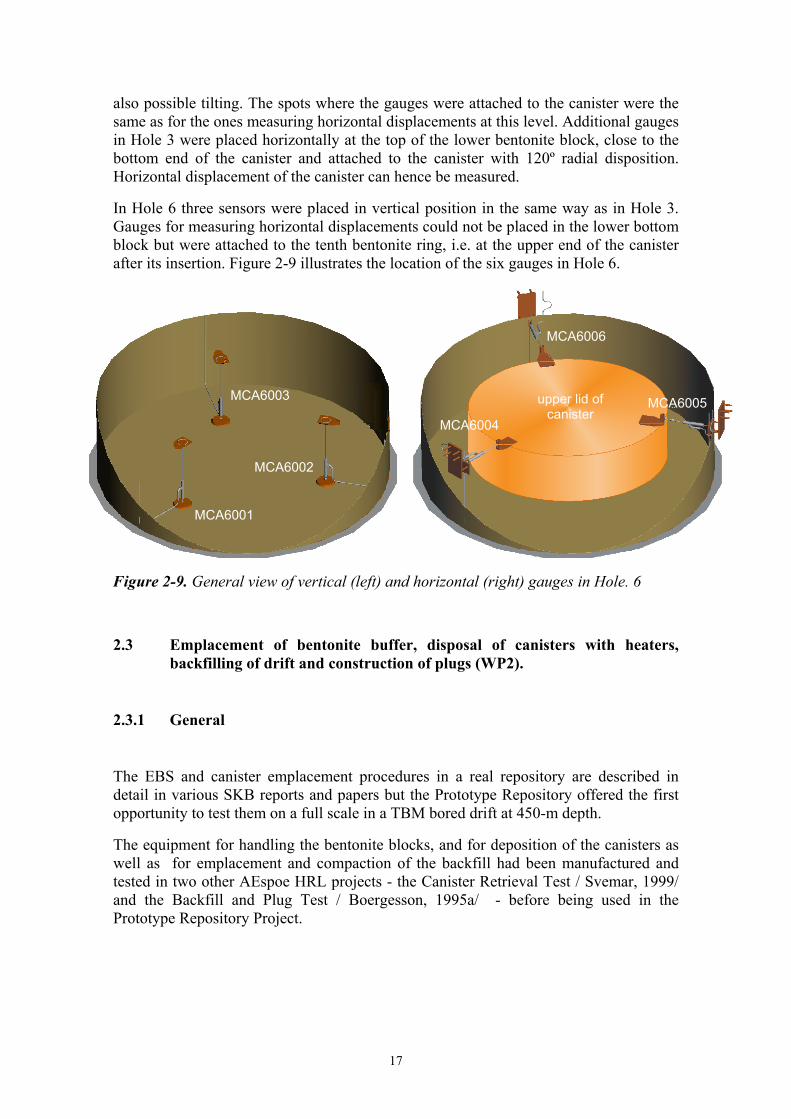
General The buffer material and canisters have been installed in all six deposition holes while instrumentation has only been made of Holes 1, 3, 5 and 6. The layout of a deposition hole with dimensions and designation of the bentonite blocks is shown in Figure 2-10. The activities carried out during the installation of the buffer and canisters are described in /D14 and D15/. The instruments and their positions were described in Section 3.2. After installation of the canister and the buffer in Hole 2, it was discovered that one of the connectors for the heaters had been damaged. The canister therefore had to be lifted up from the deposition hole, repaired and installed again.
∼5000
Ø1650
Ø1750
φ1050
φ1070
Ø1050
Ø1070
∼500
C1R1
R2
R3
R4
R5
R6
R7
R8
R9
C2
C3
C4
R10
Figure 2-10. Layout of a deposition hole with buffer and canister.
The installation of the buffer and the deposition of the canisters in Section I was made from May to August 2001. For Section II the corresponding activity lasted from January to April 2003. The pellets filling of the gap between the buffer blocks and the rock wall of the deposition holes was carried out when the backfilling of the drift hade reached the
20
edge of the respective holes during September to October 2001 in Section I, and during May 2003 in Section II.
Preparative work The emplacement of the buffer blocks and pellets fill was preceded by a number of preparatory steps. A four-legged gantry crane was used for handling and placing the blocks after which a large tube-shaped plastic sheet was attached to the walls of the deposition holes for preventing wetting of the bentonite blocks in the installation phase. The sheet was fixed to the concrete slab at the bottom of the deposition holes with an O-ring. It was removed after the installation of the buffer and the canister by being pulled up from the deposition hole before filling the bentonite pellets
Placement of blocks and canisters The placement of the bentonite blocks was made stepwise in the following way:
• The bentonite block was transported to the gantry-crane in its protecting box and the top of the box then removed.
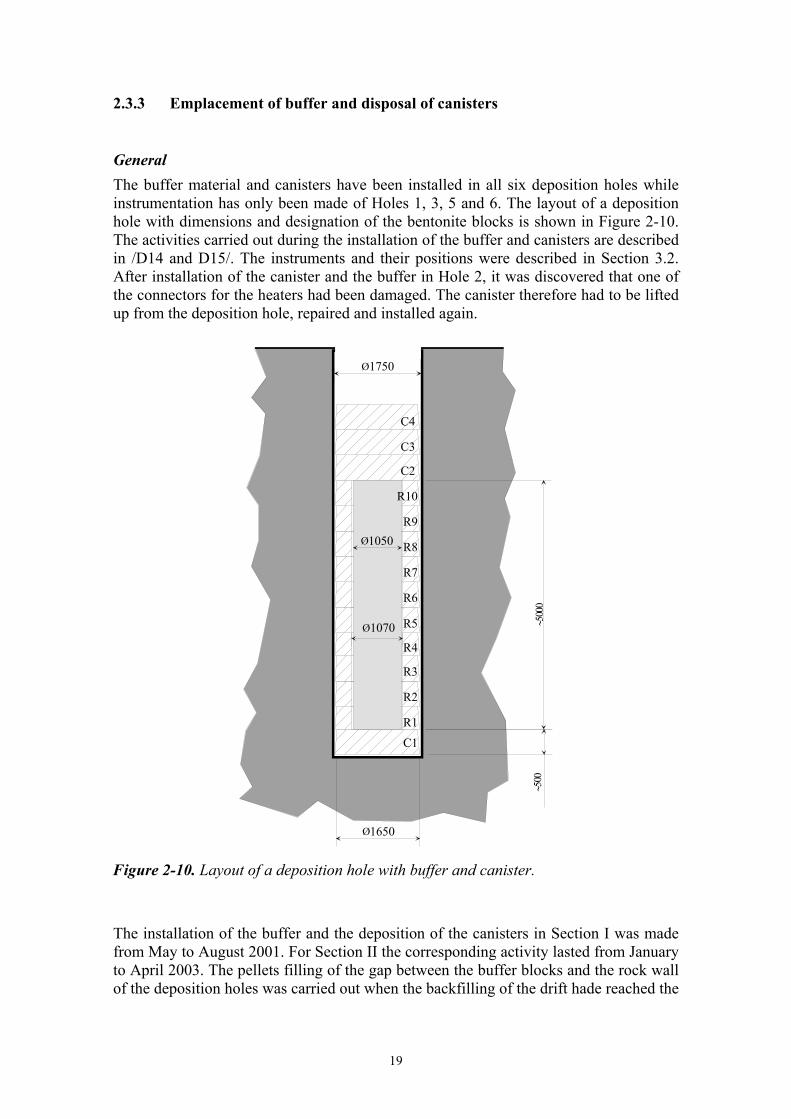
• The block was attached to the lifting equipment by four straps, moved in position and lowered into the deposition hole with the gantry-crane (see Figure 2-11).
• The block was centered in the deposition hole. The final adjustment of the position of the block was made just before the block was put in place in the deposition hole.
• After emplacement the four straps were released from the block and the lifting equipment removed from the deposition hole.
Figure 2-11. A bentonite block lifted by the four straps using the gantry-crane.

21
After emplacement of a bentonite block all instruments that should be in it were installed. The cable protection tubes were bent to fit into the recesses cut in the column of blocks. All remaining empty space was filled with bentonite paste.
Each canister was installed after completing the piling of all the annular blocks, the uppermost one being termed R10. The canister was placed in a horizontal position at the outer end of the drift and transported into it by use of a trailer. The trailer with the deposition-machine was placed over the deposition hole using a truck and the machine lifted so that the trailer could be pulled out and the canister lowered into the open space inside the column of blocks. The procedure is illustrated in Figure 2-12.
Figure 2-12. Installation of the canister with the deposition machine.
The total height of the column of bentonite rings did not exactly match that of the canister and the surplus volume with the height of about 185 mm had to be filled with bentonite bricks with the dimensions 233x114x65 mm3. They were made by uniaxial compaction of MX-80 bentonite with a water content of about 17%. Each block had a dry density of 1.7 Mg/m3 and a weight of about 4000 g.
After emplacement of the uppermost block C4 a plastic sheet was placed on top and attached to the plastic sheet on the rock wall of the deposition hole with tape. The deposition holes with the buffer and canisters were thereby isolated from the water in the rock and moist air until the backfilling had reached the edge of the respective deposition hole. The relative humidity (RH) in the deposition hole and displacements of block C4 were measured frequently. Naturally, the procedure with plastic shielding of the buffer in the installation phase can not be applied in a real repository and other means, like blowing in dry air, have to be found in future research and development.
22
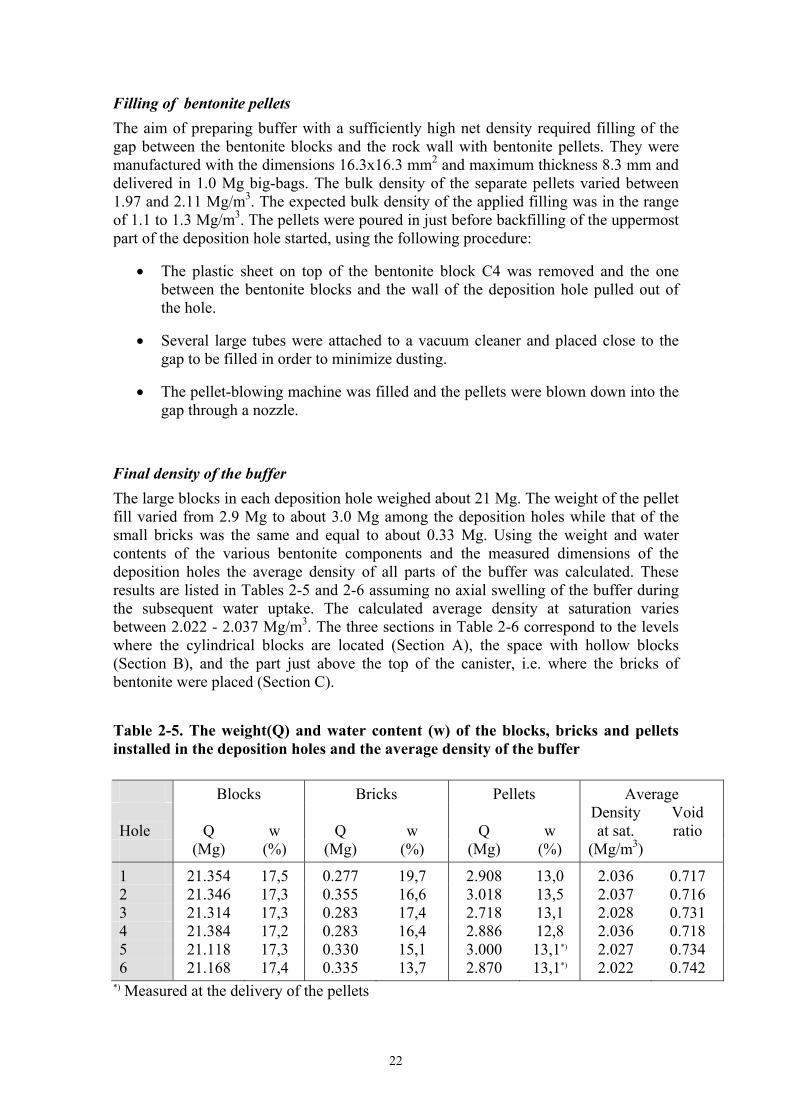
Filling of bentonite pellets The aim of preparing buffer with a sufficiently high net density required filling of the gap between the bentonite blocks and the rock wall with bentonite pellets. They were manufactured with the dimensions 16.3x16.3 mm2 and maximum thickness 8.3 mm and delivered in 1.0 Mg big-bags. The bulk density of the separate pellets varied between 1.97 and 2.11 Mg/m3. The expected bulk density of the applied filling was in the range of 1.1 to 1.3 Mg/m3. The pellets were poured in just before backfilling of the uppermost part of the deposition hole started, using the following procedure:
• The plastic sheet on top of the bentonite block C4 was removed and the one between the bentonite blocks and the wall of the deposition hole pulled out of the hole.
• Several large tubes were attached to a vacuum cleaner and placed close to the gap to be filled in order to minimize dusting.
• The pellet-blowing machine was filled and the pellets were blown down into the gap through a nozzle.
Final density of the buffer The large blocks in each deposition hole weighed about 21 Mg. The weight of the pellet fill varied from 2.9 Mg to about 3.0 Mg among the deposition holes while that of the small bricks was the same and equal to about 0.33 Mg. Using the weight and water contents of the various bentonite components and the measured dimensions of the deposition holes the average density of all parts of the buffer was calculated. These results are listed in Tables 2-5 and 2-6 assuming no axial swelling of the buffer during the subsequent water uptake. The calculated average density at saturation varies between 2.022 - 2.037 Mg/m3. The three sections in Table 2-6 correspond to the levels where the cylindrical blocks are located (Section A), the space with hollow blocks (Section B), and the part just above the top of the canister, i.e. where the bricks of bentonite were placed (Section C).
Table 2-5. The weight(Q) and water content (w) of the blocks, bricks and pellets installed in the deposition holes and the average density of the buffer
Blocks Bricks Pellets Average
Hole Q w Q w Q w Density at sat.
Void ratio
(Mg) (%) (Mg) (%) (Mg) (%) (Mg/m3)
1 21.354 17,5 0.277 19,7 2.908 13,0 2.036 0.717 2 21.346 17,3 0.355 16,6 3.018 13,5 2.037 0.716 3 21.314 17,3 0.283 17,4 2.718 13,1 2.028 0.731 4 21.384 17,2 0.283 16,4 2.886 12,8 2.036 0.718 5 21.118 17,3 0.330 15,1 3.000 13,1*) 2.027 0.734 6 21.168 17,4 0.335 13,7 2.870 13,1*) 2.022 0.742
*) Measured at the delivery of the pellets

23
Table 2-6. Calculated density and void ratio for different parts of the buffer
Section A (cyl. blocks) Section B (canister section) Section C (brick section)
Hole Density at
sat. Void ratio Density at
sat. Void ratio Density at
sat. Void ratio (Mg/m3) (Mg/m3) (Mg/m3)
1 2.048 0,699 2.028 0,732 2.051 0.694 2 2.048 0,698 2.031 0,726 2.040 0.712 3 2.044 0,705 2.017 0,750 2.041 0.710 4 2.046 0,701 2.029 0,729 2.036 0.719 5 2.039 0,713 2.017 0,750 2.053 0.690 6 2.034 0,722 2.012 0,759 2.067 0.668
2.3.4 Emplacement of backfill
Overview of the backfilling The drift was backfilled sideways by applying 200 mm layers inclined by 35°. The innermost 10 m part of the drift was filled with coarse, self-draining material in 400 mm thick layers for discharging water from this very wet part of the drift. The rest of the drift was backfilled with a mixture of 30% MX-80 bentonite and 70% crushed rock (30/70) /D14 and D15/. Bentonite blocks were placed in the gap between the upper surface of the compacted backfill and the roof.
When the backfilling had progressed from the inner end to the first deposition hole the plastic sheet protecting the bentonite blocks in the hole was removed and the space between the blocks and the rock wall filled with bentonite pellets. When this operation was complete the upper part of the deposition hole was backfilled and instrumented. After compaction of this fill the backfilling of the drift continued. The same procedure was repeated for all six deposition holes.
When the position of the plugs was approached the construction of them started by using prefabricated concrete beams that were anchored by angle-irons bolted to the walls of the drift. The backfilling implied application and compaction of 200 mm thick layers until the edge of the first beam was reached where after the second beam was put in place. This procedure was repeated until it was not possible to reach higher with the compaction equipment. The remaining volume was filled with highly compacted blocks containing 20 % bentonite and 80 % sand. Bentonite pellets were used for adjusting the density and hence the swelling pressure. When the last beam was in place the backfill was finished and the construction of the plug could start.
Instruments in the backfill and in the rock were installed in the course of the backfilling operation and ventilation tubes, electrical cables and illumination removed parallel to it. The carrier of the compaction tool needed to come close to the base of the backfill layers in order to compact them for which a special telescopic roadbed segment was constructed. When the backfilling front came close to a roadbed segment, it was moved out of the drift and replaced by the telescopic roadbed.

24
Handling of water inflow into the inner part of the drift The innermost part of the drift was backfilled with porous sand, and the roof and walls of the wet inner part of the drift were covered with a porous plastic mat. The lower edges of the mat were sealed against the rock. The water was led from the porous backfill and the mat to a pump pit that had been excavated in the floor of the drift. This pit was equipped with two pumps for discharging water out from the Prototype Repository. At the end of year 2003 were the discharging tubes plugged whereby the water pressure in and around the experimental site started to increase, as expected.
The problem with inflowing water in the backfilling operation is characteristic of construction in crystalline rock. In a real repository it will hardly be possible to drain the rock in the way applied in the field experiment unless discharge tubes etc. can be pulled out or sealed after the backfilling operation. The Prototype Repository project gave very good information on both possibilities and limitations with respect to allowable water inflow for successful backfilling of drifts and shafts.
Backfilling and instrumentation Construction The backfilling of the layers is described in Figure 2-14. Photos of the roof and slope compactors are shown in Figure 2-15.

25
Figure 2-14. Sequence for backfilling the drift. The required amount of material for each layer was placed at the foot of the slope (upper left). The material was pushed up to form the layer and additional material pushed up to the roof (mid left). Compaction of the layer over the entire area was made by use of the vibrating plate (right row) the material near the roof being compacted with a small vibrating tool (lower left).
Major data for the backfilling were as follows:
• For each layer the required amount of mixed bentonite (30 %) and crushed rock (70 %) was 1.2 Mg.
• A pushing tool was used for moving the backfill uphill to form the 200 mm thick layers with an inclination of 35o.
• A light vibratory roof compactor was used for moving the material in contact with the roof and for compacting it.
• A 400 kg vibrating plate manoeuvred by a crane was moved over the slope surface for compacting it. The number of runs was 5-10 depending on the outcome of density measurements.

26
The construction of the backfill was successful with the exception of the wearing of several of the mechanical components of the compacting tools.
Figure 2-15. The roof compactor (left) and the slope compactor (right) during
compaction.
Before starting the backfilling of the drift the cables and tubes from the instrumentation to be installed in the respective layers were grouped in bundles that extended to the neighbouring drift with the recording units. The various instruments were installed when the backfilling had progressed to the location intended for them. The tubes and sensors were placed in 30 mm deep grooves in the backfill for minimizing disturbance of the backfill and sensors. Bentonite powder was placed on and between the cables for reducing the risk of water flow along them.
Backfilling of the upper part of the deposition holes Ten 100 mm thick layers consisting of the same material as used for backfilling of the drift were applied over the bentonite blocks in each deposition hole, the intended high density requiring effective compaction with smaller tools than in the drift space. A practical problem was that the compaction had to be careful for avoiding damage of the tubes from the instruments in the buffer The first layer was given a low water content (about 5 %) for avoiding early swelling of the nearby buffer.
The layers were given a concave shape for effective compaction near the walls of the holes. The density of the backfill was measured at eight spots in every second layer. The instrumentation was installed in the same way as in the backfill in the drift.
Measurement of density and water content The density and water content of the buffer material were measured in each or every second layer. A nuclear gauge was used for the density measurements in most cases and a penetrometer where the distance from the roof and walls of the drift was small. The working principle of the penetrometer is to measure the resistance when pushing a steel rod into the soil. Calibration gives the relation between force and density.
Figure 2-16 shows a compilation of the results of the dry density measurement in the drift in Section I by use of the nuclear gauge. The average dry density was 1.7 Mg/m3

27
but considerable variations were noticed. Thus, the dry density was found to be 1.65 Mg/m3 for the inner half and 1.75 Mg/m3 for the outer part of the backfill. The reason for the higher density in the latter part is the successively improved technique and increased compaction time decided on the basis of the recordings.
Figure 2-16. Compilation of the average dry density (upper curve) and water content (lower curve) of the layers in Section I.
The results of the measurements in Section II were similar to the results in Section I, but the average density was higher, i.e. 1.75 Mg/m3). The measured dry density of the backfill in the deposition holes varied between 1.55 Mg/m3 and 1.85 Mg/m3. In the last two holes (5 and 6) the compaction time was increased to 30 min per layer and the density was thereby significantly increased.
1,0 1,1 1,2 1,3 1,4 1,5 1,6 1,7 1,8 1,9 2,0
0 20 40 60 80 100 120 Layer ID
Dry
den
sity
(Mg/
m3 )
10,0% 11,0% 12,0% 13,0% 14,0% 15,0% 16,0% 17,0% 18,0% 19,0% 20,0%
Wat
er c
onte
nt
Dry densityWater content

28
3 Conceptual modelling of the function of EBS and application and development of mathematical models for describing important processes in the integrated EBS performance (WP3)
3.1 General The work performed in this work package concerned the near-field rock, buffers and backfills. It was made in the context of nine sub-packages WP3a to WP3i, dealing with:
- Water and gas sampling and analysis.
- Hydraulic tests in rock.
- THM laboratory tests on buffer and backfill properties.
- Laboratory tests on mechanical properties of rock and THM processes in rock.
- Laboratory investigation of cracks in EDZ.
- T, TM, HM and THM rock modelling.
- THM modelling of buffer and backfill and their interaction with near-field rock.
- C modelling of buffer, backfill and groundwater.
Focus in this section is on EBS issues, particularly the comparison of predicted and recorded performance of the buffer and backfill with special respect to their interaction with the near-field rock.
3.2 Hydraulic conditions
3.2.1 Geochemistry Water samples have been taken as part of the comprehensive geochemical program for recording and predicting the geochemical evolution of the groundwater in the near-field and far-field rock /D24/.
The initial analyses showed a decrease in oxygen content, and a reverse correlation between oxygen and methane. These and other data indicate that there is a significant gas exchange going on between the Prototype Repository and the surrounding drifts. Such a process may occur, if there are fluctuating pressure differences between the inside and outside of the Prototype Repository, implying that the Prototype Repository is breathing. The disappearance of oxygen was a most importance finding. It can not be explained by the presence of micro-organisms since the dry conditions gave too little moisture for their metabolism.

29
3.2.2 Hydraulic performance of the rock
Large-scale hydraulic performance Characterization of the general rock structure in terms of location, orientation and properties of fracture zones and rock matrix has led to definition of 18 deterministic discontinuities (“conductive features”) near the Prototype Repository and of the way they perform hydraulically. Groundwater flow is concentrated to discrete, interacting fracture zones of different size and extension in the far-field and to systems of discrete fractures in the near-field rock. The distribution of salinity of the groundwater is closely related to the existence of the major hydraulically active features identified.
Predictions of water pressure in the far- and near-field The rock between major water-bearing features on all scales has a low hydraulic conductivity and the concept “porous medium” is believed to be applicable. The large-scale hydraulic performance of the rock mass is assumed to be determined by the conductive fracture zones in combination with a stochastic network of finer discontinuities. As an average, the hydraulic conductivity in the interval 300-500 m depth is concluded to range between E-11 and E-9 m/s, while the average transmissivity of major fracture zones in the numerical model varies between E-5 and E-8 m2/s /D34/. The groundwater pressure has been calculated by use of the code DarcyTools (Figure 3-1). Modelling of groundwater pressure in the near-field using the same code as for the large-scale hydrological modelling has given a water pressure at 2 m distance from the drift wall between 100 kPa and 1.5 MPa.

30
Figure 3-1. Predicted pressure heads in meters for one realisation, at 447 m depth in AEspoe HRL. Top: before backfilling. Below: after backfilling, steady state. In the lower picture is the backfilled part of the drift only indicated by a line.

31
Comparison of predicted and recorded pressure data
Large-scale conditions The actual pressures measured in the rock surrounding the Prototype Repository drift are within the same large span as the predictions, from which one concludes that the applied way of predicting groundwater pressures on a large scale, taking fracture zones as discrete hydraulically active discontinuities, gives values that are in fair but not very good agreement with recordings.
Near-field conditions The access to water from the rock for maturation of the buffer and backfill is of great practical importance. The inflow of water into the large-diameter deposition holes naturally corresponds to the hydraulic conductivities and pressure conditions of the near-field rock and using currently available theoretical flow and rock structural models the data in Table 3-1 have been obtained. The actual inflow data given in the table shows a totally different picture, hence demonstrating that today’s tools for predicting access to water for hydration of the buffer are of very limited value.
Table 3-1. Comparison of measured and calculated inflow to deposition holes. Hole No Designation Predicted median
inflow, l/min Recorded inflow, l/min
1 DA3587G01 0.943 0.0800
2 DA3581G01 0.553 0.0020
3 DA3575G01 0.607 0.0030
4 DA3569G01 0.695 0.0007
5 DA3551G01 1.678 0.0027
6 DA3545G01 0.934 0.0030
The conductivity of the rock closest to the drift and deposition holes determines how the water inflow into these spaces is distributed. The excavation-damaged zone (EDZ) developed when using a Tunnel Boring Machine (TBM) or Shaft Boring Machine (SBM) performs as a porous medium and various investigations made by BGR, Posiva, and SKB indicate that the average hydraulic conductivity within some 10 mm from the walls is about E-10 to E-9 m/s, and that it is E-11 to E-10 m/s for rock free of macroscopic fractures within a couple of hundred mm from it. Including the effect of discrete fractures that intersect or are very close to deposition holes the average macroscopic hydraulic conductivity is concluded to be E-10 to E-9 m/s (cf. Section 3.5).

32
3.3 Laboratory tests on buffer and backfill properties The material data that formed the basis of the modelling work is compiled in /D28 and D29/, represented by the summary in Table 3-2.
Table 3-2. Material data for modelling purposes. Parameters Values
Exploratory holes; location SKB`s Sicada data base
Deposition holes;
• Chemical composition of water • Hydraulic heads
• SKB`s Sicada data base • SKB`s Sicada data base
Fractures mapped in drift /Patel et. al., 1997/
Buffer (bentonite MX-80)
• Mineralogy
• Initial water content • Water content at saturation • Thermal properties • Block properties (density, etc.) • Matured buffer properties • Suction • Diffusivity, sorption etc.
• Smectite (montm.) 65-75 %, quartz 10-14 %, feldsp. 5-19 %, calcite 3-5 %, chlorite 2-4 %
• 17 % • 27 % • /Boergesson et. al., 1994/ • / Boergesson et. al., 1995b/ • /Boergesson et. al., 1995b/ • / Boergesson et. al., 1994/ • /Yu et. al., 1997/
Backfill (MX-80/ballast)
• Composition ratio • Granulometry • Initial water content • Water content at saturation • Dry density • Density at saturation • Void ratio • Thermal properties • Hydraulic conductivity • Hydraulic conductivity, general relat. • Soil mechanical data • Suction
• Diffusivity, etc.
• 30/70 • Fuller curve, max grain size is 20 mm • 12 % • 21 % • 1.75 Mg/m3 • Is derived from given data • 0.57 (weight of water divided by weight of dry
benonite) • /Boergesson et. al., 1994/ • E-10 m/s • //Boergesson et. al., 1999a and b/ • //Boergesson et. al., 1999a and b/ • Very similar to the backfill properties in Backfill
and Plug Test /Johannesson et. al., 1999 and Boergesson et. al., 1999b/
• Not determined Rock
• Sorption etc • Rock mechanical properties
• /Ohlsson et. al., 1997/ • /Dahlstroem, 1998/
Canister
• Weight • Material properties • Waste • Nuclide inventory and ratio
• 25 Mg with heaters • /Werme, 1998/ • /Haokansson., 1999/ • /Haokansson., 1999/

33
3.4 Laboratory tests on mechanical properties of rock and THM processes in rock
The properties of the rock mass, fractures and samples of rock material have been investigated and reported for use in hydrological and rock mechanical modelling /Pettitt, 1999, Nordlund et. al., 1999, Collin et. al., 2001, Staub et. al., 2003, Sjoeberg, 2003, SKB, 2004 and D6/.
The stress conditions are basic to the performance of the near-field rock and have been determined at various places in the rock mass yielding the average magnitudes and orientations given in Table 3-3. The data together with the material properties determined prior to the project indicate that stable conditions prevail.
Table 3-3. Averaged rock stress magnitudes in MPa and orientations. Parameter σ1 σ2 σ3
Principal stress 29 21 10
Trend/plunge 133/19 49/42 234/33
Intact rock The rock types in the modelled area are crystalline and show the typical stiff, strong and brittle behaviour of crystalline rocks often found in Sweden. The main rock types occurring in the local model area have a mean Young’s modulus of 80 – 85 GPa and a mean uniaxial compressive strength (UCS) of 210 MPa for the fine-grained diorite and somewhat lower, 165 MPa, for other rock types. The crack initiation strength is about 47% of the UCS. The description is provided as truncated normal distribution functions for all parameters, where the standard deviation value describes the variation within the respective rock type and the truncation values gives the expected most extreme values. The standard deviation for Young’s modulus is 10 GPa, while the standard deviation for UCS is 50 MPa for the fine-grained diorite and 30 MPa for other rock type /SKB, 2004/.
Single fractures The single fracture mechanical properties are described by the Mohr-Coulomb fracture model, using the peak friction angle and cohesion parameters. The mean friction angle is estimated to be 32 degrees with a standard deviation of 4 degrees. The cohesion is described as a function of the friction angle, giving a mean value of 0.5 MPa. The fracture samples tested show high normal stiffness, in the range from 49 to 179 MPa/mm with a mean value of 100 MPa/mm. The shear stiffness is about three times lower than the normal stiffness /SKB, 2004/.
Rock mass equivalent properties The resulting model parameters for the rock mass have been given as truncated normal distributions as provided for the intact rock. Both the deformation modulus and the

34
Poisson’s ratio depends on the scale and stress conditions. The mean deformation modulus is 61 – 62 GPa in the competent parts of the rock mass and clearly lower, 38 GPa, in minor deformation zones. The mean friction angle is 39 – 42 degrees, and the cohesion on the order of 10-20 MPa /SKB, 2004/.
3.5 Laboratory investigation of cracks in EDZ Laboratory experiments have been conducted by SKB, Posiva and BGR and reported in AEspoe´s report series /D32/ and contributions to the CLUSTER EDZ conference and workshop in Luxembourg in 2003 /European Commission, 2004/.
The scale-dependence of the frequency and hydraulic conductivity of boring-induced defects is very significant but while it is fairly well known and quantified for blasted rock it is still poorly known for TBM drifts and SBM deposition holes Thus, the question to what extent the EDZ of drifts and holes is of importance for the maturation of the buffer and backfill has not yet been fully answered. Cored samples show an increase in hydraulic conductivity by about 1000 times to 1 cm depth from the periphery (K=E-10 m/s). This narrow zone is claimed to have a small effect on the hydration of buffer clay but stress changes within one or a few decimetres from the periphery may cause a wider permeable zone with the conductivity raised by 10 to 100 times, i.e. corresponding to K = 5E-10 to E-9 m/s in the AEspoe case (Figure 3-2). The aforementioned inflow tests by use of diapers indicate that the average bulk hydraulic conductivity of the near-field rock around the deposition holes is K=E-12 to K = 4E-10
m/s.
Figure 3-2. Three major conceptual cases for deriving representative K-values of the near-field rock.

35
3.6 T, TM, HM and THM rock modelling Rock mechanical modelling with due respect to the impact of temperature has not been comprehensive. Some general findings are reported in /Staub et. al., 2003 and D6/.
Geophysical measurements have been made for determination of the local stress fields around the six deposition holes. This has been made by use of acoustic emission technique /Pettitt et.al., 2000/. Figure 3-3 illustrates the outcome of a comparison of the stress conditions and acoustic signals, indicating comprehensive overstressing up to a few decimetres distance from the periphery. It is reasonable to believe that the strength dropped and the hydraulic conductivity increased in these regions.
Figure 3-3. Comparison of acoustic signals and calculated tangential stresses in Holes 5 (upper) and 6 (lower) /Pettitt et.al., 2000/.

36
3.7 THM modelling of buffer, backfill and their interaction with near-field rock
3.7.1 Major processes In principle, the evolution of the buffer involves the following processes concept
(Figure 3-4).
• Redistribution of initially contained porewater in the buffer generated by the thermal gradient.
• Homogenisation and subsequent consolidation of the initially heterogeneous buffer components.
• Uptake of water from the rock and backfill leading to hydration of the buffer.
• Expansion of the uppermost part of the buffer causing displacement of the overlying backfill.
• Consolidation and shearing of the buffer caused by the canister load.
• Transport of chemical elements into and out of the buffer due to temperature gradients.
• Dissolution and alteration minerals and precipitation of chemical compounds.
3.7.2 Conceptual modelling A number of physico/chemical processes are involved in the maturation of the buffer and backfill of a repository of KBS-3V type. The EBS components are shown in Figure 3-4
The processes include:
• Redistribution of initial porewater generated by the thermal gradient across the buffer.
• Homogenisation and subsequent consolidation of the pellets fill under the swelling pressure exerted by the hydrating and expanding dense blocks.
• Uptake of water from the rock and backfill leading to hydration of the buffer.
• Expansion of the uppermost part of the buffer, which displaces the overlying backfill.
• Consolidation and shearing of the buffer caused by the canister load.
All these processes affect the evolution of the buffer and should be included in the theoretical modelling. However, a complete theoretical model would be very complex and one has to make certain simplifications, a major one being the assumption of uniform access to water for hydration of the buffer over the entire buffer/rock contact.

37
This assumption is adequate only if the EDZ has a significantly higher hydraulic conductivity than the rest of the rock and if the water flow to it is not a limiting factor for the wetting process.
Figure 3-4. Interacting EBS components of a KBS-3V deposition hole.
3.7.3 Theoretical modelling of THM processes The models used in predicting and evaluating the various processes in the Prototype Repository buffer and backfill have been described in detail in /D33/ and predictive modelling has been reported in /D34/. The following is a brief summary of the major features of the models used for predicting the THM evolution:
1. Thermal evolution in the buffer, backfill and near-field rock.
2. Hydration of the buffer and backfill.
3. Build-up of swelling pressure in the buffer and backfill.
COMPASS ( Cardiff University (UK)) Partly saturated soil is considered as a three-phase porous medium consisting of solids, liquid and gas. The liquid phase is the buffer pore water containing multiple chemical solutes and the gas phase is pore air. A set of coupled governing differential equations has been developed to describe the flow and deformation behaviour of the soil.
• Heat conduction and flow are expressed using classical physics but is generalized by including the velocities of liquid, vapour and air respectively. For

38
unsaturated soil the heat capacities of solid particles, liquid, vapour and dry air are considered in addition to the degree of saturation with respect to liquid water.
• The velocities of pore liquid and pore air are calculated using a generalised Darcy's law with special respect to the chemical solute concentration gradient and the conductivity of the air phase and the pore air pressure. Also, an osmotic flow term in the liquid velocity is included for representation of liquid flow behaviour found in some highly compacted clays.
• Air in partly saturated soil is considered to exist in two forms: bulk air and dissolved air. In this approach the proportion of dry air in the pore liquid is defined using Henry's law.
• Where a chemical solute is considered non-reactive and sorption onto the soil surface is ignored the governing equation for chemical transfer can be expressed in terms of diffusion and dispersion, as derived in primary variable form. The approach has been extended to a multi-chemical species form with a sink term introduced to account for mass accumulation from reactions due to the sorption process. This is then coupled to a geochemical model.
• A number of constitutive relationships have been implemented to describe the net stress, temperature and suction contributions and both elastic and elasto-plastic formulations have been employed. To describe the contribution of the chemical solute on the stress-strain behaviour of the soil, as a first approximation, an elastic state surface concept was proposed that described the contribution of the chemical solute via an elastic relationship based on osmotic potential theory.
• A numerical solution of the governing differential equations is achieved by a combination of the finite element method for the spatial discretisation and a finite difference time stepping scheme for temporal discretisation. The Galerkin weighted residual method is employed to formulate the finite element discretisation. For the flow and stress/strain equations shape functions are used to define approximation polynomials. The software package, COMPASS, has been developed to implement the numerical approach detailed above. The package has a modular structure to aid the implementation of suitable code and documentation management systems. It has two main components, i.e. a pre and post processor and an analysis ‘engine’. Evaluation of integrals is achieved via Gaussian integration. For the elasto-plastic based stress equilibrium equations a stress return algorithm is used.
CODE_BRIGHT ( CIMNE, Enresa (ES)) A porous medium composed by solid grains, water and gas is considered. Thermal, hydraulic and mechanical aspects are taken into account, including coupling between them in all possible directions. The problem is formulated in a multiphase and multi-species approach.
• The resulting system of partial differential equations is solved numerically dividing the operation into spatial and temporal discretisations. The finite

39
element method is used for the spatial discretisation while finite differences are used for the temporal one.
• The mechanical stress-strain relationship of the buffer clay is defined by means of an elasto-plastic model specially designed for unsaturated soil and known as the “Barcelona Basic Model”. The early difference in physical state between the zone with pellets and the blocks of bentonite is considered by using different parameters but maintaining the same model. Rock is considered elastic in all the analyses.
• An attempt to simulate the THMC problem in 1D has been carried out including reactive transport in the problem. The types of processes that can be considered include complex-formation, oxidation/reduction reactions, acid/base reactions, precipitation/dissolution of minerals, cation exchange, sorption and radioactive decay. The total analytical concentrations are adopted as basic transport variables and chemical equilibrium is achieved by minimising Gibbs Free Energy.
RF/RM (ROCKFLOW/ROCKMECH, BGR (DE)) Completely coupled thermo/hydraulic/mechanical models considering the non-linear effects caused by i.a. permeation under unsaturated conditions and elasto-plastic behaviour of the buffer clay are basic to the code, which was developed by the German Hanover and Tuebingen universities. For the buffer one also needs to consider the influence of desiccation fractures, swelling and micro-structural changes.
• The parameters to be determined are the gas pressure, water pressure, displacements of solids, as well as temperature. In addition to physical changes (stress/strain, drying and wetting) and chemical alteration some of the properties used for modelling, like alteration of the heat conductivity of buffer under saturation, and microstructural changes, have to be taken into consideration.
• One can identify impacts in the form of hydro-mechanical, thermo-mechanical and hydrothermal effects. For non-isothermal processes in partially saturated porous media it is more convenient to separate dry air and vapour and formulate a mass balance equation for both liquid species, i.e. liquid and liquid vapour.
• Concepts for formulations are compositional or phase-related. The first approach consists of balancing the species rather than the phases. The compositional approach is adopted to establish the mass balance equations.
THAMES (JNC (JP)) The mathematical formulation for the model utilizes Biot’s theory with the Duhamel-Neuman’s form of Hooke’s law, and an energy balance equation. The governing equations are derived with fully coupled thermal, hydraulic and mechanical processes. The governing equations are derived under the assumptions of 1) The medium is poro-elastic, 2) Darcy’s law is valid for the flow of water through a saturated medium, 3) Heat flow occurs in solid and liquid phases (impact of vapour is not considered), 4)

40
Heat transfer among three phases (solid, liquid and gas) is disregarded, 5) Fourier’s law holds for heat flux, 6) Water density varies depending on temperature and water pressure.
• The behaviour of the buffer material is influenced by the interdependence of thermal, hydraulic and mechanical phenomena. To treat the water/vapour movement and heat- induced water movement, the continuity equation used in the extended THAMES code contains terms representing the isothermal water diffusivity, the volumetric water content, the water potential head, and the intrinsic permeability K. This equation means that the water flow in the unsaturated zone is expressed by the diffusion term and in the saturated zone by Darcy’s law.
• The stress/strain relationship at equilibrium takes the swelling behaviour into account and considers the elastic matrix, the density of the medium and the body force. The effective stress in the unsaturated zone and in the saturated zone are functions of the thermal expansion. The swelling pressure is assumed to be a function of the water potential head.
ABAQUS ( Clay Technology (SE)) The finite element code ABAQUS has been extended to include special material models for rock and soil and ability to model moisture transport associated with stress and strain on various scales. The hydro-mechanical model consists of a porous medium and wetting fluid and is based on equilibrium, constitutive equations, energy balance and mass conservation using the effective stress theory.
• Thermal flux by conduction is modelled is thermal conduction using the conventional theory with thermal conductivity and specific heat as variables.
• The water flux in the liquid phase is modelled by Darcy’s law with the water pressure difference as driving force in the same way as for water saturated clay. The magnitude of the hydraulic conductivity of partly saturated clay is a function of the void ratio, the degree of saturation and the temperature. This conductivity is assumed to be a function of the hydraulic conductivity of the saturated clay and the degree of saturation. Water vapour flow is modelled as a diffusion processes driven by the temperature gradient and the water vapour pressure gradient (under isothermal conditions).
• The pore pressure of the unsaturated buffer material is always negative and expressed as a function of the degree of saturation independent of the void ratio. ABAQUS also allows for hysteresis effects, which means that drying and wetting are represented by two separate curves.
• The mechanical behaviour has been modelled with a non-linear Porous Elastic Model and Drucker-Prager Plasticity model. The effective stress theory, as defined by Bishop, is applied and adapted to unsaturated conditions. The shortcoming of the effective stress theory is compensated by introduction of a “moisture swelling correction” that depends on the degree of water saturation.

41
3.7.4 Recording of THM
Temperature at mid-height canister in the wettest hole (Hole 1) In early 2004 the temperature was still rising after more than 2 years testing time. It reached about 72oC in the clay adjacent to the canister surface and around 60oC at the rock after 700 days as shown by Figure 3-5. The average temperature gradient was about 0.034 centigrades per mm radial distance. Almost the same temperature figures were also given by the Vaisala RH meters. The power has been about 1800 W.
Prototype\Hole 1 \Ring5 (010917-031201)Temperature - Pentronic
10
20
30
40
50
60
70
80
90
100
0 100 200 300 400 500 600 700 800 900
Time(days) day0=010917
Tem
pera
ture
(°C
)
TBU10011(2.980\0°\0.635) TBU10012(2.980\0°\0.735) TBU10013(2.980\90°\0.585)TBU10014(2.980\90°\0.685) TBU10015(2.980\90°\0.785) TBU10016(2.980\175°\0.585)
Figure 3-5. Temperature at mid-height of the canister in the wettest hole (Hole 1).The legend denotes which instrument and where it is located; example TBU10011 (2.980\0o
0.635) where TBU is gauge type (here temperature sensor), 10011 is the gauge number, 2.980 is the distance from the hole bottom, 0o is the coordinate angle from the drift axis (see top figure at right), and 0.635 is the distance from the hole centre.
Hydration at mid-height canister in the wettest hole (Hole 1) The hydration process has been interpreted from the output of the Vaisala RH meters as exemplified by Figure 3-6). The results indicate that the clay between the canister and the rock in Hole 1 had reached RH values of 92-94 % after about one year. The present understanding is that for high RH the values are approximately equal to the degree of water saturation, which indicates that a high degree of water saturation had been reached in the buffer between the canister and the rock after one year.

42
Prototype\Hole 1\Ring.5 (010917-031201)Relative humidity - Vaisala
10
20
30
40
50
60
70
80
90
100
110
0 100 200 300 400 500 600 700 800 900
Time(days) day0=010917
Rel
ativ
e hu
mid
ity(%
)\Tem
pera
ture
(°C
)
WBU10013(2.870\350°\0.585) WBU10014(2.870\350°\0.685) WBU10015(2.870\350°\0.785)
WBU10019(2.870\180°\0.535\In the slot) WBU10020(2.870\180°\0.685) Figure 3-6. RH distribution in the buffer in the wettest hole (Hole 1). The legend is explained in Figure 3-5, WBU denotes relative humidity gauges. The data can be approximately taken as the degree of water saturation. The upper curve set shows the RH readings and the lower set gives the temperature.
Total pressure at mid-height canister in the wettest hole (Hole 1) The total pressure was measured by two types of gauges of which the Geokon instruments appeared to be the most accurate. The homogeneous distribution of water according to the RH measurements would correspond to a uniform distribution also of the pressure but the obvious variations in Figure 3-7 indicate that full maturation of the buffer had not taken place within 2-2.5 years. One reason may be that the degree of water saturation varies more than indicated by the RH measurements and another that complete, homogeneous embedment of the pressure cells requires rather long time because of the involved creep, expansion, consolidation and moisture redistribution. It is also believed that the cables connecting the Vaisala gauges to the recording units served as water conductors and caused local wetting and too early saturation at the spots where the gauges are. This may explain the slight drop of RH after reaching a maximum value for one of the gauges, cf. Figure 3-6.
It is estimated that nearly complete homogeneity will require several years, a main cause being that complete hydration is slower than expected.
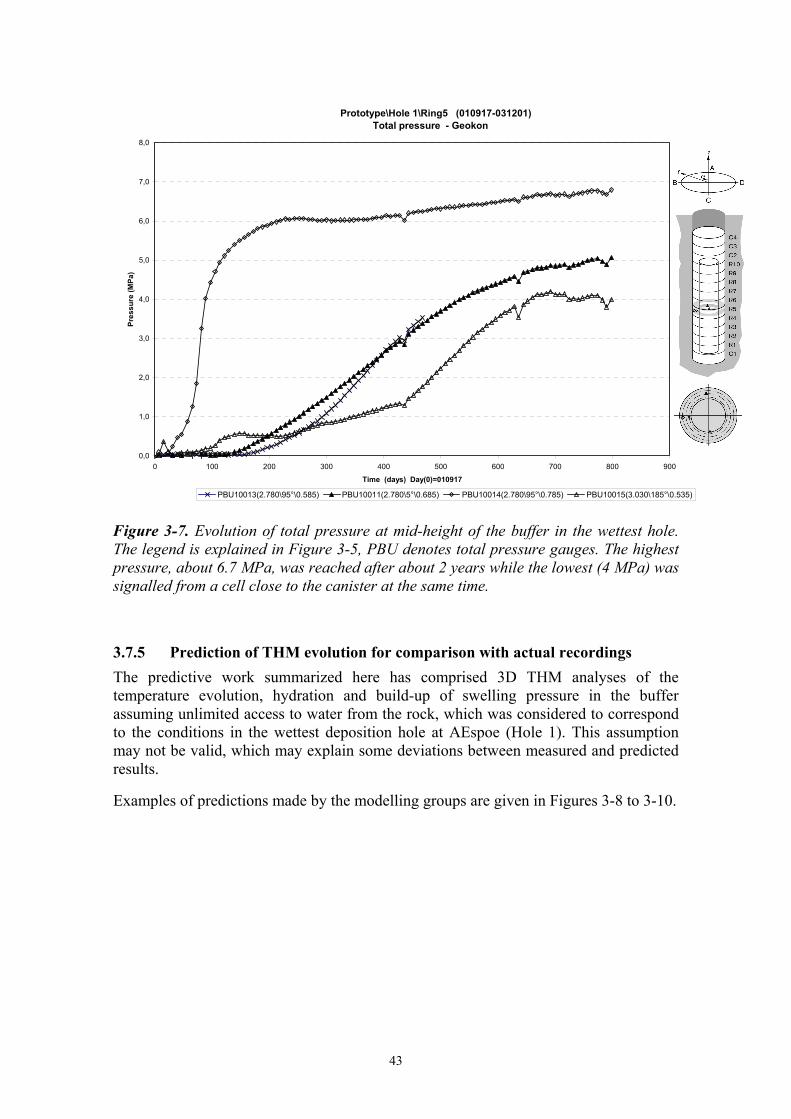
43
Prototype\Hole 1\Ring5 (010917-031201)Total pressure - Geokon
0,0
1,0
2,0
3,0
4,0
5,0
6,0
7,0
8,0
0 100 200 300 400 500 600 700 800 900
Time (days) Day(0)=010917
Pres
sure
(MPa
)
PBU10013(2.780\95°\0.585) PBU10011(2.780\5°\0.685) PBU10014(2.780\95°\0.785) PBU10015(3.030\185°\0.535) Figure 3-7. Evolution of total pressure at mid-height of the buffer in the wettest hole. The legend is explained in Figure 3-5, PBU denotes total pressure gauges. The highest pressure, about 6.7 MPa, was reached after about 2 years while the lowest (4 MPa) was signalled from a cell close to the canister at the same time.
3.7.5 Prediction of THM evolution for comparison with actual recordings The predictive work summarized here has comprised 3D THM analyses of the temperature evolution, hydration and build-up of swelling pressure in the buffer assuming unlimited access to water from the rock, which was considered to correspond to the conditions in the wettest deposition hole at AEspoe (Hole 1). This assumption may not be valid, which may explain some deviations between measured and predicted results.
Examples of predictions made by the modelling groups are given in Figures 3-8 to 3-10.

44
0 100 200 300 400 500 600 700 800 900 1000
t (day)
10
20
30
40
50
60
70
80
90
Tem
pera
ture
(C)
r=0.785m
r=0.685m
r=0.585m
Bentonite points
Figure 3-8. Temperature as a function of time as predicted by 3D calculations (CODE_BRIGHT) at mid-height canister for three points in the buffer: 60 mm (r=0.585 m) from the heater (upper curve), middle of buffer (middle curve) and 90 mm (r=0.785 m) from the rock (lower curve). The radius is 0.525 m and 0.875 m of the canister and of the deposition hole respectively.
0 100 200 300 400 500 600 700 800 900 1000
t (day)
0.80
0.85
0.90
0.95
1.00
Satu
ratio
n D
egre
e
r=0.785m
r=0.685m
r=0.585m
Bentonite points
Figure 3-9. Predicted degree of saturation of the buffer as a function of time (CODE_ BRIGHT) at mid-height canister for the same three points in the buffer as in Figure 3-8.

45
0
1
2
3
4
5
6
7
8
0 100 200 300 400 500 600 700 800 900 1000El apsed t i me ( day)
Pres
sure
(MP
a)
PBU30010PBU30011PBU30012
Figure 3-10. Predicted total stress at different distances from the canister as a function of time (CODE_BRIGHT). The upper curve represents the rock/buffer contact, the second highest curve half distance between rock and canister, and the lowest the buffer/canister contact.
3.7.6 Comparison between predictions and recordings The comparison of results from THMCB modelling of processes in buffer, backfill and rock with measured data in the Prototype Repository project have been reported in /D35/. The following summarises the work.
Simple validation attempts Early in the project the modellers were encouraged to apply their models to very simple experiments for testing and validation of the various codes. One example of such a comparison is given in Figure 3-11, showing good agreement between the trends but less good fitting of the absolute data for the simple case of wetting from one end of a 50 mm long sample of MX-80 clay of the same type, initial water content and density as the buffer clay in the deposition holes under isothermal conditions. Unfortunately, all models were not tested in this fashion or under thermal gradients.
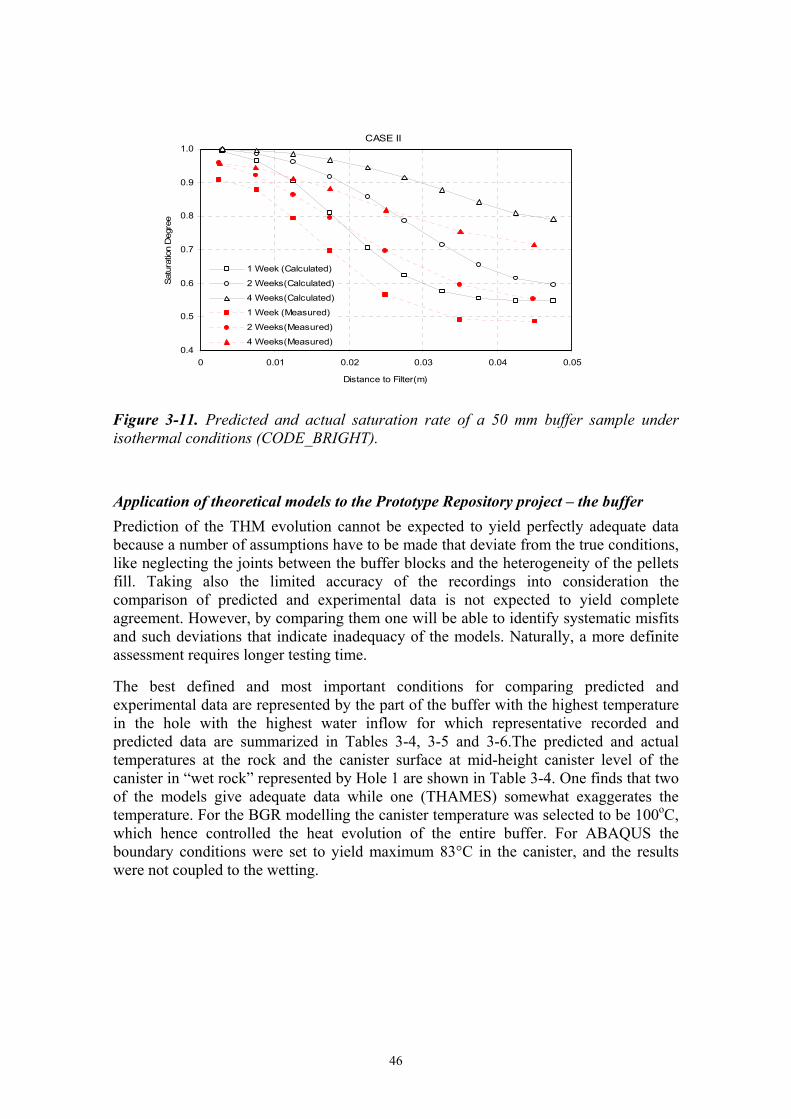
46
Figure 3-11. Predicted and actual saturation rate of a 50 mm buffer sample under isothermal conditions (CODE_BRIGHT).
Application of theoretical models to the Prototype Repository project – the buffer Prediction of the THM evolution cannot be expected to yield perfectly adequate data because a number of assumptions have to be made that deviate from the true conditions, like neglecting the joints between the buffer blocks and the heterogeneity of the pellets fill. Taking also the limited accuracy of the recordings into consideration the comparison of predicted and experimental data is not expected to yield complete agreement. However, by comparing them one will be able to identify systematic misfits and such deviations that indicate inadequacy of the models. Naturally, a more definite assessment requires longer testing time.
The best defined and most important conditions for comparing predicted and experimental data are represented by the part of the buffer with the highest temperature in the hole with the highest water inflow for which representative recorded and predicted data are summarized in Tables 3-4, 3-5 and 3-6.The predicted and actual temperatures at the rock and the canister surface at mid-height canister level of the canister in “wet rock” represented by Hole 1 are shown in Table 3-4. One finds that two of the models give adequate data while one (THAMES) somewhat exaggerates the temperature. For the BGR modelling the canister temperature was selected to be 100oC, which hence controlled the heat evolution of the entire buffer. For ABAQUS the boundary conditions were set to yield maximum 83°C in the canister, and the results were not coupled to the wetting.
CASE II
0.4
0.5
0.6
0.7
0.8
0.9
1.0
0 0.01 0.02 0.03 0.04 0.05
Distance to Filter(m)
Satu
ratio
n D
egre
e
1 Week (Calculated)
2 Weeks(Calculated)
4 Weeks(Calculated)
1 Week (Measured)
2 Weeks(Measured)
4 Weeks(Measured)
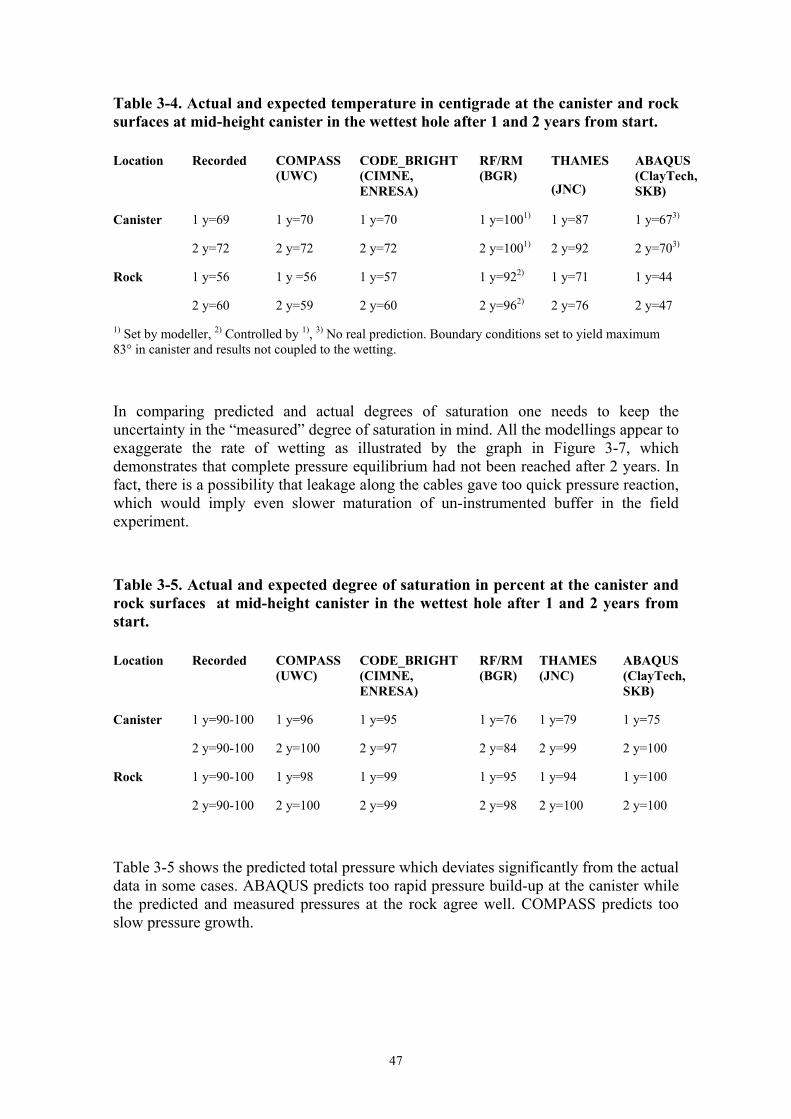
47
Table 3-4. Actual and expected temperature in centigrade at the canister and rock surfaces at mid-height canister in the wettest hole after 1 and 2 years from start. Location Recorded COMPASS
(UWC) CODE_BRIGHT (CIMNE, ENRESA)
RF/RM (BGR)
THAMES
(JNC)
ABAQUS (ClayTech, SKB)
Canister 1 y=69
2 y=72
1 y=70
2 y=72
1 y=70
2 y=72
1 y=1001)
2 y=1001)
1 y=87
2 y=92
1 y=673)
2 y=703)
Rock 1 y=56
2 y=60
1 y =56
2 y=59
1 y=57
2 y=60
1 y=922)
2 y=962)
1 y=71
2 y=76
1 y=44
2 y=47
1) Set by modeller, 2) Controlled by 1), 3) No real prediction. Boundary conditions set to yield maximum 83° in canister and results not coupled to the wetting.
In comparing predicted and actual degrees of saturation one needs to keep the uncertainty in the “measured” degree of saturation in mind. All the modellings appear to exaggerate the rate of wetting as illustrated by the graph in Figure 3-7, which demonstrates that complete pressure equilibrium had not been reached after 2 years. In fact, there is a possibility that leakage along the cables gave too quick pressure reaction, which would imply even slower maturation of un-instrumented buffer in the field experiment.
Table 3-5. Actual and expected degree of saturation in percent at the canister and rock surfaces at mid-height canister in the wettest hole after 1 and 2 years from start. Location Recorded COMPASS
(UWC) CODE_BRIGHT (CIMNE, ENRESA)
RF/RM (BGR)
THAMES (JNC)
ABAQUS (ClayTech, SKB)
Canister 1 y=90-100
2 y=90-100
1 y=96
2 y=100
1 y=95
2 y=97
1 y=76
2 y=84
1 y=79
2 y=99
1 y=75
2 y=100
Rock 1 y=90-100
2 y=90-100
1 y=98
2 y=100
1 y=99
2 y=99
1 y=95
2 y=98
1 y=94
2 y=100
1 y=100
2 y=100
Table 3-5 shows the predicted total pressure which deviates significantly from the actual data in some cases. ABAQUS predicts too rapid pressure build-up at the canister while the predicted and measured pressures at the rock agree well. COMPASS predicts too slow pressure growth.

48
Table 3-5 Actual and expected pressure in MPa at the canister and rock surfaces at mid-height canister in the wettest hole after 1 and 2 years from start. Location Recorded COMPASS
(UWC) CODE_BRIGHT (CIMNE, ENRESA)
RF/RM (BGR)
THAMES (JNC)
ABAQUS (ClayTech, SKB)
Canister 1 y=1.0
2 y=4.0
1 y=0.8
2 y=3.2
1 y=3.0
2 y=5.1
1 y=3.5
2 y=4.8
1 y=4.7
2 y=6.2
1 y=5.3
2 y=6.8
Rock 1 y=6.0
2 y=6.7
1 y=2.8
2 y=3.9
1 y=5.0
2 y=7.2
1 y=3.5
2 y=4.8
1 y=6.4
2 y=7.2
1 y=5.3
2 y=6.8
The major conclusions from the comparison of predicted and actual data are the following:
• The development of the temperature regime is captured well and the results illustrate that the temperature regime is well understood and represented in the system. It is clear, however, that the three-dimensional configuration of the 6 deposition holes in the project is essential to correctly capture the variation in the thermal response in each of the various deposition holes.
• The simulated hydration rates in the buffer for the “wet” hole (Hole 1) show reasonable agreement with the experimental results although some over-prediction of drying in the initial stages (first 100 days) is found. For the “dry” hole (Hole 3) it was found that the simulated hydration rates throughout the buffer also showed reasonable agreement with the experimental results measured by certain humidity sensors. The hydration is more difficult to predict than the temperature since the boundary conditions are poorly defined. Variations related to condensation and evaporation of pore water can be seen near the heater by close examination of recordings while such phenomena can not be simulated because of the difficulty to combine water diffusivity and thermal diffusivity. Keeping in mind that the recorded hydration rate can have been too high because of water leakage along sensor cables, it is possible that the deviation between predictions and actual data is even larger than shown by most of the modelling results reported in Table 3-5.
• One of the simulations of the mechanical behaviour of the buffer in Hole 1 captured the key features of the observed development of swelling pressures. Peak pressures close to the rock are under-predicted possibly due to an over-estimation of the compressibility of the pellets region. In Hole 3 there is very little swelling pressure developed in both the simulated and measured results due to the slow rate of hydration experienced in this hole. It is believed that a problem is caused by neglecting the gaps between the buffer blocks. For some models the initial stress in the simulation is therefore too large compared with the actual data.

49
3.7.7 Extrapolation of the THM evolution over longer periods of time For the later part of the Prototype Repository project one expects nearly complete fluid saturation of both the backfill and the buffer in the “wet” rock (Section I). However, the rate of maturation will be very slow in Holes 2 to 6 because of the slow groundwater flow to these holes.
Simulation over longer periods of time is more difficult since the period of desiccation of the buffer close to the canisters in “dry” rock may change their hydration potential. Disregarding from such changes and using the same models as for the short-term evolution one can predict the saturation process under different hydraulic conditions as exemplified by a calculation made by use of the 3D RF/RM model, based on two-phase flow (Figure 3-12). It illustrates the impact of the piezometric conditions and the presence of water-bearing fractures in deposition holes according to this model. The example shows that assuming one water-bearing fracture charged with water under 1 MPa water pressure and an EDZ that is more permeable than the rock matrix having an assumed hydraulic conductivity of E-11 m/s, the degree of water saturation will still be below 80 % in some parts of the buffer even after 30 years. For the same rock with no discrete water-bearing fractures the time to reach 100 % degree of saturation of the buffer may be more than 100 years.
Figure 3-12. Water saturation versus time for two cases, both with permeable EDZ, according to BGR’s use of the RF/RM code. Upper curve shows hydration under 1MPa water pressure and a major intersecting fracture, lower curve is hydration at low piezometric pressure and no such fracture /D34/.
3.7.8 Application of theoretical models to the Prototype Repository project – the backfill
The maturation of the backfill has not been predicted by modelling or evaluated by using the models described and used for the buffer maturation. Further study of the involved processes and also the possible physical changes that the backfill may undergo by piping and erosion caused by the harsh hydraulic conditions in Section I is required.
0.5
0.6
0.7
0.8
0.9
1
satu
ratio
n
0 10 20 30time [year]
water pressure in the EDZcase 1 pEDZ = 1 MPacase 2 water bearing features
Y
Z
X
SATU1[-]10.950.90.850.80.750.70.650.60.550.5

50
3.8 C modelling of buffer, backfill and groundwater
3.8.1 Prediction of the chemical constitution of the groundwater in the near-field rock and the porewater of backfill and buffer
The predictive modelling calculations (PHREEQC-2.5 software) within the engineered barrier system are based on the assumption of a constant near-field groundwater composition /D34/. It is focused on the major element compositions of the porewater and on the certain solid phases (montmorillonite, quartz, calcite, gypsum, pyrite, and goethite) of the EBS. The model computations follow equilibrium thermodynamic assumptions and take into account cation exchange properties of the EBS in which calcium is a major ion species controlling pH. Predictions by SKB, Posiva and Enresa modellers show that no significant changes in the chemical constitution of the mineral phase will occur in the course of the experiments. The first mentioned conclude that the existence of a temperature gradient alone is not sufficient for precipitation of quartz or amorphous silica in the course of the project but that cooling can have such an effect /Pusch et. al.,1998 /.
3.8.2 Comparison of predictions of water geochemical data with other observations
One concludes /D35/ that the possibility of amorphous silica precipitation is very much dependent on the time scale of cooling relative to that of the quartz precipitation, i.e. rapid cooling leaves the system super-saturated with quartz and excess concentration of silica in solution eventually reaches the solubility of amorphous silica at the lower temperature. This may be the case in the laboratory experiment where cooling in conjunction with termination of the experiments will be much more rapid than in the repository environment.
Parallel tests (Long Term tests of Buffer Materials /Karnland, 2000/) have given indications also of two more conditions, firstly that the sulphate levels in the buffer porewater are gypsum solubility limited and that precipitation of gypsum actually takes place, and secondly that oxygen is used up quickly in the near-field rock and the buffer.
51
4 Assessment of results and conclusions
4.1 General
The various WP activities have followed the original plans with some delay but the outcome is very valuable in several respects:
The instrumentation of rock, buffer and backfill has been successful and the large majority of the gauges and recording units have operated without failure and with expected accuracy. One problem appears to be that water has leaked along cables leading into the interior of the buffer and backfill causing more rapid moistening than where there are no instruments. This seems to have caused certain false indication of the hydration rate of the buffer and backfill, which can have misled the modellers somewhat.
The preparation and installation of deposition holes, buffer and backfill has followed the plans and caused no major problem except that the inflow of water in the inner part of the test drift (Section I) has required continuous drainage in a way that can not be made in a true repository. Hence, future research and development are needed for sealing of deposition drifts or selecting a backfill method that can be applied also when the inflow is this high.
Prediction of the performance of the rock, buffer and backfill by applying the proposed conceptual and theoretical models has illustrated their applicability and shortcomings. As to the hydraulic performance of the near-field rock and its relation to the rock structure it has not been possible to work out and apply accurate models. However, it is an obvious fact that the models used for predicting the maturation of buffer and backfill give data that are sufficiently good for practical use, if the considered period is short and the rock gives off rather much water, while there are doubts if they can provide reliable predictions if the rock gives off only very little water to the deposition holes. Since delay in maturation may have a substantial impact on the long-term performance and chemical stability of the buffer, research and development are required for improving the knowledge and modelling ability. For this purpose continuation of the project to cover a period of 20 years would be very valuable.
4.2 Scientific achievements
The major scientific achievements refer to the hydraulic performance of the rock in the sense that large-scale modelling of groundwater flow can be made with fair accuracy, and that the hydration of clay buffer can be predicted fairly well under certain hydraulic conditions in the rock. However, as discussed and debated in workshops at Sitges and Lund in 2003 and 2004, arranged in conjunction with the modelling activities of the project, the true processes involved in hydration and homogenization of the buffer are not sufficiently well known. Thus, the hydration of the buffer may be controlled rather

52
by molecular diffusion of water in vapour and liquid forms than by suction-generated flow through the partly saturated clay matrix. More research and development of this issue would be needed in order to verify this assumption.
4.3 Technological achievements The Prototype Repository project is concluded to have yielded a number of innovative techniques and very valuable practical experience. This includes the manufacturing of canisters and mega-sized buffer blocks and placement of these objects on site on a full scale. Other achievements of great value in future disposal of HLW are:
Preparation of large-diameter deposition holes with required straightness and steepness at reasonable cost.
Development of practically useful tools and techniques for placement of canisters and buffer blocks.
Selection and application of long-lasting instrumentation and reliable monitoring systems.

53
5 Acknowledgements
The work has been accomplished with financial support from the European Commission as part of the 5th Euratom Framework Programme for research and training, Nuclear Fission (1998 – 2002) and the contributing organisations Andra, AITEMIN, BGR, Cimne, Cardiff University, Clay Technology AB, Enresa, GRS, Geodevelopment AB, JNC, Posiva SKB, Sweco-VIAK AB and VTT for which the project co-ordinator is greatly indebted. Very important scientific and technical contributions have been provided by a number of researchers and engineers representing these organizations at the large number of meetings held and in the daily work in the underground laboratory. Furthermore, the co-ordinator wishes to express his sincere appreciation to the staff at AEspoe and consultants to SKB that have been involved in the project. Special thanks are due to prof. Roland Pusch for his skilled and dedicated contributions in all the major fields of the project, and to the European Commission officer Christophe Davies for his engagement and support of the project in all its phases.

54
6 References
Deliverables D1-D40. See List of Deliverables in Appendix 1.
Boergesson L., Fredrikson A., Johannesson L-E., 1994. Heat conductivity of buffer materials. SKB TR 94-29. Svensk Kaernbraenslehantering AB. Boergesson L., 1995a. Test Plan for backfill and plug test in ZEDEX drift. HRL PR 25-95-15. Svensk Kaernbraenslehantering AB. Boergesson L., Johannesson L-E., Sandén T., Hernelind J., 1995b. Modelling of the physical behaviour of water saturated clay barriers. Laboratory tests, material models and finite element application. SKB TR 95-20. Svensk Kaernbraenslehantering AB. Boergesson L., 1998. AEspoe Hard Rock Laboratory. Test plan for backfill and plug test. PR HRL 98-08. Svensk Kaernbraenslehantering AB. Boergesson L., Hernelind J., 1999a Coupled thermo-hydro-mechanical calculations of the water saturation phase of a KBS-3 deposition hole. Influence of hydraulic rock properties on the water saturation phase. SKB TR-99-41. Svensk Kaernbraenslehantering AB. Boergesson L., Hernelind J., 1999b. Prototype Repository. Preliminary modelling of the water saturation phase of the buffer and backfill materials. IPR-00-11. Svensk Kaernbraenslehantering AB. Collin, M., Boergesson, L., 2001.Prototype Repository. Instrumentation of buffer and backfill for measuring THM processes. IPR-02-03. Svensk Kaernbraenslehantering AB. Dahlstroem L-O., 1998. Test plan for the Prototype Repository. PR HRL-98-24. Svensk Kaernbraenslehantering AB. European Commission, 2004. CLUSTER EDZ, 2004. Proceedings of a European Commission CLUSTER Conference and workshop on - Impact of the Excavation Disturbed or Damaged Zone (EDZ) on the Performance of Radioactive Waste Geological Repositories, Luxembourg, LU, 03-05 November 2003, Nuclear Science and Technology, EUR 21028 EN”. Haokansson R., 1999. Beraekning av nuklidinnehaoll, resteffekt, aktivitet samt doshastighet foer utbraent kaernbraensle. R-99-74 Svensk Kaernbraenslehantering AB. (Swedish) Johannesson L-E., Boergesson L., Sandén T., 1998 Backfill materials based on crushed rock (part 2). Geotechnical properties determined in laboratory. IPR-99-23 Svensk Kaernbraenslehantering AB.

55
Karnland O., Sandén T., Johannesson L-E., Eriksen T. Jansson M., Wold S., Pedersen K., Motamedi M., Rosborg B., 2000. Long term test of buffer material. Final Report on the pilot parcels. SKB TR 00-22. Svensk Kaernbraenslehantering AB. Nordlund E., Li C., Carlsson, B., 1999. Prototype Repository. Mechanical properties of the diorite in the Prototype Repository at AEspoe HRL. Laboratory tests. IPR-99-25. Svensk Kaernbraenslehantering AB. Ohlsson Y., Neretnieks I., 1997. Diffusion data in granite. Recommended values. SKB TR 97-20. Svensk Kaernbraenslehantering AB. Patel S., Dahlstroem L-O., Stenberg L., 1997. Characterisation of the rock mass in the Prototype Repository at AEspoe HRL, Stage 1. HRL PR 25-97-24. Svensk Kaernbraenslehantering AB. Pettitt W., 1999.Acoustic emission and ultrasonic monitoring during the excavation of deposition holes in the Prototype Repository. IPR-01-01. Svensk Kaernbraenslehantering AB. Pettitt W., Young P., 2000. Analysis of the in situ principal stress field at the HRL using acoustic emission data. IPR-01-09. Svensk Kaernbraenslehantering AB, Pusch R., Takase K., Benbow S., 1998. Chemical processes causing cementation in heat-affected smectite – the Kinnekulle bentonite. SKB TR-98-25. Svensk Kaernbraenslehantering AB. Sjoeberg J., 2003. AEspoe Pillar Stability Experiment. 3D overcoring rock stress measurement in borehole KA3376B01 at the AEspoe HRL. IPR-03-16. Svensk Kaernbraenslehantering AB. SKB, 2004. Preliminary site description Simpevarp area – version 1.1. Svensk Kaernbraenslehantering AB. (in preparation) Staub I., Janson T., Fredriksson A., 2003. AEspoe Pillar Stability Experiment. Geology and properties of the rock mass around the experiment volume. IPR-03-02. Svensk Kaernbraenslehantering AB. Svemar C., 1999. Canister Retrieval Test. Test Plan. Part 1 - Geotechnical characterisation, test installation and monitoring during saturation. IPR-99-26. Svensk Kaernbraenslehantering AB. Torstenfelt B., Allard B., 1986 Migration of fission products and actinides in compacted Bentonite. SKB TR 86-14. Svensk Kaernbraenslehantering AB. Werme L., 1998. Design premises for canister for spent nuclear fuel. SKB TR 98-08. Yu J-W., Neretnieks I., 1997. Diffusion and sorption properties of radionuclides in compacted bentonite. SKB TR-97-12. Svensk Kaernbraenslehantering AB.

56
Appendix 1
List of deliverables
EC Delivery
Report title Author SKB report no
D1 Project work plan C Svemar, R Pusch IPR-00-30
D2 Instrumentation of buffer and backfill in Section I
L Boergesson, R Pusch
IPR-01-60
D3 Instrumentation of buffer and backfill in Section II
L Boergesson T Sandén
IPR-03-21
D4 Instrumentation for hydraulic measurement in Section I
I Rhén T Forsmark L Torin I Puigdomenech
IPR-01-32
D5 Instrumentation for hydraulic measurements in Section II
I Rhen T Forsmark T Magnusson P Alm
IPR-03-22
D6 Instrumentation for stress, strain and displacement measurement in rock
K Roeshoff N Bono
IPR-03-19
D7 Instrumentation for gas and water sampling in buffer and backfill in Section I
I Puigdomenech, T Sandén
IPR-01-62
D8 Instrumentation for gas and water sampling in buffer and backfill Section II
L Boergesson IPR-03-21
D9 Instrumentation for resistivity measurements in buffer, backfill in Section I
T Rothfuchs IPR-01-63
D10 Instrumentation for resistivity measurement in buffer, backfill and rock Section II
T Rothfuchs et. al. IPR-03-48
D11 Instrumentation for measurement of canisters displacement
I Barcena, J-L Sineriz
IPR-02-06
D12 Preparation of deposition holes prior to emplacement of buffer and canister in Section I
C Andersson, R Pusch
IPR-01-64

57
EC Delivery
Report title Author SKB report no
D13 Preparation of deposition holes prior to emplacement of buffer and canisters in Section II
C Andersson, R Pusch
IPR-04-21
D14 Installation of buffer and canisters in Section I
L Boergesson D Gunnarsson L-E Johannesson T Sandén
IPR-02-23
D15 Installation of buffer and canisters in Section II
L-E Johannesson IPR-04-13
D16 Backfill & plug installation in Section I L Boergesson D Gunnarsson L-E Johannesson T Sandén
IPR-02-23
D17 Backfill & plug installation in Section II L Boergesson et. al. IPR-04-13
D18 Prototype Repository test design and installation
T Sandén ITD-00-20 IPR-01-18
D19 Sensor data report # 1 L Boergesson, R Goudarzi
IPR-02-22
D20 Sensor data report # 2 L Boergesson, R Goudarzi
IPR-02-53
D21 Sensor data report #3 L Boergesson, R Goudarzi
IPR-02-61
D22 Sensor data report # 4 L Boergesson, R Goudarzi
IPR-03-15
D23 Sensor data report # 5 L Boergesson, R Goudarzi
IPR-03-23
D24 Water and gas analysis report #1 I Puigdomenech IPR-04-26
D25 Water and gas analysis report #2 I Puigdomenech Cancelled
D26 Water and gas analysis report #3 I Puigdomenech Cancelled
D27 Summary report of investigations before the operation phase.
T Forsmark, I Rhén
IPR-01-65
D28 THM laboratory test on buffer and backfill – progress report #1
L Boergesson IPR-01-34
D29 THM laboratory tests on buffer and backfill – progress report # 2
L Boergesson IPR-01-34

58
EC Delivery
Report title Author SKB report no
D30 THM laboratory tests on rock – progress report #1
K Larsson IPR-02-66
D31 THM laboratory tests on rock – progress report # 2
Cancelled
D32 Determination of porosity in EDZ J Maaranen, J Lehtioksa J Timonen
IPR-02-17
D33 Selection of THMCB models R Pusch IPR-01-66
D34 Predictive THMCB modelling of buffer, backfill and rock
R Pusch (editor) IPR-03-26
D35 Comparison of results from THMCB modelling of buffer, backfill and rock with measured data from Prototype Repository
R Pusch (editor) IPR-04-11
D36 Final report on EC project C Svemar IPR-04-27
D37 Preliminary Technological Implementation Plan (TIP)
EC report
D38 Mid-term TIP EC report
D39 Final TIP EC report
D40 Prototype Repository. Installation of buffer, canisters, backfill and instruments in Section 1
B Vignal IPR-02-23

59
Appendix 2
Contact details concerning follow-up of the project
Participant SC member Address Contact
Svensk Kaernbraenslehantering (SKB)
Christer Svemar
AEspoelaboratoriet Pl.300 572 95 FIGEHOLM Sweden
E-mail: [email protected] Phone: +46-491 76 78 05
Posiva Oy (Posiva)
Jukka-Pekka Salo
27160 OLKILUOTO Finland
E-mail: [email protected] Phone:+358 2 8372 3744
Empresa Nacional de Residuos radiactivos, S.A (Enresa)
Fernando Huertas Empresa Nacional de Residuos Emilio Vargas, 7 28043 MADRID Spain
E-mail: [email protected] Phone: +34 91 566 8196
Asociacion para la Investigacion y Desarrollo Industrial de los Recursos Naturales (AITEMIN)
Jose-Luis Fuentes-Cantillana
Aitemin Alenza, 1 28003 MADRID Spain
E-mail: [email protected] Phone: +34 914 424955
Centre Internacionale de Métode Numérics en Enginyeria (Cimne)
Alberto Ledesma Gran Capitan, s/n-Edifico C1 Campus Norte 08034 BARCELONA Spain
E-mail: [email protected] Phone:34 93 401 68 64
Gesellschaft fuer Anlagen-und Reaktorsicherheit (GRS)
Klaus Wieczorek Teodor-Heuss-Strasse 438122 BRAUNSCHWEIG Germany
E-mail: [email protected] Phone: +49 531 801 22 26
Bundesanstalt fuer Geowissenschaften und Rohstoffe (BGR)
Thomas Nowak Box 510153 3065 HANNOVER Germany
E-mail: [email protected] Phone: 46 511 643 24 18
Geoenvironmental research Centre, Univ. of Cardiff (UWC)
Hywel Thomas Geoenvironmental Research Centre Box 686 CF24 3TB CARDIFF UK
E-mail: [email protected] Phone: +44 29 2087 4279 +44 29 2087 4189

60
Participant SC member Address Contact
Japan Nuclear Cycle Development Institute (JNC)
Mikazu Yui Tokai Works 4-33, Muramatsu 319-1184 TOKAI TOWN Ibaraki Pref. Japan
E-mail: [email protected]
Phone: +81 29 287 3695
Geodevelopment AB (GEO)
Roland Pusch
IDEON Research Center 223 70 LUND Sweden
E-mail: [email protected]
Phone:+4646 286 24 00
Sweco VIAK (Sweco VIAK)
Ingvar Rhén Environmental Eng. Box 2203 403 14 GOETEBORG Sweden
E-mail: [email protected] Phone: +46 31 62 75 00
Clay Technology AB (CT) Lennart Boergesson IDEON Research Center 223 70 LUND Sweden
E-mail: [email protected] Phone: +46 46 286 25 70
VTT Comminities and Infrastructure (VTT)
Ari Luukkonen Box 19031 02044 ESPOO Finland
E-mail : [email protected]
Phone : +358 20 722 111
Agence Nationale pour la gestion des Déchets Radioactifs (Andra)
Bertrand Vignal Andra 1-7 rue Jean Monnet 92298 Chatenay Malabry France
E-mail : [email protected]
Phone : +33 (146) 11 8149