European Apple & Pear Crop Forecast August...
104
39th Prognosfruit European Apple & Pear Crop Forecast August 2015 Sponsored by
Transcript of European Apple & Pear Crop Forecast August...
39th Prognosfruit
European Apple & Pear Crop Forecast
August 2015
Sponsored by
www.smartfresh.com
Beautifully crisp, juicy and tasty!The SmartFreshSM Quality System enhances the freshness,quality and value of your apples and contributes to fruitwaste reduction. Now commercialized in 46 countries.
Contact your AgroFreshrepresentative today.
Programme – Thursday 6 August 2015
08:00 – 09:00 Registration
09:00 – 09:30 Opening
Mr Hans van Es, Chairman Fruit and Vegetables Committee at COPA – COGECA
Mr Georg Kössler, President South Tyrolean Apple Consortium
Mr Arnold Schuler, Political Leader of Agriculture in South Tyrol
09:30 – 10:30 Production Apple Forecast, Market Analysis and Outlook
Mr Philippe Binard, WAPA – Apple Production forecast 2015
Mr Helwig Schwartau, AMI – Apple Market Analysis & Trends
Mr Alessandro Dalpiaz, Assomela – Italian Apple Outlook
10:30 – 11:15 Coffee Break
11:15 – 12:30 Production Pear Forecast, Market Analysis and Outlook
Ms Daphne van Doorn, WAPA – Pear Production forecast 2015
Mr Helwig Schwartau, AMI – Pear Market Analysis & Trends
Mr Christian Weseloh, BVEO – Prognosfruit 2016 preview, Germany
12:30 – 14:15 Lunch
14:15 – 15:45 Afternoon Session 1
Mr Herbert Dorfmann, member of the European Parliament o TTIP – what does it mean for the apple and pear production in the EU?
Mr Todd Fryhofer, Washington Apple Commission o USA and Washington apples trends
Mr Klaus Gasser, VOG Products o Trends and 2015 market development in the processing industry
15:45 – 16:15 Coffee break
16:15 – 17:45 Afternoon Session 2
Mr Georg Theiner, Fructus o The change in the apples and pear processing industry in the next 10 years
Mr Gerhard Eberhöfer, vice-president EBF and Mr Peter Rolker, vice-president EBF - European bio/organic fruit forum
o Organic market: growth and opportunities in Europe o EU reform of organic legislation: A step forward or backwards?
Mr Michael Oberhuber, research centre Laimburg o Innovations in the apple production sector in South Tyrol
19:30 Gala dinner
3
PROGNOSFRUIT 2015 Participants ListUpdated, 29 July 2015
Nr. Surname, Name Company / Institute E-Mail
Austria1 Amon, Johann Austria Juice GmbH [email protected]
2 Baldauf, Christian LTW Intralogistics GmbH [email protected]
3 Eibel, David OPST Obst Partner Steiermark GmbH [email protected]
4 Ennser, Franz Austria Juice GmbH [email protected]
5 Gsöls, Rupert Verband Steirischer Erwerbsobstbauern [email protected]
6 Juritsch, Henrich EVA Handels GmbH [email protected]
7 Mann, Gerhard Steirerfrucht GmbH [email protected]
8 Mauthner, Gerd Obstbau Zinner [email protected]
9 Mazelle, Wolfgang Verband Steirischer Erwerbsobstbauern [email protected]
10 Nestelberger, Thomas OPST Partner Steiermark GmbH [email protected]
11 Pressnig, Daniela EVA Handels GmbH [email protected]
12 Rosenzopf, Roland EVA Handels GmbH [email protected]
13 Schaden, Franz OPST Obst Partner Steiermark GmbH [email protected]
14 Zinner Dr., Heinz Obstbau Zinner [email protected]
Belgium15 Agil, Emmanuel Belgische Fruitveiling CVBA [email protected]
16 Appeltans, Philippe V.B.T [email protected]
17 Baestaens, Leo BELORTA [email protected]
18 Benoit, Marc Belgische Fruitveiling CVBA [email protected]
19 Binard, Philippe WAPA Association [email protected]
20 Bylemans, Dany Proefcentrum Fruitteelt npo [email protected]
21 Champagne, Erik Belgische Fruitveiling CVBA [email protected]
22 Craemers, Joseph BELORTA [email protected]
23 De Meulenear, Wim REO Veiling [email protected]
24 De Wever, Geert Janssen Pharmaceutica NV [email protected]
25 Debersaques, Filip BFO-OFB [email protected]
26 Demare, Rita V.B.T [email protected]
27 Eeman, Yves Univeg Belgium [email protected]
28 Groven, Didier Enzafruit New Zealand (Continent) NV [email protected]
29 Gustin, Christian Belgische Fruitveiling CVBA [email protected]
30 Hermans, Jan AIJN [email protected]
31 Izquierdo De Santiago, Raquel WAPA Association [email protected]
32 Jans, Kris BELORTA [email protected]
33 Lessens, Jürgen REO Veiling [email protected]
34 Lowette, Filip Belgische Fruitveiling CVBA [email protected]
35 Luder, Urs T. GKE NV [email protected]
36 Meesters, Jos Veiling Haspengouw C.V. [email protected]
37 Morren, Hilde [email protected]
38 Pauly, Mathieu BELORTA [email protected]
39 Theon, Patrick Belgische Fruitveiling CVBA [email protected]
40 Van Der Veken, Alain Belgische Fruitveiling CVBA [email protected]
41 Van Doorn, Daphne WAPA Association [email protected]
42 Vercammen, Josef Proefcentrum Fruitteelt npo [email protected]
43 Vercammen, Patricia V.B.T [email protected]
44 Vrancken, Pieter BELORTA [email protected]
45 Willems, Philippe BELORTA [email protected]
4
PROGNOSFRUIT 2015 Participants ListUpdated, 29 July 2015
Nr. Surname, Name Company / Institute E-Mail
Bulgaria46 Mihaylova, Tanya Greens Trade Ltd. [email protected]
Denmark47 Jager, Jan GartneriRadgivnngen [email protected]
France48 Astoul, Bernadette Sica Sival [email protected]
49 Aubert, Frederic Blue Whale [email protected]
50 Belloc, Christophe Blue Whale [email protected]
51 Berger, Alain Pommes Poires Communication Sas [email protected]
52 Brard, Sylvain Blue Whale [email protected]
53 Bergere, Denis AFIDEM [email protected]
54 Chauffaille, Beatrice Pommes Poires Communication Sas [email protected]
55 Chauffaille, Yves Sica dü Roseix [email protected]
56 Clivaz, Michel [email protected]
57 Crabos, Didier Cofruid'Oc Mèditerranée [email protected]
58 Dasque, Jacques AREFLH [email protected]
59 Doucet, Florence Credit Agricole [email protected]
60 Favart, Christian COOPLIM [email protected]
61 Gazeau, Yves Sica Sevre Gatine yves@vergersgazeau@fr
62 Gocha, Nathalie AGROFRESH [email protected]
63 Guerin, Vincent Association Nationale Pommes Poires [email protected]
64 Harzig, Jean Vegetable - L'écho de la planète fruits & legumes
65 Herman, Philippe Association Nationale Pommes Poires [email protected]
66 Heulin, Louise VERGERS DES COTEAUX [email protected]
67 Kager, Jochen AGROFRESH [email protected]
68 Lambert, Nicolas Perlim [email protected]
69 Leterne, Jean Christofer AGROFRESH [email protected]
70 Levade, Pascal Sica Sival [email protected]
71 Mellenotte, Thierry PINK LADY EUROPE [email protected]
72 Nougaillac, Jean Codruid'OC [email protected]
73 Peyres, Marc Blue Whale [email protected]
74 Philip, Marc Pommes Poires Communication Sas [email protected]
75 Rauffet, Marc Pommes Poires Communication Sas [email protected]
76 Richard, Albert Pommes Poires Communication Sas [email protected]
77 Sauvaitre, Daniel Association Nationale Pommes Poires [email protected]
78 Tessier, Gerard Blue Whale [email protected]
79 Varlet, Pierre Pommes Poires Communication Sas [email protected]
80 Vialaret, Alain Blue Whale [email protected]
Germany81 Berg, Andreas EDEKA AG [email protected]
82 Börnicke, Katja Evelina Deutschland GmbH [email protected]
83 Büchele, Manfred Kompetenzzentrum Obstbau-Bodensee [email protected]
84 Burghard, Gertrud BVEO [email protected]
85 Contreras, Francisco EDEKA AG [email protected]
86 Diekmann, Friedrich-Andrea Amecke Fruchtsaft GmbH & Co. KG [email protected]
87 Fiedler, Michael BPW Consulting & Marketing GmbH [email protected]
5

PROGNOSFRUIT 2015 Participants ListUpdated, 29 July 2015
Nr. Surname, Name Company / Institute E-Mail
88 Form, Ilonka BVEO [email protected]
89 Gillner, Axel Döhler GmbH [email protected]
90 Heitliner, Klaus Association of the German fruit Juice industry [email protected]
91 Kolb, Andreas Albi GmbH & Co. KG, [email protected]
92 Kopcinski, Daniel Haus Rabenhorst O. Lauffs GmbH & Co. KG [email protected]
93 Mayer, Ingolf Plattenhardt und Wirth [email protected]
94 Moje, Stefan Elbe-Obst Erzeugerorganisation r.V. [email protected]
95 Nüssle, Jürgen WOG Raiffeisen eG [email protected]
96 Raff, Markus Döhler GmbH [email protected]
97 Rolker, Peter Rolker Ökofrucht GmbH [email protected]
98 Schwartau, Helwig Agrarmarkt Informations-Gesellschaft mbH [email protected]
99 Stallknecht, Hans-Dieter Deutscher Bauernverband [email protected]
100 Stricker, Christoph EDEKA AG [email protected]
101 Thuile, Peter BB Brandenburger Fruchthandel GmbH [email protected]
102 Treyer, Egon Marktgemeinschaft Bodenseeobst AG [email protected]
103 Weseloh, Christian BVEO [email protected]
104 Wieneke, Björn Elbe-Obst Erzeugerorganisation r.V. [email protected]
105 Winstel, Michael WOg Raiffeisen eG [email protected]
106 Zum Felde, Hans-Herbert Elbe-Obst Erzeugerorganisation r.V. [email protected]
Italy107 Alber, Alois Juval - Obstgen [email protected]
108 Alber, Andreas OG Lanafruit
109 Alber, Christoph OVEG [email protected]
110 Aliprandini, Lorenzo Consorzio Melinda
111 Andergassen, Martin VOG
112 Andergassen, Hannes VOG Products Gen. Landw. Ges. [email protected]
113 Anegg, Thomas Neufrucht
114 Bassi, Daniele Consorzio Melinda
115 Bergamo, Nicola Consorzio Melinda
116 Bernard, Arthur VOG
117 Bertagnolli, Carolin smtConsulting - Organisation
118 Brandlwanter, Markus Sortenerneuerungskonsortium Südtirol [email protected]
119 Bragantini, Giuseppe OP Nordest
120 Brandstätter, Thomas Hans Zipperle AG [email protected]
121 Brigadue, Stefano Isolcell S.p.A. [email protected]
122 Brocchetti, Rodolf Consorzio La Trentina
123 Bruni, Pierluigi Consorzio Melinda
124 Caliari, Luca Consorzio La Trentina
125 Calzà, Romano Consorzio La Trentina
126 Canestrini, Silvio Mezzacorona sca
127 Capello, Frank Dolmetscher / Interpreter
128 Carra, Anton Consorzio Melinda [email protected]
129 Castiglioni, Werner Bio Südtirol
130 Cattani, Francesco Consorzio Melinda
131 Cescolini, Mario Consorzio Melinda
132 Chisté, Mario Consorzio La Trentina
133 Clementi, Otmar OG Grufruit Group
6
PROGNOSFRUIT 2015 Participants ListUpdated, 29 July 2015
Nr. Surname, Name Company / Institute E-Mail
134 Clò, Alberto Dolmetscher / Interpreter
135 Dalpiaz, Alessandro Assomela Società Cooperativa [email protected]
136 De Poli, Anna Dolmetscher / Interpreter
137 Detomi, Nicola European Fruit Group Italy srl [email protected]
138 Devigili, Ciro Consorzio La Trentina
139 Dichgans, Gerhard VOG
140 Dietl, Karl GEOS [email protected]
141 Dolzani, Gianluca Consorzio Melinda
142 Donat, Philipp Obstversteigerung Sigmundskron KG [email protected]
143 Dorfmann, Herbet EU-Parlamentarier
144 Eberhöfer, Gerhard VI.P Gen. Landw. Gesellschaft [email protected]
145 Elsler, Maria RAI
146 Espro, Felice Corriere dell'Alto Adige [email protected]
147 Filippi, Giulio Consorzio Melinda [email protected]
148 Franzoi, Cesare Consorzio Melinda
149 Frötscher, Daniel OG Fruchthof Überetsch
150 Gaiser, Luis OG Terlan
151 Gamper, Barbara VOG Products [email protected]
152 Gamper, Christiane smtConsulting - Organisation
153 Gamper, Stefanie smtConsulting - Organisation
154 Gang, Judy smtConsulting - Organisation
155 Gasser, Johann Melix
156 Gasser, Klaus Vog Products
157 Gasser, Norbert Fruitservice GmbH [email protected]
158 Gatscher, Andreas OG Terlan
159 Gorza, Roberto Consorzio Melinda
160 Götsch, Evi Messe Bozen
161 Granata, Luca C.S.O. SOC.COOP
162 Gruber, Thomas OG Lana
163 Gruber, Helmut VOG
164 Guerra, Walter Sortenerneuerungskonsortium Südtirol [email protected]
165 Höller, Rudolf Texel Landw. Gesellschaft [email protected]
166 Kofler, Manuel OG Zwölfmalgreien
167 Kössler, Georg VOG
168 Kraus, Andreas Amt für Obst-und Weinbau Provinz Bozen
169 Ladurner, Reinhard ALPE [email protected]
170 Leonardi, Massimo Consorzio Melinda
171 Lochmann, Gregor Longobardi [email protected]
172 Lochmann, Manfred OG Fruchthof Überetsch
173 Lorenzi, Battista Consorzio Melinda
174 Lösh, Bernhard Bio Südtirol
175 Lovatti, Luca C.I.F.
176 Magnani, Ennio Assomela Società Cooperativa [email protected]
177 Magnani, Nicola Consorzio Melinda
178 Mair, Markus Neufrucht
179 Mair, Willi Palbox
180 Marini, Claudia smtConsulting - Organisation
181 Menapace, Stefano Consorzio Melinda
7
PROGNOSFRUIT 2015 Participants ListUpdated, 29 July 2015
Nr. Surname, Name Company / Institute E-Mail
182 Meneghel, Monica Dolmetscher / Interpreter
183 Menegoni, Marco Consorzio La Trentina [email protected]
184 Menghini, Aldo Consorzio Melinda
185 Mittermair, Stefan Cafa Meran
186 Montanaro, Giulia Assomela Società Cooperativa [email protected]
187 Nardin, Karl Isolcell S.p.A.
188 Niederegger, Markus OVEG [email protected]
189 Nocentino, Giacomo RK Marketing srl
190 Oberhofer, Thomas VI.P Gen. Landw. Gesellschaft [email protected]
191 Oberhollenzer, Sabine VOG
192 Oberhuber, Michael Versuchszentrum Laimburg
193 Oberkofler, Anna Südtiroler Apfelkonsortium [email protected]
194 Oberrauch, Michael Obstversteigerung Sigmundskron KG [email protected]
195 Odorizzi, Michele Consorzio Melinda [email protected]
196 Pan, Peter Selectfruit GmbH [email protected]
197 Paoli, Franco Consorzio Melinda
198 Paoli, Norbert OG Kaiser Alexander
199 Pastore, Martina Dolmetscher / Interpreter
200 Pezzi, Flavio Consorzio Melinda
201 Pezzi, Diego Consorzio Melinda
202 Pfeifer, Alexander VOG Products Gen. Landw. Ges. [email protected]
203 Pichler, Richard OG Grufruit Group
204 Pilati, Carlo Consorzio Melinda
205 Pilati, Simone Consorzio La Trentina
206 Pinzger, Martin VI.P Gen. Landw. Gesellschaft [email protected]
207 Pircher, Markus Cafa Meran [email protected]
208 Pircher, Dietmar VOG
209 Pirchstaller, Kathrin VOG
210 Platzgummer, Vera Sortenerneuerungskonsortium Südtirol [email protected]
211 Poldervaart, Gerard FruitMedia BV [email protected]
212 Profaizer, Davide Consorzio Melinda
213 Puff, Siegfried Hans Zipperle AG [email protected]
214 Ratschiller, Kurt VOG
215 Reggidori, Giampiero C.S.O. SOC.COOP [email protected]
216 Riddo, Renato Consorzio Melinda
217 Rivoira, Marco RIVOIRA GIOVANNI & Figli spa
218 Roncador, Michele Consorzio La Trentina
219 Roncador, Roberto Consorzio La Trentina
220 Rubner, Renate Ana Südtiroler Bauernbund [email protected]
221 Runggaldier, Johannes OG Algund
222 Saltuari, Michael TopControl GmbH [email protected]
223 Salvi, Marco Fruitimprese [email protected]
224 Sarcletti, Walter Consorzio Melinda
225 Schnitzer, Hannes smtConsulting - Organisation
226 Schnitzer, Hermann smtConsulting - Organisation
227 Schnitzer, Katrin smtConsulting - Organisation
228 Schnitzer, Norbert OG Lanafruit
229 Schuler, Arnold Landesrat für Landwirtschaft Provinz Bozen
8

PROGNOSFRUIT 2015 Participants ListUpdated, 29 July 2015
Nr. Surname, Name Company / Institute E-Mail
230 Schwarz, Erich OG Kurmark Unifruit
231 Sinner, Dietman Südtiroler Qualitätskontrolle [email protected]
232 Spögler, Hannes GEOS [email protected]
233 Stefli, Giovanni Consorzio Melinda
234 Steinegger, Walter OG Kurmark Unifruit
235 Stelzer, Erwin VOG Products Gen. Landw. Ges. [email protected]
236 Stocchi, Laura C.S.O. SOC.COOP [email protected]
237 Stricker, Peter Juval - Obstgen [email protected]
238 Tappeiner, Christoph Texel Landw. Gesellschaft [email protected]
239 Thaler, Walter EO-Frut
240 Thaler, Stephan Melix
241 Theiner, Georg Fructus Meran AG [email protected]
242 Theiner, Fritz Fructus Meran AG [email protected]
243 Theiner, Andreas Fructus Meran AG [email protected]
244 Theiner, Thomas Fructus Meran AG [email protected]
245 Theiner, Peter Fructus Meran AG [email protected]
246 Tomaselli, Luca Consorzio La Trentina
247 Tröger, Jochen ALPE [email protected]
248 Ungerer, Karl EO-Frut
249 Unterweger, Huber OG Algund
250 Valerio, Andrea Consorzio La Trentina
251 Valerio, Luca Consorzio La Trentina
252 Varesco, Franz VOG Products Gen. Landw. Ges. [email protected]
253 Von Klebelsberg, Urban OG Zwölfmalgreien
254 Von Leon, Herbert Cafa Meran
255 Vorhauser, Stefan Cofrum
256 Waldner, Walther Fachmagazin Obstbau Weinbau [email protected]
257 Weis, Harald OG EGMA
258 Wellenzohn, Leonhard VI.P Gen. Landw. Gesellschaft [email protected]
259 Werth, Hannes VOG Products Gen. Landw. Ges. [email protected]
260 Werth, Thomas OG EGMA
261 Wielander, Josef VI.P Gen. Landw. Gesellschaft [email protected]
262 Wolf, Richard Cofrum
263 Zadra, Stefano Consorzio Melinda
264 Zanesco, Fabio VI.P Gen. Landw. Gesellschaft [email protected]
265 Zanone, Roberto Dolmetscher / Interpreter
266 Zanotelli, Nicola FROM Soc. Agr. Coop [email protected]
267 Zöschg, Josef VI.P Gen. Landw. Gesellschaft [email protected]
268 Zuech, Egon OG Lana
269 Zuech, Renato Consorzio Melinda
270 Zwick, Horst DSSmith [email protected]
Netherlands271 Bus, Herman NFO [email protected]
272 De Kat, Cornelis Fruitmaster Holland [email protected]
273 Feijtel, Bas The Greenery / Coöperatie Coforta U.A. [email protected]
274 Gerritsen, Michiel NFO [email protected]
275 Kampshöer, Leonardus Fruitmaster Holland [email protected]
9

PROGNOSFRUIT 2015 Participants ListUpdated, 29 July 2015
Nr. Surname, Name Company / Institute E-Mail
276 Kavelaars, Olav The Greenery / Coöperatie Coforta U.A. [email protected]
277 Klaassen, Ad Dutch Produce Association-DPA [email protected]
278 Koning, Siep NFO [email protected]
279 Kutschruiter, Jan The Greenery / Coöperatie Coforta U.A. [email protected]
280 Maris, Anton The Greenery / Coöperatie Coforta U.A. [email protected]
281 Pinckaers, Marcel US Embassy- USDA/FAS [email protected]
282 Pronk, Gerard The Greenery / Coöperatie Coforta U.A. [email protected]
283 Scheefhals,,Wilhelmus Coroos Cnserven BV [email protected]
284 Schimmel, Onno [email protected]
285 Van Es, Hans Dutch Produce Association-DPA [email protected]
286 Van Loon, Gerard The Greenery / Coöperatie Coforta U.A. [email protected]
287 Wilschut, Bert The Greenery / Coöperatie Coforta U.A. [email protected]
Poland288 Antolak, Thomasz TAB-Koncentraty Sp.zo.o. [email protected]
289 Kawalec, Marek Plantpress sp.z o.o. [email protected]
290 Makosz, Eberhard Rajpol Trade spzo.o. [email protected]
291 Mueller, Stefan TAB - Koncentraty Sp. Z o.o. [email protected]
292 Wozniak, Dominik Ewelina spz.o.o [email protected]
293 Wozniak, Ryszard Ewelina spz.o.o [email protected]
Serbia294 Milosevic, Milos PIK JUZNI BANAT doo [email protected]
295 Mojsilovic, Nikola PIK JUZNI BANAT doo [email protected]
Slovenia296 Kozole, Bostjan Chamber of Commerce and Industry of Slovenia [email protected]
Spain297 Simon, Manel AFRUCAT [email protected]
Switzerland298 Enggasser, Josiane Schweizer Obstverband [email protected]
299 Haverland, Hartmut Bucher Unipektin AG [email protected]
300 Kajdzik, Mateusz [email protected]
301 Kilchherr, John Schweizer Obstverband [email protected]
302 Mäder, Josef Schweizer Obstverband [email protected]
Turkey303 Dietz, Derya Aroma Bursa Fruit Juice & Food Ind. Inc. [email protected]
304 Iris A., Umit Targid A.S [email protected]
305 Uzun, Serpil Asya Meyve Suyu Ve Gida San As [email protected]
United Kingdom306 Barlow, Adrian English Apples and Pears Ltd [email protected]
307 Barker, Michael Fresh Produce Journal [email protected]
United States308 Barley, Kevin Morgan Stanley [email protected]
309 Fryhover, Todd M. Washington Apple Commission [email protected]
10
EUROPEAN APPLE AND PEAR CROP FORECAST
AUGUST 2015
11

12
August 2015
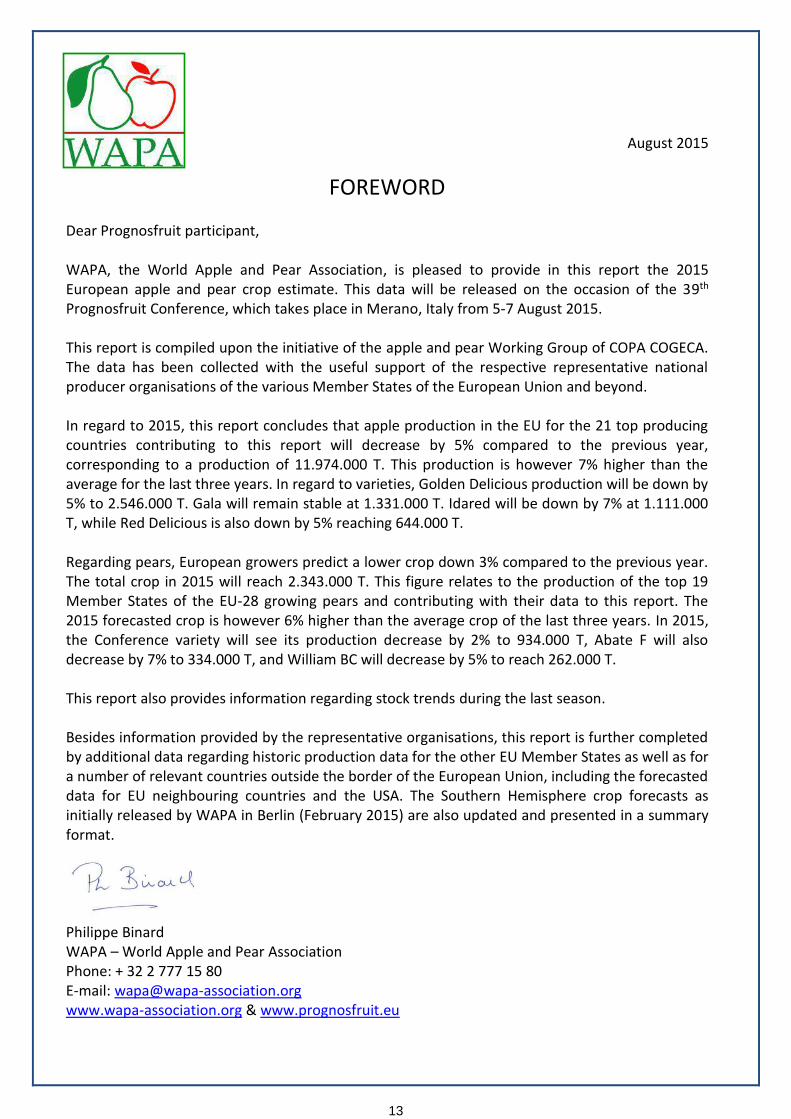
FOREWORD Dear Prognosfruit participant, WAPA, the World Apple and Pear Association, is pleased to provide in this report the 2015 European apple and pear crop estimate. This data will be released on the occasion of the 39th Prognosfruit Conference, which takes place in Merano, Italy from 5-7 August 2015. This report is compiled upon the initiative of the apple and pear Working Group of COPA COGECA. The data has been collected with the useful support of the respective representative national producer organisations of the various Member States of the European Union and beyond. In regard to 2015, this report concludes that apple production in the EU for the 21 top producing countries contributing to this report will decrease by 5% compared to the previous year, corresponding to a production of 11.974.000 T. This production is however 7% higher than the average for the last three years. In regard to varieties, Golden Delicious production will be down by 5% to 2.546.000 T. Gala will remain stable at 1.331.000 T. Idared will be down by 7% at 1.111.000 T, while Red Delicious is also down by 5% reaching 644.000 T. Regarding pears, European growers predict a lower crop down 3% compared to the previous year. The total crop in 2015 will reach 2.343.000 T. This figure relates to the production of the top 19 Member States of the EU-28 growing pears and contributing with their data to this report. The 2015 forecasted crop is however 6% higher than the average crop of the last three years. In 2015, the Conference variety will see its production decrease by 2% to 934.000 T, Abate F will also decrease by 7% to 334.000 T, and William BC will decrease by 5% to reach 262.000 T. This report also provides information regarding stock trends during the last season. Besides information provided by the representative organisations, this report is further completed by additional data regarding historic production data for the other EU Member States as well as for a number of relevant countries outside the border of the European Union, including the forecasted data for EU neighbouring countries and the USA. The Southern Hemisphere crop forecasts as initially released by WAPA in Berlin (February 2015) are also updated and presented in a summary format.
Philippe Binard WAPA – World Apple and Pear Association Phone: + 32 2 777 15 80 E-mail: [email protected] www.wapa-association.org & www.prognosfruit.eu
13

Important comments on the report:
All crop data presented in this report are in metric tonnes (MT).
Data are rounded to the nearest ‘000T. Rounding could influence % of variation in particular in case of low production levels.
Data are those collected by the representative producer organisations of the respective countries. Data usually reflect the commercial volume of production and therefore does not include own garden production. These data could therefore also be different from those as collected by FAO.
When there is no reporting organisation, data included in this report relates to the information collected from FAOSTAT and/or EUROSTAT databases. This information is added to extend the scope of the report and to give a more comprehensive overview of the situation.
The list of varieties has been established on the basis of the recommendation of the apple and pear Working Group of COPA COGECA. If a variety is not specifically specified, it is then reported into the category “other”.
Concerning the USA, the official apples data will be made available on 20 – 21 August 2015 at the US Apple Crop Outlook Conference in Chicago. The data as included in this report are therefore provisional and could be subject to change. For apples, the breakdown by variety is not yet available and therefore was extrapolated from an average of the previous five years’ breakdown.
14
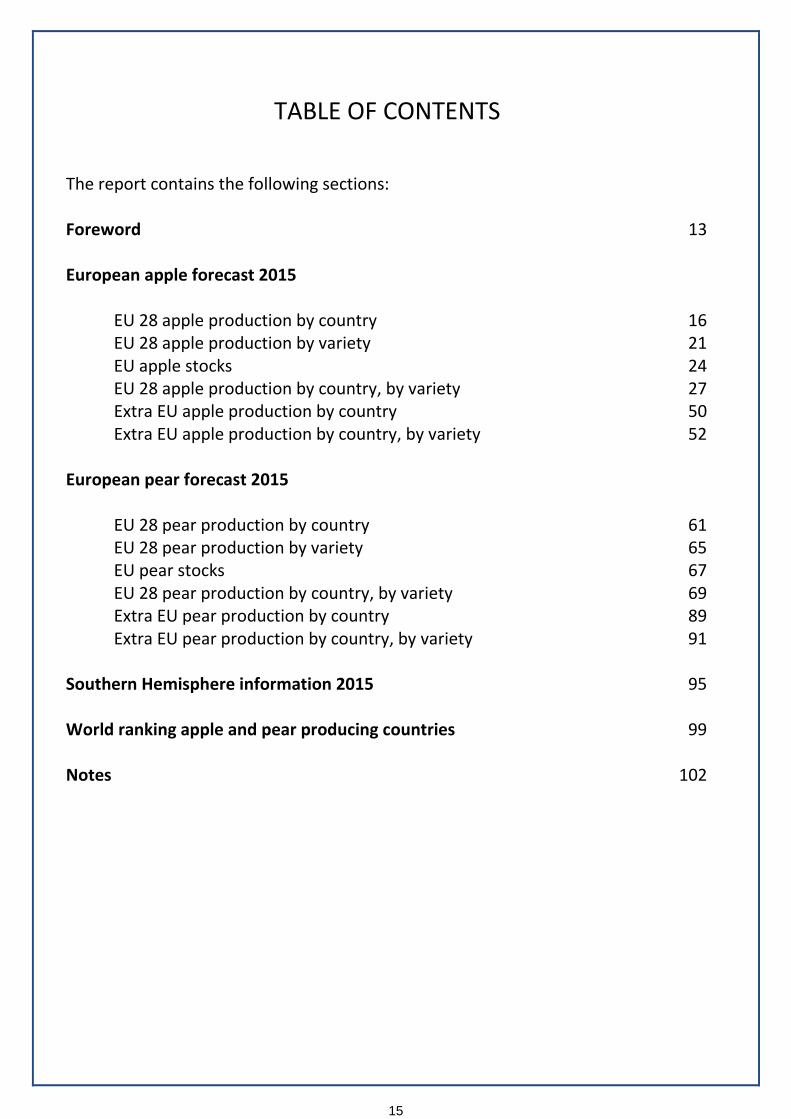
TABLE OF CONTENTS The report contains the following sections: Foreword 13 European apple forecast 2015
EU 28 apple production by country 16 EU 28 apple production by variety 21 EU apple stocks 24 EU 28 apple production by country, by variety 27 Extra EU apple production by country 50 Extra EU apple production by country, by variety 52
European pear forecast 2015
EU 28 pear production by country 61 EU 28 pear production by variety 65 EU pear stocks 67 EU 28 pear production by country, by variety 69 Extra EU pear production by country 89 Extra EU pear production by country, by variety 91
Southern Hemisphere information 2015 95 World ranking apple and pear producing countries 99 Notes 102
15

16

EUROPEAN APPLE FORECAST 2015
EU 28 apple production by country
17

Apple production by country
EU 28
2006 2007 2008 (1) (2)Countryx 1000 tons
2009 2010 2011 2012 2013 2014 F2015
163 193 159 -5 7Austria 185 169 199 157 155 188 179
358 358 336 -19 2Belgium 344 288 305 220 220 318 258
48 40 49 63 40Croatia 60 89 83 59 96 62 101
160 113 157 15 22Czech Rep 145 103 79 118 121 131 151
27 32 26 -8 7Denmark 24 21 20 18 23 26 24
1,585 1,676 1,528 10 14France 1,651 1,579 1,701 1,169 1,576 1,444 1,594
948 1,070 1,047 -21 -8Germany 1,071 835 953 972 804 1,116 885
267 236 231 -3 -1Greece 224 254 305 242 236 245 238
480 203 583 -33 -18Hungary 514 488 301 750 585 920 618
1,991 2,196 2,164 -5 7Italy 2,237 2,179 2,293 1,939 2,122 2,456 2,328
32 31 34 -10 -21Latvia 13 12 8 9 15 10 9
100 40 74 37 5Lithuania 74 46 49 39 40 27 37
348 396 376 -7 4Netherlands 402 334 418 281 314 353 330
2,250 1,100 3,200 0 15Poland 2,600 1,850 2,500 2,900 3,170 3,750 3,750
258 258 245 7 12Portugal 274 251 265 221 284 272 291
417 362 329 -8 -6Romania 379 423 412 351 387 382 351
31 10 42 -11 -1Slovakia 48 32 33 36 42 46 41
71 80 68 6 28Slovenia 64 66 73 45 56 68 72
547 599 528 -4 7Spain 470 486 507 391 464 505 486
20 16 18 31 34Sweden 18 20 17 14 17 16 21
174 196 201 -6 7UK 212 214 226 162 204 225 211
10,275Total: 9,206 11,395 -5 7
(1) Percentage difference between F2015 and 2014(2) Percentage difference between F2015 and the average of 2012 - 2013 - 2014
020004000
60008000
100001200014000
2005
2006
2007
2008
2009
2010
2011
2012
2013
2014
F20
15
EU apple production
11,008 9,740 10,746 10,095 10,929 12,560 11,974
18

Apple production in other Member States (based on FAO and/ or EUROSTAT data)
x 1000 tons
Country 2006 2007 2008 2009 2010 2011 2012 2013 2014
Bulgaria 26,3 26,2 23,5 35,5 43,2 40,4 30,9 55 54,5
Cyprus 10,7 8,6 6,5 7,3 7 7 6,8 7 7,9
Estonia 2,8 4,1 2,3 5,5 2 2,7 1,9 4,5 1,2
Finland 3,3 3,5 4,3 4,3 4,3 5,2 4,8 4,8 5,3
Ireland 42 45 47 43 41 43 44 45 44
Luxembourg 2,2 2,2 3,1 2,3 2,6 2,1 1,8 1,9 2,6
OTHER EU
19

20

EU 28 apple production by variety
21

EU 28
Apple production by variety
Variety (1) (2)
x 1000 tons
2006 2007 2008 2009 2010 2011 2012 2013 2014 F2015
Annurca 56 51 45 -13 -535 34 35 35 35 40 35
Boskoop 108 100 100 0 2782 60 73 58 58 85 86
Braeburn 279 318 295 -8 0338 289 324 264 302 321 295
Bramley 83 85 95 -36 -2595 95 91 59 70 83 53
Cortland 155 75 136 0 -1780 50 70 40 25 25 25
Cox Orange 117 108 103 -4 -1865 89 89 38 42 32 31
Cripps Pink 66 73 70 -5 22162 160 184 144 187 249 236
Elstar 432 489 471 -13 -1488 362 453 353 346 431 373
Fuji 133 188 205 4 18245 251 261 212 311 321 333
Gala 1,016 1,024 1,051 0 101,077 989 1,137 1,111 1,204 1,328 1,331
Gloster 128 94 166 -12 -9114 112 148 187 196 201 177
Golden Delicious 2,346 2,530 2,582 -5 22,636 2,413 2,628 2,286 2,535 2,677 2,546
Granny Smith 311 306 313 -1 9343 342 413 302 361 383 379
Idared 653 388 895 -7 3828 619 692 986 1,069 1,192 1,111
Jonagold 642 660 812 -11 6742 544 652 475 500 644 575
Jonagored 210 234 198 -13 7204 180 194 367 341 491 430
Jonathan 35 148 353 -17 -16305 282 242 201 178 193 161
Lobo 210 100 203 0 -18100 61 100 50 30 30 30
Morgendurf/impera 119 88 91 -5 1567 81 61 53 57 74 71
Pinova 17 20 30 14 4735 27 37 43 62 79 90
Red Delicious 631 629 769 -5 6724 663 680 541 597 675 644
Red Jonaprince 31 -5 4138 29 33 48 53 98 94
Reinette Grise du 78 103 86 1 1999 101 108 73 121 126 127
Shampion 307 172 395 0 8323 257 327 423 457 494 494
Spartan 12 11 1 -18 6 6 6 6 6 6
Stayman 21 19 18 -14 -1816 18 17 12 18 14 12
Other new varieties 15 17 65 1 14108 134 152 350 412 459 462
Other 2,106 1,173 1,804 -2 171,652 1,494 1,541 1,377 1,358 1,809 1,769
Total: 10,275 9,206 11,395 -5 7
(1) Percentage difference between F2015 and 2014(2) Percentage difference between F2015 and the average of 2012 - 2013 - 2014(3) Other new varieties: Ariane, Belgica, Cameo, Diwa, Greenstar, Honey Crunch, Jazz, Junami, Kanzi, Mariac, Rubens, Tentation, Wellant,...
0
500
1000
1500
Gala Idared Red Delicious Jonagold
Top 4 varieties of apple production after Golden Delicious
2 0 11
2 0 12
2 0 13
2 0 14
F2 0 15
2000
2200
2400
2600
2800
2012 2013 2014 F2015
Top 1 variety - Golden Delicious production
11,008 9,740 10,746 10,095 10,929 12,560 11,974
22
EU apple stocks
23
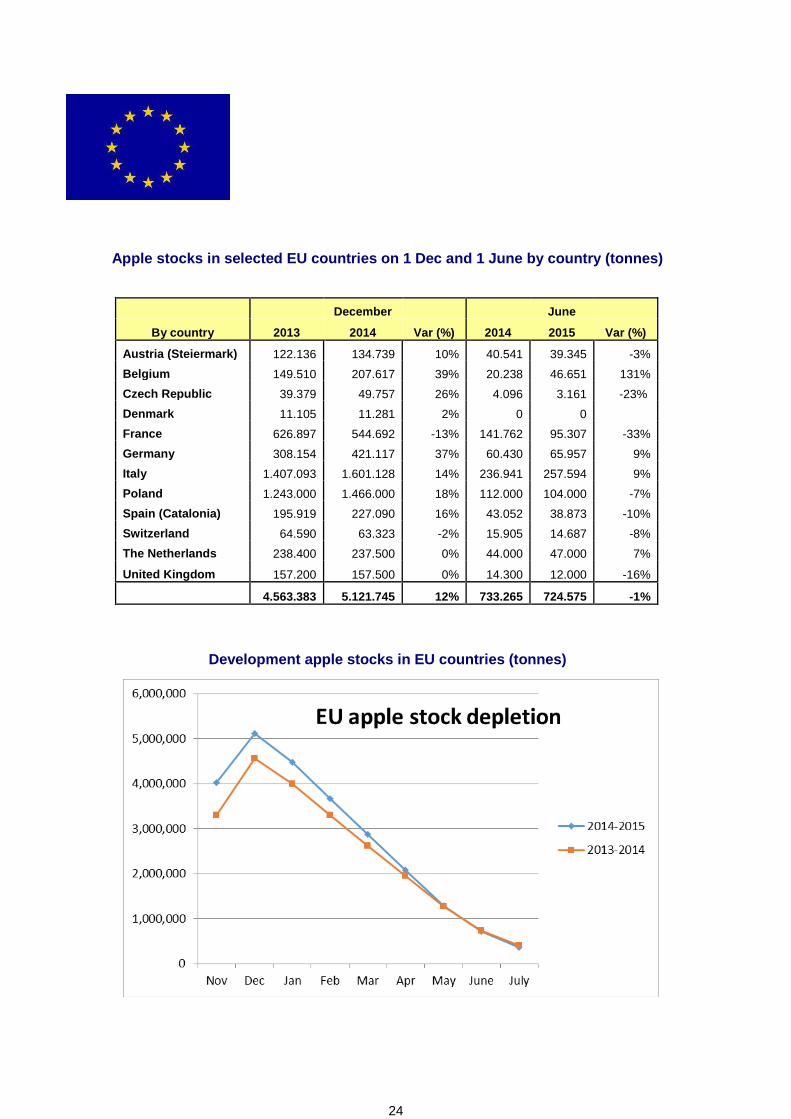
Apple stocks in selected EU countries on 1 Dec and 1 June by country (tonnes)
December June
By country 2013 2014 Var (%) 2014 2015 Var (%)
Austria (Steiermark) 122.136 134.739 10% 40.541 39.345 -3%
Belgium 149.510 207.617 39% 20.238 46.651 131%
Czech Republic 39.379 49.757 26% 4.096 3.161 -23%
Denmark 11.105 11.281 2% 0 0
France 626.897 544.692 -13% 141.762 95.307 -33%
Germany 308.154 421.117 37% 60.430 65.957 9%
Italy 1.407.093 1.601.128 14% 236.941 257.594 9%
Poland 1.243.000 1.466.000 18% 112.000 104.000 -7%
Spain (Catalonia) 195.919 227.090 16% 43.052 38.873 -10%
Switzerland 64.590 63.323 -2% 15.905 14.687 -8%
The Netherlands 238.400 237.500 0% 44.000 47.000 7%
United Kingdom 157.200 157.500 0% 14.300 12.000 -16%
4.563.383 5.121.745 12% 733.265 724.575 -1%
Development apple stocks in EU countries (tonnes)
24
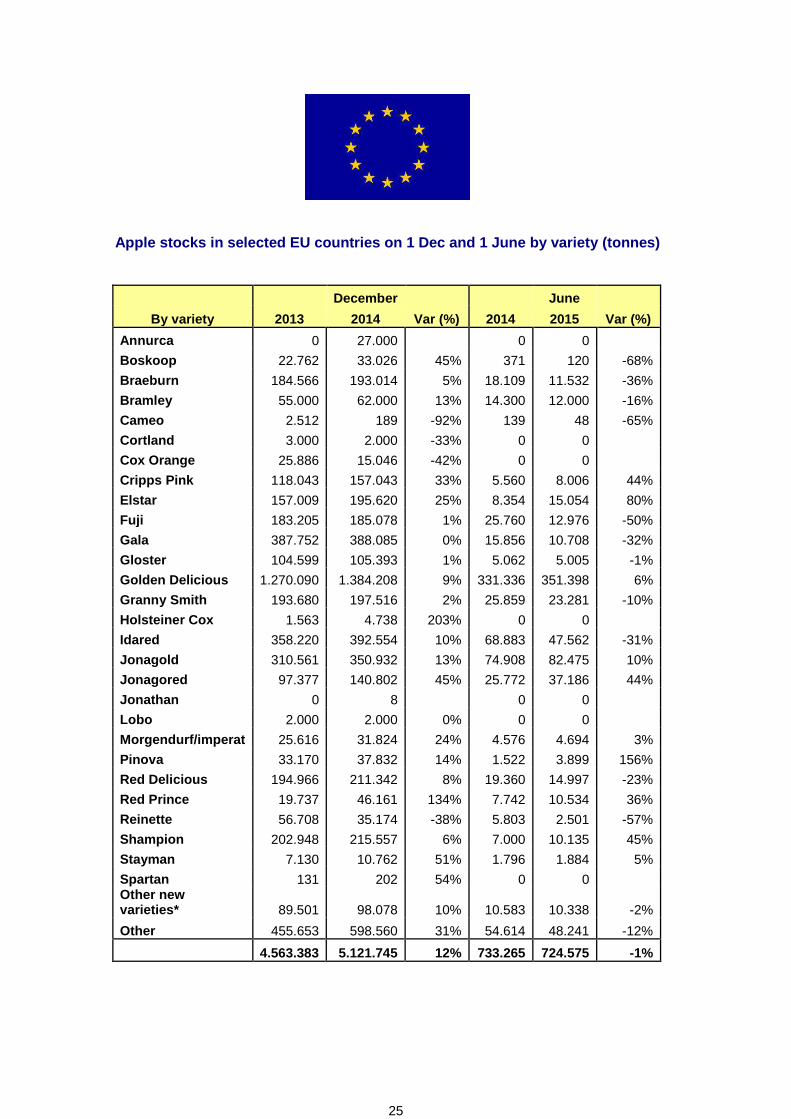
Apple stocks in selected EU countries on 1 Dec and 1 June by variety (tonnes)
December June
By variety 2013 2014 Var (%) 2014 2015 Var (%)
Annurca 0 27.000 0 0
Boskoop 22.762 33.026 45% 371 120 -68%
Braeburn 184.566 193.014 5% 18.109 11.532 -36%
Bramley 55.000 62.000 13% 14.300 12.000 -16%
Cameo 2.512 189 -92% 139 48 -65%
Cortland 3.000 2.000 -33% 0 0
Cox Orange 25.886 15.046 -42% 0 0
Cripps Pink 118.043 157.043 33% 5.560 8.006 44%
Elstar 157.009 195.620 25% 8.354 15.054 80%
Fuji 183.205 185.078 1% 25.760 12.976 -50%
Gala 387.752 388.085 0% 15.856 10.708 -32%
Gloster 104.599 105.393 1% 5.062 5.005 -1%
Golden Delicious 1.270.090 1.384.208 9% 331.336 351.398 6%
Granny Smith 193.680 197.516 2% 25.859 23.281 -10%
Holsteiner Cox 1.563 4.738 203% 0 0
Idared 358.220 392.554 10% 68.883 47.562 -31%
Jonagold 310.561 350.932 13% 74.908 82.475 10%
Jonagored 97.377 140.802 45% 25.772 37.186 44%
Jonathan 0 8 0 0
Lobo 2.000 2.000 0% 0 0
Morgendurf/imperat 25.616 31.824 24% 4.576 4.694 3%
Pinova 33.170 37.832 14% 1.522 3.899 156%
Red Delicious 194.966 211.342 8% 19.360 14.997 -23%
Red Prince 19.737 46.161 134% 7.742 10.534 36%
Reinette 56.708 35.174 -38% 5.803 2.501 -57%
Shampion 202.948 215.557 6% 7.000 10.135 45%
Stayman 7.130 10.762 51% 1.796 1.884 5%
Spartan 131 202 54% 0 0 Other new varieties* 89.501 98.078 10% 10.583 10.338 -2%
Other 455.653 598.560 31% 54.614 48.241 -12%
4.563.383 5.121.745 12% 733.265 724.575 -1%
25

26
EU 28 apple production by country, by variety
27
EU 28
Apple production by country, by variety
Variety (1) (2)
x 1000 tons
F2015
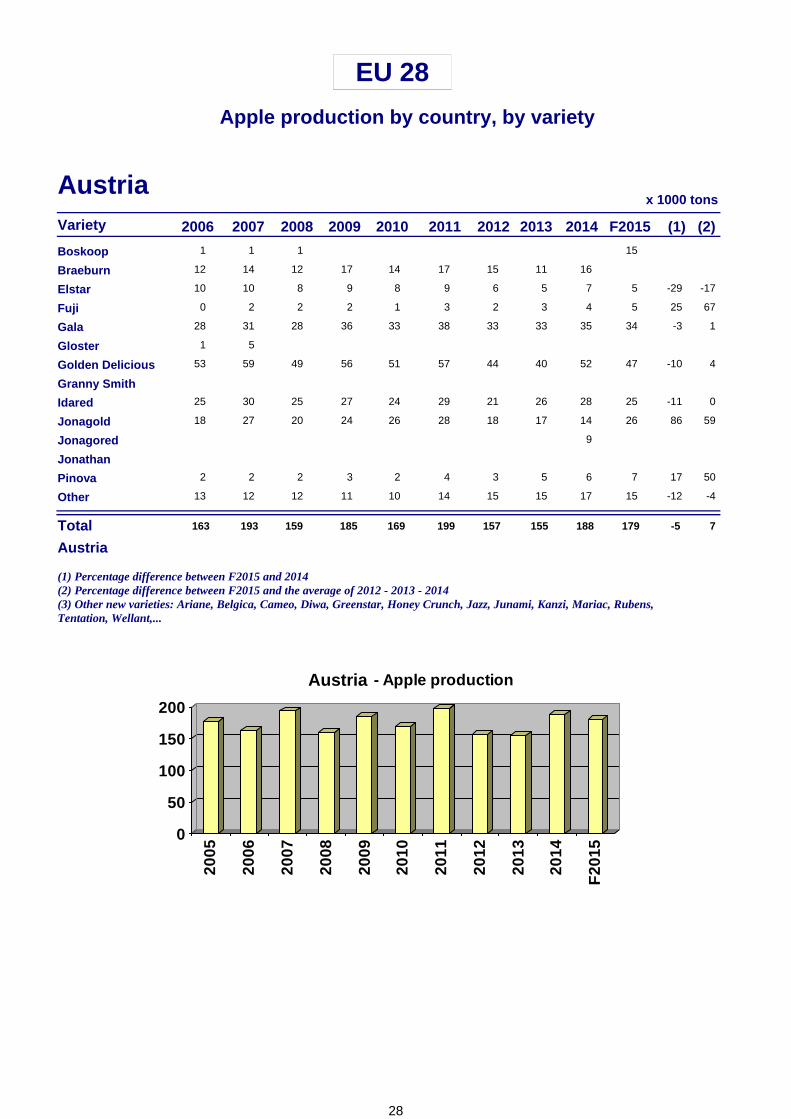
Austria2006 2007 2008 2009 2010 2011 2012 2013 2014
1 1 1Boskoop 15
12 14 12Braeburn 17 14 17 15 11 16
10 10 8 -29 -17Elstar 9 8 9 6 5 7 5
0 2 2 25 67Fuji 2 1 3 2 3 4 5
28 31 28 -3 1Gala 36 33 38 33 33 35 34
1 5Gloster53 59 49 -10 4Golden Delicious 56 51 57 44 40 52 47
Granny Smith25 30 25 -11 0Idared 27 24 29 21 26 28 25
18 27 20 86 59Jonagold 24 26 28 18 17 14 26
Jonagored 9
Jonathan2 2 2 17 50Pinova 3 2 4 3 5 6 7
13 12 12 -12 -4Other 11 10 14 15 15 17 15
Total 163 193 159 -5 7
(1) Percentage difference between F2015 and 2014(2) Percentage difference between F2015 and the average of 2012 - 2013 - 2014(3) Other new varieties: Ariane, Belgica, Cameo, Diwa, Greenstar, Honey Crunch, Jazz, Junami, Kanzi, Mariac, Rubens, Tentation, Wellant,...
0
50
100
150
200
2005
2006
2007
2008
2009
2010
2011
2012
2013
2014
F20
15
- Apple production
Austria
Austria
185 169 199 157 155 188 179
28
EU 28
Apple production by country, by variety
Variety (1) (2)
x 1000 tons
F2015
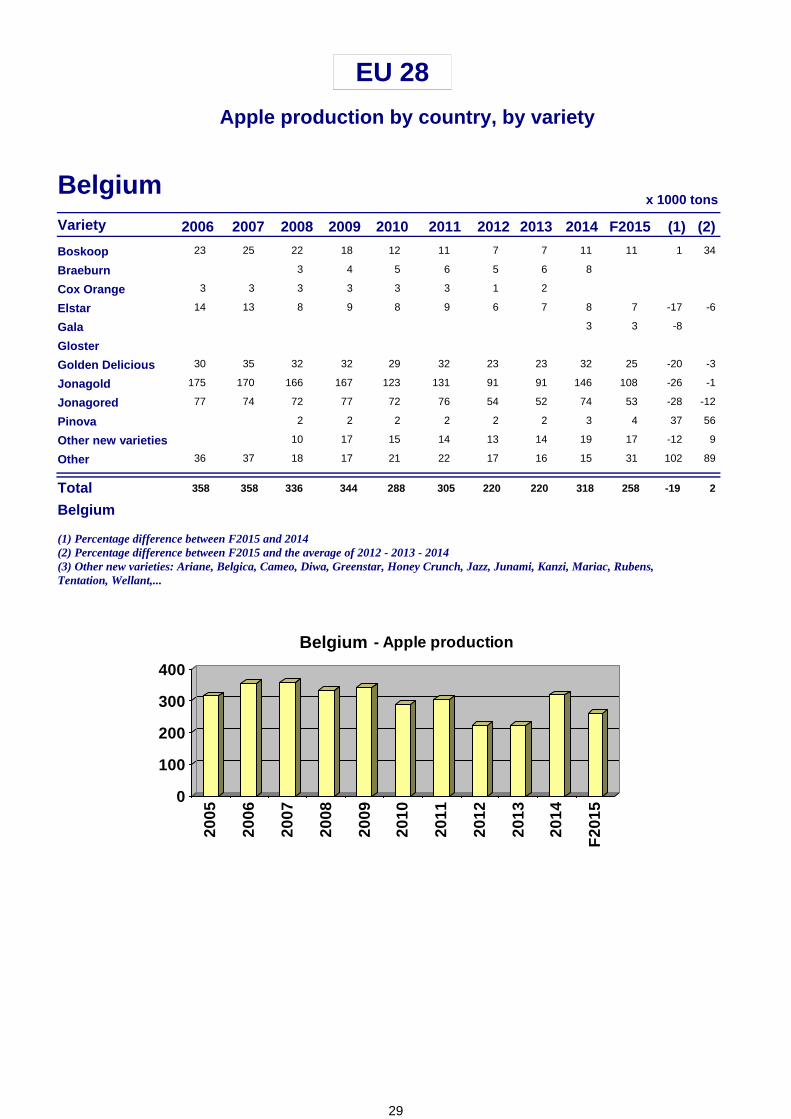
Belgium2006 2007 2008 2009 2010 2011 2012 2013 2014
23 25 22 1 34Boskoop 18 12 11 7 7 11 11
3Braeburn 4 5 6 5 6 8
3 3 3Cox Orange 3 3 3 1 2
14 13 8 -17 -6Elstar 9 8 9 6 7 8 7
-8Gala 3 3
Gloster30 35 32 -20 -3Golden Delicious 32 29 32 23 23 32 25
175 170 166 -26 -1Jonagold 167 123 131 91 91 146 108
77 74 72 -28 -12Jonagored 77 72 76 54 52 74 53
2 37 56Pinova 2 2 2 2 2 3 4
10 -12 9Other new varieties 17 15 14 13 14 19 17
36 37 18 102 89Other 17 21 22 17 16 15 31
Total 358 358 336 -19 2
(1) Percentage difference between F2015 and 2014(2) Percentage difference between F2015 and the average of 2012 - 2013 - 2014(3) Other new varieties: Ariane, Belgica, Cameo, Diwa, Greenstar, Honey Crunch, Jazz, Junami, Kanzi, Mariac, Rubens, Tentation, Wellant,...
0
100
200
300
400
2005
2006
2007
2008
2009
2010
2011
2012
2013
2014
F20
15
- Apple production
Belgium
Belgium
344 288 305 220 220 318 258
29
EU 28
Apple production by country, by variety
Variety (1) (2)
x 1000 tons
F2015
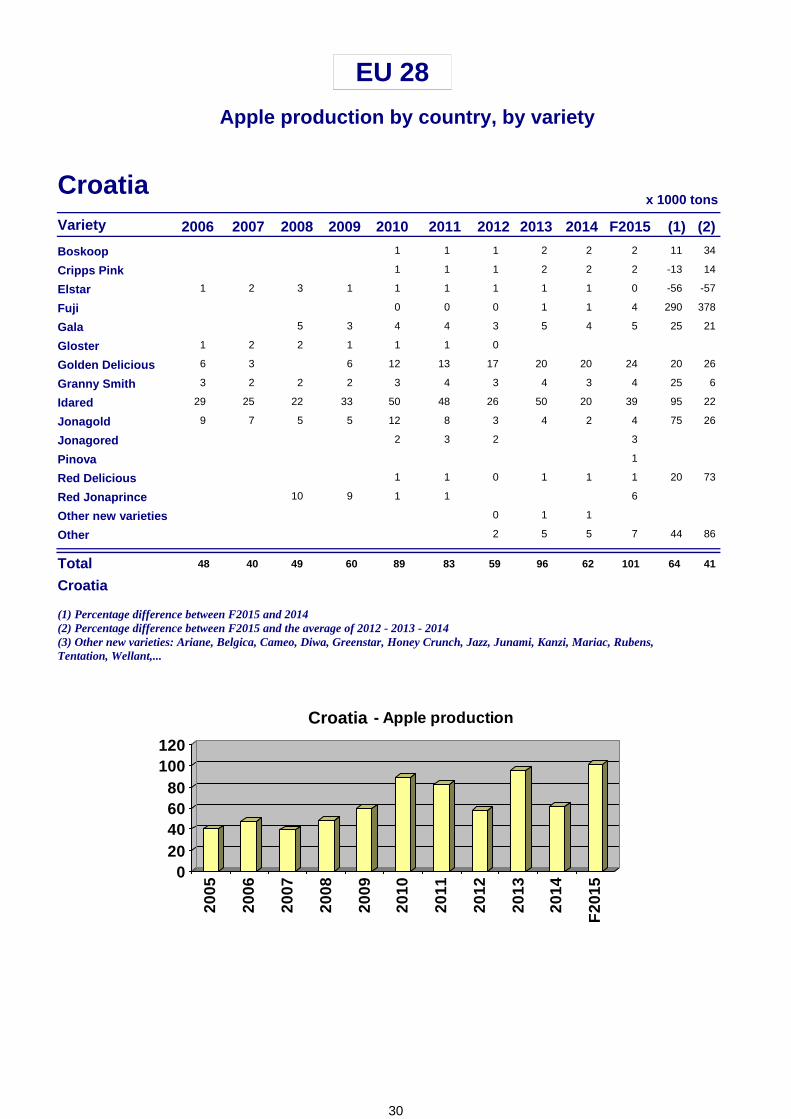
Croatia2006 2007 2008 2009 2010 2011 2012 2013 2014
11 34Boskoop 1 1 1 2 2 2
-13 14Cripps Pink 1 1 1 2 2 2
1 2 3 -56 -57Elstar 1 1 1 1 1 1 0
290 378Fuji 0 0 0 1 1 4
5 25 21Gala 3 4 4 3 5 4 5
1 2 2Gloster 1 1 1 0
6 3 20 26Golden Delicious 6 12 13 17 20 20 24
3 2 2 25 6Granny Smith 2 3 4 3 4 3 4
29 25 22 95 22Idared 33 50 48 26 50 20 39
9 7 5 75 26Jonagold 5 12 8 3 4 2 4
Jonagored 2 3 2 3
Pinova 1
20 73Red Delicious 1 1 0 1 1 1
10Red Jonaprince 9 1 1 6
Other new varieties 0 1 1
44 86Other 2 5 5 7
Total 48 40 49 64 41
(1) Percentage difference between F2015 and 2014(2) Percentage difference between F2015 and the average of 2012 - 2013 - 2014(3) Other new varieties: Ariane, Belgica, Cameo, Diwa, Greenstar, Honey Crunch, Jazz, Junami, Kanzi, Mariac, Rubens, Tentation, Wellant,...
020406080
100120
2005
2006
2007
2008
2009
2010
2011
2012
2013
2014
F20
15
- Apple production
Croatia
Croatia
60 89 83 59 96 62 101
30

EU 28
Apple production by country, by variety
Variety (1) (2)
x 1000 tons
F2015
Czech Rep2006 2007 2008 2009 2010 2011 2012 2013 2014
Cox Orange3 4 42 63Gala 6 4 4 5 8 8 11
8 5 6 -5 -8Gloster 4 4 3 5 3 4 4
34 20 27 3 18Golden Delicious 33 22 21 27 29 35 36
45 28 45 0 5Idared 38 29 18 28 23 27 27
12 10 13 8 18Jonagold 12 8 8 10 14 14 15
Jonathan2 1 2 14 -5Red Delicious 1 1 1 1 1 1 1
10 8 10 12 18Shampion 9 6 5 9 7 9 10
10 9 17 5Spartan 6 4 3 5 4 4 4
50 29 40 42 44Other 37 26 14 29 31 30 43
Total 160 113 157 15 22
(1) Percentage difference between F2015 and 2014(2) Percentage difference between F2015 and the average of 2012 - 2013 - 2014(3) Other new varieties: Ariane, Belgica, Cameo, Diwa, Greenstar, Honey Crunch, Jazz, Junami, Kanzi, Mariac, Rubens, Tentation, Wellant,...
0
50
100
150
200
2005
2006
2007
2008
2009
2010
2011
2012
2013
2014
F20
15
- Apple production
Czech Rep
Czech Rep
145 103 79 118 121 131 151
31
EU 28
Apple production by country, by variety
Variety (1) (2)
x 1000 tons
F2015
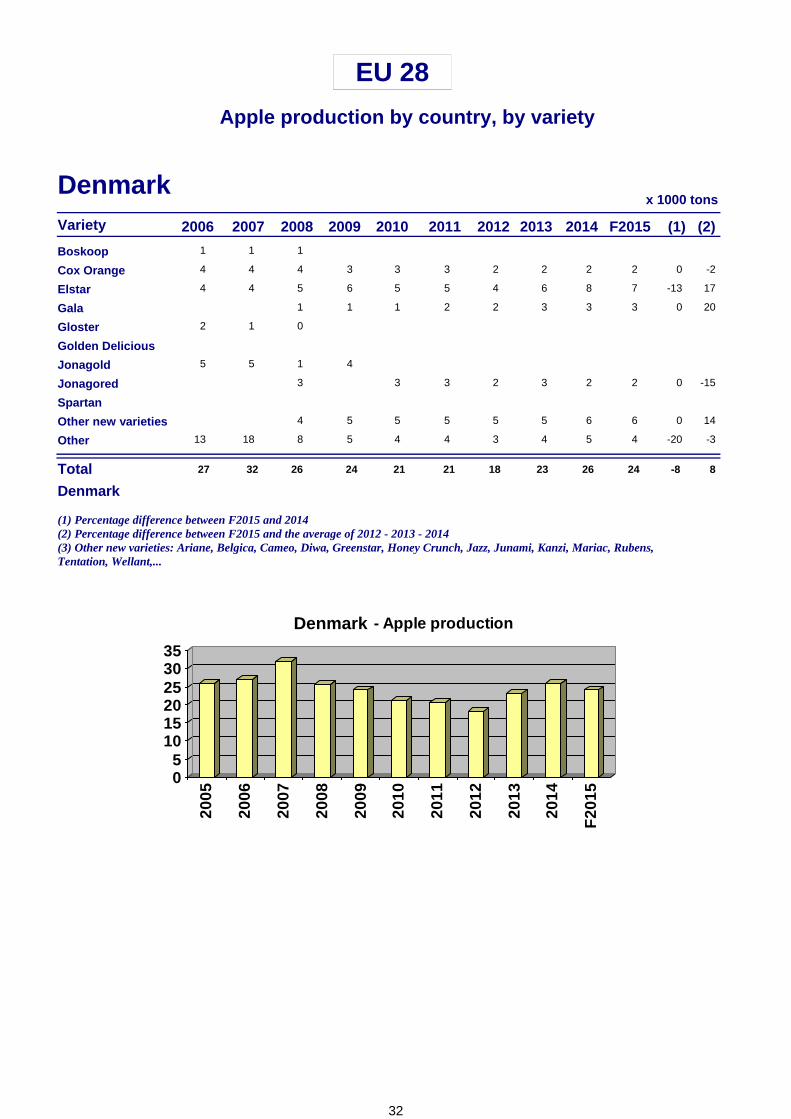
Denmark2006 2007 2008 2009 2010 2011 2012 2013 2014
1 1 1Boskoop4 4 4 0 -2Cox Orange 3 3 3 2 2 2 2
4 4 5 -13 17Elstar 6 5 5 4 6 8 7
1 0 20Gala 1 1 2 2 3 3 3
2 1 0Gloster
Golden Delicious5 5 1Jonagold 4
3 0 -15Jonagored 3 3 2 3 2 2
Spartan4 0 14Other new varieties 5 5 5 5 5 6 6
13 18 8 -20 -3Other 5 4 4 3 4 5 4
Total 27 32 26 -8 8
(1) Percentage difference between F2015 and 2014(2) Percentage difference between F2015 and the average of 2012 - 2013 - 2014(3) Other new varieties: Ariane, Belgica, Cameo, Diwa, Greenstar, Honey Crunch, Jazz, Junami, Kanzi, Mariac, Rubens, Tentation, Wellant,...
05
101520253035
2005
2006
2007
2008
2009
2010
2011
2012
2013
2014
F20
15
- Apple production
Denmark
Denmark
24 21 21 18 23 26 24
32

EU 28
Apple production by country, by variety
Variety (1) (2)
x 1000 tons
F2015
France2006 2007 2008 2009 2010 2011 2012 2013 2014
9 11 10 0 55Boskoop 9 6 7 4 10 15 15
141 144 115 14 9Braeburn 118 94 102 61 94 73 83
66 73 70 5 32Cripps Pink 82 89 92 78 102 129 136
26 24 17 24 37Elstar 18 15 17 14 22 21 26
41 49 49 49 26Fuji 68 62 63 44 65 43 64
272 290 266 13 17Gala 261 246 269 226 270 263 296
581 616 543 5 8Golden Delicious 605 564 581 336 507 441 462
173 174 172 6 -3Granny Smith 186 183 210 147 169 139 147
16 11 9 0 -10Idared 7 6 6 4 10 6 6
25 28 22 52 111Jonagold 20 15 14 6 23 25 38
84 75 61 2 -3Red Delicious 74 67 82 47 59 49 50
40 42 39 5 21Reinette Grise du C 40 41 46 23 46 43 45
15 14 30 5 14Other new varieties 50 57 59 50 62 64 67
98 126 126 20 20Other 113 134 153 129 137 133 159
Total 1,585 1,676 1,528 10 14
(1) Percentage difference between F2015 and 2014(2) Percentage difference between F2015 and the average of 2012 - 2013 - 2014(3) Other new varieties: Ariane, Belgica, Cameo, Diwa, Greenstar, Honey Crunch, Jazz, Junami, Kanzi, Mariac, Rubens, Tentation, Wellant,...
0
500
1000
1500
2000
2005
2006
2007
2008
2009
2010
2011
2012
2013
2014
F20
15
- Apple production
France
France
1,651 1,579 1,701 1,169 1,576 1,444 1,594
33
EU 28
Apple production by country, by variety
Variety (1) (2)
x 1000 tons
F2015
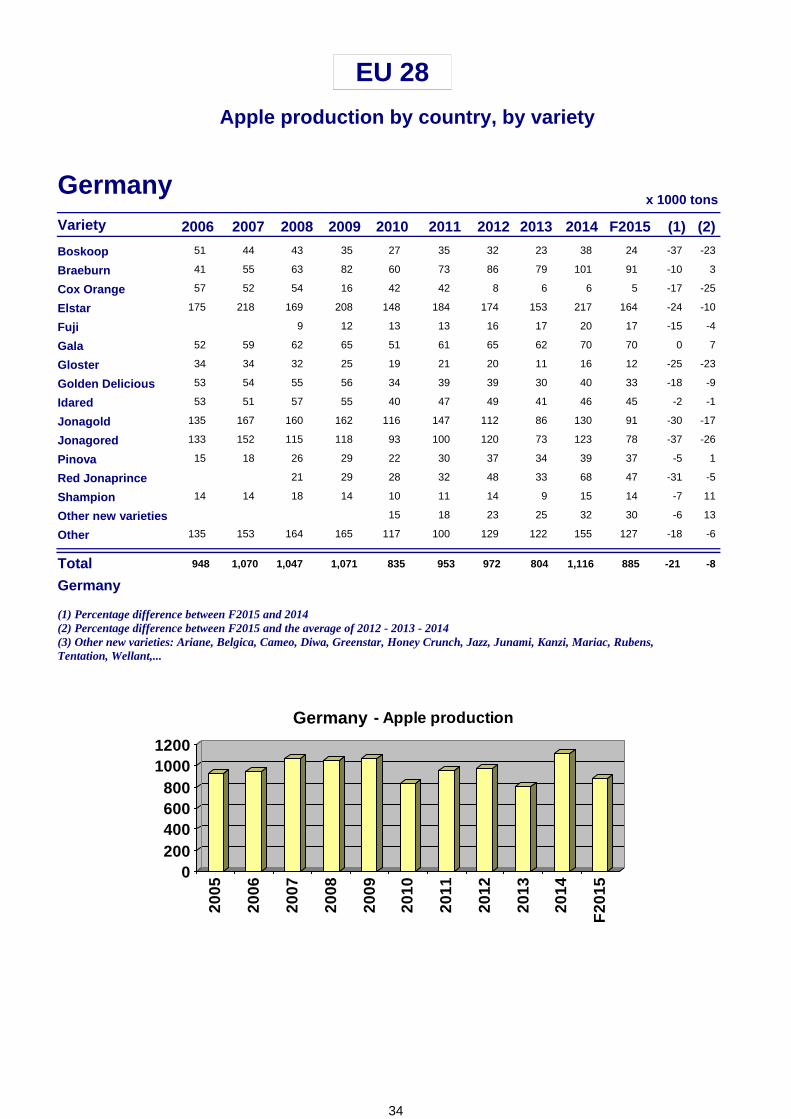
Germany2006 2007 2008 2009 2010 2011 2012 2013 2014
51 44 43 -37 -23Boskoop 35 27 35 32 23 38 24
41 55 63 -10 3Braeburn 82 60 73 86 79 101 91
57 52 54 -17 -25Cox Orange 16 42 42 8 6 6 5
175 218 169 -24 -10Elstar 208 148 184 174 153 217 164
9 -15 -4Fuji 12 13 13 16 17 20 17
52 59 62 0 7Gala 65 51 61 65 62 70 70
34 34 32 -25 -23Gloster 25 19 21 20 11 16 12
53 54 55 -18 -9Golden Delicious 56 34 39 39 30 40 33
53 51 57 -2 -1Idared 55 40 47 49 41 46 45
135 167 160 -30 -17Jonagold 162 116 147 112 86 130 91
133 152 115 -37 -26Jonagored 118 93 100 120 73 123 78
15 18 26 -5 1Pinova 29 22 30 37 34 39 37
21 -31 -5Red Jonaprince 29 28 32 48 33 68 47
14 14 18 -7 11Shampion 14 10 11 14 9 15 14
-6 13Other new varieties 15 18 23 25 32 30
135 153 164 -18 -6Other 165 117 100 129 122 155 127
Total 948 1,070 1,047 -21 -8
(1) Percentage difference between F2015 and 2014(2) Percentage difference between F2015 and the average of 2012 - 2013 - 2014(3) Other new varieties: Ariane, Belgica, Cameo, Diwa, Greenstar, Honey Crunch, Jazz, Junami, Kanzi, Mariac, Rubens, Tentation, Wellant,...
0200400600800
10001200
2005
2006
2007
2008
2009
2010
2011
2012
2013
2014
F20
15
- Apple production
Germany
Germany
1,071 835 953 972 804 1,116 885
34
EU 28
Apple production by country, by variety
Variety (1) (2)
x 1000 tons
F2015
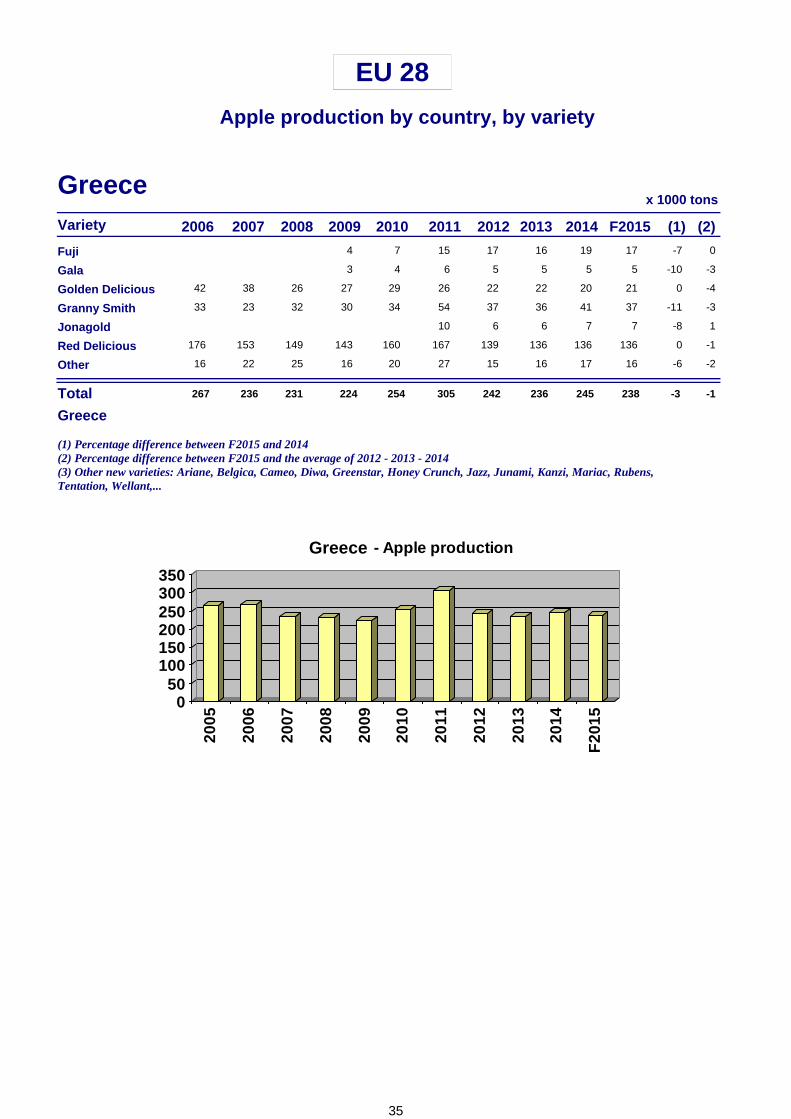
Greece2006 2007 2008 2009 2010 2011 2012 2013 2014
-7 0Fuji 4 7 15 17 16 19 17
-10 -3Gala 3 4 6 5 5 5 5
42 38 26 0 -4Golden Delicious 27 29 26 22 22 20 21
33 23 32 -11 -3Granny Smith 30 34 54 37 36 41 37
-8 1Jonagold 10 6 6 7 7
176 153 149 0 -1Red Delicious 143 160 167 139 136 136 136
16 22 25 -6 -2Other 16 20 27 15 16 17 16
Total 267 236 231 -3 -1
(1) Percentage difference between F2015 and 2014(2) Percentage difference between F2015 and the average of 2012 - 2013 - 2014(3) Other new varieties: Ariane, Belgica, Cameo, Diwa, Greenstar, Honey Crunch, Jazz, Junami, Kanzi, Mariac, Rubens, Tentation, Wellant,...
050
100150200250300350
2005
2006
2007
2008
2009
2010
2011
2012
2013
2014
F20
15
- Apple production
Greece
Greece
224 254 305 242 236 245 238
35
EU 28
Apple production by country, by variety
Variety (1) (2)
x 1000 tons
F2015
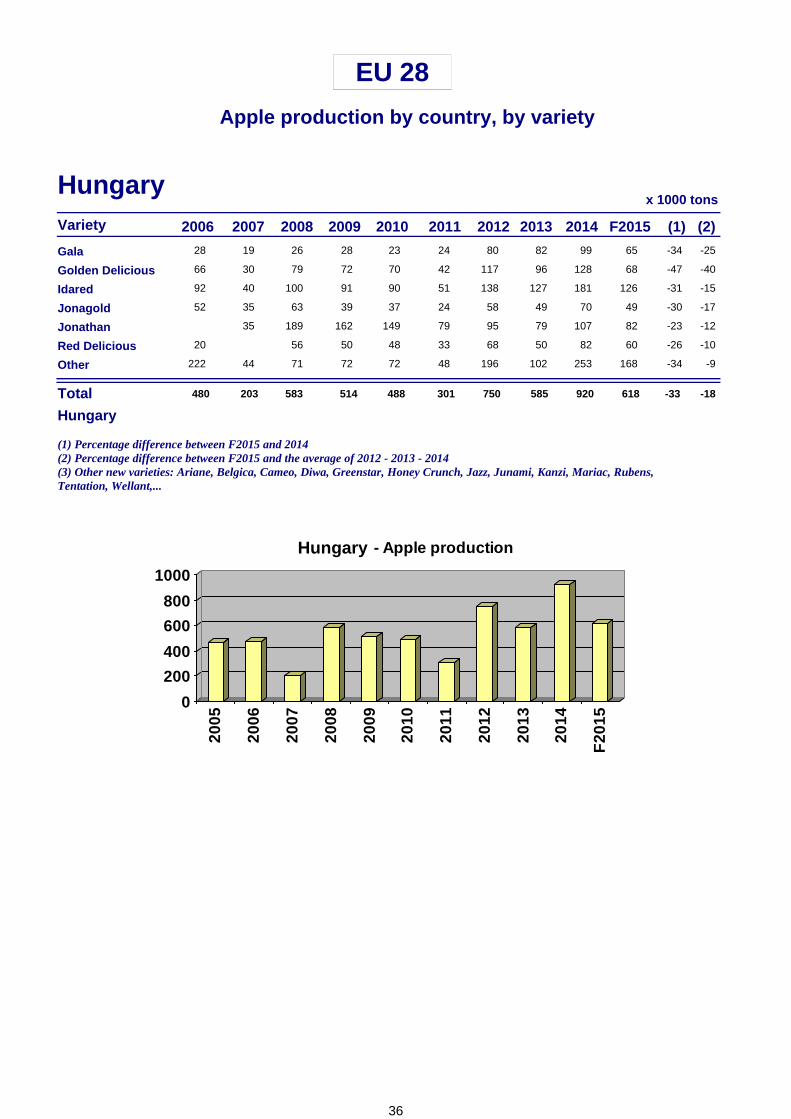
Hungary2006 2007 2008 2009 2010 2011 2012 2013 2014
28 19 26 -34 -25Gala 28 23 24 80 82 99 65
66 30 79 -47 -40Golden Delicious 72 70 42 117 96 128 68
92 40 100 -31 -15Idared 91 90 51 138 127 181 126
52 35 63 -30 -17Jonagold 39 37 24 58 49 70 49
35 189 -23 -12Jonathan 162 149 79 95 79 107 82
20 56 -26 -10Red Delicious 50 48 33 68 50 82 60
222 44 71 -34 -9Other 72 72 48 196 102 253 168
Total 480 203 583 -33 -18
(1) Percentage difference between F2015 and 2014(2) Percentage difference between F2015 and the average of 2012 - 2013 - 2014(3) Other new varieties: Ariane, Belgica, Cameo, Diwa, Greenstar, Honey Crunch, Jazz, Junami, Kanzi, Mariac, Rubens, Tentation, Wellant,...
0
200
400
600
800
1000
2005
2006
2007
2008
2009
2010
2011
2012
2013
2014
F20
15
- Apple production
Hungary
Hungary
514 488 301 750 585 920 618
36

EU 28
Apple production by country, by variety
Variety (1) (2)
x 1000 tons
F2015
Italy2006 2007 2008 2009 2010 2011 2012 2013 2014
56 51 45 -13 -5Annurca 35 34 35 35 35 40 35
78 93 87 -10 -3Braeburn 97 97 102 78 84 91 82
-17 8Cripps Pink 80 70 92 65 72 104 86
2 2 1 -68Elstar 1 1 1 1 0 0
91 136 142 -5 12Fuji 154 163 164 129 181 200 189
262 283 299 -2 8Gala 324 302 318 274 291 328 321
1 1 1 -33Gloster 0 0 0 0 0
879 1,010 981 -5 3Golden Delicious 979 947 1,021 909 938 1,036 986
94 99 99 -5 25Granny Smith 115 113 122 94 128 174 165
6 5 5 3 -42Idared 4 4 2 2 3 1 1
30 30 24 -3 -21Jonagold 24 14 17 11 14 9 9
0 1 0 -85Jonathan 0 0 0 0 0
119 88 91 -5 15Morgendurf/imperat 67 81 61 53 57 74 71
253 249 243 -8 7Red Delicious 269 245 253 191 232 268 247
17 28 23 -11 6Reinette Grise du C 25 27 27 22 30 34 30
21 19 18 -14 -18Stayman 16 18 17 12 18 14 12
82 104 106 10 48Other 47 62 60 63 39 83 92
Total 1,991 2,196 2,164 -5 7
(1) Percentage difference between F2015 and 2014(2) Percentage difference between F2015 and the average of 2012 - 2013 - 2014(3) Other new varieties: Ariane, Belgica, Cameo, Diwa, Greenstar, Honey Crunch, Jazz, Junami, Kanzi, Mariac, Rubens, Tentation, Wellant,...
0
500
1000
1500
2000
2500
2005
2006
2007
2008
2009
2010
2011
2012
2013
2014
F20
15
- Apple production
Italy
Italy
2,237 2,179 2,293 1,939 2,122 2,456 2,328
37

EU 28
Apple production by country, by variety
Variety (1) (2)
x 1000 tons
F2015
Latvia2006 2007 2008 2009 2010 2011 2012 2013 2014
32 31 34 -6 -20Other 13 12 8 9 15 10 9
Total 32 31 34 -6 -20
(1) Percentage difference between F2015 and 2014(2) Percentage difference between F2015 and the average of 2012 - 2013 - 2014(3) Other new varieties: Ariane, Belgica, Cameo, Diwa, Greenstar, Honey Crunch, Jazz, Junami, Kanzi, Mariac, Rubens, Tentation, Wellant,...
0
10
20
30
40
2005
2006
2007
2008
2009
2010
2011
2012
2013
2014
F20
15
- Apple production
Latvia
Latvia
13 12 8 9 15 10 9
38
EU 28
Apple production by country, by variety
Variety (1) (2)
x 1000 tons
F2015
Lithuania2006 2007 2008 2009 2010 2011 2012 2013 2014
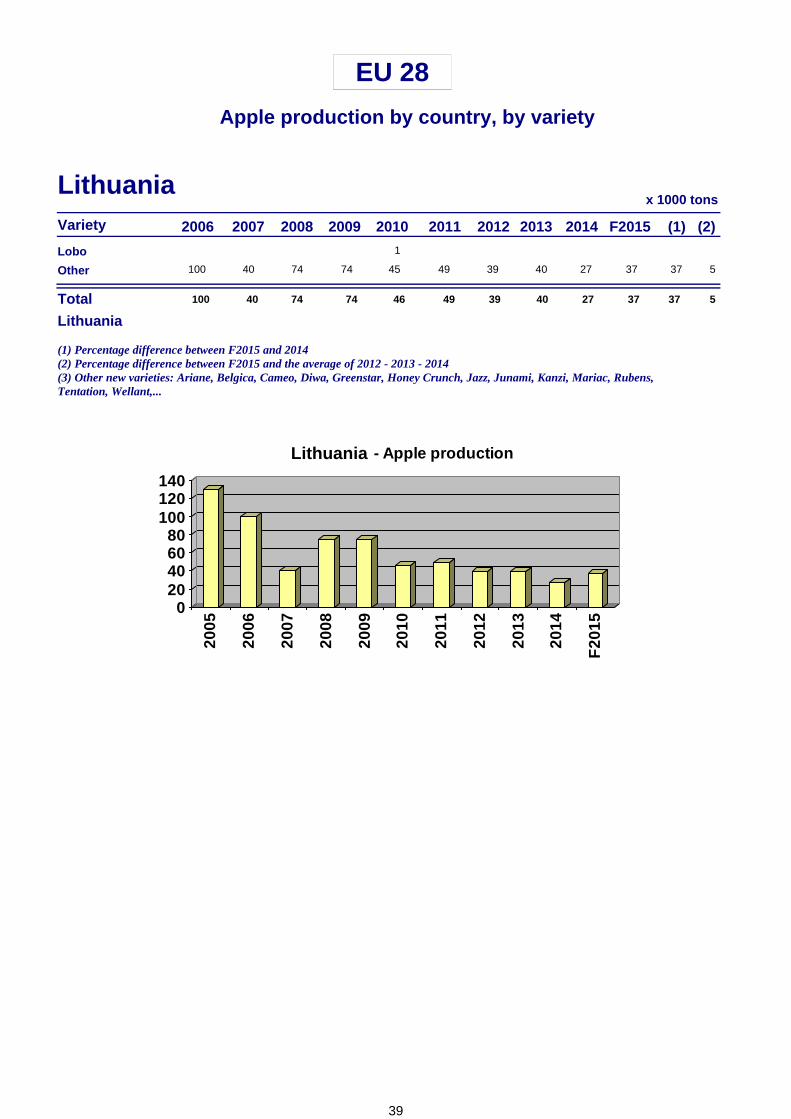
Lobo 1
100 40 74 37 5Other 74 45 49 39 40 27 37
Total 100 40 74 37 5
(1) Percentage difference between F2015 and 2014(2) Percentage difference between F2015 and the average of 2012 - 2013 - 2014(3) Other new varieties: Ariane, Belgica, Cameo, Diwa, Greenstar, Honey Crunch, Jazz, Junami, Kanzi, Mariac, Rubens, Tentation, Wellant,...
020406080
100120140
2005
2006
2007
2008
2009
2010
2011
2012
2013
2014
F20
15
- Apple production
Lithuania
Lithuania
74 46 49 39 40 27 37
39
EU 28
Apple production by country, by variety
Variety (1) (2)
x 1000 tons
F2015
Netherlands2006 2007 2008 2009 2010 2011 2012 2013 2014
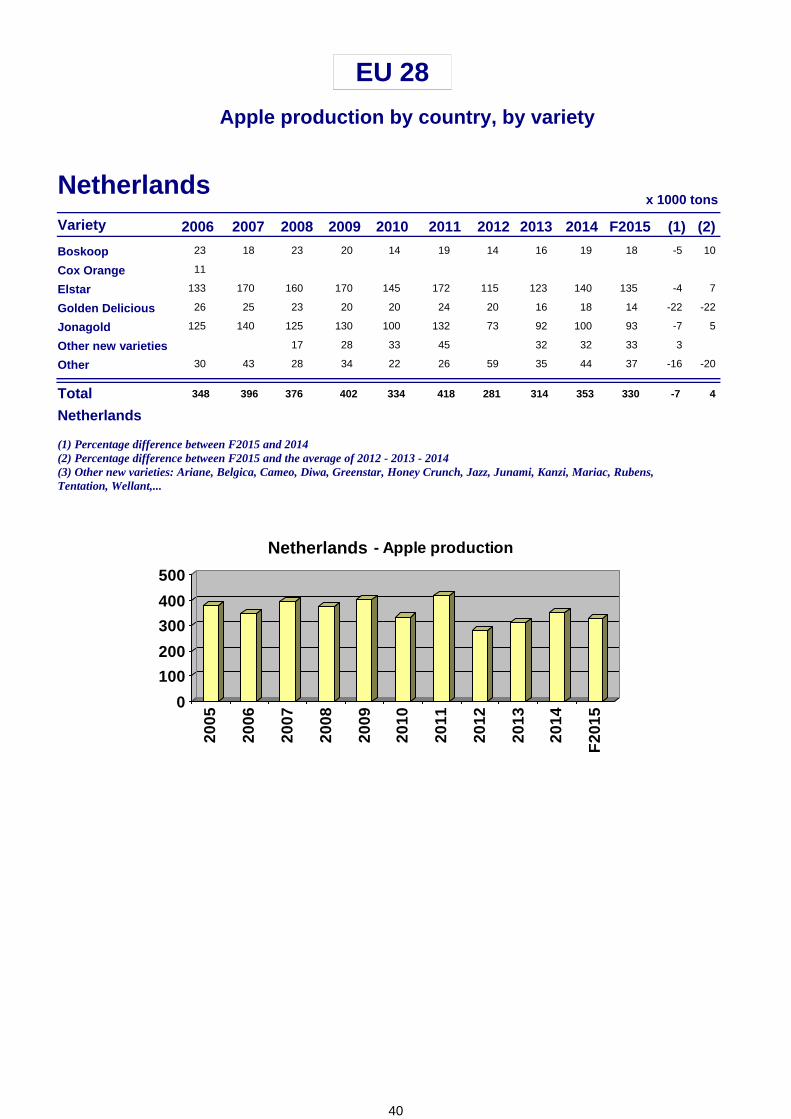
23 18 23 -5 10Boskoop 20 14 19 14 16 19 18
11Cox Orange133 170 160 -4 7Elstar 170 145 172 115 123 140 135
26 25 23 -22 -22Golden Delicious 20 20 24 20 16 18 14
125 140 125 -7 5Jonagold 130 100 132 73 92 100 93
17 3Other new varieties 28 33 45 32 32 33
30 43 28 -16 -20Other 34 22 26 59 35 44 37
Total 348 396 376 -7 4
(1) Percentage difference between F2015 and 2014(2) Percentage difference between F2015 and the average of 2012 - 2013 - 2014(3) Other new varieties: Ariane, Belgica, Cameo, Diwa, Greenstar, Honey Crunch, Jazz, Junami, Kanzi, Mariac, Rubens, Tentation, Wellant,...
0
100
200
300
400
500
2005
2006
2007
2008
2009
2010
2011
2012
2013
2014
F20
15
- Apple production
Netherlands
Netherlands
402 334 418 281 314 353 330
40

EU 28
Apple production by country, by variety
Variety (1) (2)
x 1000 tons
F2015
Poland2006 2007 2008 2009 2010 2011 2012 2013 2014
155 75 136 0 -17Cortland 80 50 70 40 25 25 25
62 40 95 0 -6Elstar 60 25 50 30 25 25 25
225 100 162 0 12Gala 150 130 210 250 270 310 310
80 45 122 -11 -8Gloster 80 85 120 160 180 180 160
270 130 271 0 8Golden Delicious 290 160 270 300 320 350 350
370 100 543 -5 7Idared 530 330 420 620 700 790 750
40 20 190 10 32Jonagold 120 60 110 70 80 100 110
4 29Jonagored 180 200 270 280
35 15 67Jonathan 50 40 50
210 100 203 0 -18Lobo 100 60 100 50 30 30 30
33Pinova 20 30 40
35 20 136Red Delicious 80 40 40 10
33Red Jonaprince 20 30 40
283 150 366 0 8Shampion 300 240 310 400 440 470 470
0 9Other new varieties 250 260 290 290
485 305 909 1 29Other 760 630 750 550 600 850 860
Total 2,250 1,100 3,200 0 15
(1) Percentage difference between F2015 and 2014(2) Percentage difference between F2015 and the average of 2012 - 2013 - 2014(3) Other new varieties: Ariane, Belgica, Cameo, Diwa, Greenstar, Honey Crunch, Jazz, Junami, Kanzi, Mariac, Rubens, Tentation, Wellant,...
0
1000
2000
3000
4000
2005
2006
2007
2008
2009
2010
2011
2012
2013
2014
F20
15
- Apple production
Poland
Poland
2,600 1,850 2,500 2,900 3,170 3,750 3,750
41
EU 28
Apple production by country, by variety
Variety (1) (2)
x 1000 tons
F2015
Portugal2006 2007 2008 2009 2010 2011 2012 2013 2014
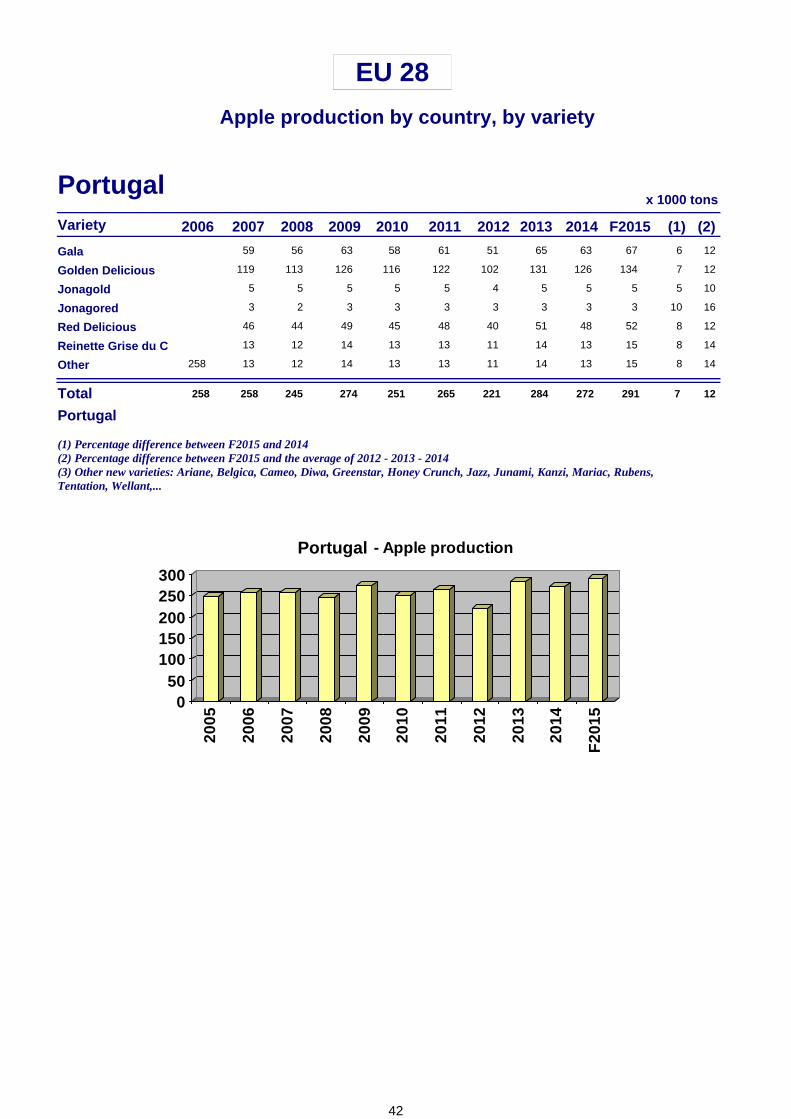
59 56 6 12Gala 63 58 61 51 65 63 67
119 113 7 12Golden Delicious 126 116 122 102 131 126 134
5 5 5 10Jonagold 5 5 5 4 5 5 5
3 2 10 16Jonagored 3 3 3 3 3 3 3
46 44 8 12Red Delicious 49 45 48 40 51 48 52
13 12 8 14Reinette Grise du C 14 13 13 11 14 13 15
258 13 12 8 14Other 14 13 13 11 14 13 15
Total 258 258 245 7 12
(1) Percentage difference between F2015 and 2014(2) Percentage difference between F2015 and the average of 2012 - 2013 - 2014(3) Other new varieties: Ariane, Belgica, Cameo, Diwa, Greenstar, Honey Crunch, Jazz, Junami, Kanzi, Mariac, Rubens, Tentation, Wellant,...
050
100150200250300
2005
2006
2007
2008
2009
2010
2011
2012
2013
2014
F20
15
- Apple production
Portugal
Portugal
274 251 265 221 284 272 291
42

EU 28
Apple production by country, by variety
Variety (1) (2)
x 1000 tons
F2015
Romania2006 2007 2008 2009 2010 2011 2012 2013 2014
1 1 -1Gala 1 1 1
77 76 -16 -22Golden Delicious 60 68 79 94 77 77 65
Granny Smith 3 3 1
71 69 0 -6Idared 26 28 49 84 71 71 71
2 2 -27 21Jonagold 13 14 1 2 2 4 3
1 0 -15Jonagored 1 1 1
98 96 -8 -19Jonathan 92 92 112 106 98 85 78
29 26 -10 34Red Delicious 19 17 14 24 30 53 48
0 0 -57 -74Reinette Grise du C 1 0 1 1 0 0 0
Shampion 0 0 0 0
Other new varieties 2
417 85 60 -8 3Other 166 201 155 40 108 88 81
Total 417 362 329 -8 -6
(1) Percentage difference between F2015 and 2014(2) Percentage difference between F2015 and the average of 2012 - 2013 - 2014(3) Other new varieties: Ariane, Belgica, Cameo, Diwa, Greenstar, Honey Crunch, Jazz, Junami, Kanzi, Mariac, Rubens, Tentation, Wellant,...
0
100
200
300
400
500
2005
2006
2007
2008
2009
2010
2011
2012
2013
2014
F20
15
- Apple production
Romania
Romania
379 423 412 351 387 382 351
43
EU 28
Apple production by country, by variety
Variety (1) (2)
x 1000 tons
F2015
Slovakia2006 2007 2008 2009 2010 2011 2012 2013 2014
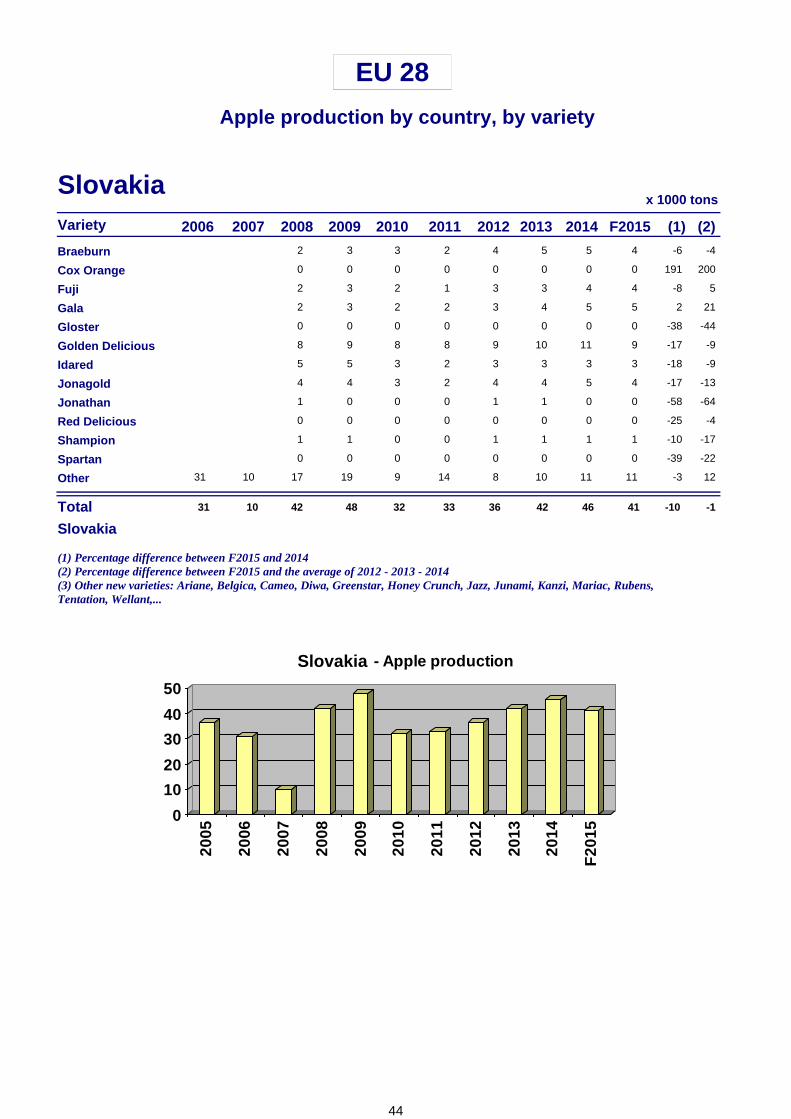
2 -6 -4Braeburn 3 3 2 4 5 5 4
0 191 200Cox Orange 0 0 0 0 0 0 0
2 -8 5Fuji 3 2 1 3 3 4 4
2 2 21Gala 3 2 2 3 4 5 5
0 -38 -44Gloster 0 0 0 0 0 0 0
8 -17 -9Golden Delicious 9 8 8 9 10 11 9
5 -18 -9Idared 5 3 2 3 3 3 3
4 -17 -13Jonagold 4 3 2 4 4 5 4
1 -58 -64Jonathan 0 0 0 1 1 0 0
0 -25 -4Red Delicious 0 0 0 0 0 0 0
1 -10 -17Shampion 1 0 0 1 1 1 1
0 -39 -22Spartan 0 0 0 0 0 0 0
31 10 17 -3 12Other 19 9 14 8 10 11 11
Total 31 10 42 -10 -1
(1) Percentage difference between F2015 and 2014(2) Percentage difference between F2015 and the average of 2012 - 2013 - 2014(3) Other new varieties: Ariane, Belgica, Cameo, Diwa, Greenstar, Honey Crunch, Jazz, Junami, Kanzi, Mariac, Rubens, Tentation, Wellant,...
0
10
20
30
40
50
2005
2006
2007
2008
2009
2010
2011
2012
2013
2014
F20
15
- Apple production
Slovakia
Slovakia
48 32 33 36 42 46 41
44
EU 28
Apple production by country, by variety
Variety (1) (2)
x 1000 tons
F2015
Slovenia2006 2007 2008 2009 2010 2011 2012 2013 2014
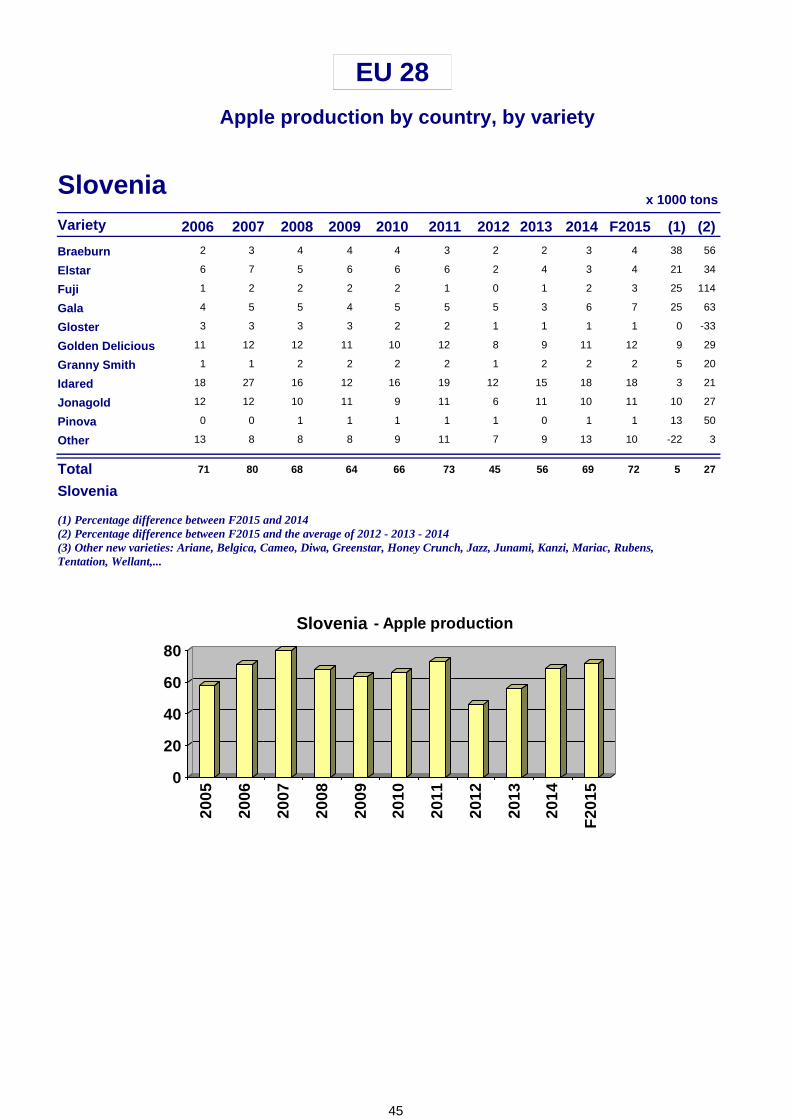
2 3 4 38 56Braeburn 4 4 3 2 2 3 4
6 7 5 21 34Elstar 6 6 6 2 4 3 4
1 2 2 25 114Fuji 2 2 1 0 1 2 3
4 5 5 25 63Gala 4 5 5 5 3 6 7
3 3 3 0 -33Gloster 3 2 2 1 1 1 1
11 12 12 9 29Golden Delicious 11 10 12 8 9 11 12
1 1 2 5 20Granny Smith 2 2 2 1 2 2 2
18 27 16 3 21Idared 12 16 19 12 15 18 18
12 12 10 10 27Jonagold 11 9 11 6 11 10 11
0 0 1 13 50Pinova 1 1 1 1 0 1 1
13 8 8 -22 3Other 8 9 11 7 9 13 10
Total 71 80 68 5 27
(1) Percentage difference between F2015 and 2014(2) Percentage difference between F2015 and the average of 2012 - 2013 - 2014(3) Other new varieties: Ariane, Belgica, Cameo, Diwa, Greenstar, Honey Crunch, Jazz, Junami, Kanzi, Mariac, Rubens, Tentation, Wellant,...
0
20
40
60
80
2005
2006
2007
2008
2009
2010
2011
2012
2013
2014
F20
15
- Apple production
Slovenia
Slovenia
64 66 73 45 56 69 72
45
EU 28
Apple production by country, by variety
Variety (1) (2)
x 1000 tons
F2015
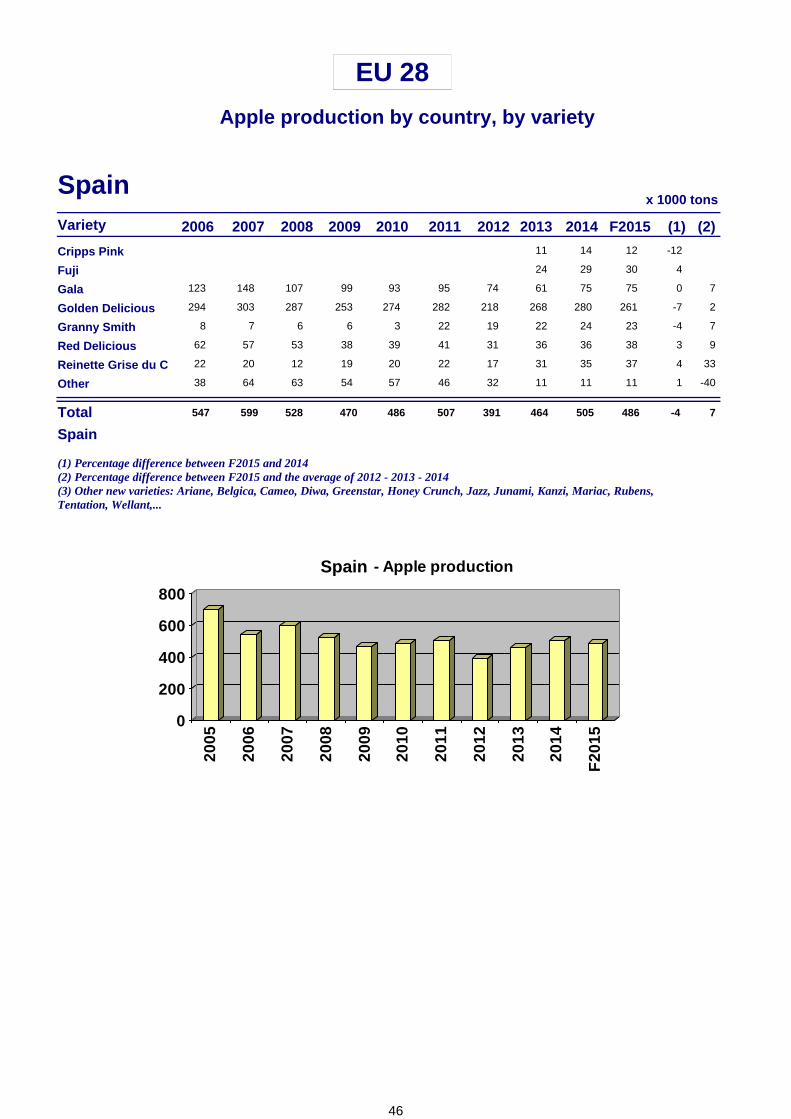
Spain2006 2007 2008 2009 2010 2011 2012 2013 2014
-12Cripps Pink 11 14 12
4Fuji 24 29 30
123 148 107 0 7Gala 99 93 95 74 61 75 75
294 303 287 -7 2Golden Delicious 253 274 282 218 268 280 261
8 7 6 -4 7Granny Smith 6 3 22 19 22 24 23
62 57 53 3 9Red Delicious 38 39 41 31 36 36 38
22 20 12 4 33Reinette Grise du C 19 20 22 17 31 35 37
38 64 63 1 -40Other 54 57 46 32 11 11 11
Total 547 599 528 -4 7
(1) Percentage difference between F2015 and 2014(2) Percentage difference between F2015 and the average of 2012 - 2013 - 2014(3) Other new varieties: Ariane, Belgica, Cameo, Diwa, Greenstar, Honey Crunch, Jazz, Junami, Kanzi, Mariac, Rubens, Tentation, Wellant,...
0
200
400
600
800
2005
2006
2007
2008
2009
2010
2011
2012
2013
2014
F20
15
- Apple production
Spain
Spain
470 486 507 391 464 505 486
46

EU 28
Apple production by country, by variety
Variety (1) (2)
x 1000 tons
F2015
Sweden2006 2007 2008 2009 2010 2011 2012 2013 2014
Cox Orange 1 0
Gloster
Other new varieties 1 1
20 16 18 30 40Other 18 20 16 12 17 17 21
Total 20 16 18 30 34
(1) Percentage difference between F2015 and 2014(2) Percentage difference between F2015 and the average of 2012 - 2013 - 2014(3) Other new varieties: Ariane, Belgica, Cameo, Diwa, Greenstar, Honey Crunch, Jazz, Junami, Kanzi, Mariac, Rubens, Tentation, Wellant,...
0
5
10
15
20
25
2005
2006
2007
2008
2009
2010
2011
2012
2013
2014
F20
15
- Apple production
Sweden
Sweden
18 20 17 14 17 17 21
47
EU 28
Apple production by country, by variety
Variety (1) (2)
x 1000 tons
F2015
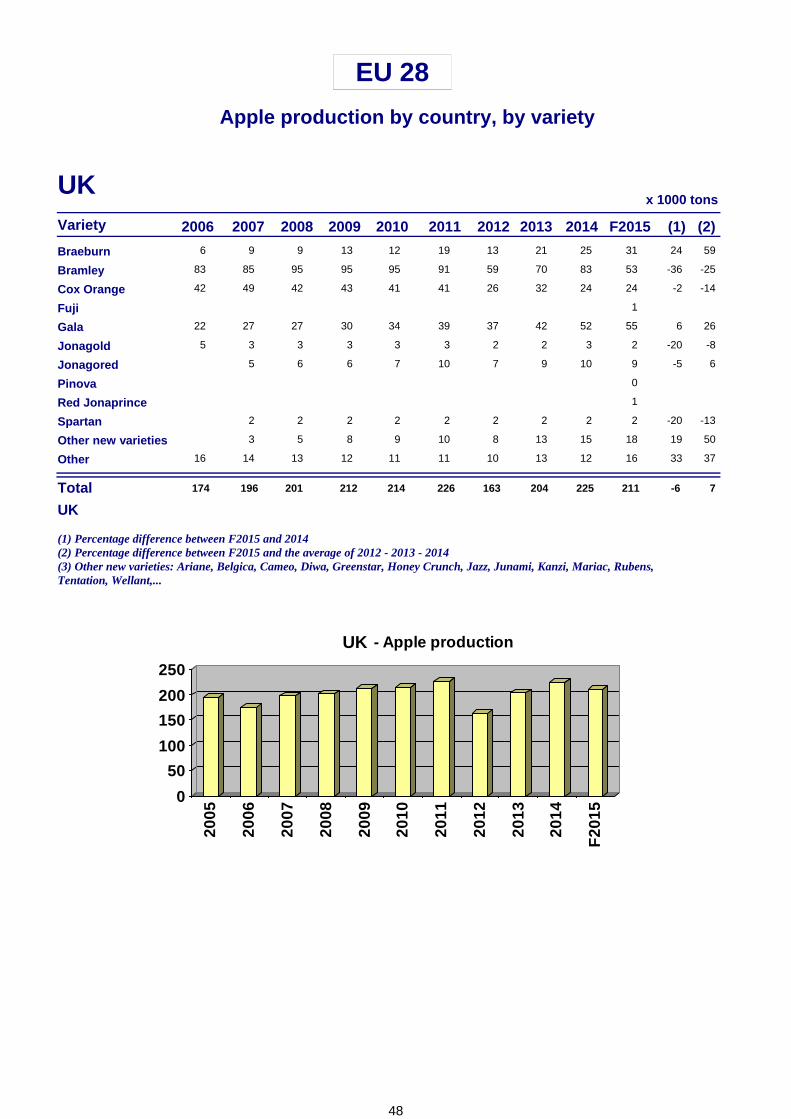
UK2006 2007 2008 2009 2010 2011 2012 2013 2014
6 9 9 24 59Braeburn 13 12 19 13 21 25 31
83 85 95 -36 -25Bramley 95 95 91 59 70 83 53
42 49 42 -2 -14Cox Orange 43 41 41 26 32 24 24
Fuji 1
22 27 27 6 26Gala 30 34 39 37 42 52 55
5 3 3 -20 -8Jonagold 3 3 3 2 2 3 2
5 6 -5 6Jonagored 6 7 10 7 9 10 9
Pinova 0
Red Jonaprince 1
2 2 -20 -13Spartan 2 2 2 2 2 2 2
3 5 19 50Other new varieties 8 9 10 8 13 15 18
16 14 13 33 37Other 12 11 11 10 13 12 16
Total 174 196 201 -6 7
(1) Percentage difference between F2015 and 2014(2) Percentage difference between F2015 and the average of 2012 - 2013 - 2014(3) Other new varieties: Ariane, Belgica, Cameo, Diwa, Greenstar, Honey Crunch, Jazz, Junami, Kanzi, Mariac, Rubens, Tentation, Wellant,...
0
50
100
150
200
250
2005
2006
2007
2008
2009
2010
2011
2012
2013
2014
F20
15
- Apple production
UK
UK
212 214 226 163 204 225 211
48

Extra EU apple production by country
49

50

Extra EUApple production by country
Country 2006 2007 2008 (1) (2)x 1000 tons
2009 2010 2011 2012 2013 2014 F2015400 300 240 -3 -2Belarus 250 150 180 171 145 160 155
58 61 52 12 5Bosnia-Herzego 72 72 75 50 85 61 69
429 423 322 -26 -17Canada 404 383 398 276 410 410 302
26,066 27,860 29,847 8 2China 31,681 33,263 35,985 38,500 37,500 35,000 37,625
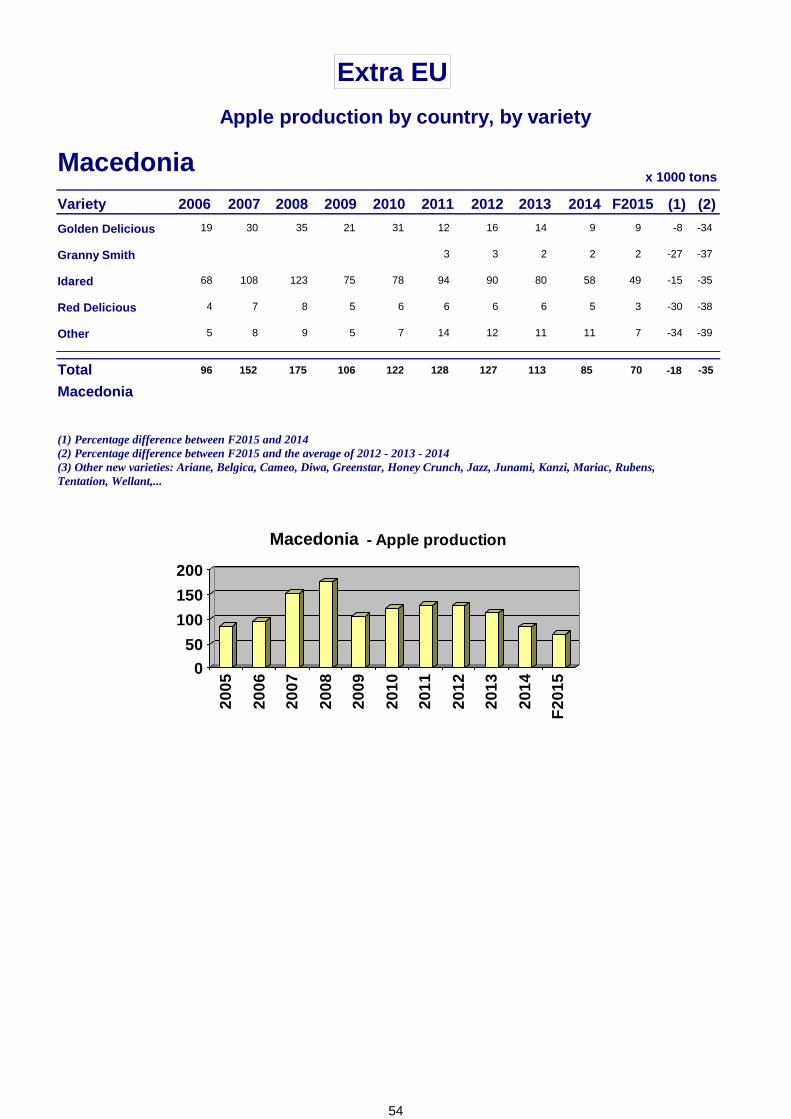
96 152 175 -18 -35Macedonia 106 122 128 127 113 85 70
602 505 512 3 -13Mexico 561 585 631 375 522 350 360
203 218 255 -40 -22Moldova 210 208 269 282 260 420 250
1,619 2,333 1,467 4 7Russia 1,775 1,233 1,500 1,622 1,647 1,707 1,775
240 245 236 10 27Serbia 282 240 266 179 332 317 350
99 155 136 -4 -2Switzerland 167 127 155 141 132 143 136
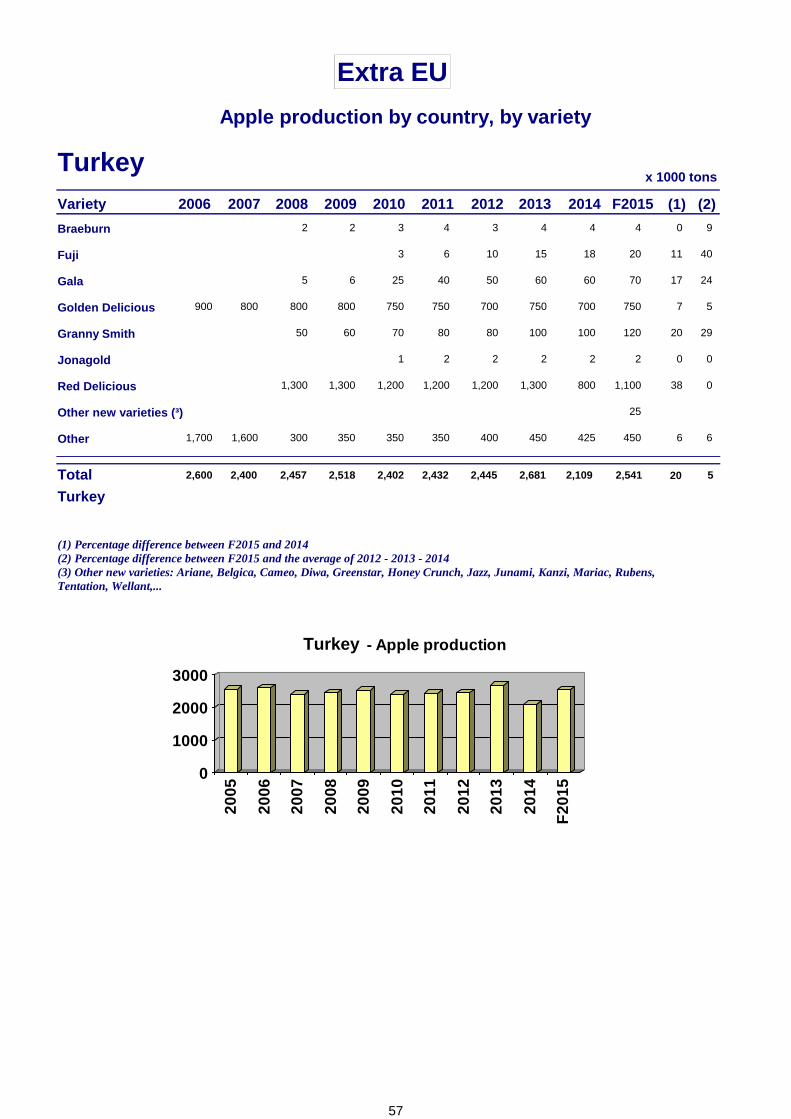
2,600 2,400 2,457 20 5Turkey 2,518 2,402 2,432 2,445 2,681 2,109 2,541
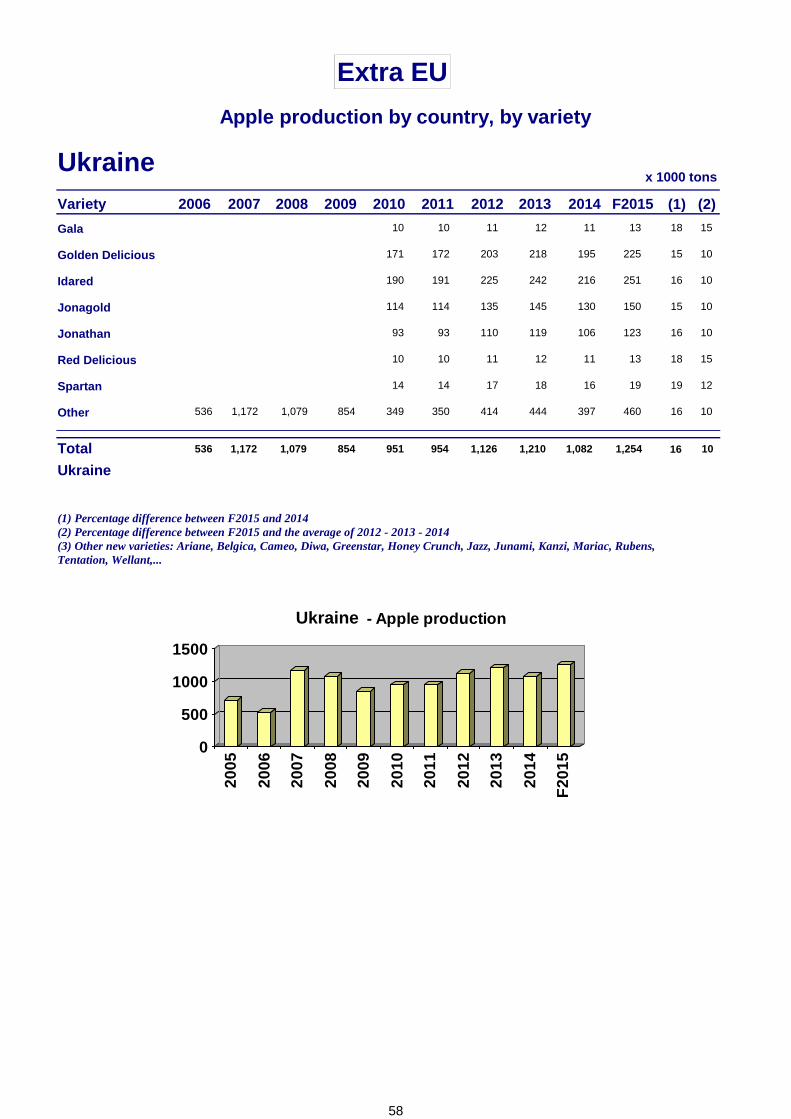
536 1,172 1,079 16 10Ukraine 854 951 954 1,126 1,210 1,082 1,254
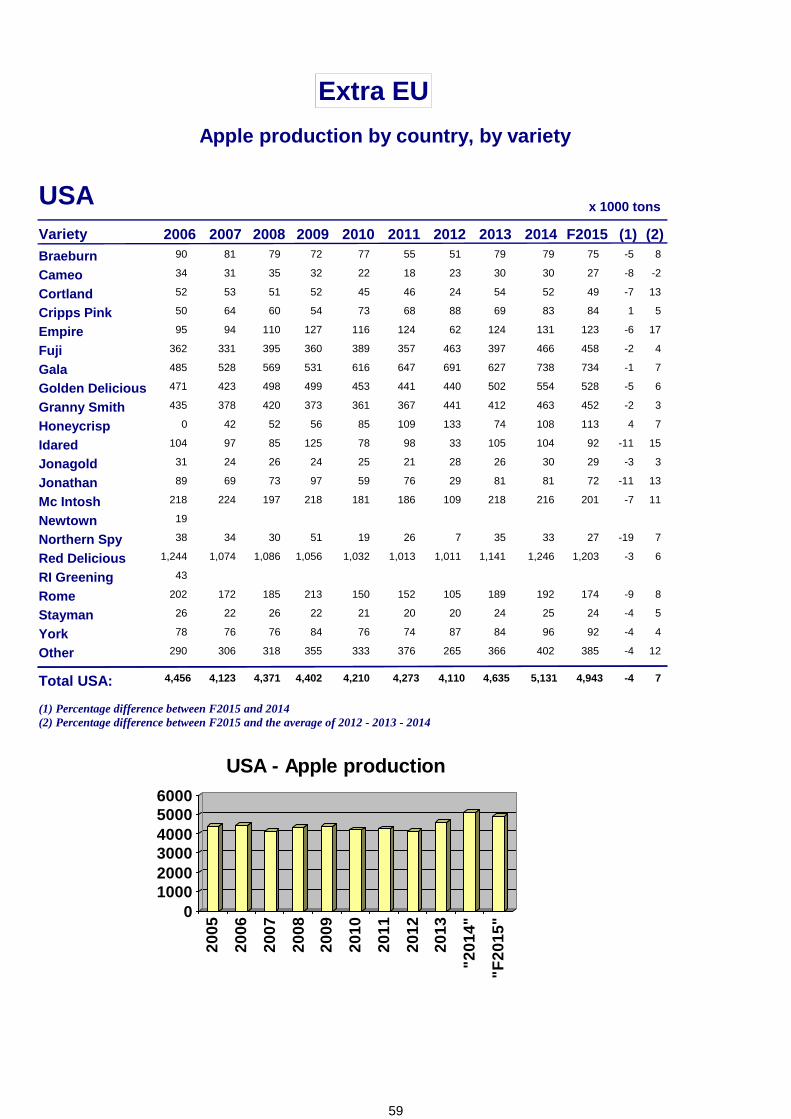
4,456 4,123 4,371 -4 7USA 4,402 4,210 4,273 4,110 4,635 5,131 4,943
(1) Percentage difference between F2015 and 2014(2) Percentage difference between F2015 and the average of 2012 - 2013 - 2014
51
Extra EU apple production by country, by variety
52
Extra EU
Apple production by country, by variety
2014
CanadaVariety (1) (2)
x 1000 tons
2006 2007 2008 2009 2010 2011 2012 2013 F2015
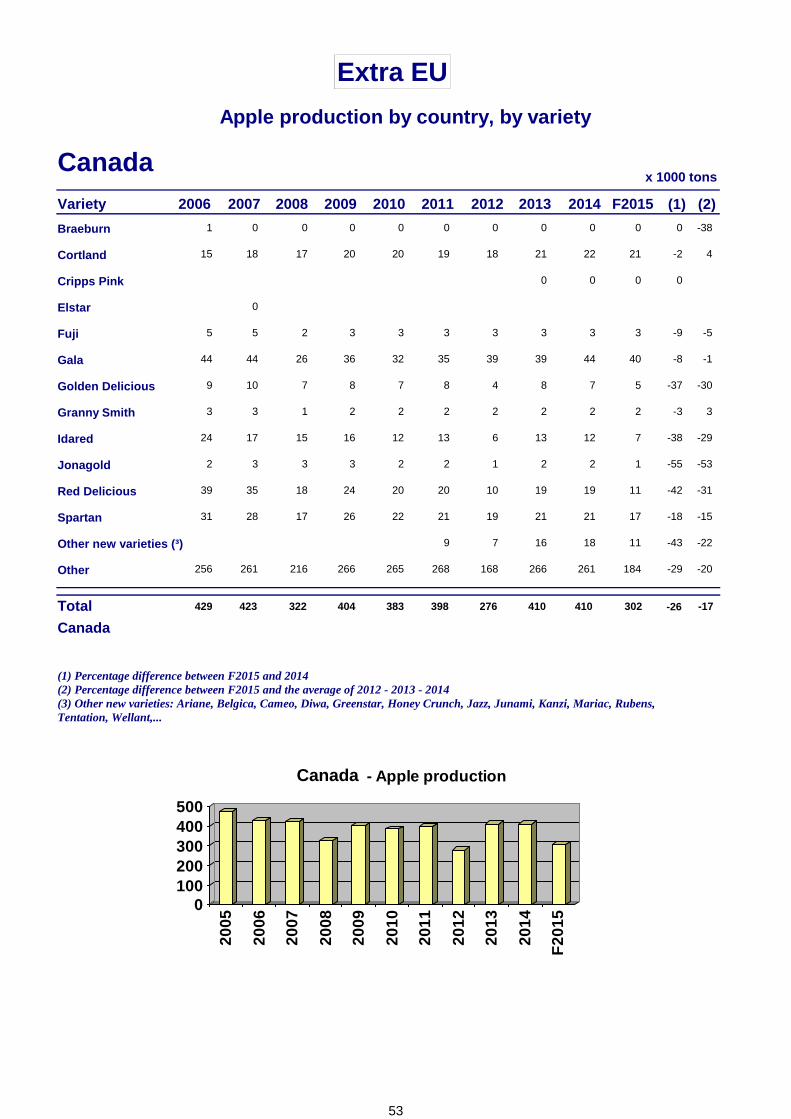
Braeburn 1 0 0 0 -380 0 0 0 0 0 0
Cortland 15 18 17 -2 420 20 19 18 21 22 21
Cripps Pink 00 0 0
Elstar 0
Fuji 5 5 2 -9 -53 3 3 3 3 3 3
Gala 44 44 26 -8 -136 32 35 39 39 44 40
Golden Delicious 9 10 7 -37 -308 7 8 4 8 7 5
Granny Smith 3 3 1 -3 32 2 2 2 2 2 2
Idared 24 17 15 -38 -2916 12 13 6 13 12 7
Jonagold 2 3 3 -55 -533 2 2 1 2 2 1
Red Delicious 39 35 18 -42 -3124 20 20 10 19 19 11
Spartan 31 28 17 -18 -1526 22 21 19 21 21 17
Other new varieties (³) -43 -229 7 16 18 11
Other 256 261 216 -29 -20266 265 268 168 266 261 184
429 423 322 -26 -17Total
(1) Percentage difference between F2015 and 2014(2) Percentage difference between F2015 and the average of 2012 - 2013 - 2014(3) Other new varieties: Ariane, Belgica, Cameo, Diwa, Greenstar, Honey Crunch, Jazz, Junami, Kanzi, Mariac, Rubens, Tentation, Wellant,...
0100200300400500
2005
2006
2007
2008
2009
2010
2011
2012
2013
2014
F20
15
- Apple production
Canada
Canada
404 383 398 276 410 410 302
53
Extra EU
Apple production by country, by variety
2014
MacedoniaVariety (1) (2)
x 1000 tons
2006 2007 2008 2009 2010 2011 2012 2013 F2015
Golden Delicious 19 30 35 -8 -3421 31 12 16 14 9 9
Granny Smith -27 -373 3 2 2 2
Idared 68 108 123 -15 -3575 78 94 90 80 58 49
Red Delicious 4 7 8 -30 -385 6 6 6 6 5 3
Other 5 8 9 -34 -395 7 14 12 11 11 7
96 152 175 -18 -35Total
(1) Percentage difference between F2015 and 2014(2) Percentage difference between F2015 and the average of 2012 - 2013 - 2014(3) Other new varieties: Ariane, Belgica, Cameo, Diwa, Greenstar, Honey Crunch, Jazz, Junami, Kanzi, Mariac, Rubens, Tentation, Wellant,...
0
50
100
150
200
2005
2006
2007
2008
2009
2010
2011
2012
2013
2014
F20
15- Apple production
Macedonia
Macedonia
106 122 128 127 113 85 70
54

Extra EU
Apple production by country, by variety
2014
SerbiaVariety (1) (2)
x 1000 tons
2006 2007 2008 2009 2010 2011 2012 2013 F2015
Golden Delicious 88
Granny Smith 53
Idared 175
Jonagold
Red Delicious
Other 240 245 236 -89 -87282 240 266 179 332 317 35
240 245 236 10 27Total
(1) Percentage difference between F2015 and 2014(2) Percentage difference between F2015 and the average of 2012 - 2013 - 2014(3) Other new varieties: Ariane, Belgica, Cameo, Diwa, Greenstar, Honey Crunch, Jazz, Junami, Kanzi, Mariac, Rubens, Tentation, Wellant,...
0
100
200
300
400
2005
2006
2007
2008
2009
2010
2011
2012
2013
2014
F20
15- Apple production
Serbia
Serbia
282 240 266 179 332 317 350
55

Extra EU
Apple production by country, by variety
2014
SwitzerlandVariety (1) (2)
x 1000 tons
2006 2007 2008 2009 2010 2011 2012 2013 F2015
Boskoop 5 6 5 -4 -75 3 5 5 4 4 4
Braeburn 6 8 8 -6 511 10 12 12 13 15 14
Cox Orange 2 2 2 5 -133 2 3 3 2 2 2
Elstar 4 4 2 -9 14 2 3 2 2 2 2
Gala 23 31 27 -5 -240 28 37 33 31 33 32
Golden Delicious 39 44 34 -12 -1238 29 30 26 24 26 22
Idared 9 8 9 5 -117 7 6 5 5 4 4
Jonagold 12 11 10 11 812 8 11 10 7 8 9
Pinova 2 2 2
Other new varieties (³) -38 8 8
Other 43 37 -3 -447 37 47 46 36 40 39
99 155 136 -4 -2Total
(1) Percentage difference between F2015 and 2014(2) Percentage difference between F2015 and the average of 2012 - 2013 - 2014(3) Other new varieties: Ariane, Belgica, Cameo, Diwa, Greenstar, Honey Crunch, Jazz, Junami, Kanzi, Mariac, Rubens, Tentation, Wellant,...
0
50
100
150
200
2005
2006
2007
2008
2009
2010
2011
2012
2013
2014
F20
15
- Apple production
Switzerland
Switzerland
167 127 155 141 132 143 136
56
Extra EU
Apple production by country, by variety
2014
TurkeyVariety (1) (2)
x 1000 tons
2006 2007 2008 2009 2010 2011 2012 2013 F2015
Braeburn 2 0 92 3 4 3 4 4 4
Fuji 11 403 6 10 15 18 20
Gala 5 17 246 25 40 50 60 60 70
Golden Delicious 900 800 800 7 5800 750 750 700 750 700 750
Granny Smith 50 20 2960 70 80 80 100 100 120
Jonagold 0 01 2 2 2 2 2
Red Delicious 1,300 38 01,300 1,200 1,200 1,200 1,300 800 1,100
Other new varieties (³) 25
Other 1,700 1,600 300 6 6350 350 350 400 450 425 450
2,600 2,400 2,457 20 5Total
(1) Percentage difference between F2015 and 2014(2) Percentage difference between F2015 and the average of 2012 - 2013 - 2014(3) Other new varieties: Ariane, Belgica, Cameo, Diwa, Greenstar, Honey Crunch, Jazz, Junami, Kanzi, Mariac, Rubens, Tentation, Wellant,...
0
1000
2000
3000
2005
2006
2007
2008
2009
2010
2011
2012
2013
2014
F20
15
- Apple production
Turkey
Turkey
2,518 2,402 2,432 2,445 2,681 2,109 2,541
57
Extra EU
Apple production by country, by variety
2014
UkraineVariety (1) (2)
x 1000 tons
2006 2007 2008 2009 2010 2011 2012 2013 F2015
Gala 18 1510 10 11 12 11 13
Golden Delicious 15 10171 172 203 218 195 225
Idared 16 10190 191 225 242 216 251
Jonagold 15 10114 114 135 145 130 150
Jonathan 16 1093 93 110 119 106 123
Red Delicious 18 1510 10 11 12 11 13
Spartan 19 1214 14 17 18 16 19
Other 536 1,172 1,079 16 10854 349 350 414 444 397 460
536 1,172 1,079 16 10Total
(1) Percentage difference between F2015 and 2014(2) Percentage difference between F2015 and the average of 2012 - 2013 - 2014(3) Other new varieties: Ariane, Belgica, Cameo, Diwa, Greenstar, Honey Crunch, Jazz, Junami, Kanzi, Mariac, Rubens, Tentation, Wellant,...
0
500
1000
1500
2005
2006
2007
2008
2009
2010
2011
2012
2013
2014
F20
15
- Apple production
Ukraine
Ukraine
854 951 954 1,126 1,210 1,082 1,254
58
Extra EU
Apple production by country, by variety
2014
USAVariety (1) (2)
x 1000 tons
2006 2007 2008 2009 2010 2011 2012 2013 F2015Braeburn 90 81 79 -5 872 77 55 51 79 79 75
Cameo 34 31 35 -8 -232 22 18 23 30 30 27
Cortland 52 53 51 -7 1352 45 46 24 54 52 49
Cripps Pink 50 64 60 1 554 73 68 88 69 83 84
Empire 95 94 110 -6 17127 116 124 62 124 131 123
Fuji 362 331 395 -2 4360 389 357 463 397 466 458
Gala 485 528 569 -1 7531 616 647 691 627 738 734
Golden Delicious 471 423 498 -5 6499 453 441 440 502 554 528
Granny Smith 435 378 420 -2 3373 361 367 441 412 463 452
Honeycrisp 0 42 52 4 756 85 109 133 74 108 113
Idared 104 97 85 -11 15125 78 98 33 105 104 92
Jonagold 31 24 26 -3 324 25 21 28 26 30 29
Jonathan 89 69 73 -11 1397 59 76 29 81 81 72
Mc Intosh 218 224 197 -7 11218 181 186 109 218 216 201
Newtown 19
Northern Spy 38 34 30 -19 751 19 26 7 35 33 27
Red Delicious 1,244 1,074 1,086 -3 61,056 1,032 1,013 1,011 1,141 1,246 1,203
RI Greening 43
Rome 202 172 185 -9 8213 150 152 105 189 192 174
Stayman 26 22 26 -4 522 21 20 20 24 25 24
York 78 76 76 -4 484 76 74 87 84 96 92
Other 290 306 318 -4 12355 333 376 265 366 402 385
4,456 4,123 4,371 -4 7Total USA: 4,402 4,210
(1) Percentage difference between F2015 and 2014(2) Percentage difference between F2015 and the average of 2012 - 2013 - 2014
0100020003000400050006000
2005
2006
2007
2008
2009
2010
2011
2012
2013
"201
4"
"F20
15"
USA - Apple production
4,273 4,110 4,635 5,131 4,943
59

60
EUROPEAN PEAR FORECAST 2015
EU 28 pear production by country
61
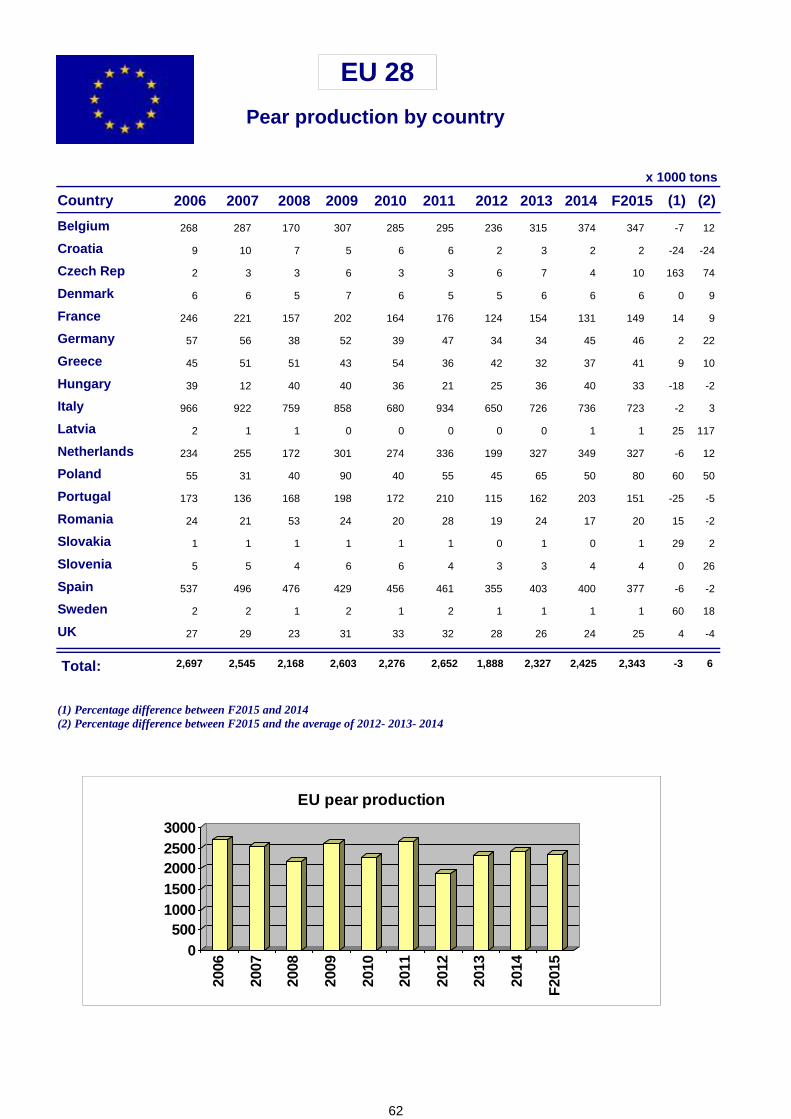
Pear production by country
EU 28
Country F20152006 2007 2008 (1) (2)
x 1000 tons
2009 2010 2011 2012 2013 2014
Belgium 347268 287 170 -7 12307 285 295 236 315 374
Croatia 29 10 7 -24 -245 6 6 2 3 2
Czech Rep 102 3 3 163 746 3 3 6 7 4
Denmark 66 6 5 0 97 6 5 5 6 6
France 149246 221 157 14 9202 164 176 124 154 131
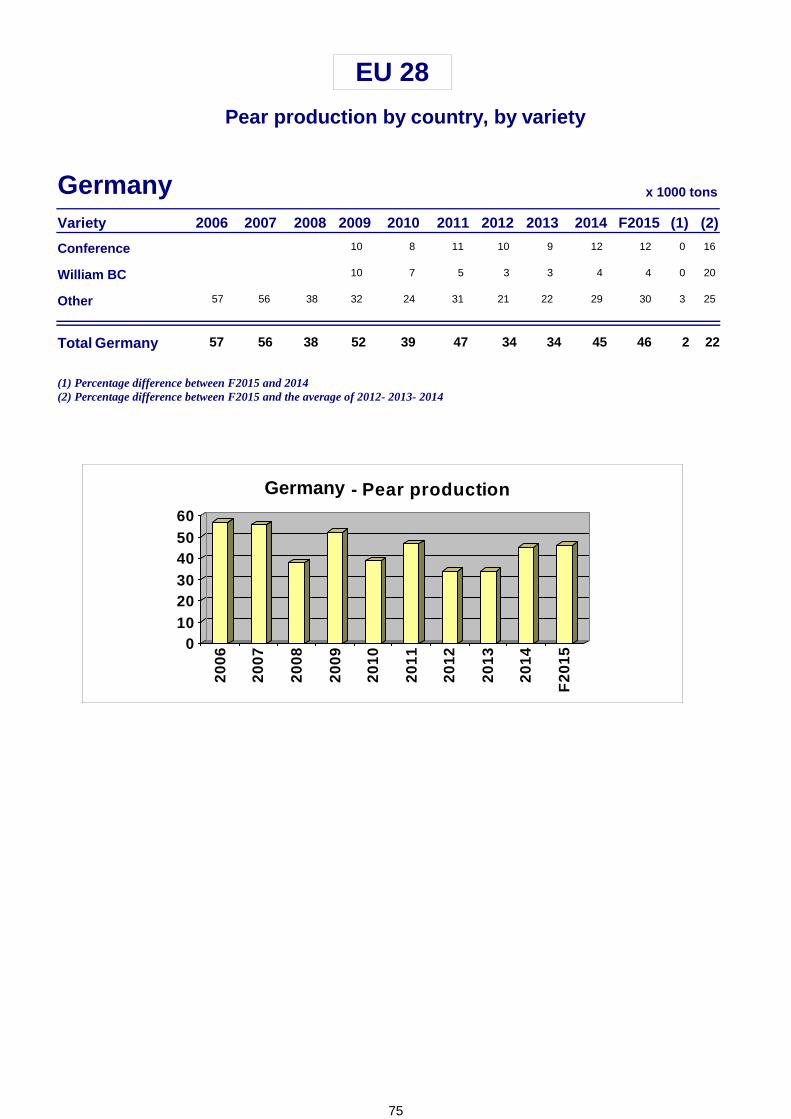
Germany 4657 56 38 2 2252 39 47 34 34 45
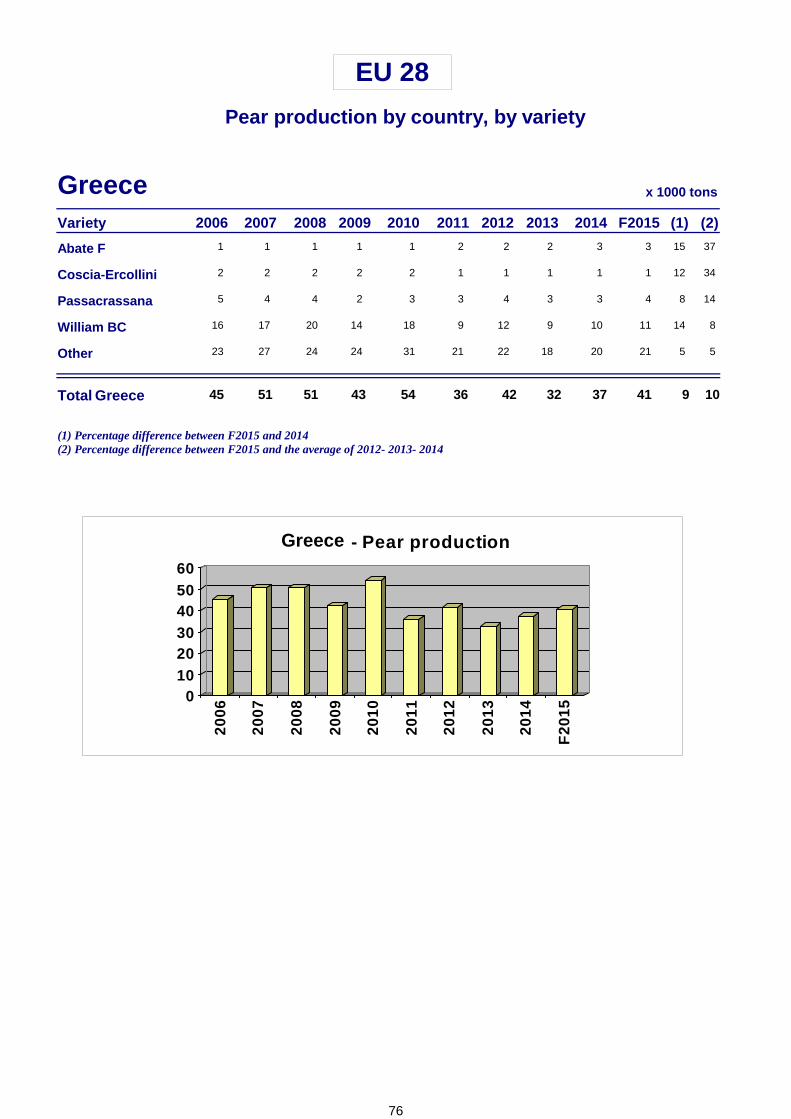
Greece 4145 51 51 9 1043 54 36 42 32 37
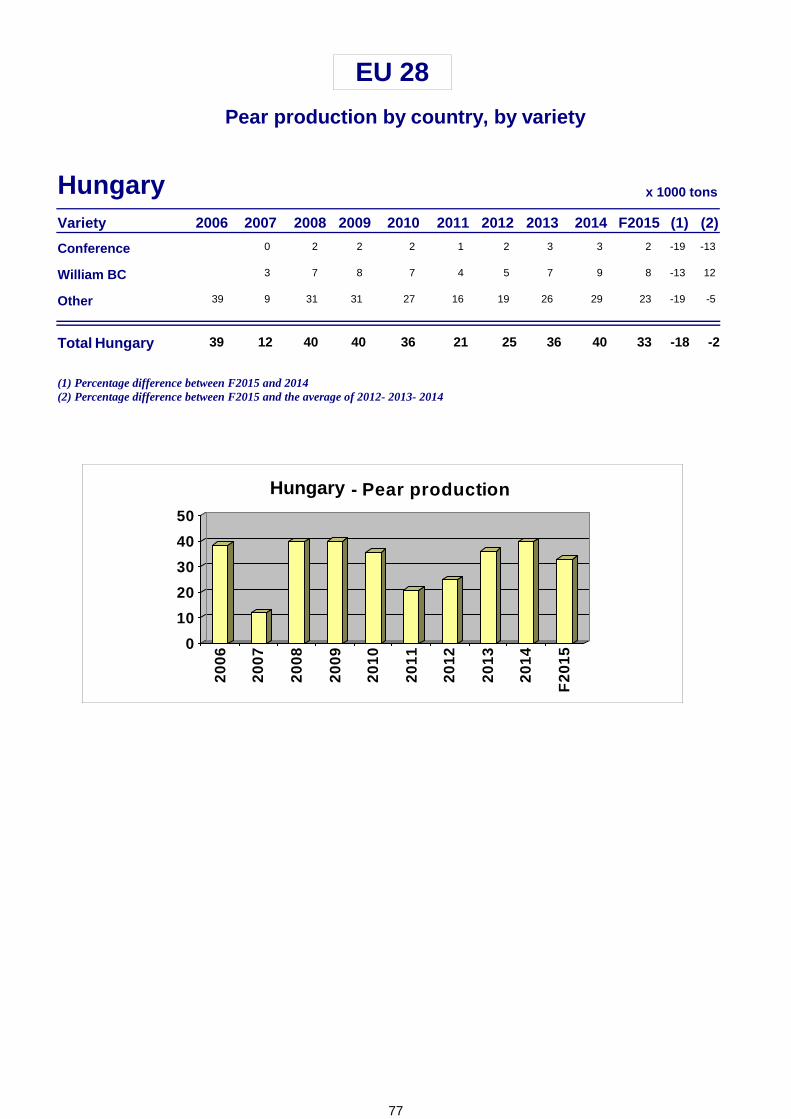
Hungary 3339 12 40 -18 -240 36 21 25 36 40
Italy 723966 922 759 -2 3858 680 934 650 726 736
Latvia 12 1 1 25 1170 0 0 0 0 1
Netherlands 327234 255 172 -6 12301 274 336 199 327 349
Poland 8055 31 40 60 5090 40 55 45 65 50
Portugal 151173 136 168 -25 -5198 172 210 115 162 203
Romania 2024 21 53 15 -224 20 28 19 24 17
Slovakia 11 1 1 29 21 1 1 0 1 0
Slovenia 45 5 4 0 266 6 4 3 3 4
Spain 377537 496 476 -6 -2429 456 461 355 403 400
Sweden 12 2 1 60 182 1 2 1 1 1
UK 2527 29 23 4 -431 33 32 28 26 24
Total: 2,3432,697 2,545 2,168 -3 6
(1) Percentage difference between F2015 and 2014(2) Percentage difference between F2015 and the average of 2012- 2013- 2014
0500
10001500200025003000
2006
2007
2008
2009
2010
2011
2012
2013
2014
F20
15
EU pear production
2,603 2,276 2,652 1,888 2,327 2,425
62

Pear production in other Member States (based on FAO and/ or EUROSTAT data)
x 1000 tons
Country 2006 2007 2008 2009 2010 2011 2012 2013 2014
Austria 64 95,5 43,1 86,3 45 89,3 58,2 54,1 50,7
Bulgaria 0,6 1 0,9 1,4 1,4 2 1,4 2,9 2,2
Cyprus 1,1 1,1 1,2 1,3 1,3 1,1 1,1 1,2 1,1
Luxembourg 0,3 0,3 0,3 0,3 0,3 0,2 0,2 0,2 0,3
OTHER EU
63

64

EU 28 pear production by variety
65
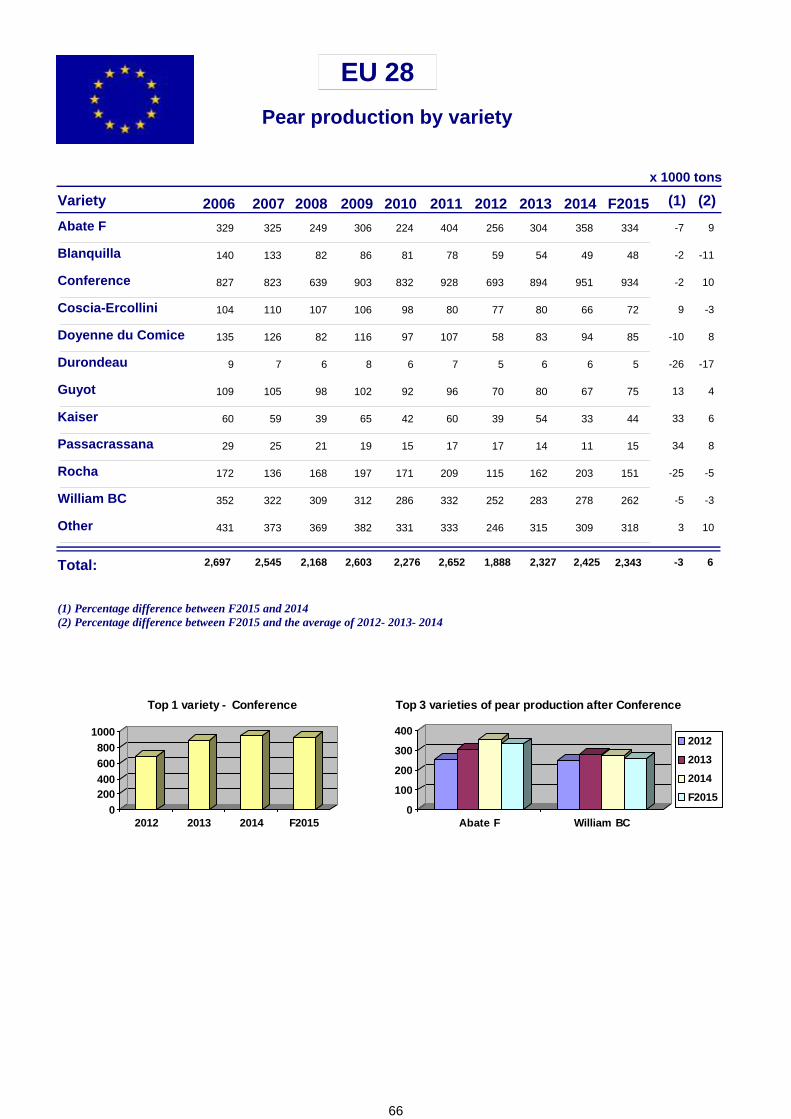
EU 28
Pear production by variety
Variety F20152006 2007 2008 (1) (2)
x 1000 tons
2009 2010 2011 2012 2013 2014
Abate F 334329 325 249 -7 9306 224 404 256 304 358
Blanquilla 48140 133 82 -2 -1186 81 78 59 54 49
Conference 934827 823 639 -2 10903 832 928 693 894 951
Coscia-Ercollini 72104 110 107 9 -3106 98 80 77 80 66
Doyenne du Comice 85135 126 82 -10 8116 97 107 58 83 94
Durondeau 59 7 6 -26 -178 6 7 5 6 6
Guyot 75109 105 98 13 4102 92 96 70 80 67
Kaiser 4460 59 39 33 665 42 60 39 54 33
Passacrassana 1529 25 21 34 819 15 17 17 14 11
Rocha 151172 136 168 -25 -5197 171 209 115 162 203
William BC 262352 322 309 -5 -3312 286 332 252 283 278
Other 318431 373 369 3 10382 331 333 246 315 309
Total: 2,3432,697 2,545 2,168 -3 6
(1) Percentage difference between F2015 and 2014(2) Percentage difference between F2015 and the average of 2012- 2013- 2014
0
100
200
300
400
Abate F William BC
Top 3 varieties of pear production after Conference
2012
2013
2014
F20150
200400600800
1000
2012 2013 2014 F2015
Top 1 variety - Conference
2,603 2,276 2,652 1,888 2,327 2,425
66
EU pear stocks in selected countries
67
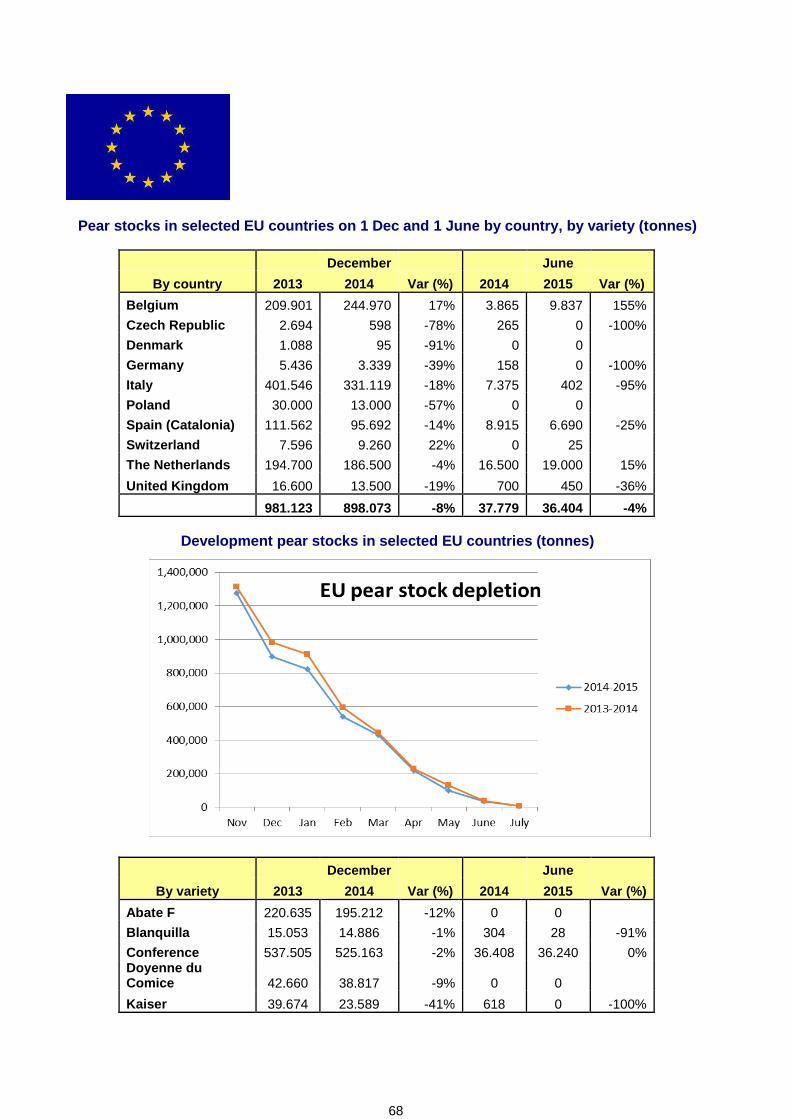
Pear stocks in selected EU countries on 1 Dec and 1 June by country, by variety (tonnes)
December June
By country 2013 2014 Var (%) 2014 2015 Var (%)
Belgium 209.901 244.970 17% 3.865 9.837 155%
Czech Republic 2.694 598 -78% 265 0 -100%
Denmark 1.088 95 -91% 0 0
Germany 5.436 3.339 -39% 158 0 -100%
Italy 401.546 331.119 -18% 7.375 402 -95%
Poland 30.000 13.000 -57% 0 0
Spain (Catalonia) 111.562 95.692 -14% 8.915 6.690 -25%
Switzerland 7.596 9.260 22% 0 25
The Netherlands 194.700 186.500 -4% 16.500 19.000 15%
United Kingdom 16.600 13.500 -19% 700 450 -36%
981.123 898.073 -8% 37.779 36.404 -4%
Development pear stocks in selected EU countries (tonnes)
December June
By variety 2013 2014 Var (%) 2014 2015 Var (%)
Abate F 220.635 195.212 -12% 0 0
Blanquilla 15.053 14.886 -1% 304 28 -91%
Conference 537.505 525.163 -2% 36.408 36.240 0% Doyenne du Comice 42.660 38.817 -9% 0 0
Kaiser 39.674 23.589 -41% 618 0 -100%
68

EU 28 pear production by country, by variety
69

EU 28
Pear production by country, by variety
Variety F20152006 2007 2008 (1) (2)2014
Belgium x 1000 tons
2009 2010 2011 2012 2013
Conference 314235 255 152 -6 11273 253 263 221 290 335
Doyenne du Comice 1820 20 9 -22 2120 19 21 7 14 23
Durondeau 59 7 6 -26 -178 6 7 5 6 6
Other 106 4 4 9 686 6 5 3 5 9
Total 347268 287 170 -7 12
(1) Percentage difference between F2015 and 2014(2) Percentage difference between F2015 and the average of 2012- 2013- 2014
0
100
200
300
400
2006
2007
2008
2009
2010
2011
2012
2013
2014
F20
15
- Pear production
Belgium
Belgium
307 285 295 236 315 374
70
EU 28
Pear production by country, by variety
Variety F20152006 2007 2008 (1) (2)2014
Croatia x 1000 tons
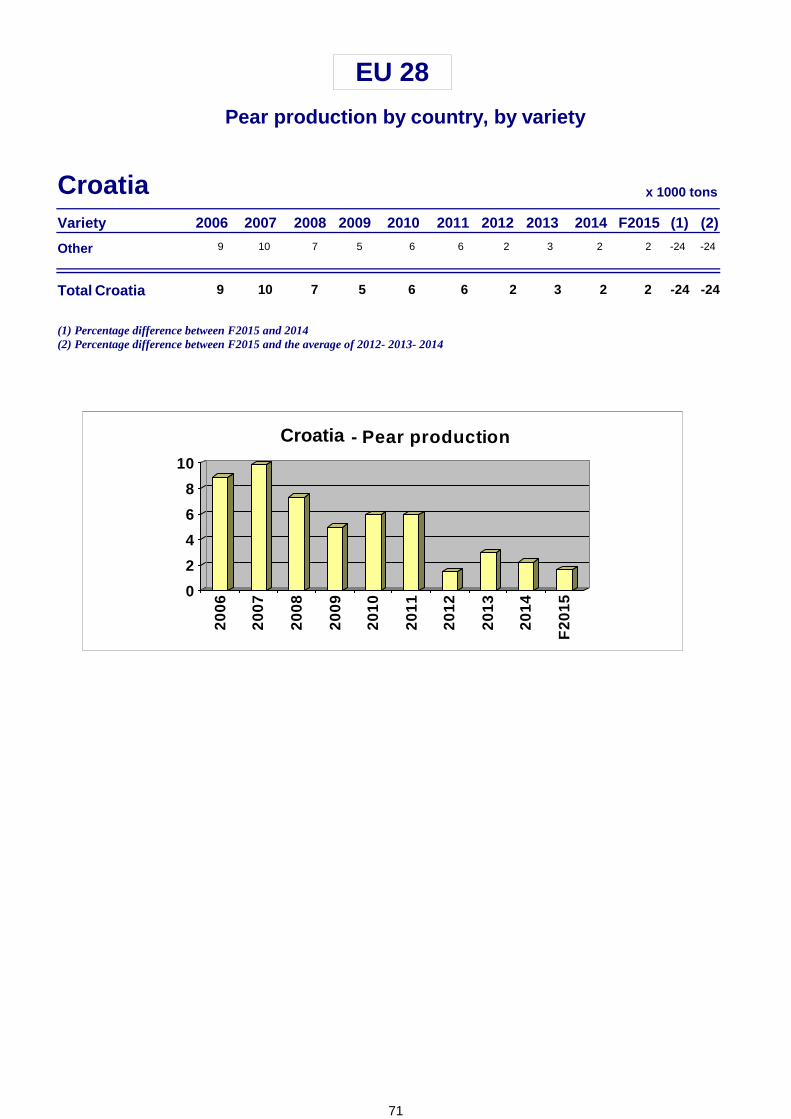
2009 2010 2011 2012 2013
Other 29 10 7 -24 -245 6 6 2 3 2
Total 29 10 7 -24 -24
(1) Percentage difference between F2015 and 2014(2) Percentage difference between F2015 and the average of 2012- 2013- 2014
0
2
4
6
8
10
2006
2007
2008
2009
2010
2011
2012
2013
2014
F20
15
- Pear production
Croatia
Croatia
5 6 6 2 3 2
71
EU 28
Pear production by country, by variety
Variety F20152006 2007 2008 (1) (2)2014
Czech Rep x 1000 tons
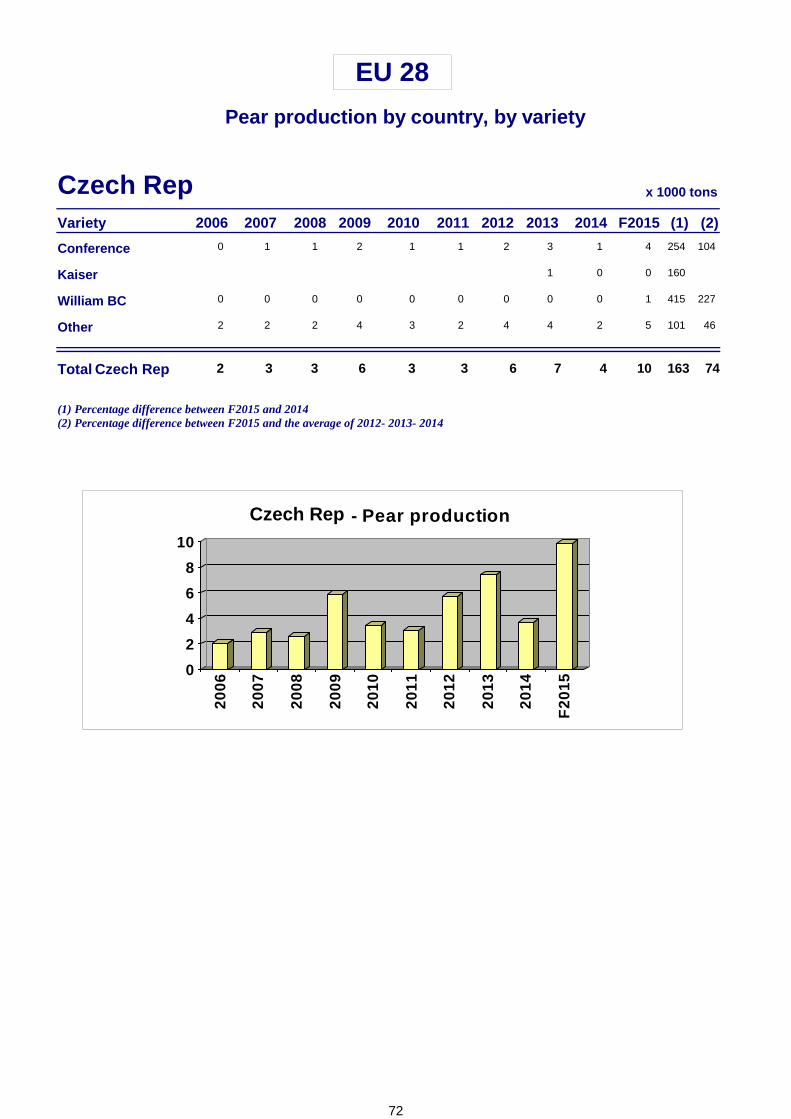
2009 2010 2011 2012 2013
Conference 40 1 1 254 1042 1 1 2 3 1
Kaiser 0 1601 0
William BC 10 0 0 415 2270 0 0 0 0 0
Other 52 2 2 101 464 3 2 4 4 2
Total 102 3 3 163 74
(1) Percentage difference between F2015 and 2014(2) Percentage difference between F2015 and the average of 2012- 2013- 2014
0
2
4
6
8
10
2006
2007
2008
2009
2010
2011
2012
2013
2014
F20
15
- Pear production
Czech Rep
Czech Rep
6 3 3 6 7 4
72
EU 28
Pear production by country, by variety
Variety F20152006 2007 2008 (1) (2)2014
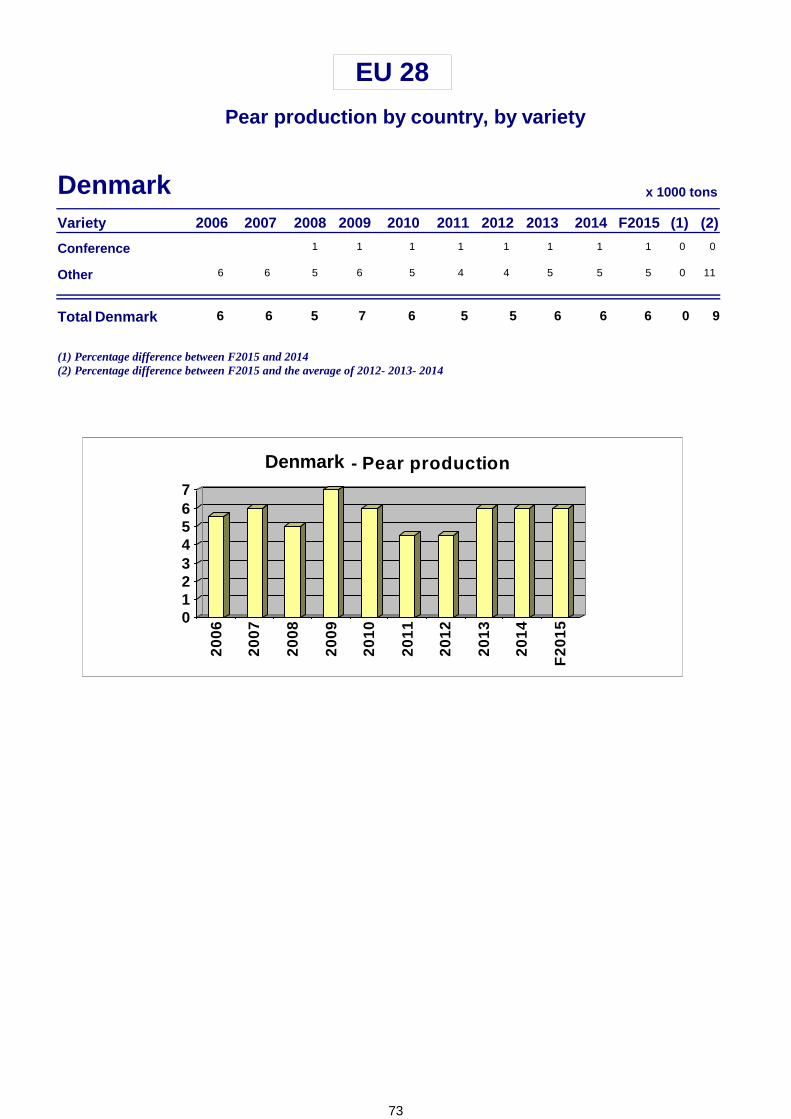
Denmark x 1000 tons
2009 2010 2011 2012 2013
Conference 11 0 01 1 1 1 1 1
Other 56 6 5 0 116 5 4 4 5 5
Total 66 6 5 0 9
(1) Percentage difference between F2015 and 2014(2) Percentage difference between F2015 and the average of 2012- 2013- 2014
01234567
2006
2007
2008
2009
2010
2011
2012
2013
2014
F20
15
- Pear production
Denmark
Denmark
7 6 5 5 6 6
73

EU 28
Pear production by country, by variety
Variety F20152006 2007 2008 (1) (2)2014
France x 1000 tons
2009 2010 2011 2012 2013
Conference 3136 35 20 15 2429 25 25 20 28 27
Doyenne du Comice 1729 24 12 -11 2418 12 18 9 13 19
Guyot 3959 56 48 34 1361 49 49 35 40 29
Passacrassana 713 13 9 133 249 6 8 8 6 3
William BC 4081 65 46 11 -153 46 53 35 50 36
Other 1529 28 22 -12 -1232 26 23 17 17 17
Total 149246 221 157 14 9
(1) Percentage difference between F2015 and 2014(2) Percentage difference between F2015 and the average of 2012- 2013- 2014
0
50
100
150
200
250
2006
2007
2008
2009
2010
2011
2012
2013
2014
F20
15- Pear production
France
France
202 164 176 124 154 131
74
EU 28
Pear production by country, by variety
Variety F20152006 2007 2008 (1) (2)2014
Germany x 1000 tons
2009 2010 2011 2012 2013
Conference 12 0 1610 8 11 10 9 12
William BC 4 0 2010 7 5 3 3 4
Other 3057 56 38 3 2532 24 31 21 22 29
Total 4657 56 38 2 22
(1) Percentage difference between F2015 and 2014(2) Percentage difference between F2015 and the average of 2012- 2013- 2014
0102030405060
2006
2007
2008
2009
2010
2011
2012
2013
2014
F20
15
- Pear production
Germany
Germany
52 39 47 34 34 45
75
EU 28
Pear production by country, by variety
Variety F20152006 2007 2008 (1) (2)2014
Greece x 1000 tons
2009 2010 2011 2012 2013
Abate F 31 1 1 15 371 1 2 2 2 3
Coscia-Ercollini 12 2 2 12 342 2 1 1 1 1
Passacrassana 45 4 4 8 142 3 3 4 3 3
William BC 1116 17 20 14 814 18 9 12 9 10
Other 2123 27 24 5 524 31 21 22 18 20
Total 4145 51 51 9 10
(1) Percentage difference between F2015 and 2014(2) Percentage difference between F2015 and the average of 2012- 2013- 2014
0102030405060
2006
2007
2008
2009
2010
2011
2012
2013
2014
F20
15- Pear production
Greece
Greece
43 54 36 42 32 37
76
EU 28
Pear production by country, by variety
Variety F20152006 2007 2008 (1) (2)2014
Hungary x 1000 tons
2009 2010 2011 2012 2013
Conference 20 2 -19 -132 2 1 2 3 3
William BC 83 7 -13 128 7 4 5 7 9
Other 2339 9 31 -19 -531 27 16 19 26 29
Total 3339 12 40 -18 -2
(1) Percentage difference between F2015 and 2014(2) Percentage difference between F2015 and the average of 2012- 2013- 2014
0
10
20
30
40
50
2006
2007
2008
2009
2010
2011
2012
2013
2014
F20
15
- Pear production
Hungary
Hungary
40 36 21 25 36 40
77

EU 28
Pear production by country, by variety
Variety F20152006 2007 2008 (1) (2)2014
Italy x 1000 tons
2009 2010 2011 2012 2013
Abate F 330328 324 248 -7 9302 220 398 252 301 355
Conference 62137 127 105 2 -6118 93 106 72 66 61
Coscia-Ercollini 3561 64 58 8 -760 53 45 41 41 33
Doyenne du Comice 2255 48 37 12 -441 38 32 23 25 19
Guyot 23 3 3 32 222 2 3 2 2 2
Kaiser 4460 59 39 32 1560 39 55 34 48 33
Passacrassana 48 6 6 -10 -136 5 5 4 4 4
William BC 146207 195 181 -8 -6183 156 205 150 156 158
Other 78107 97 84 10 486 74 86 72 82 71
Total 723966 922 759 -2 3
(1) Percentage difference between F2015 and 2014(2) Percentage difference between F2015 and the average of 2012- 2013- 2014
0
200
400
600
800
1000
2006
2007
2008
2009
2010
2011
2012
2013
2014
F20
15
- Pear production
Italy
Italy
858 680 934 650 726 736
78
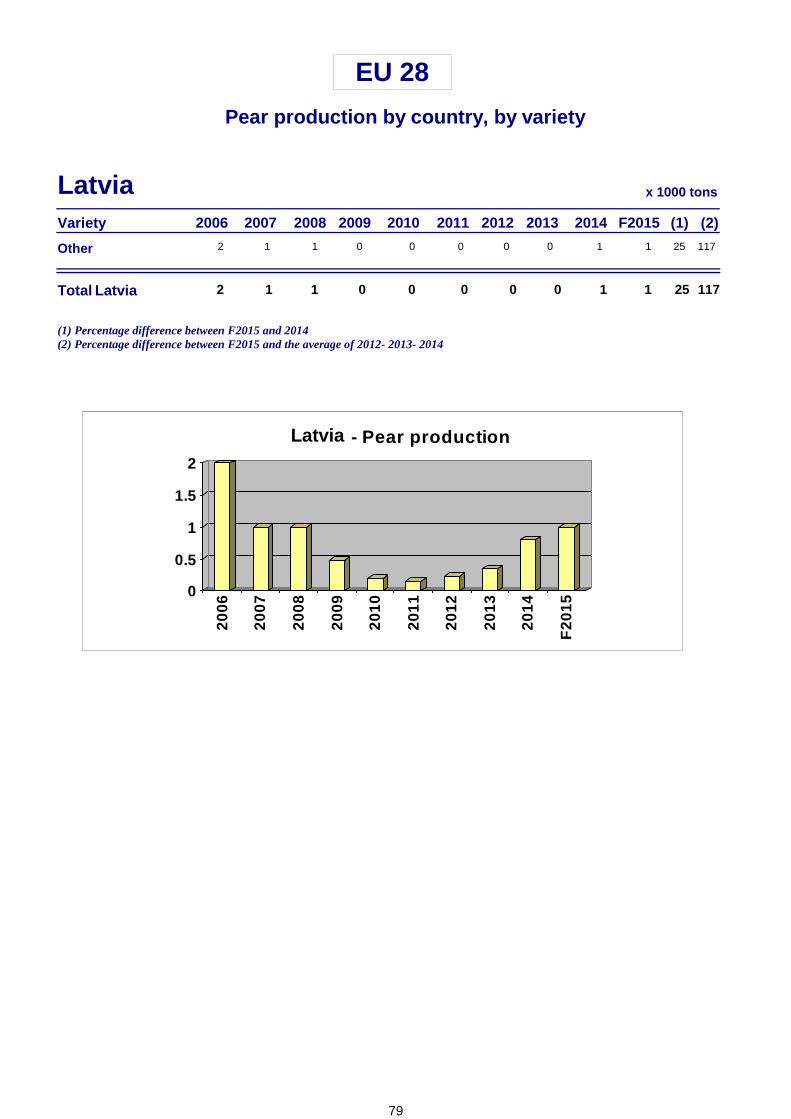
EU 28
Pear production by country, by variety
Variety F20152006 2007 2008 (1) (2)2014
Latvia x 1000 tons
2009 2010 2011 2012 2013
Other 12 1 1 25 1170 0 0 0 0 1
Total 12 1 1 25 117
(1) Percentage difference between F2015 and 2014(2) Percentage difference between F2015 and the average of 2012- 2013- 2014
0
0.5
1
1.5
2
2006
2007
2008
2009
2010
2011
2012
2013
2014
F20
15
- Pear production
Latvia
Latvia
0 0 0 0 0 1
79
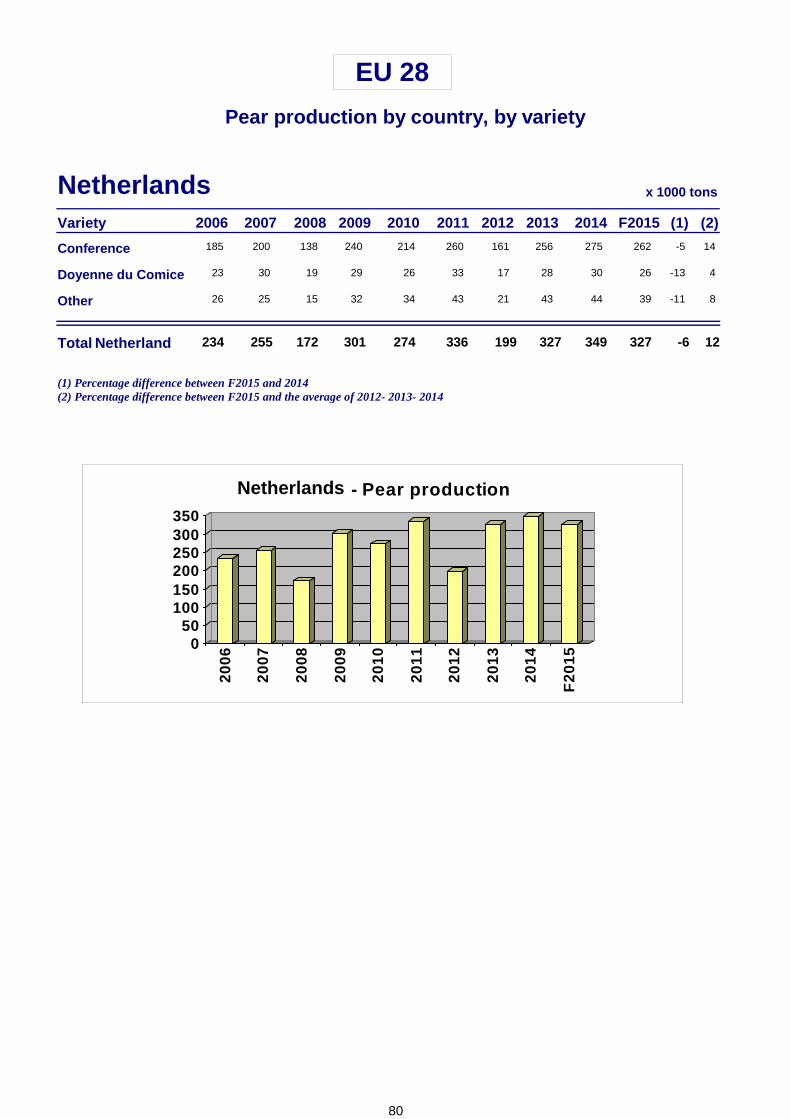
EU 28
Pear production by country, by variety
Variety F20152006 2007 2008 (1) (2)2014
Netherlands x 1000 tons
2009 2010 2011 2012 2013
Conference 262185 200 138 -5 14240 214 260 161 256 275
Doyenne du Comice 2623 30 19 -13 429 26 33 17 28 30
Other 3926 25 15 -11 832 34 43 21 43 44
Total 327234 255 172 -6 12
(1) Percentage difference between F2015 and 2014(2) Percentage difference between F2015 and the average of 2012- 2013- 2014
050
100150200250300350
2006
2007
2008
2009
2010
2011
2012
2013
2014
F20
15
- Pear production
Netherland
Netherlands
301 274 336 199 327 349
80

EU 28
Pear production by country, by variety
Variety F20152006 2007 2008 (1) (2)2014
Poland x 1000 tons
2009 2010 2011 2012 2013
Conference 5025 16 20 67 5040 20 35 30 40 30
Doyenne du Comice 5 2 3 5
Kaiser 0 5 3 5 5 5
Other 3025 13 17 50 8040 17 15 10 20 20
Total 8055 31 40 60 50
(1) Percentage difference between F2015 and 2014(2) Percentage difference between F2015 and the average of 2012- 2013- 2014
0
20
40
60
80
100
2006
2007
2008
2009
2010
2011
2012
2013
2014
F20
15
- Pear production
Poland
Poland
90 40 55 45 65 50
81
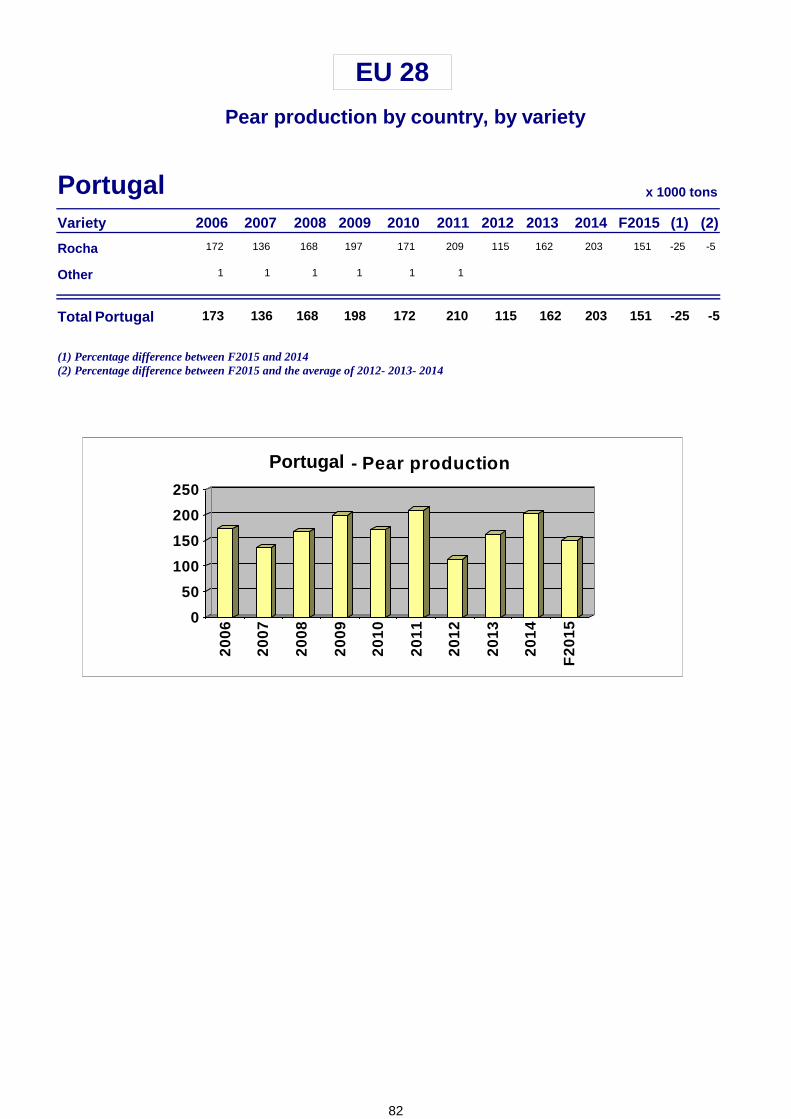
EU 28
Pear production by country, by variety
Variety F20152006 2007 2008 (1) (2)2014
Portugal x 1000 tons
2009 2010 2011 2012 2013
Rocha 151172 136 168 -25 -5197 171 209 115 162 203
Other 1 1 1 1 1 1
Total 151173 136 168 -25 -5
(1) Percentage difference between F2015 and 2014(2) Percentage difference between F2015 and the average of 2012- 2013- 2014
0
50
100
150
200
250
2006
2007
2008
2009
2010
2011
2012
2013
2014
F20
15
- Pear production
Portugal
Portugal
198 172 210 115 162 203
82

EU 28
Pear production by country, by variety
Variety F20152006 2007 2008 (1) (2)2014
Romania x 1000 tons
2009 2010 2011 2012 2013
Abate F 0 44 -692 2 3 2 0 0
Conference 0 49 -764 4 4 4 0 0
William BC 9 -8 74 4 6 8 6 9
Other 1024 21 53 44 613 11 15 6 17 7
Total 2024 21 53 15 -2
(1) Percentage difference between F2015 and 2014(2) Percentage difference between F2015 and the average of 2012- 2013- 2014
0102030405060
2006
2007
2008
2009
2010
2011
2012
2013
2014
F20
15
- Pear production
Romania
Romania
24 20 28 19 24 17
83
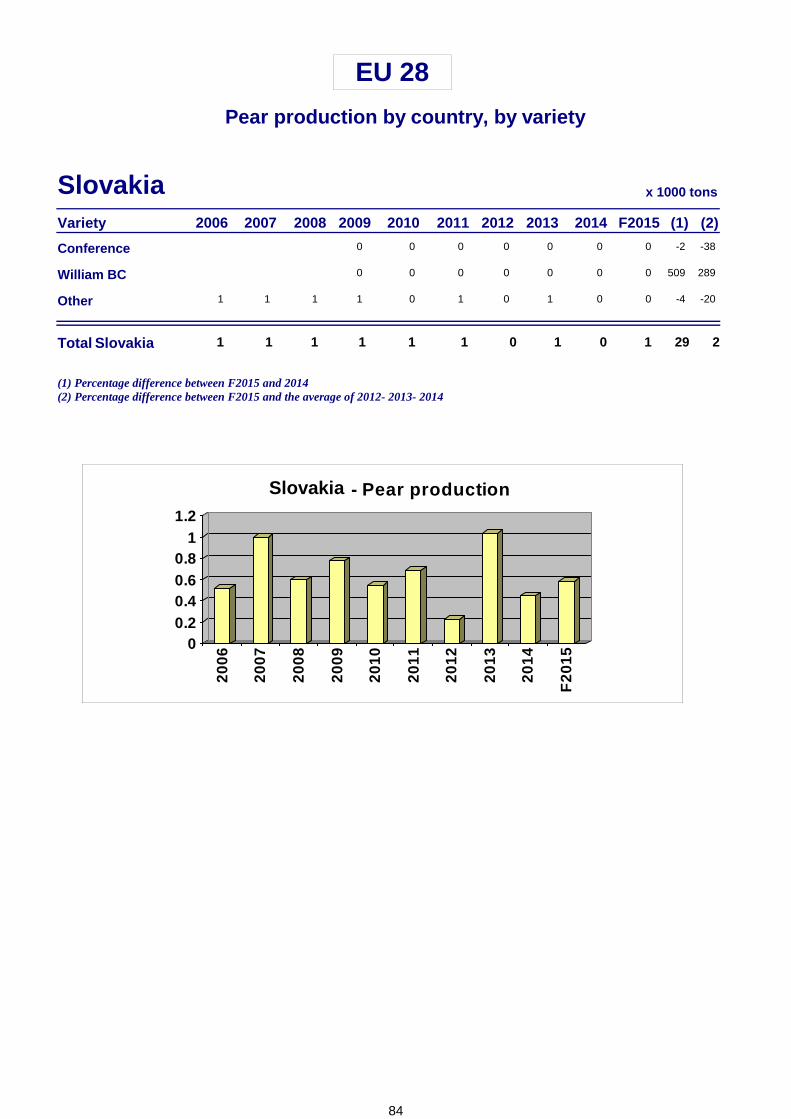
EU 28
Pear production by country, by variety
Variety F20152006 2007 2008 (1) (2)2014
Slovakia x 1000 tons
2009 2010 2011 2012 2013
Conference 0 -2 -380 0 0 0 0 0
William BC 0 509 2890 0 0 0 0 0
Other 01 1 1 -4 -201 0 1 0 1 0
Total 11 1 1 29 2
(1) Percentage difference between F2015 and 2014(2) Percentage difference between F2015 and the average of 2012- 2013- 2014
00.20.40.60.8
11.2
2006
2007
2008
2009
2010
2011
2012
2013
2014
F20
15
- Pear production
Slovakia
Slovakia
1 1 1 0 1 0
84
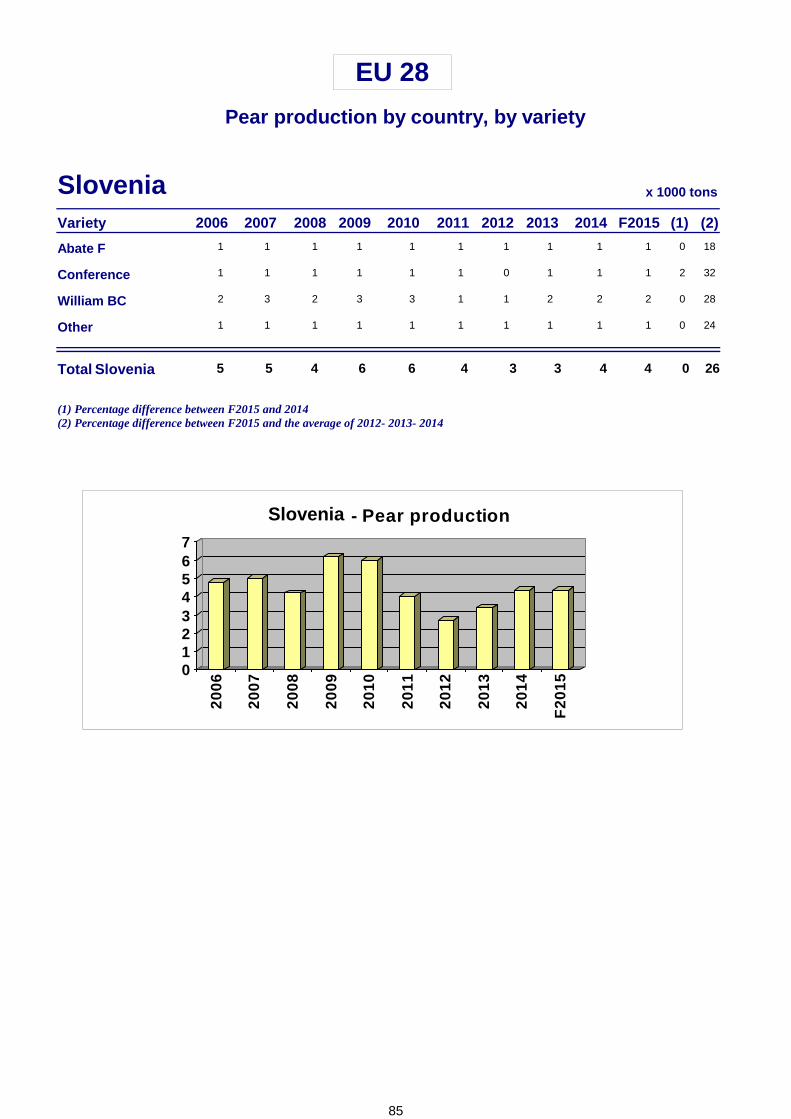
EU 28
Pear production by country, by variety
Variety F20152006 2007 2008 (1) (2)2014
Slovenia x 1000 tons
2009 2010 2011 2012 2013
Abate F 11 1 1 0 181 1 1 1 1 1
Conference 11 1 1 2 321 1 1 0 1 1
William BC 22 3 2 0 283 3 1 1 2 2
Other 11 1 1 0 241 1 1 1 1 1
Total 45 5 4 0 26
(1) Percentage difference between F2015 and 2014(2) Percentage difference between F2015 and the average of 2012- 2013- 2014
01234567
2006
2007
2008
2009
2010
2011
2012
2013
2014
F20
15
- Pear production
Slovenia
Slovenia
6 6 4 3 3 4
85

EU 28
Pear production by country, by variety
Variety F20152006 2007 2008 (1) (2)2014
Spain x 1000 tons
2009 2010 2011 2012 2013
Blanquilla 48140 133 82 -2 -1186 81 78 59 54 49
Conference 173187 163 181 -7 2158 184 194 147 176 185
Coscia-Ercollini 3541 44 47 10 044 43 34 35 39 32
Guyot 3447 46 47 -6 -639 41 44 33 38 36
Passacrassana 13 2 2 -10 -192 2 2 1 1 1
William BC 4247 40 53 -13 -637 45 48 37 48 48
Other 4573 68 64 -8 -364 60 60 44 48 49
Total 377537 496 476 -6 -2
(1) Percentage difference between F2015 and 2014(2) Percentage difference between F2015 and the average of 2012- 2013- 2014
0100200300400500600
2006
2007
2008
2009
2010
2011
2012
2013
2014
F20
15
- Pear production
Spain
Spain
429 456 461 355 403 400
86
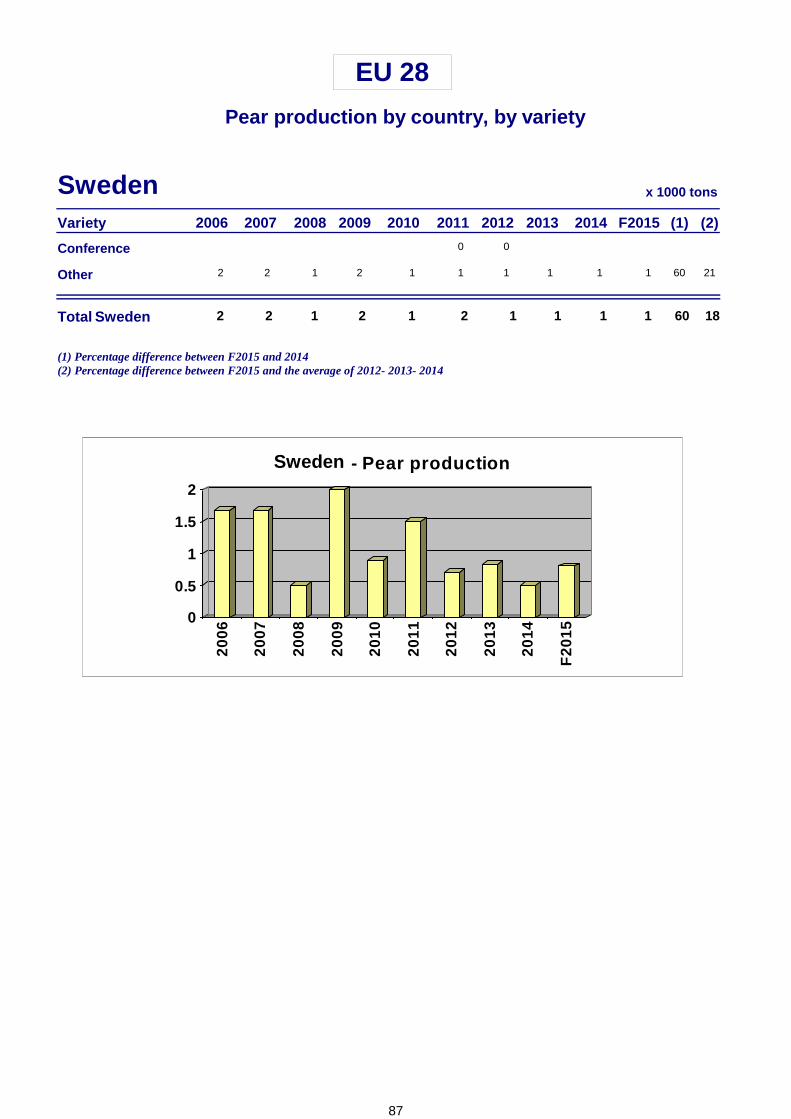
EU 28
Pear production by country, by variety
Variety F20152006 2007 2008 (1) (2)2014
Sweden x 1000 tons
2009 2010 2011 2012 2013
Conference 0 0
Other 12 2 1 60 212 1 1 1 1 1
Total 12 2 1 60 18
(1) Percentage difference between F2015 and 2014(2) Percentage difference between F2015 and the average of 2012- 2013- 2014
0
0.5
1
1.5
2
2006
2007
2008
2009
2010
2011
2012
2013
2014
F20
15
- Pear production
Sweden
Sweden
2 1 2 1 1 1
87
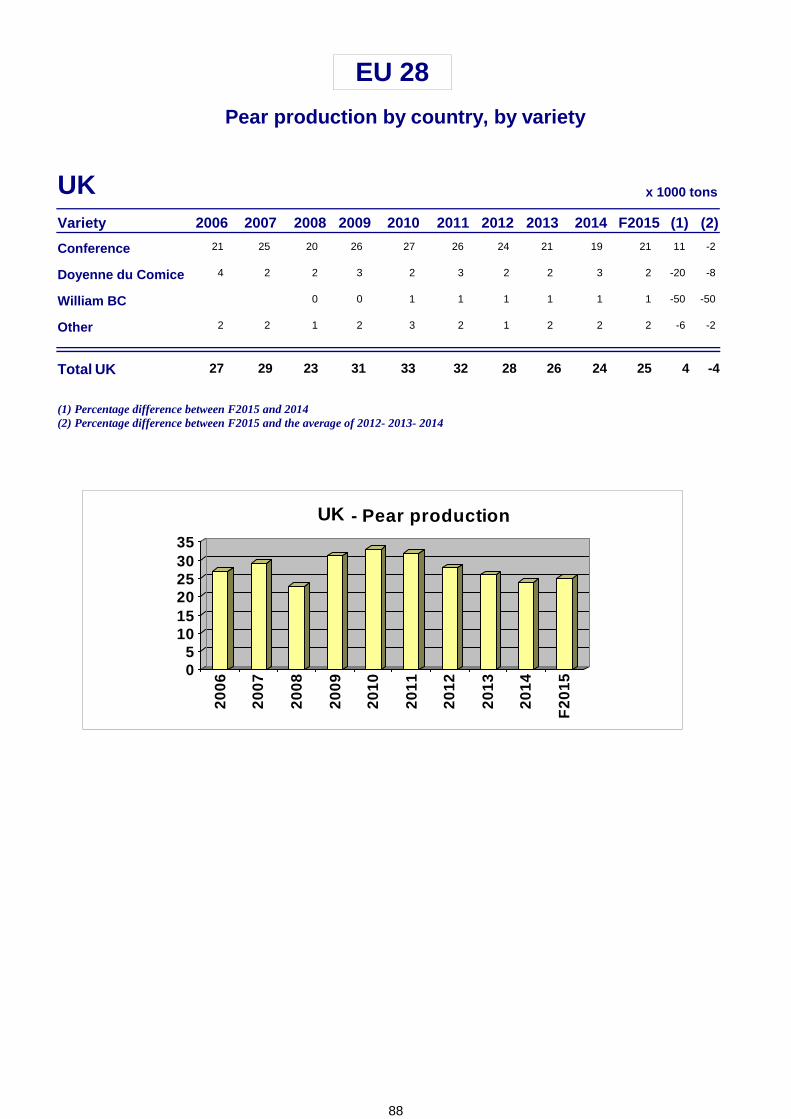
EU 28
Pear production by country, by variety
Variety F20152006 2007 2008 (1) (2)2014
UK x 1000 tons
2009 2010 2011 2012 2013
Conference 2121 25 20 11 -226 27 26 24 21 19
Doyenne du Comice 24 2 2 -20 -83 2 3 2 2 3
William BC 10 -50 -500 1 1 1 1 1
Other 22 2 1 -6 -22 3 2 1 2 2
Total 2527 29 23 4 -4
(1) Percentage difference between F2015 and 2014(2) Percentage difference between F2015 and the average of 2012- 2013- 2014
05
101520253035
2006
2007
2008
2009
2010
2011
2012
2013
2014
F20
15
- Pear production
UK
UK
31 33 32 28 26 24
88

Extra EU pear production by country
89
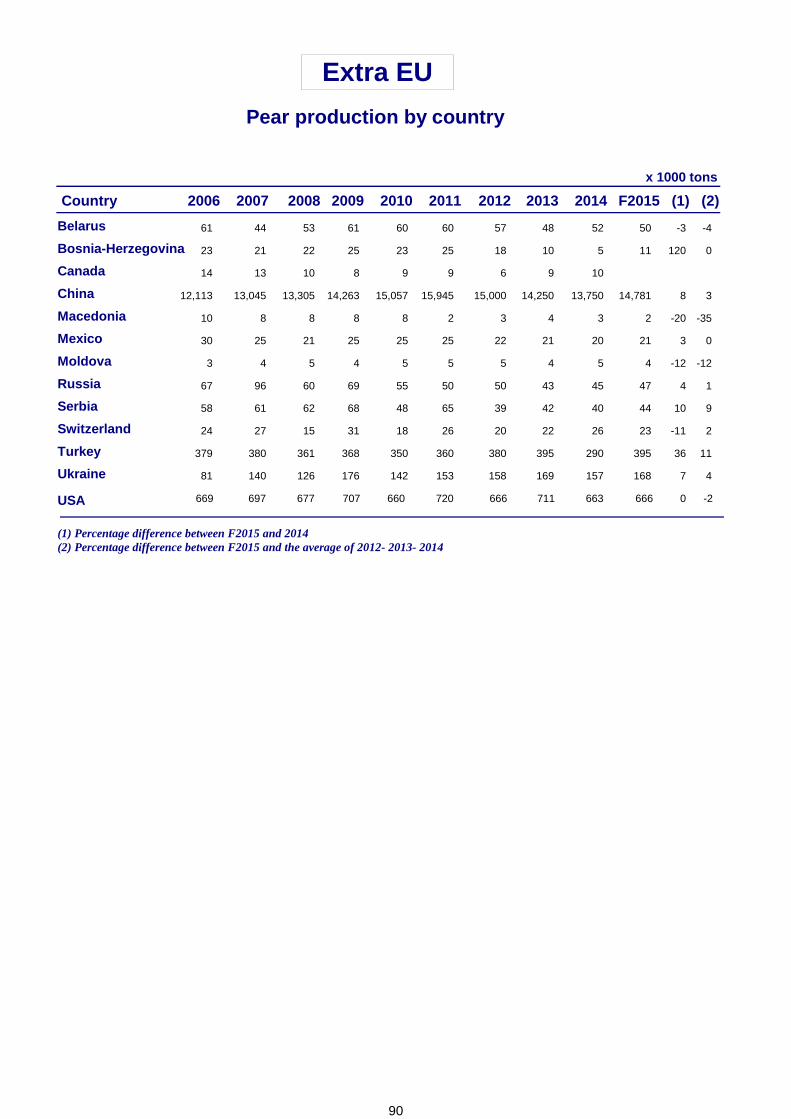
Pear production by country
Extra EU
F20152006 2007 2008 (1) (2)
x 1000 tons
2009 2010 2011 2012 20142013Country
Belarus 5061 44 53 -3 -461 60 60 57 48 52
Bosnia-Herzegovina 1123 21 22 120 025 23 25 18 10 5
Canada 14 13 10 8 9 9 6 9 10
China 14,78112,113 13,045 13,305 8 314,263 15,057 15,945 15,000 14,250 13,750
Macedonia 210 8 8 -20 -358 8 2 3 4 3
Mexico 2130 25 21 3 025 25 25 22 21 20
Moldova 43 4 5 -12 -124 5 5 5 4 5
Russia 4767 96 60 4 169 55 50 50 43 45
Serbia 4458 61 62 10 968 48 65 39 42 40
Switzerland 2324 27 15 -11 231 18 26 20 22 26
Turkey 395379 380 361 36 11368 350 360 380 395 290
Ukraine 16881 140 126 7 4176 142 153 158 169 157
(1) Percentage difference between F2015 and 2014(2) Percentage difference between F2015 and the average of 2012- 2013- 2014
669 666697 677 707 660 720USA 0 -2666 711 663
90

Extra EU pear production by country, by variety
91
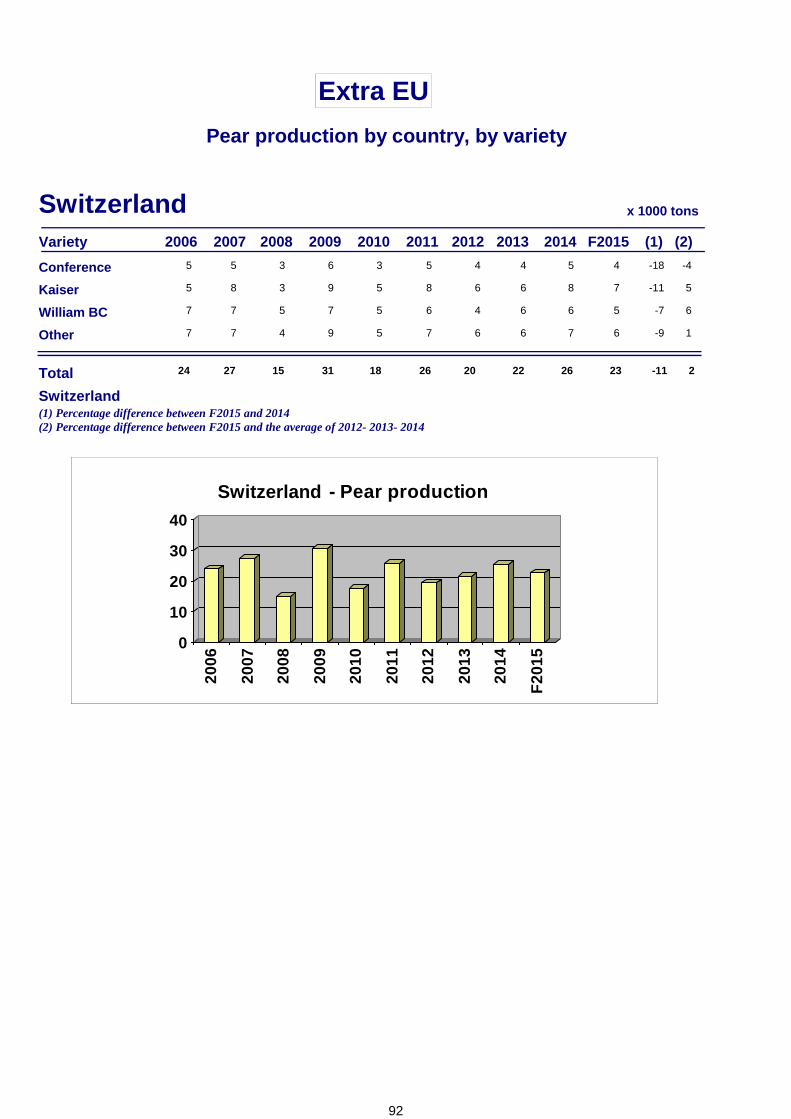
Extra EU
Pear production by country, by variety
2014
SwitzerlandVariety F20152006 2007 2008 (1) (2)
x 1000 tons
2009 2010 2011 2012 2013
Conference 45 5 3 -18 -46 3 5 4 54
Kaiser 75 8 3 -11 59 5 8 6 86
William BC 57 7 5 -7 67 5 6 4 66
Other 67 7 4 -9 19 5 7 6 76
(1) Percentage difference between F2015 and 2014(2) Percentage difference between F2015 and the average of 2012- 2013- 2014
Total 2324 27 15 -11 2
0
10
20
30
40
2006
2007
2008
2009
2010
2011
2012
2013
2014
F20
15
- Pear production
Switzerland
Switzerland
31 18 26 20 22 26
92
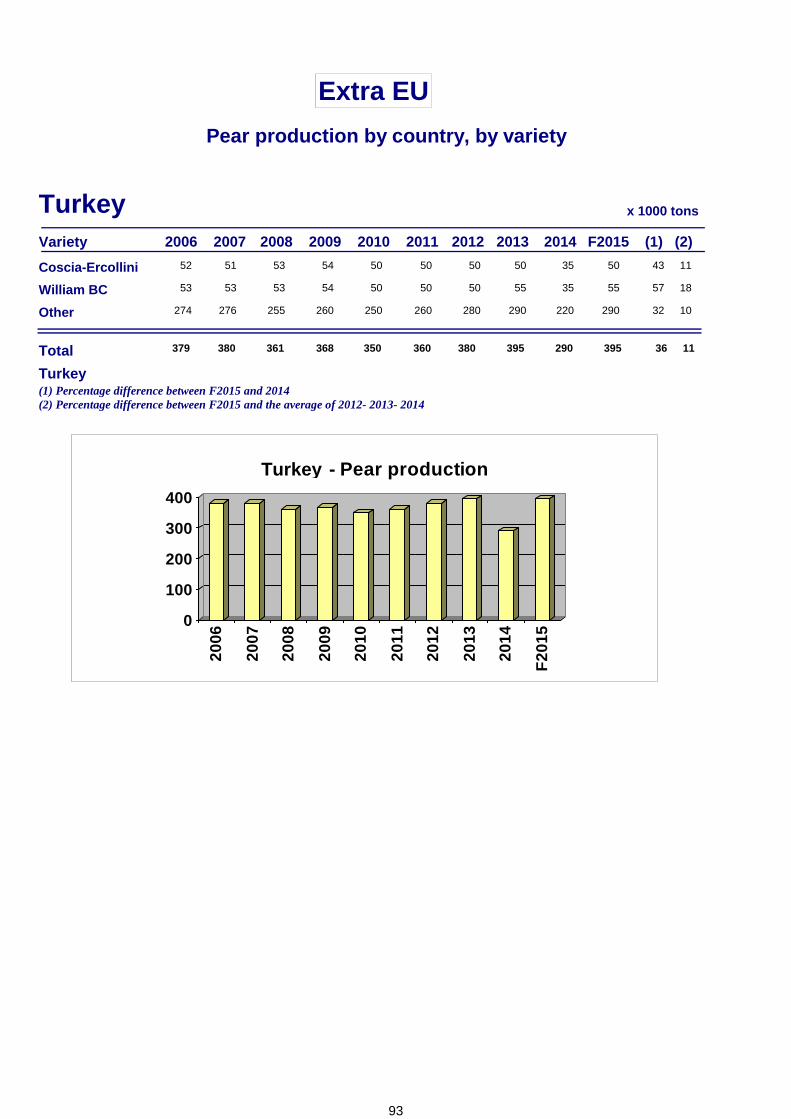
Extra EU
Pear production by country, by variety
2014
TurkeyVariety F20152006 2007 2008 (1) (2)
x 1000 tons
2009 2010 2011 2012 2013
Coscia-Ercollini 5052 51 53 43 1154 50 50 50 3550
William BC 5553 53 53 57 1854 50 50 50 3555
Other 290274 276 255 32 10260 250 260 280 220290
(1) Percentage difference between F2015 and 2014(2) Percentage difference between F2015 and the average of 2012- 2013- 2014
Total 395379 380 361 36 11
0
100
200
300
400
2006
2007
2008
2009
2010
2011
2012
2013
2014
F20
15
- Pear production
Turkey
Turkey
368 350 360 380 395 290
93
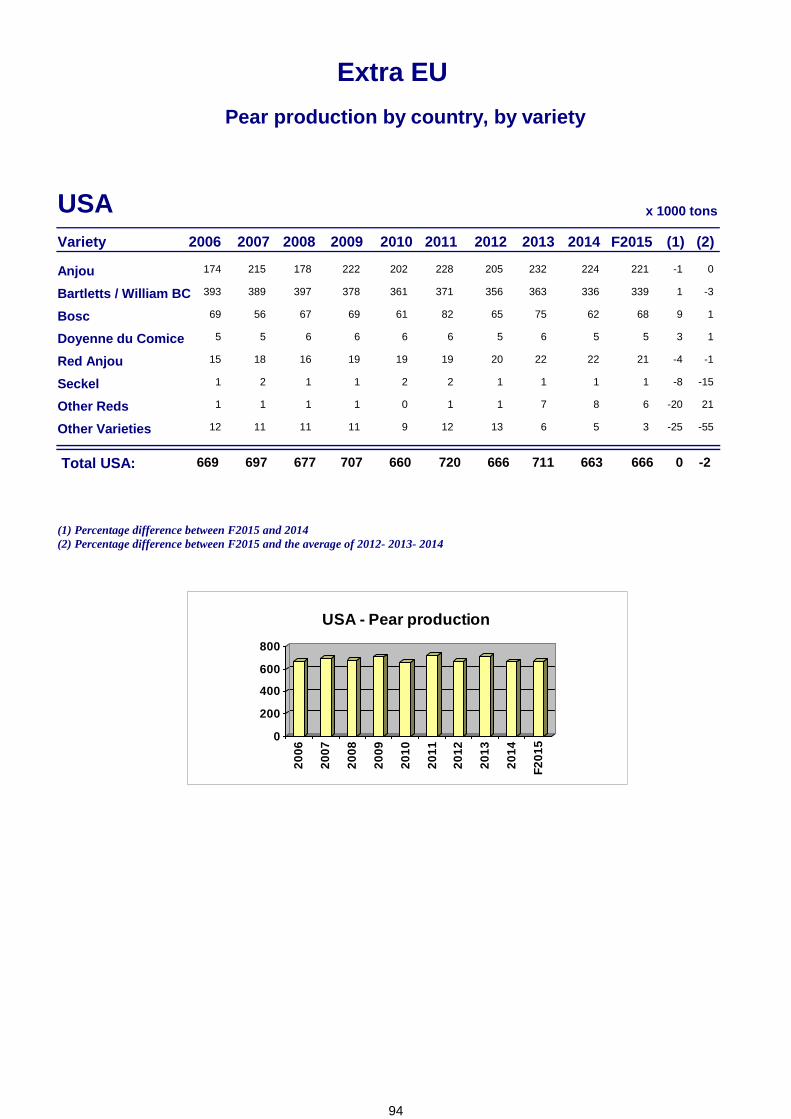
Extra EU
Pear production by country, by variety
Variety F20152006 2007 2008 (1) (2)
x 1000 tonsUSA2009 2010 2011 2012 2013 2014
Anjou 221174 215 178 -1 0222 202 228 205 232 224
Bartletts / William BC 339393 389 397 1 -3378 361 371 356 363 336
Bosc 6869 56 67 9 169 61 82 65 75 62
Doyenne du Comice 55 5 6 3 16 6 6 5 6 5
Red Anjou 2115 18 16 -4 -119 19 19 20 22 22
Seckel 11 2 1 -8 -151 2 2 1 1 1
Other Reds 61 1 1 -20 211 0 1 1 7 8
Other Varieties 312 11 11 -25 -5511 9 12 13 6 5
666669 697 677 0 -2Total USA:
0
200
400
600
800
2006
2007
2008
2009
2010
2011
2012
2013
2014
F201
5
USA - Pear production
707
(1) Percentage difference between F2015 and 2014(2) Percentage difference between F2015 and the average of 2012- 2013- 2014
660 720 666 711 663
94

SOUTHERN HEMISPHERE APPLE AND PEAR CROP 2015
95
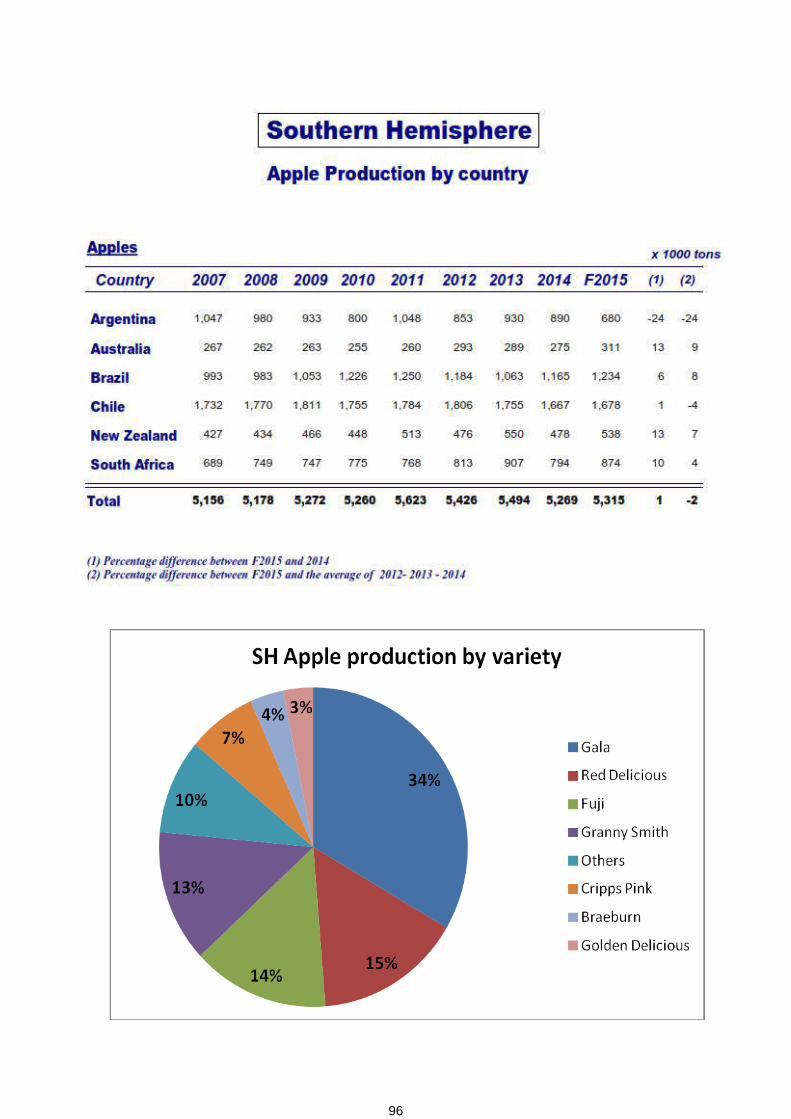
96

97

98
WORLD RANKING APPLE AND PEAR PRODUCING COUNTRIES
99

Apple production by country and year
Apple production by country (FAOstat in T) 2009 2010 2011 2012 2013
1 China 31.684.433 33.265.186 35.986.667 38.492.519 39.684.118
2 United States 4.402.069 4.214.599 4.275.113 4.110.051 4.081.608
3 Turkey 2.782.365 2.600.000 2.680.075 2.889.000 3.128.450
4 Poland 2.626.273 1.877.906 2.493.078 2.877.336 3.085.074
5 Italy 2.325.653 2.204.972 2.411.201 1.991.312 2.216.963
6 India 1.985.000 1.777.200 2.891.000 2.203.400 1.915.000
7 France 1.803.370 1.788.433 1.857.349 1.384.852 1.737.482
8 Chile 1.330.617 1.624.242 1.588.347 1.625.000 1.709.589
9 Iran 2.000.000 1.662.430 1.842.972 1.700.000 1.693.370
10 Russia 1.441.200 992.000 1.200.000 1.403.000 1.572.000
11 Argentina 950.000 1.050.000 1.043.512 947.486 1.245.018
12 Brazil 1.222.885 1.279.124 1.338.995 1.339.771 1.231.472
13 Ukraine 853.400 897.000 954.100 1.126.800 1.211.400
14 Uzbekistan 635.000 712.000 769.363 855.000 937.000
15 Mexico 561.493 584.655 630.533 375.045 858.608
16 South Africa 817.698 724.232 781.124 795.758 811.523
17 Germany 1.070.678 834.960 898.448 972.405 803.784
18 North Korea 719.608 752.020 752.300 785.000 780.000
19 Japan 845.600 786.500 655.300 793.800 741.700
20 Pakistan 366.360 525.855 598.804 556.307 606.016
21 Morocco 422.572 444.861 512.407 485.642 583.046
22 Hungary 575.368 496.916 292.810 650.595 552.400
23 Spain 601.979 645.918 670.264 481.500 546.400
24 Egypt 508.833 493.119 455.817 541.239 546.164
25 South Korea 494.491 460.285 379.541 394.596 493.701
26 Romania 517.491 552.860 620.362 462.935 493.405
27 Algeria 267.469 378.637 404.105 397.529 455.937
28 New Zealand 431.000 450.000 445.000 448.000 438.952
29 Canada 435.490 371.025 394.758 273.919 382.001
30 Austria 485.609 488.954 546.741 471.420 375.336
Others 5.552.913 5.403.415 5.409.872 5.472.172 5.566.310
Total World 70.716.917 70.339.304 75.779.957 77.303.388 80.483.827
100

Pear production by country and year
Pear production by country (FAOstat in T) 2009 2010 2011 2012 2013
1 China 14.416.430 15.231.858 15.945.013 17.210.911 17.440.751
2 United States 868.357 738.085 876.087 772.074 795.557
3 Italy 872.368 736.646 926.542 645.540 743.029
4 Argentina 700.000 704.242 812.633 825.115 722.324
5 Turkey 384.244 380.003 386.382 439.656 461.826
6 Spain 463.969 476.686 502.434 407.200 425.700
7 South Africa 340.088 368.495 350.527 338.584 343.203
8 India 308.487 336.049 334.774 340.000 340.000
9 Netherlands 295.000 274.000 336.000 199.000 327.000
10 Belgium 280.600 307.270 284.827 236.400 305.000
11 Japan 351.500 284.900 312.800 299.000 294.400
12 South Korea 418.368 307.820 290.494 172.599 282.212
13 Algeria 159.997 234.274 233.147 211.191 240.709
14 Chile 191.000 180.000 190.000 191.000 226.118
15 Portugal 200.040 176.764 230.447 116.300 202.500
16 Ukraine 145.900 141.700 153.100 157.500 169.400
17 France 162.697 148.532 170.759 124.166 148.938
18 North Korea 137.207 142.974 143.000 147.000 145.000
19 Iran 153.390 153.390 106.733 147.000 136.314
20 Australia 120.376 95.111 123.267 119.274 109.206
21 Uzbekistan 65.000 72.700 68.796 88.000 100.000
22 Austria 168.663 44.892 89.344 71.491 83.587
23 Poland 83.032 46.542 62.784 64.678 75.674
24 Russia 59.600 41.000 53.600 62.200 70.000
25 Romania 66.111 60.375 66.913 54.274 66.849
26 Egypt 54.229 44.713 48.817 64.664 66.403
27 Greece 73.784 68.400 61.900 67.200 65.000
28 Tunisia 60.000 66.000 61.000 62.000 48.000
29 Switzerland 67.788 40.062 59.937 48.229 42.923
30 Azerbaijan 36.228 35.538 36.639 39.205 40.654
Others 655.280 643.651 648.790 547.993 614.741
Total World 22.359.733 22.582.672 23.967.486 24.269.444 25.133.018
101

Notes

www.smartfresh.com
Beautifully crisp, juicy and tasty!The SmartFreshSM Quality System enhances the freshness,quality and value of your apples and contributes to fruitwaste reduction. Now commercialized in 46 countries.
Contact your AgroFreshrepresentative today.
Join us for
PROGNOSFRUIT 2016
HAMBURG (Germany)
3-5TH AUGUST 2016
www.prognosfruit.eu
www.wapa-association.org