Europe Roadshow - Australian Securities Exchange · 2015-01-20 · Oct 14 * Mar 14 Funding...
25
RIGHT SOLUTIONS · RIGHT PARTNER 1 RIGHT SOLUTIONS · RIGHT PARTNER Europe Roadshow January 2015 All financials are in Australian dollars unless otherwise noted For personal use only
Transcript of Europe Roadshow - Australian Securities Exchange · 2015-01-20 · Oct 14 * Mar 14 Funding...
RIGHT SOLUTIONS · RIGHT PARTNER
1
RIGHT SOLUTIONS · RIGHT PARTNER
Europe Roadshow
January 2015
All financials are in Australian dollars unless otherwise noted
For
per
sona
l use
onl
y
RIGHT SOLUTIONS · RIGHT PARTNER
2
Important notice and disclaimer
• This presentation has been prepared by ALS Limited, (ALS or the Company). It contains general information about the
Company’s activities as at the date of the presentation. It is information given in summary form and does not purport
to be complete. The distribution of this presentation in jurisdictions outside Australia may be restricted by law, and
you should observe any such restrictions.
• This presentation is not, and nothing in it should be construed as, an offer, invitation or recommendation in respect of
securities, or an offer, invitation or recommendation to sell, or a solicitation of an offer to buy, securities in any
jurisdiction. Neither this document nor anything in it shall form the basis of any contract or commitment. This
presentation is not intended to be relied upon as advice to investors or potential investors and does not take into
account the investment objectives, financial situation or needs of any investor. All investors should consider such
factors in consultation with a professional advisor of their choosing when deciding if an investment is appropriate.
• The Company has prepared this presentation based on information available to it, including information derived from
public sources that have not been independently verified. No representation or warranty, express or implied, is
provided in relation to the fairness, accuracy, correctness, completeness or reliability of the information, opinions or
conclusions expressed herein.
• This presentation may include forward-looking statements within the meaning of securities laws. Any forward-looking
statements involve known and unknown risks and uncertainties, many of which are outside the control of the Company
and its representatives. Forward-looking statements may also be based on estimates and assumptions with respect to
future business decisions, which are subject to change. Any statements, assumptions, opinions or conclusions as to
future matters may prove to be incorrect, and actual results, performance or achievement may vary materially from any
projections and forward-looking statements.
• Due care and attention should be undertaken when considering and analysing the financial performance of the
Company.
• All references to dollars are to Australian currency unless otherwise stated.
For
per
sona
l use
onl
y
RIGHT SOLUTIONS · RIGHT PARTNER
3
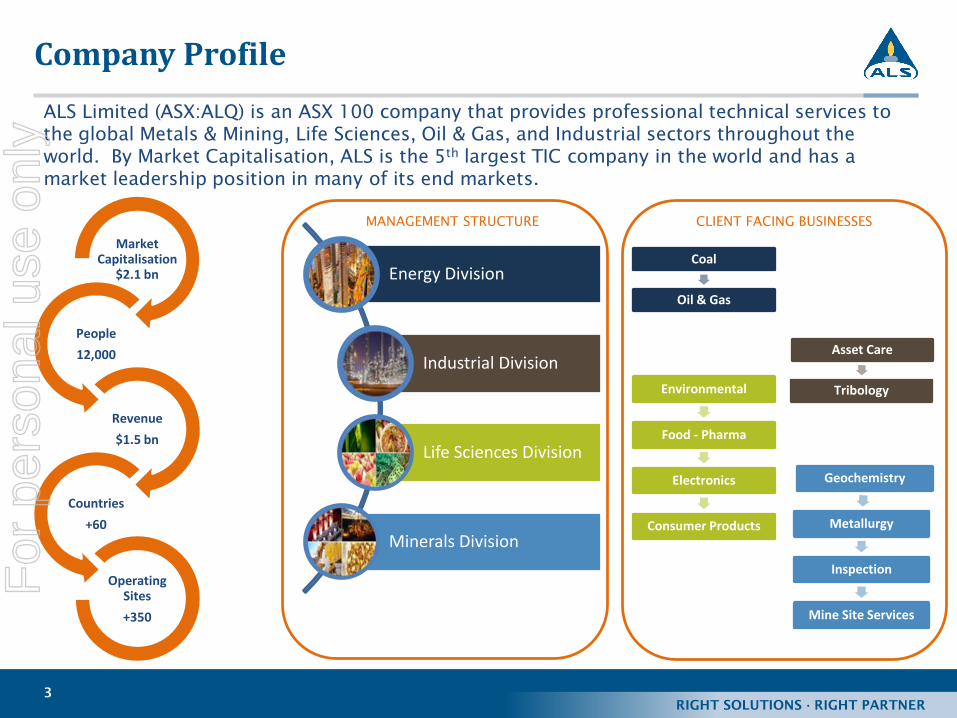
Company Profile
ALS Limited (ASX:ALQ) is an ASX 100 company that provides professional technical services to
the global Metals & Mining, Life Sciences, Oil & Gas, and Industrial sectors throughout the
world. By Market Capitalisation, ALS is the 5th
largest TIC company in the world and has a
market leadership position in many of its end markets.
Energy Division
Industrial Division
Life Sciences Division
Minerals Division
Environmental
Food - Pharma
Electronics
Consumer Products
Geochemistry
Metallurgy
Inspection
Mine Site Services
Asset Care
Tribology
Coal
Oil & Gas
Market Capitalisation
$2.1 bn
People
12,000
Revenue
$1.5 bn
Countries
+60
Operating Sites
+350
MANAGEMENT STRUCTURE CLIENT FACING BUSINESSES
For
per
sona
l use
onl
y
RIGHT SOLUTIONS · RIGHT PARTNER
4
H1 FY14
($mn)H1 FY15 ($mn)
half year Underlying1
Underlying1
Discontinued
Operations &
Impairment
Restructuring
Costs
Amortisation
of Intangibles
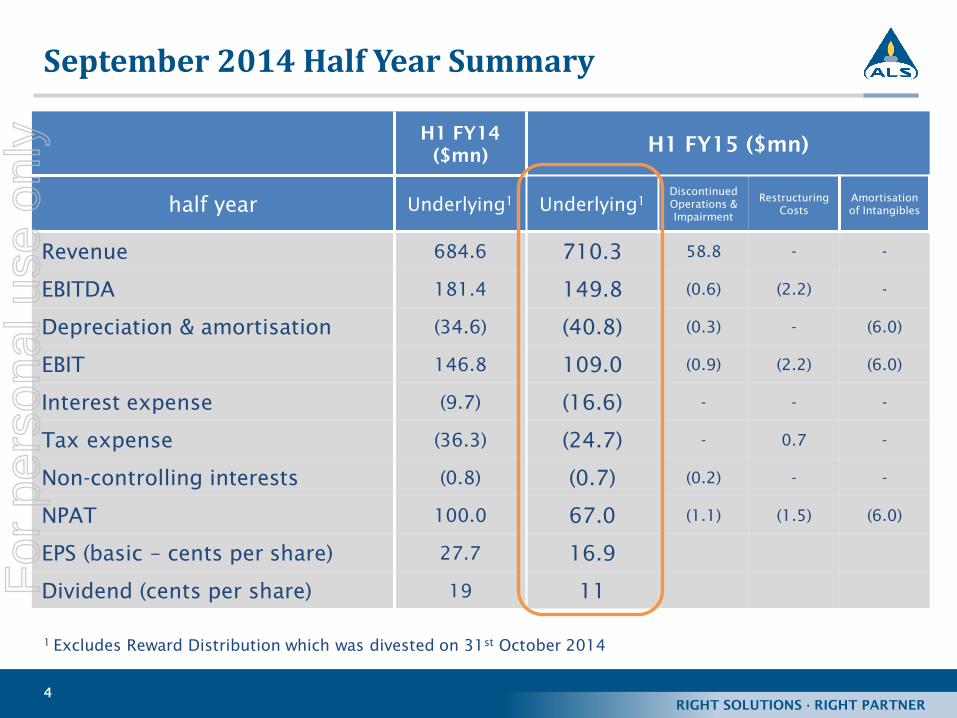
Revenue 684.6 710.3 58.8 - -
EBITDA 181.4 149.8 (0.6) (2.2) -
Depreciation & amortisation (34.6) (40.8) (0.3) - (6.0)
EBIT 146.8 109.0 (0.9) (2.2) (6.0)
Interest expense (9.7) (16.6) - - -
Tax expense (36.3) (24.7) - 0.7 -
Non-controlling interests (0.8) (0.7) (0.2) - -
NPAT 100.0 67.0 (1.1) (1.5) (6.0)
EPS (basic – cents per share) 27.7 16.9
Dividend (cents per share) 19 11
September 2014 Half Year Summary
1 Excludes Reward Distribution which was divested on 31
stOctober 2014
For
per
sona
l use
onl
y

RIGHT SOLUTIONS · RIGHT PARTNER
5
Third Quarter (Dec-14) Performance
ASX Release – 24th
November 2014
“After tax group net profit for the December 2014 quarter is expected to be
approximately $40 million. This represents an improvement in performance
over each of the first two quarters ($30.0 million and $37.7 million) of the
current financial year.”
0
10
20
30
40
50
60
Q1 (Jun) Q2 (Sep) Q3 (Dec) Q4 (Mar)
Underlying N
PA
T ($ m
illion)
FY 2014 FY 2015 FY 2015 guidance
Q3 – outperformed guidance by 15%
For
per
sona
l use
onl
y
RIGHT SOLUTIONS · RIGHT PARTNER
6
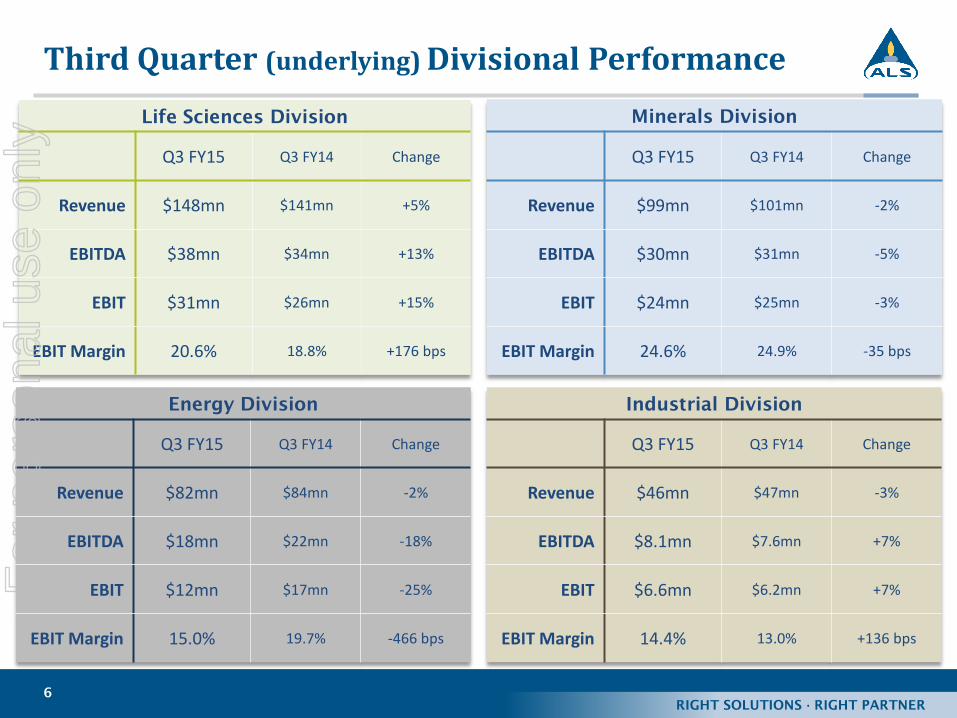
Energy Division
Q3 FY15 Q3 FY14 Change
Revenue $82mn $84mn -2%
EBITDA $18mn $22mn -18%
EBIT $12mn $17mn -25%
EBIT Margin 15.0% 19.7% -466 bps
Third Quarter (underlying) Divisional Performance
Minerals Division
Q3 FY15 Q3 FY14 Change
Revenue $99mn $101mn -2%
EBITDA $30mn $31mn -5%
EBIT $24mn $25mn -3%
EBIT Margin 24.6% 24.9% -35 bps
Life Sciences Division
Q3 FY15 Q3 FY14 Change
Revenue $148mn $141mn +5%
EBITDA $38mn $34mn +13%
EBIT $31mn $26mn +15%
EBIT Margin 20.6% 18.8% +176 bps
Industrial Division
Q3 FY15 Q3 FY14 Change
Revenue $46mn $47mn -3%
EBITDA $8.1mn $7.6mn +7%
EBIT $6.6mn $6.2mn +7%
EBIT Margin 14.4% 13.0% +136 bps
For
per
sona
l use
onl
y
RIGHT SOLUTIONS · RIGHT PARTNER
7
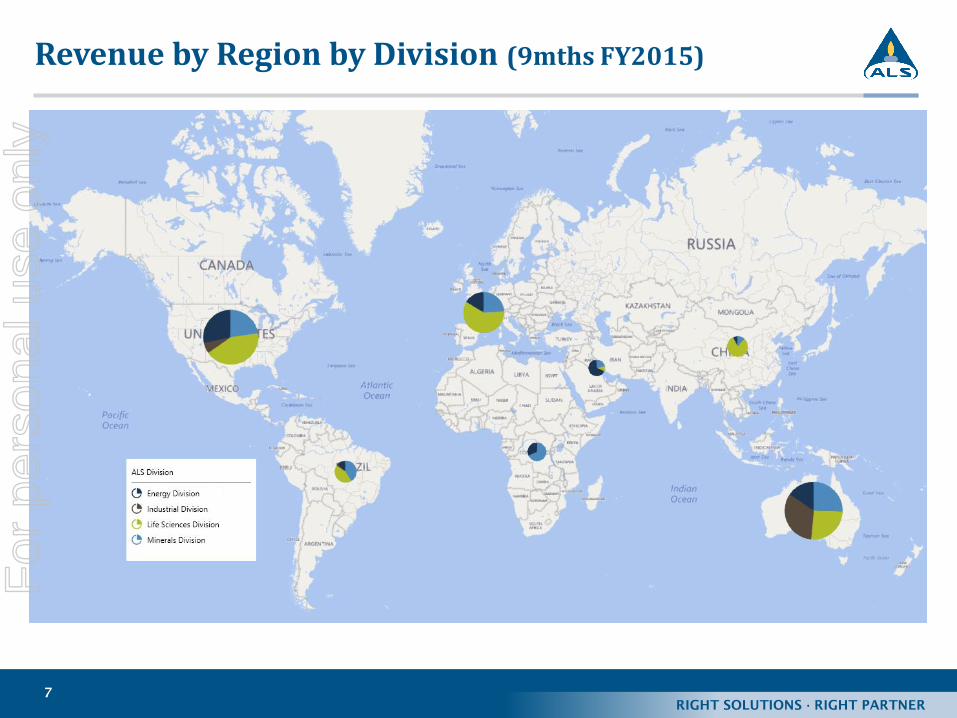
Revenue by Region by Division (9mths FY2015)F
or p
erso
nal u
se o
nly
RIGHT SOLUTIONS · RIGHT PARTNER
8
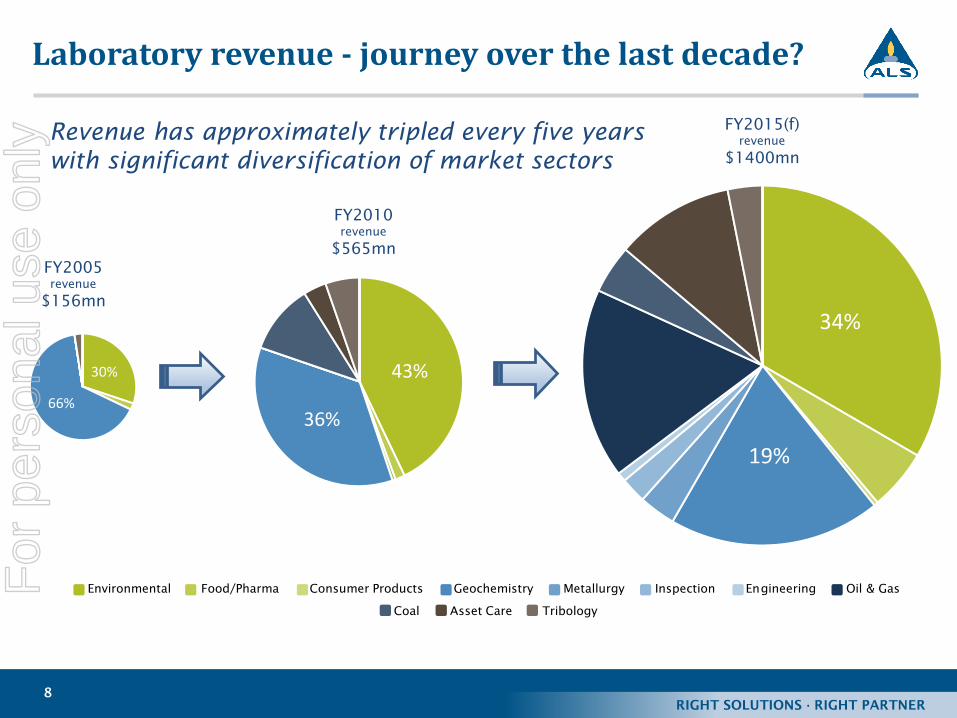
34%
19%
Environmental Food/Pharma Consumer Products Geochemistry Metallurgy Inspection Engineering Oil & Gas
Coal Asset Care Tribology
43%
36%
30%
66%
FY2005
revenue
$156mn
FY2010
revenue
$565mn
FY2015(f)
revenue
$1400mn
Laboratory revenue - journey over the last decade?
Revenue has approximately tripled every five years
with significant diversification of market sectors
For
per
sona
l use
onl
y
RIGHT SOLUTIONS · RIGHT PARTNER
9
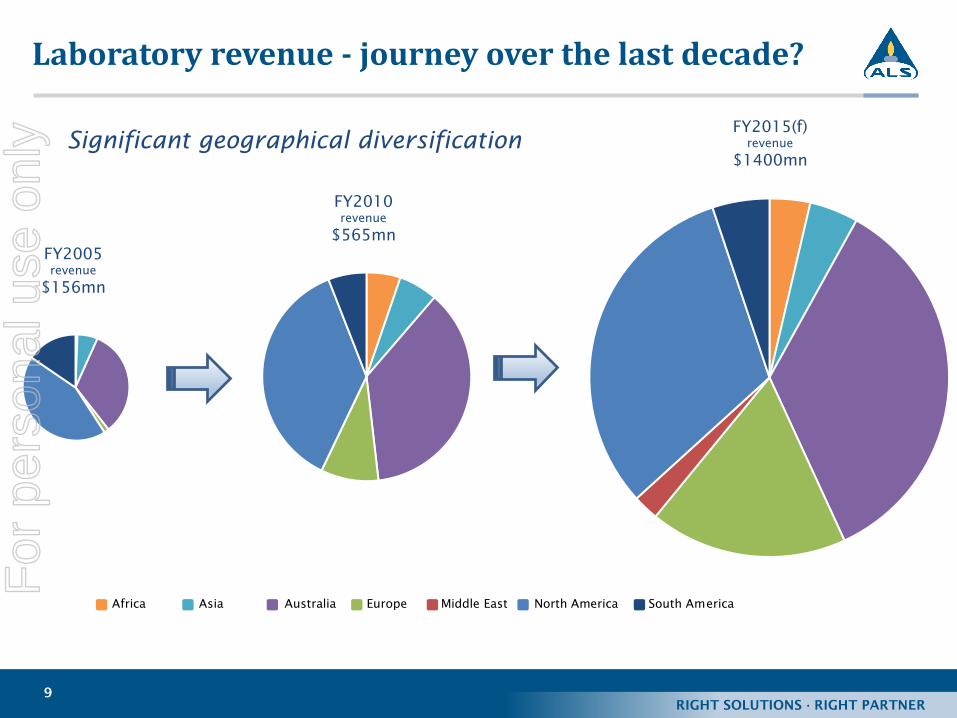
Africa Asia Australia Europe Middle East North America South America
Significant geographical diversification
FY2005
revenue
$156mn
FY2010
revenue
$565mn
FY2015(f)
revenue
$1400mn
Laboratory revenue - journey over the last decade?F
or p
erso
nal u
se o
nly
RIGHT SOLUTIONS · RIGHT PARTNER
10
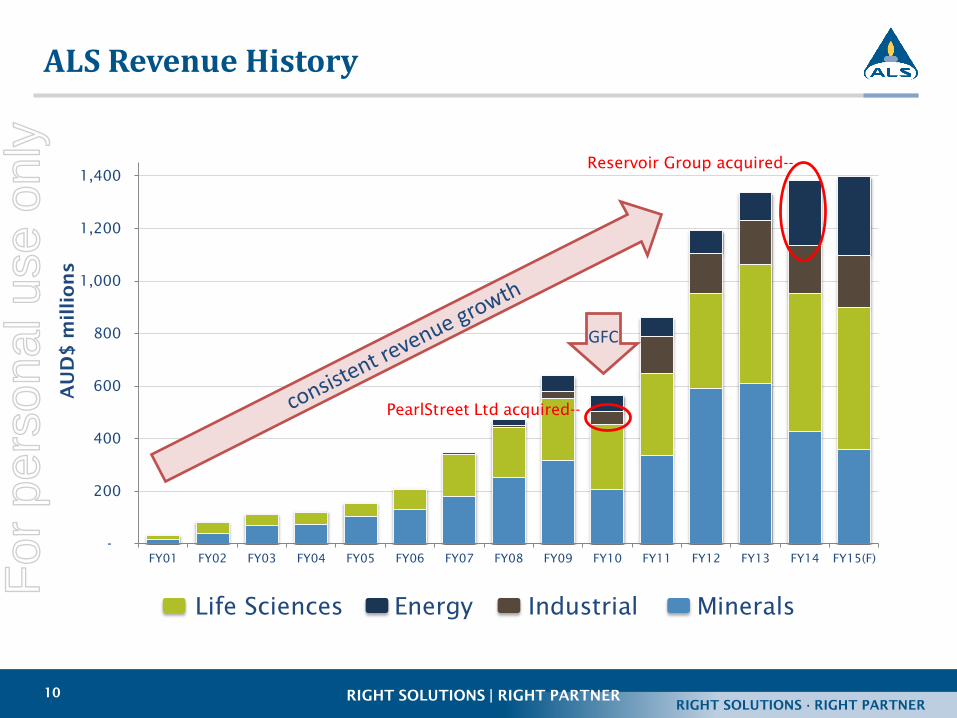
-
200
400
600
800
1,000
1,200
1,400
FY01 FY02 FY03 FY04 FY05 FY06 FY07 FY08 FY09 FY10 FY11 FY12 FY13 FY14 FY15(F)
AU
D$
m
illio
ns
Reservoir Group acquired--
RIGHT SOLUTIONS | RIGHT PARTNER
Life Sciences Energy Industrial Minerals
ALS Revenue History
PearlStreet Ltd acquired--
GFC
For
per
sona
l use
onl
y
RIGHT SOLUTIONS · RIGHT PARTNER
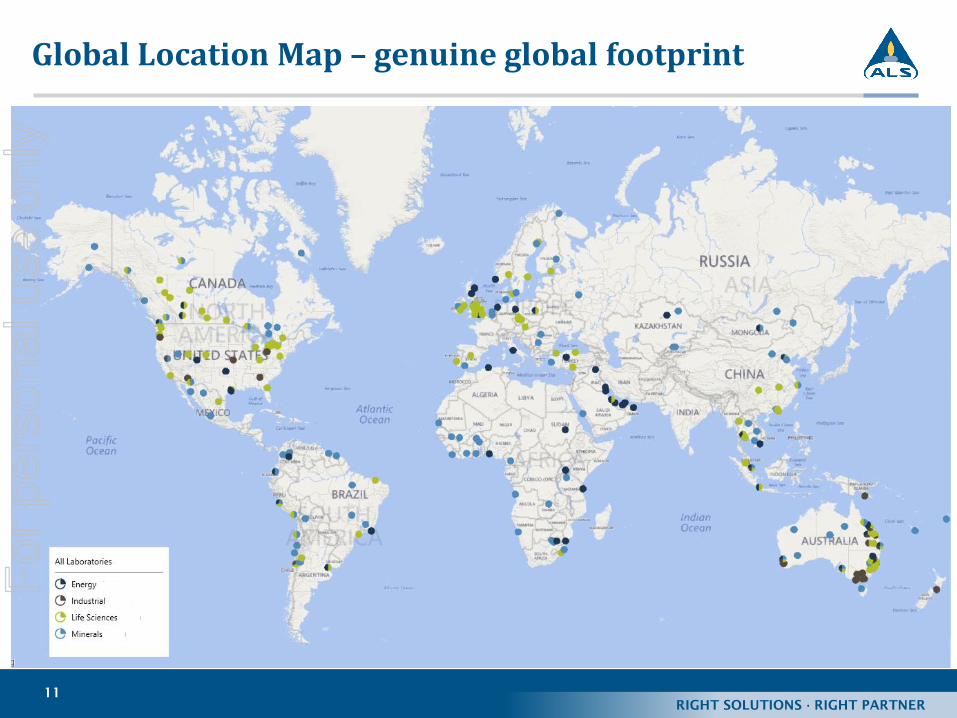
11
Global Location Map – genuine global footprintF
or p
erso
nal u
se o
nly
RIGHT SOLUTIONS · RIGHT PARTNER
12
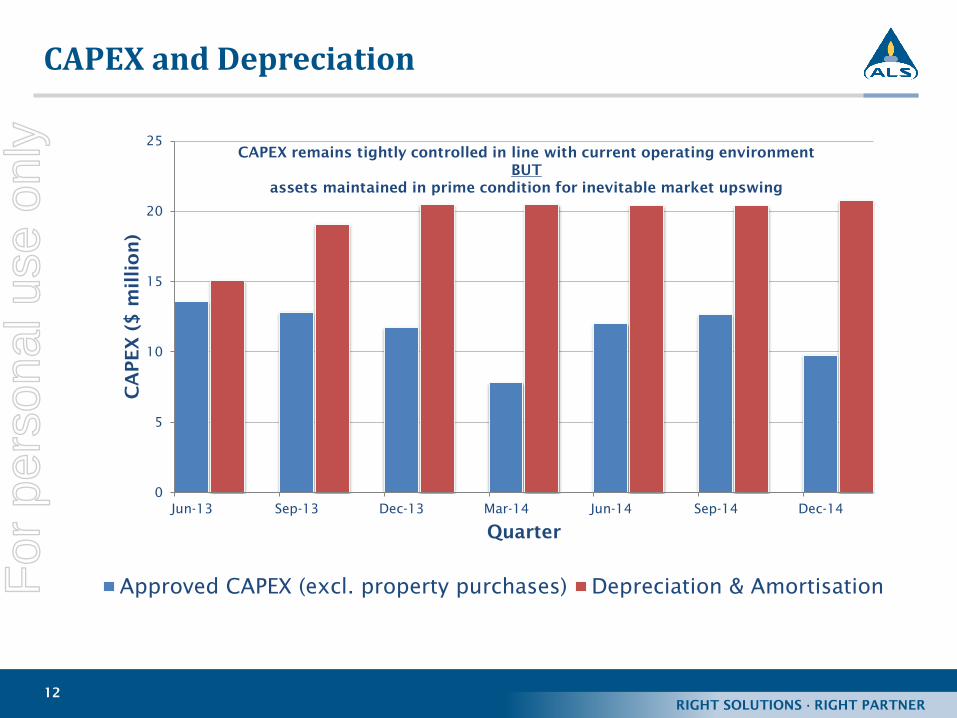
0
5
10
15
20
25
Jun-13 Sep-13 Dec-13 Mar-14 Jun-14 Sep-14 Dec-14
CA
PEX
($
m
illio
n)
Quarter
Approved CAPEX (excl. property purchases) Depreciation & Amortisation
CAPEX remains tightly controlled in line with current operating environment
BUT
assets maintained in prime condition for inevitable market upswing
CAPEX and DepreciationF
or p
erso
nal u
se o
nly
RIGHT SOLUTIONS · RIGHT PARTNER
13
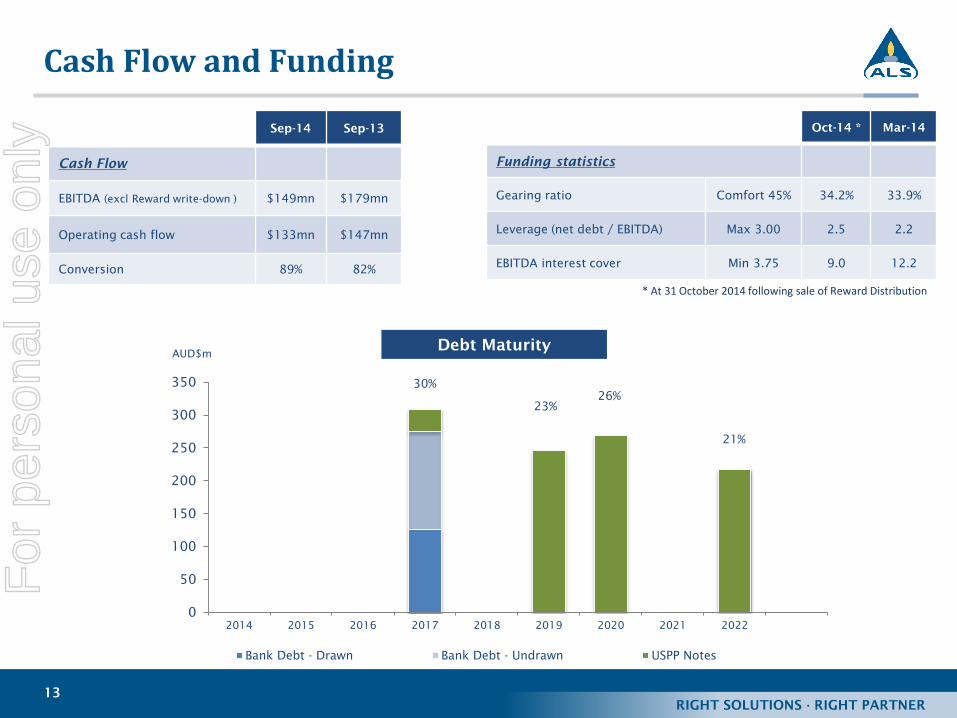
Sep-14 Sep-13
Cash Flow
EBITDA (excl Reward write-down ) $149mn $179mn
Operating cash flow $133mn $147mn
Conversion 89% 82%
0
50
100
150
200
250
300
350
2014 2015 2016 2017 2018 2019 2020 2021 2022
AUD$m
Bank Debt - Drawn Bank Debt - Undrawn USPP Notes
Debt Maturity
30%
23%
26%
21%
Cash Flow and Funding
Oct-14 * Mar-14
Funding statistics
Gearing ratio Comfort 45% 34.2% 33.9%
Leverage (net debt / EBITDA) Max 3.00 2.5 2.2
EBITDA interest cover Min 3.75 9.0 12.2
* At 31 October 2014 following sale of Reward Distribution
For
per
sona
l use
onl
y
RIGHT SOLUTIONS · RIGHT PARTNER
14
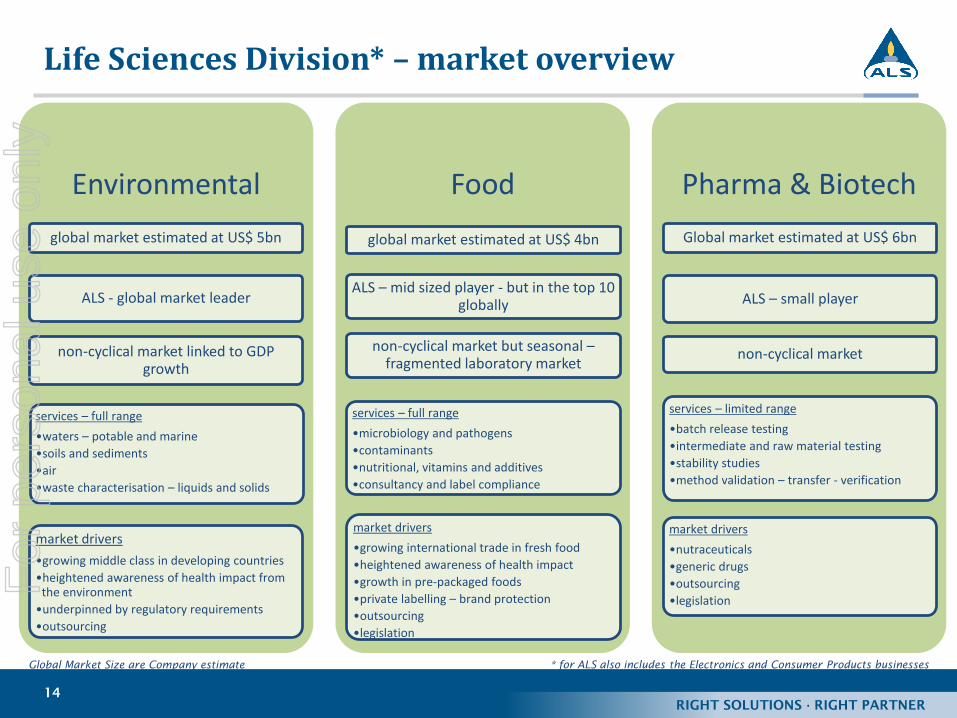
Life Sciences Division* – market overview
Environmental
global market estimated at US$ 5bn
ALS - global market leader
non-cyclical market linked to GDP growth
services – full range
•waters – potable and marine
•soils and sediments
•air
•waste characterisation – liquids and solids
market drivers
•growing middle class in developing countries
•heightened awareness of health impact from the environment
•underpinned by regulatory requirements
•outsourcing
Food
global market estimated at US$ 4bn
ALS – mid sized player - but in the top 10 globally
non-cyclical market but seasonal –fragmented laboratory market
services – full range
•microbiology and pathogens
•contaminants
•nutritional, vitamins and additives
•consultancy and label compliance
market drivers
•growing international trade in fresh food
•heightened awareness of health impact
•growth in pre-packaged foods
•private labelling – brand protection
•outsourcing
•legislation
Pharma & Biotech
Global market estimated at US$ 6bn
ALS – small player
non-cyclical market
services – limited range
•batch release testing
•intermediate and raw material testing
•stability studies
•method validation – transfer - verification
market drivers
•nutraceuticals
•generic drugs
•outsourcing
•legislation
Global Market Size are Company estimate * for ALS also includes the Electronics and Consumer Products businesses
For
per
sona
l use
onl
y
RIGHT SOLUTIONS · RIGHT PARTNER
15
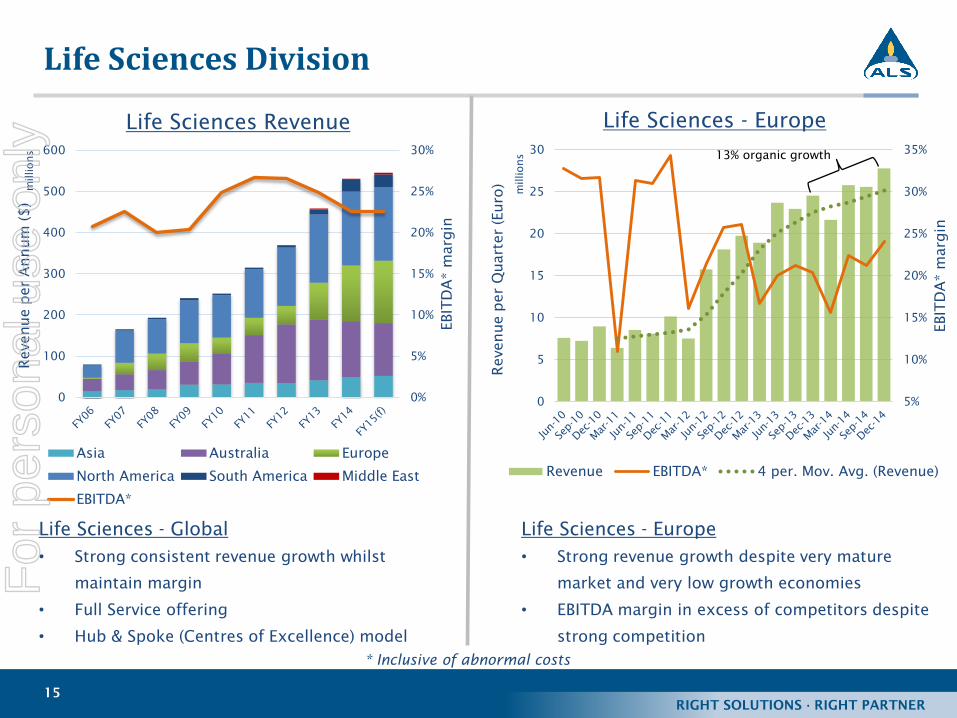
Life Sciences Division
0%
5%
10%
15%
20%
25%
30%
0
100
200
300
400
500
600
EBITD
A* m
argin
Revenue per A
nnum
($
)
Life Sciences Revenue
Asia Australia Europe
North America South America Middle East
EBITDA*
Life Sciences - Global
• Strong consistent revenue growth whilst
maintain margin
• Full Service offering
• Hub & Spoke (Centres of Excellence) model
5%
10%
15%
20%
25%
30%
35%
0
5
10
15
20
25
30
EBITD
A* m
argin
Revenue per Q
uarter (Euro)
millions
Life Sciences - Europe
Revenue EBITDA* 4 per. Mov. Avg. (Revenue)
13% organic growth
Life Sciences - Europe
• Strong revenue growth despite very mature
market and very low growth economies
• EBITDA margin in excess of competitors despite
strong competition
millions
* Inclusive of abnormal costs
For
per
sona
l use
onl
y
RIGHT SOLUTIONS · RIGHT PARTNER
16
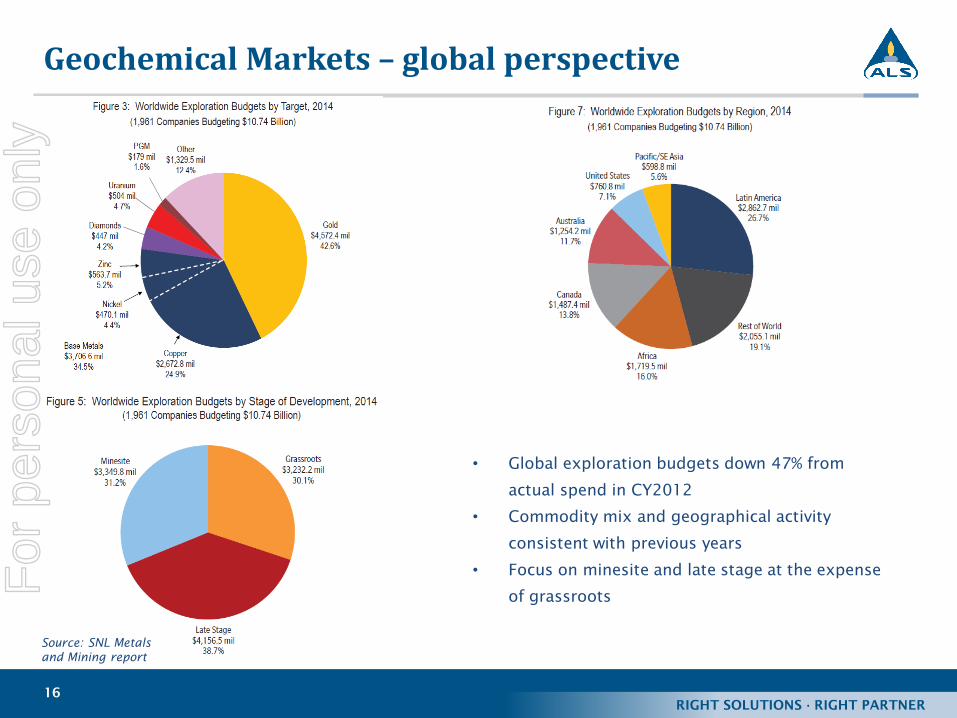
Geochemical Markets – global perspective
Source: SNL Metals
and Mining report
• Global exploration budgets down 47% from
actual spend in CY2012
• Commodity mix and geographical activity
consistent with previous years
• Focus on minesite and late stage at the expense
of grassroots
For
per
sona
l use
onl
y
RIGHT SOLUTIONS · RIGHT PARTNER
17
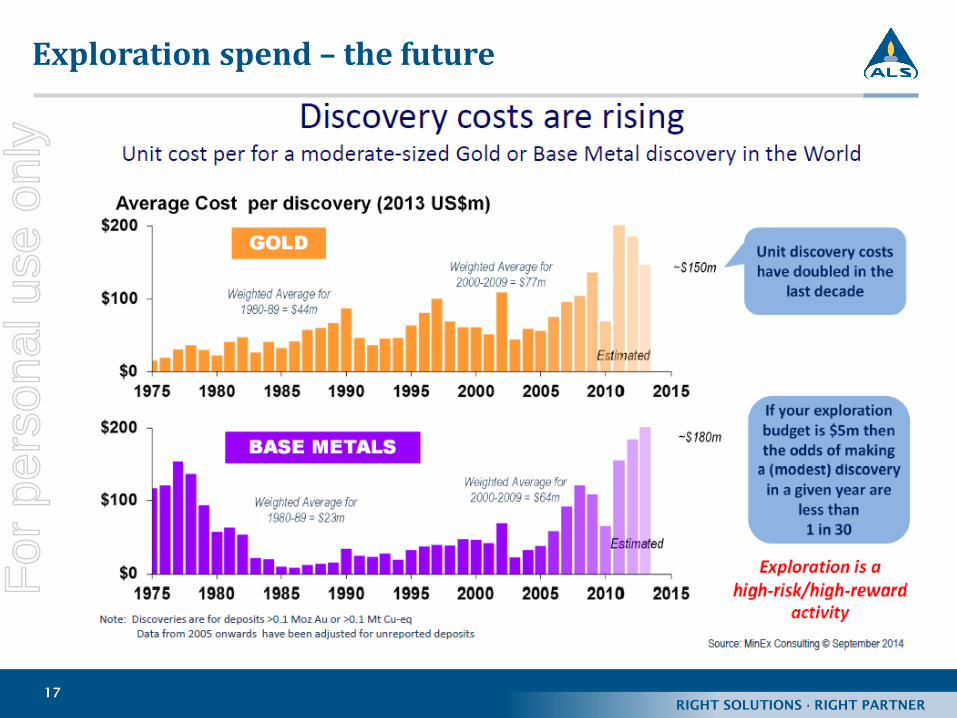
Exploration spend – the futureF
or p
erso
nal u
se o
nly

RIGHT SOLUTIONS · RIGHT PARTNER
18
Discoveries Versus SpendF
or p
erso
nal u
se o
nly
RIGHT SOLUTIONS · RIGHT PARTNER
19
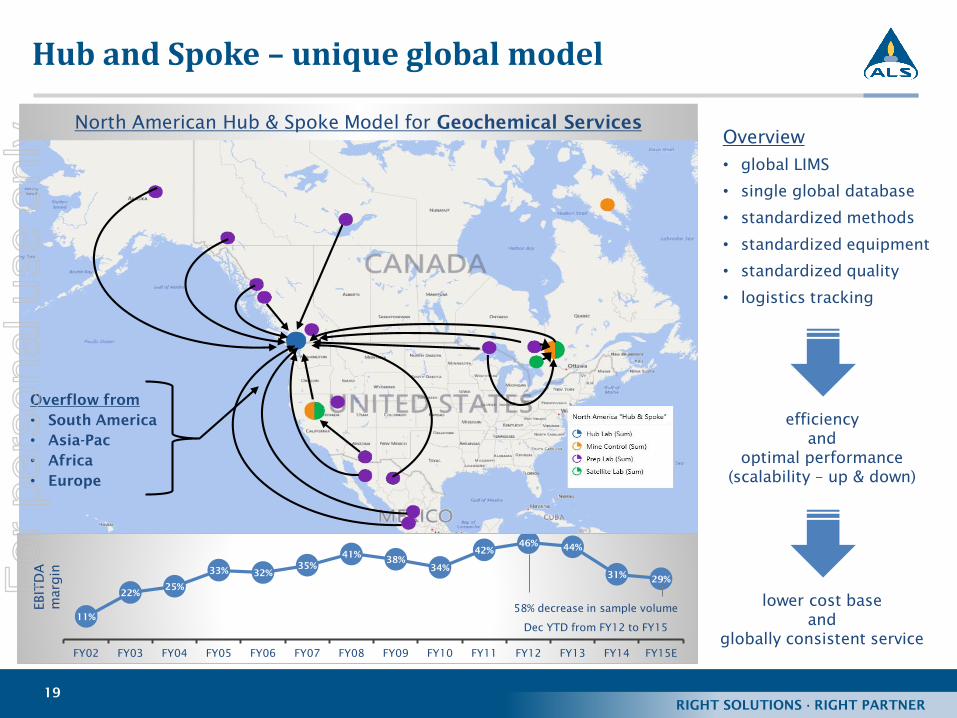
Hub and Spoke – unique global model
Overview
• global LIMS
• single global database
• standardized methods
• standardized equipment
• standardized quality
• logistics tracking
North American Hub & Spoke Model for Geochemical Services
efficiency
and
optimal performance
(scalability – up & down)
Overflow from
• South America
• Asia-Pac
• Africa
• Europe
lower cost base
and
globally consistent service
11%
22%25%
33% 32%
35%
41%38%
34%
42%
46%44%
31%29%
FY02 FY03 FY04 FY05 FY06 FY07 FY08 FY09 FY10 FY11 FY12 FY13 FY14 FY15E
EBITD
A
margin
58% decrease in sample volume
Dec YTD from FY12 to FY15
For
per
sona
l use
onl
y
RIGHT SOLUTIONS · RIGHT PARTNER
20
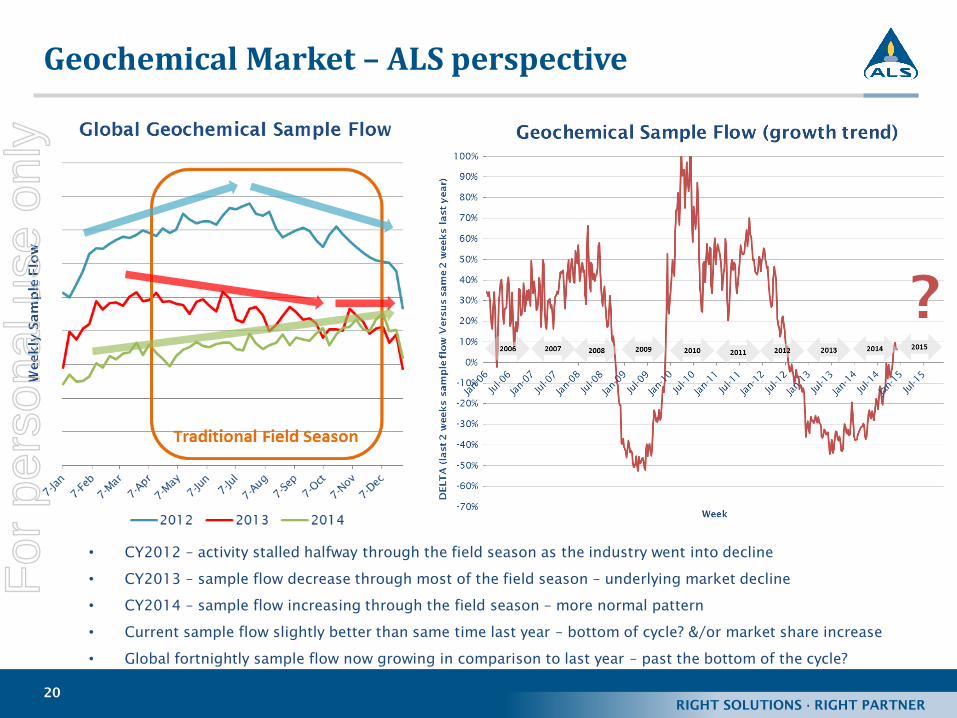
Geochemical Market – ALS perspective
• CY2012 – activity stalled halfway through the field season as the industry went into decline
• CY2013 – sample flow decrease through most of the field season – underlying market decline
• CY2014 – sample flow increasing through the field season – more normal pattern
• Current sample flow slightly better than same time last year – bottom of cycle? &/or market share increase
• Global fortnightly sample flow now growing in comparison to last year – past the bottom of the cycle?
?
For
per
sona
l use
onl
y
RIGHT SOLUTIONS · RIGHT PARTNER
21
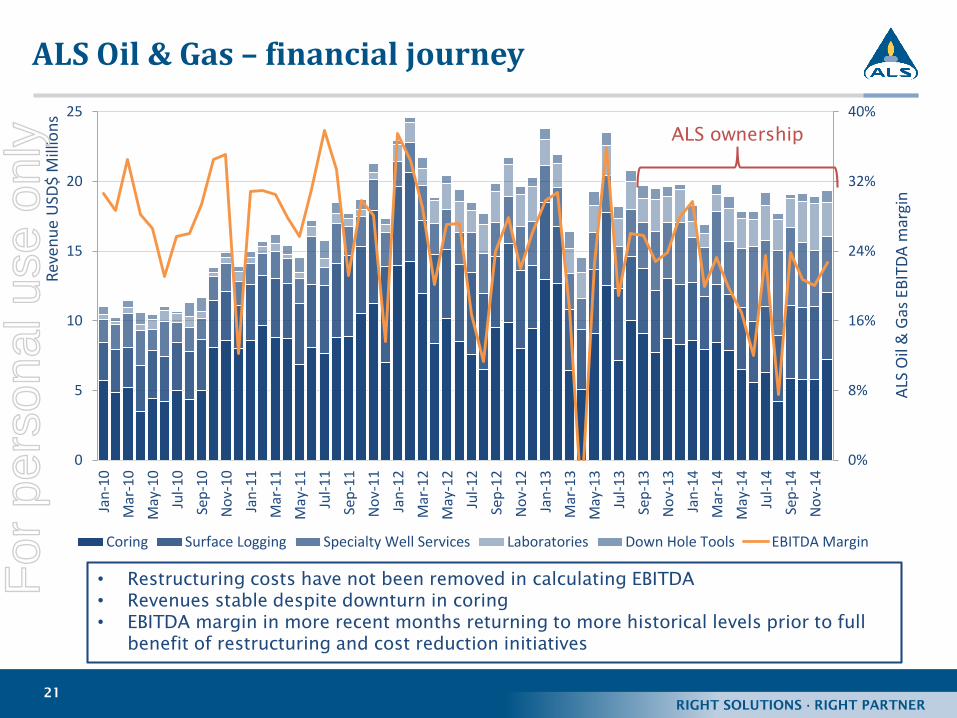
ALS Oil & Gas – financial journey
0%
8%
16%
24%
32%
40%
0
5
10
15
20
25Ja
n-1
0
Mar
-10
May
-10
Jul-
10
Sep
-10
No
v-10
Jan
-11
Mar
-11
May
-11
Jul-
11
Sep
-11
No
v-11
Jan
-12
Mar
-12
May
-12
Jul-
12
Sep
-12
No
v-12
Jan
-13
Mar
-13
May
-13
Jul-
13
Sep
-13
No
v-13
Jan
-14
Mar
-14
May
-14
Jul-
14
Sep
-14
No
v-14
ALS
Oil
& G
as E
BIT
DA
mar
gin
Rev
enu
e U
SD$
Mill
ion
s
Coring Surface Logging Specialty Well Services Laboratories Down Hole Tools EBITDA Margin
• Restructuring costs have not been removed in calculating EBITDA
• Revenues stable despite downturn in coring
• EBITDA margin in more recent months returning to more historical levels prior to full
benefit of restructuring and cost reduction initiatives
ALS ownership
For
per
sona
l use
onl
y
RIGHT SOLUTIONS · RIGHT PARTNER
22
ALS Oil & Gas – operational journey
• All business stream (coring, surface logging, specialty well services, laboratories, down
hole tools) global managers relocated to Houston Texas – effective September 2014
• Reservoir Group Corporate office in Aberdeen closed – effective December 2014
• Reservoir Group Corporate office in Houston closed - effective November 2013
• Previous CEO of ALS Oil & Gas exited – effective August 2014
• North American support services integrated into ALS resources – effective October 2014
• Global Mobility Policy in place – effective August 2014
• Rationalised facilities and “right sized” businesses – effective December 2014
• Relocated Surface Logging business into new 40,000 sq. ft. building in Houston –
effective January 2014
• Control Room built in Houston for remote control surface logging initiative – July 2014
• Purchase of a 40,000 sq. ft. building in Houston to house hub laboratory – January 2015
• Development plans for hub laboratory in Houston now finalised – expected to be
operational in August 2015
• Oil & Gas laboratory LIMS & Client Portal 40% completed – December 2014. Full
completion by August 2015
• Five key technical staff recruited for Houston laboratory – September 2014
• Global ALS financial portal customised and fully adopted by all business streams –
effective April 2014
• All sites on ALS global IT network – completed August 2014
• New strategic development three year plans in place for all business streams – effective
November 2014
• Stronger profit performance in 3rd
quarter compared to the 1st
and 2nd
quarters
For
per
sona
l use
onl
y
RIGHT SOLUTIONS · RIGHT PARTNER
23
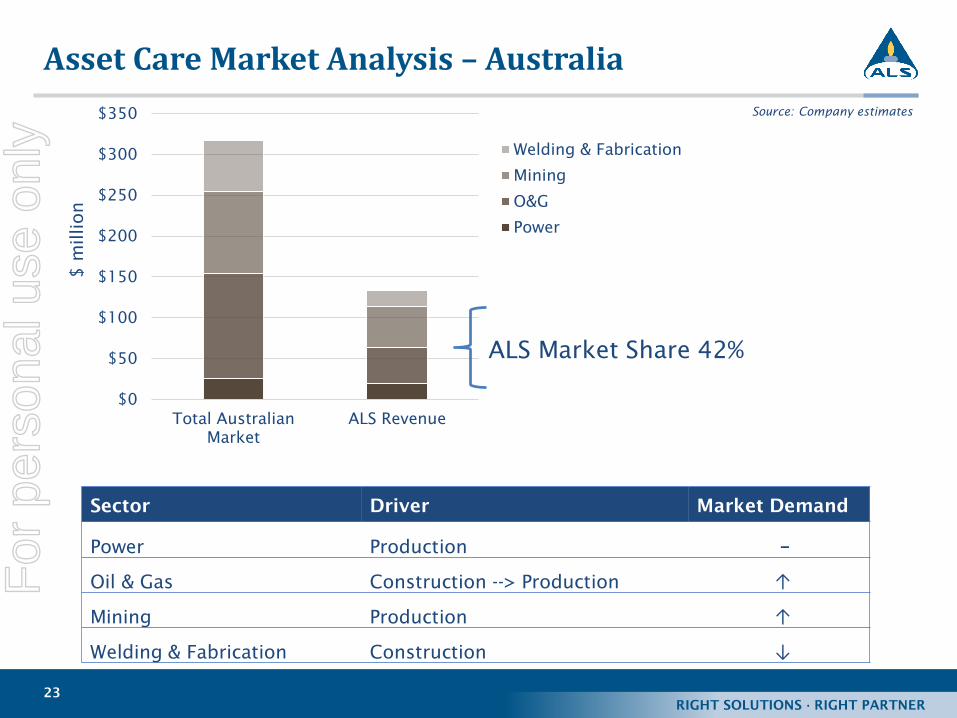
Asset Care Market Analysis – Australia
Source: Company estimates
Sector Driver Market Demand
Power Production −
Oil & Gas Construction --> Production ↑
Mining Production ↑
Welding & Fabrication Construction ↓
$0
$50
$100
$150
$200
$250
$300
$350
Total Australian
Market
ALS Revenue
$ m
illion
Welding & Fabrication
Mining
O&G
Power
ALS Market Share 42%
For
per
sona
l use
onl
y

RIGHT SOLUTIONS · RIGHT PARTNER
24
• Assets
• State of the art laboratories
• High end technical services
• Unique service offerings
• Operating Model
• Hub and spoke
• Centres of Excellence
• Systems and standards
• “Decentralised” laboratory Vs many laboratories
• Low cost base
• Client focus
• People
• Training
• Passion
• Culture
• Loyalty
• Innovative
• Entrepreneurial
• Communication
• Strategy
• Long-term horizon
• Focus
• Execution
• Disciplined investment model
What makes ALS differentF
or p
erso
nal u
se o
nly

RIGHT SOLUTIONS · RIGHT PARTNER
25
• Management Information Systems (MIS)
• LIMS
• GEMS – Geochemical
• Coal8 – Coal
• EnviroLIMS – Environmental
• SAM – Tribology
• ELMS – Food
• OSPrey – Asset Care
• Pipeline – Oil & Gas
• Webview – Management Interface
• WebTrieveTM
• Other Portals
• iLEAD – training
• EPC – succession planning
• Compliance
• Financial – TM1
• CAPEX
• Safety Tracking
• Human Resources
• Business stream SharePoint sites
• Support group SharePoint sites
What makes ALS differentskills
train
ing and
know
ledge sharin
g
For
per
sona
l use
onl
y


![[47] Strain wave gearing design system wave gearing...167 AMTEC [47] Strain wave gearing design system Fig.47.1 Strain wave gearing design system 47.1 Overview Strain wave gearing](https://static.fdocuments.us/doc/165x107/5e356487029e073cbd586fdc/47-strain-wave-gearing-design-wave-gearing-167-amtec-47-strain-wave-gearing.jpg)