Europcar Mobility Group...The document has been prepared by Europcar Mobility Group (the...
47
Europcar Mobility Group H1 2018 Achievements and Results 1
Transcript of Europcar Mobility Group...The document has been prepared by Europcar Mobility Group (the...

Europcar Mobility GroupH1 2018 Achievements and Results
1

LEGAL DISCLAIMER & CONTACTS
2
The document has been prepared by Europcar Mobility Group (the “Company”). Recipients should conduct and will be solely responsible for their own investigations andanalysis of the Company. This presentation does not contain or constitute an offer of securities for sale or an invitation to invest in securities in France, the United States or anyother jurisdiction.None of the Company nor its respective employees or officers, makes any representation or warranty, express or implied, as to the accuracy, relevance and/or completeness ofthe document or any information, forward-looking statements contained herein and the Company shall not incur any liability for the information contained in, or any omissionsfrom, the document.
Forward-looking statements are statements that are not historical facts. These statements may include projections and estimates and their underlying assumptions, statementsregarding plans, objectives, intentions and expectations with respect to future financial results, events, operations, services, product development and potential, andstatements regarding future performance or events. Forward looking statements are generally identified by the words "expects", "anticipates", "believes", "intends", "estimates","plans", “projects”, “may”, “would” “should” and similar expressions. Forward-looking statements are based on the Company management's current expectations or beliefs on orabout the date of the document but are not guarantees of future performance and are subject to inherent risks, uncertainties (including without limitation, risks identified in the"Risk factors" section of the Annual Registration Document filed with the Autorité des marchés financiers and also available on the Company's website: www.europcar-group.com) and assumptions about Europcar Mobility Group and its subsidiaries and investments, trends in their business, future capital expenditures and acquisitions,developments in respect of contingent liabilities, changes in economic conditions globally or in Europcar Mobility Group’s principal markets, competitive conditions in the marketand regulatory factors. Those events are uncertain; their outcome may differ from current expectations which may in turn materially affect expected results. Actual results maydiffer materially from those projected or implied in these forward-looking statements. Other than as required by applicable law, the Company does not undertake to revise orupdate any forward-looking statements in light of new information or future events.
INVESTOR RELATIONS Olivier Gernandt +33.1.80.20.91.81 [email protected] Relations +33.1.80.20.92.65 [email protected]
For all financial or business information, please refer to our IR website at: https://investors.europcar-group.com/

AGENDA
H1 KEY ACHIEVEMENTS
H1 & Q2 FINANCIAL RESULTS
2018 GUIDANCE & OUTLOOK
Q&A SESSION
1
2
3
4
3

H1 key achievements1
4

H1 2018 CONFIRMED THE RELEVANCE OF OUR DIVERSIFICATION
STRATEGY AND OUR BU ORGANISATION , ON OUR HISTORICAL CAR RENTAL BUSINESS
AS WELL AS ON NEW MOBILITY .
‘‘‘‘
54

• Our Group name change and the relocation of our global HQ , both reflecting ourtransformation, marked a new phase in ourdevelopment.
• H1 Achievements in our BUs demonstrate thatwe have chosen the right, ad hoc organisation to change our Group’s profile, as proven by the successful integration of Goldcar.
• During H1, we also kicked off strategicprograms that are key to improve the customer experience and thus deliver highervalue.
• Our tailored, robust and flexible fleetfinancing structure supported these steps.
KEY FACTS
65

From a car rental pure playerto a « mobility service company », offering attractive alternative solutions to vehicle ownership.
ON MAY 22nd, WE ADOPTED A NEW
NAME FOR OUR GROUPTO BETTER REFLECT
OUR TRANSFORMATION
76

VEHICLE RENTAL SERVICES NEW MOBILITY SOLUTIONS
OUR NEW NAME CONNECTS ALL OUR BRANDS AND POSITIONS OUR GROUP AS A GLOBAL MOBILITY SOLUTIONS PROVIDER
87

H1 ACHIEVEMENTS IN ALL BUSINESS UNITS DEMONSTRATE THAT WE NOW HAVE THE RIGHT BUSINESS PORTFOLIO TO GENERATE SUSTAINABLE GROWTH
LOW COST INTL’ COVERAGENEW MOBILITYVANS & TRUCKSCARS
Reinforce our #1 position in Europe
Expand globally EuropcarMobility Group services
Address new usages
Become #1 in Europe
Reinforce our #1 position in Europe
COUNTRIES / MARKETS : NETWORK
GROUP FUNCTIONS ACROSS ALL PERIMETERS
END CUSTOMER
9
+11% +49% +237% +64%H1 reportedrental revenue growth
n.m.
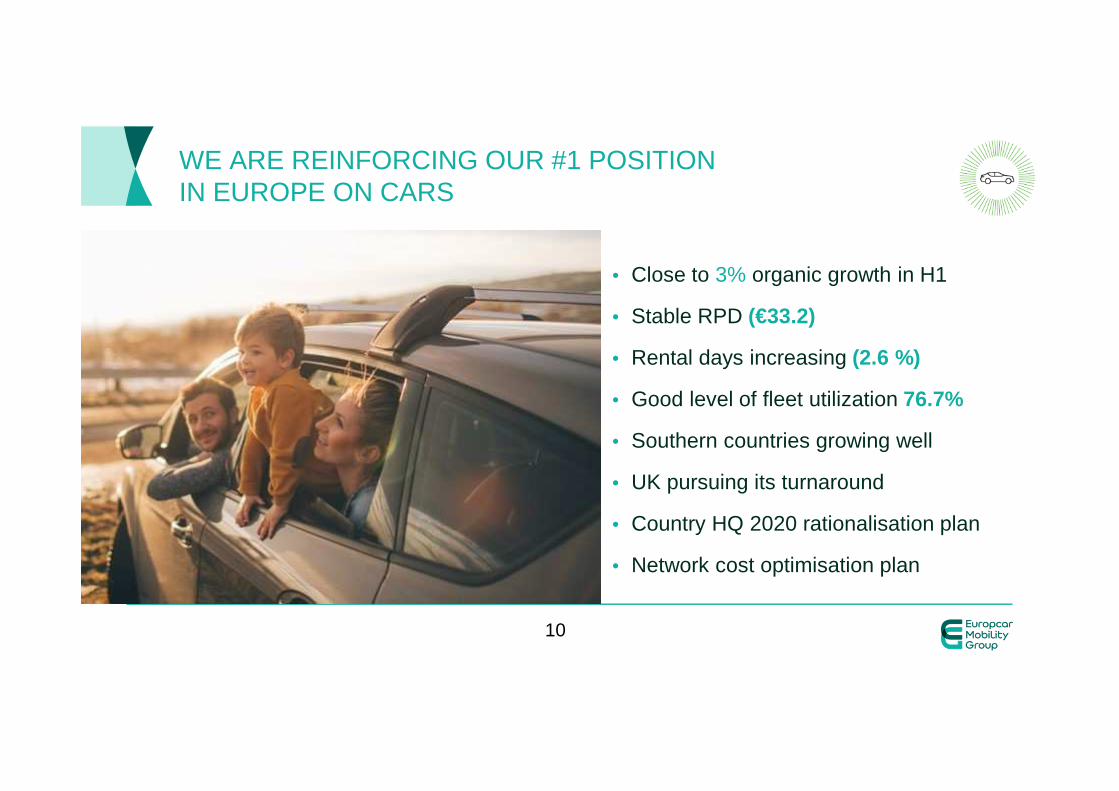
WE ARE REINFORCING OUR #1 POSITION IN EUROPE ON CARS
• Close to 3% organic growth in H1
• Stable RPD (€33.2)
• Rental days increasing (2.6 %)
• Good level of fleet utilization 76.7%
• Southern countries growing well
• UK pursuing its turnaround
• Country HQ 2020 rationalisation plan
• Network cost optimisation plan
10

ALL THIS WHILE DEVELOPING OUR CUSTOMER CENTRICITY VIA TWO KEY PROGRAMS…
DEVELOPING CUSTOMER CENTRICITY � HIGHER VALUE CREATION
• 3C: reach a level of service in our contact centersthat will help build customer loyalty and preference
• NPS 110: measure and listen to ourcustomers to identify pain points
� H1 milestone: build up a platform involvingemployees and customers to co-design solutions and services – live in Q4 2018
H1 score = 57.2up 3.2 pts YoY
11

…AND SHAPING OUR FUTURE CUSTOMER JOURNEY: ENRICHED, DIGITALIZED, SIMPLIFIED
• Click & Go program:• Kick off in June 2018• Digitalize, simplify, enrich our customer journey• First release: a mobile App for all customers
to manage their bookings whatever their booking channel
• Connected cars program:• Kick off in April 2018• Already 35.000 vehicles connected within our Group• Objective: build a platform gathering all data allowing
real time access to fleet and vehicle data
12

VANS & TRUCKS BU IS BECOMING AN ADDITIONAL GROWTH LEVER FOR OUR GROUP
• Strong 6.3% organic rental revenue growth in H1, with longer duration and higher utilisation
• An organic growth strategy focused on professionals/SMEs and deployment of “supersites”• 18 “supersites”, with positive momentum in the UK, France and
Germany during H1• Last opening of supersite in Madrid in June• Opening of Barcelona supersite planned for H2
• Integration of the Buchbinder Vans & Trucks business has proven to provide high value creation on the German market
13
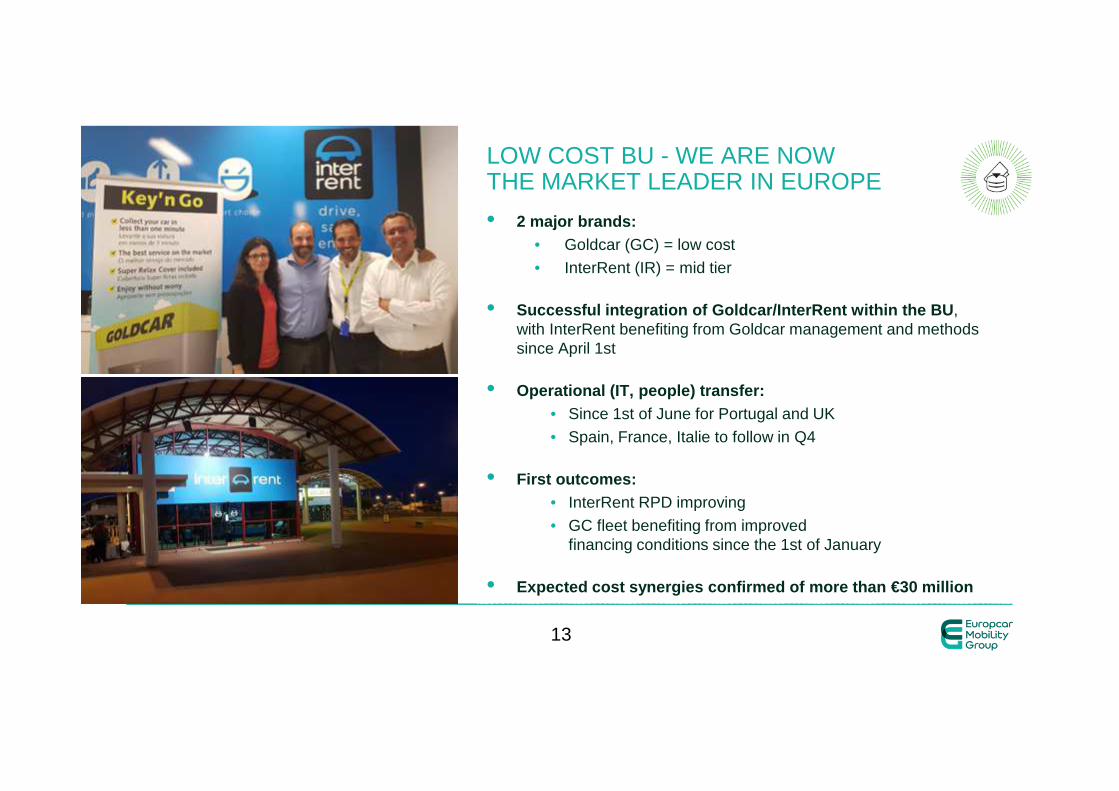
• 2 major brands: • Goldcar (GC) = low cost
• InterRent (IR) = mid tier
• Successful integration of Goldcar/InterRent within the BU, with InterRent benefiting from Goldcar management and methodssince April 1st
• Operational (IT, people) transfer:• Since 1st of June for Portugal and UK
• Spain, France, Italie to follow in Q4
• First outcomes:• InterRent RPD improving
• GC fleet benefiting from improvedfinancing conditions since the 1st of January
• Expected cost synergies confirmed of more than €30 mill ion
LOW COST BU - WE ARE NOW THE MARKET LEADER IN EUROPE
1413
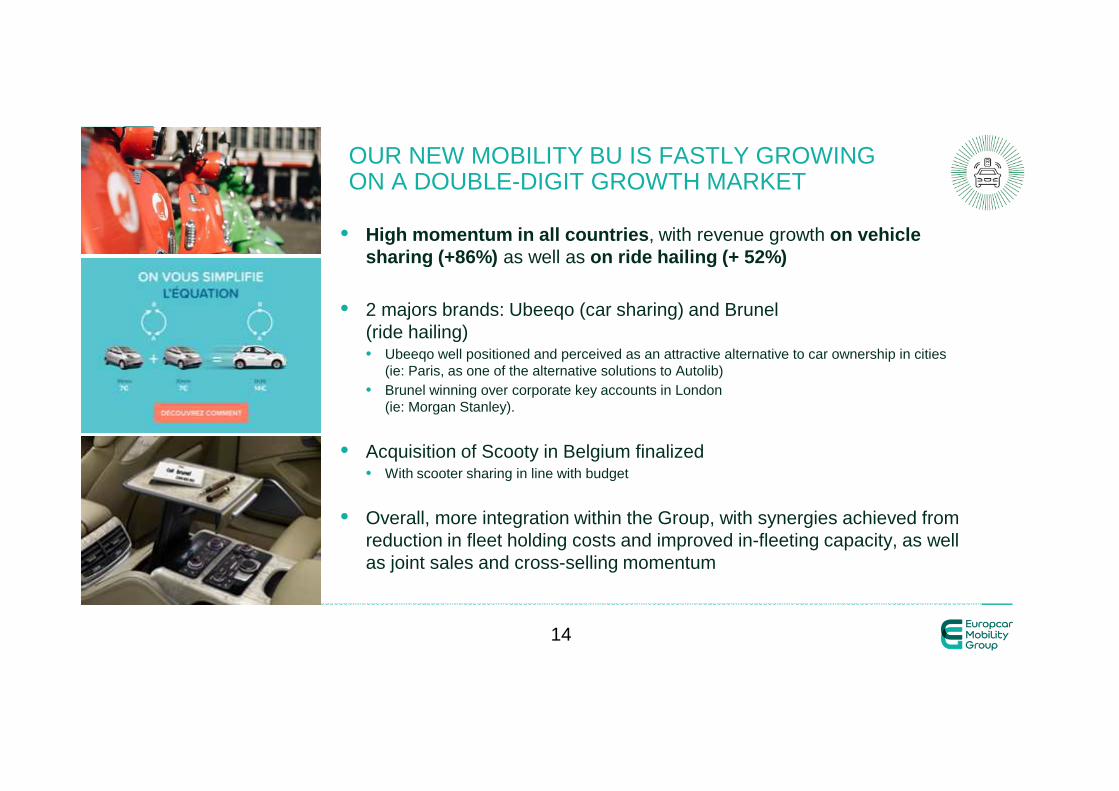
• High momentum in all countries , with revenue growth on vehiclesharing (+86%) as well as on ride hailing (+ 52%)
• 2 majors brands: Ubeeqo (car sharing) and Brunel(ride hailing)• Ubeeqo well positioned and perceived as an attractive alternative to car ownership in cities
(ie: Paris, as one of the alternative solutions to Autolib)• Brunel winning over corporate key accounts in London
(ie: Morgan Stanley).
• Acquisition of Scooty in Belgium finalized • With scooter sharing in line with budget
• Overall, more integration within the Group, with synergies achieved from reduction in fleet holding costs and improved in-fleeting capacity, as well as joint sales and cross-selling momentum
OUR NEW MOBILITY BU IS FASTLY GROWING ON A DOUBLE-DIGIT GROWTH MARKET
1514
16
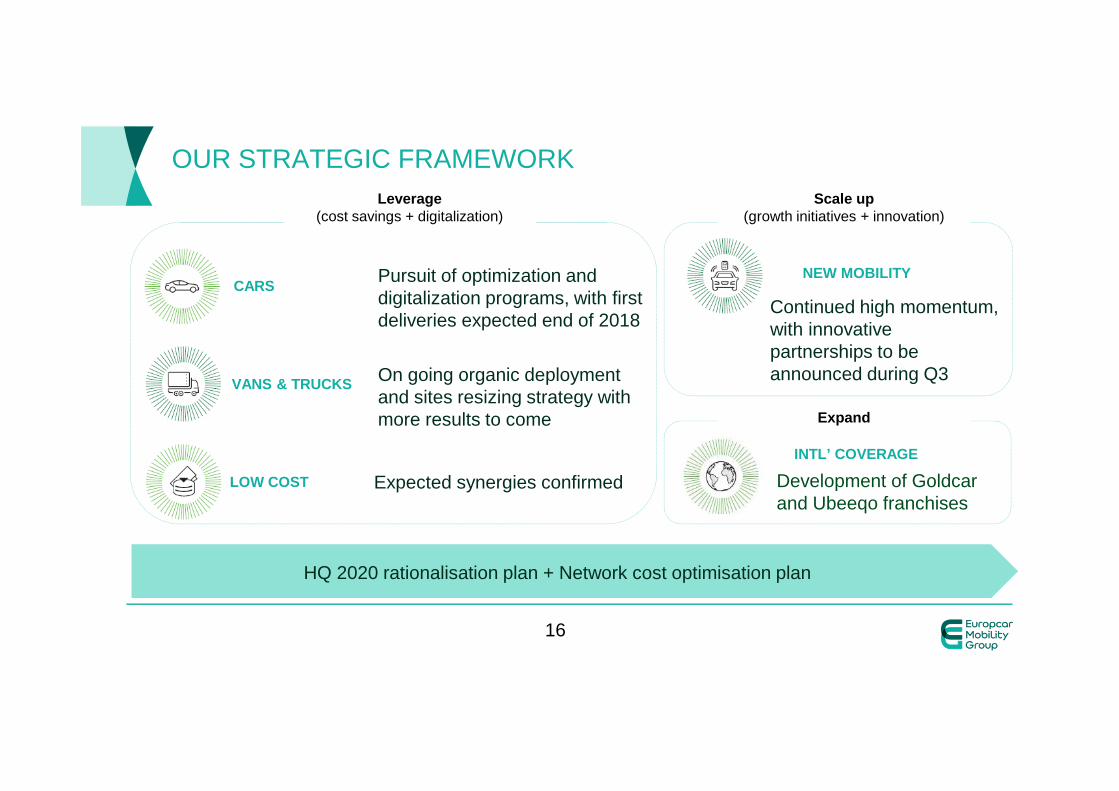
OUR STRATEGIC FRAMEWORK
LOW COST
NEW MOBILITY
VANS & TRUCKS
CARSPursuit of optimization and digitalization programs, with first deliveries expected end of 2018
On going organic deploymentand sites resizing strategy withmore results to come
Expected synergies confirmed
Continued high momentum, with innovativepartnerships to beannounced during Q3
Leverage(cost savings + digitalization)
Leverage(cost savings + digitalization)
Scale up(growth initiatives + innovation)
Scale up(growth initiatives + innovation)
HQ 2020 rationalisation plan + Network cost optimisation plan
Development of Goldcarand Ubeeqo franchises
ExpandExpand
INTL’ COVERAGE

• We increased our securitization program (SARP)to include Goldcar and support our growth needs, from €1.3 to €1.7 Bn with 2-year maturityextension
• Successof our fleetbond tap (M)
• Increased maturity of our hedgingof interest rates exposure
350 500
A TAILORED, ROBUST AND FLEXIBLE FINANCING STRUCTURE
17

H1 & Q2 financialresults2
18

Q2 FINANCIAL HIGHLIGHTS
EBITDA€71m
NET INCOME
€18m
REVENUE€740m
Op FCF€141m
• 26% reported revenue growth
• 2.2% organic revenue growth due to tough comparable base and World Cup impact
• 14% growth in EBITDA
• 23% growth in Corp Operating FCF
• Stable RPD in Cars, Solid organic revenue growth in Vans & Trucks , Excellent RPD trends in Low Cost
• Corporate Net Debt to EBITDA at 2.8x at end June 2018
19

Q2 2018 FINANCIALS
Revenue (€m and % growth) Adjusted Corporate EBITDA (€m and % margin)
Net income (€m and % margin) Corp. operating free cash flow (€m)
Notes: Revenue & Adjusted Corporate EBITDA figures are at constant exchange rate; Net Income and Corporate Operating Free Cash Flow are reported figures; Organic revenue growth is defined at constant currency and constant perimeter
+26%
+2.2% organic growth
Margin 10.5% 9.6%
Margin n.m. 2.4%
589740
Q2 2017 Q2 2018
6271
Q2 2017 Q2 2018
(45)
18
Q2 2017
Q2 2018
115
Q2 2017 Q2 2018
141
Strong growth in Adjusted Corporate EBITDA and Corporate Operating Free Cash Flow
20

Q2 2018 KPIS
Rental day volume (million and % growth) Blended RPD (€ and % growth)
Utilization rate (% and increase in bps) Fleet costs per unit per month (€ and % growth)
Good rental day volume growth with continued improvement in Fleet Costs per Unit
Note: Figures at constant exchange rate
(30)bps (1.7)%
n.m.+31%
17.122.4
Q2 2017 Q2 2018
32.1 31.0
Q2 2017 Q2 2018
77.7% 77.4%
Q2 2017 Q2 2018
236 232
Q2 2017 Q2 2018
21

Rental Revenue (€m and % growth)
Q2 2018 REVENUE BY BUSINESS UNIT
KPIs (% YoY organic growth)
Note: Figures at constant exchange rate
Cars Vans & Trucks Low Cost
Cars Vans & Trucks Low Cost
+11% +49% +237%
+1.9% organic growth
+4.9% organic growth
+0.3% organic growth463 511
Q2 2017 Q2 2018
5785
Q2 2017 Q2 2018
30
100
Q2 2017 Q2 2018
(0.2%)
+2.1%
RPD Rental days
(3.6%)
+8.8%
RPD Rental days
+13.9%
(12.0%)
RPD
Rental days
22Low Cost organic perimeter now much less pertinent due to progressive transfer
of InterRent revenue within the Goldcar perimeter

H1 2018 MARGIN AFTER VARIABLE COSTS BY BUSINESS UNIT
9.4 48.3
H1 2017 H1 2018
36.3 58.2
H1 2017 H1 2018
338.0 372.4
H1 2017 H1 2018
Margin after variable costs (€m and % growth)
Note: Margin after variable costs is defined as Revenue – Fleet costs – Revenue Related costs – Petrol costs – Rental related costs – Insurance & Assistance costs at constant exchange rates
Cars Vans & Trucks Low Cost
+10% +60% +414%
Good step up in Vans & Trucks, Giant leap in Low Cost
40.6%margin
39.9%margin
(70) bps
34.3%margin
35.5%margin
+120 bps
20.6%margin
30.5%margin
+990 bps
23

H1 FINANCIAL HIGHLIGHTS
EBITDA€46m
NET INCOME
€20m
REVENUE€1297m
Op FCF€65m
• 3.4% organic revenue growth
• Good sequential EBITDA growth momentum
• 64% revenue growth in BU New Mobility
• Operating FCF well monitored with lower non-recurring expenses and non-fleet WC requirements
• Succesfull refinancing of core facilities (SARF and Fleet bond) with extension of amounts, maturitiesand terms
• Network and HQ costs increase in line with budget, will be offset by integration synergies and cost optimization programs in order to achieve 2020 profitability target
24
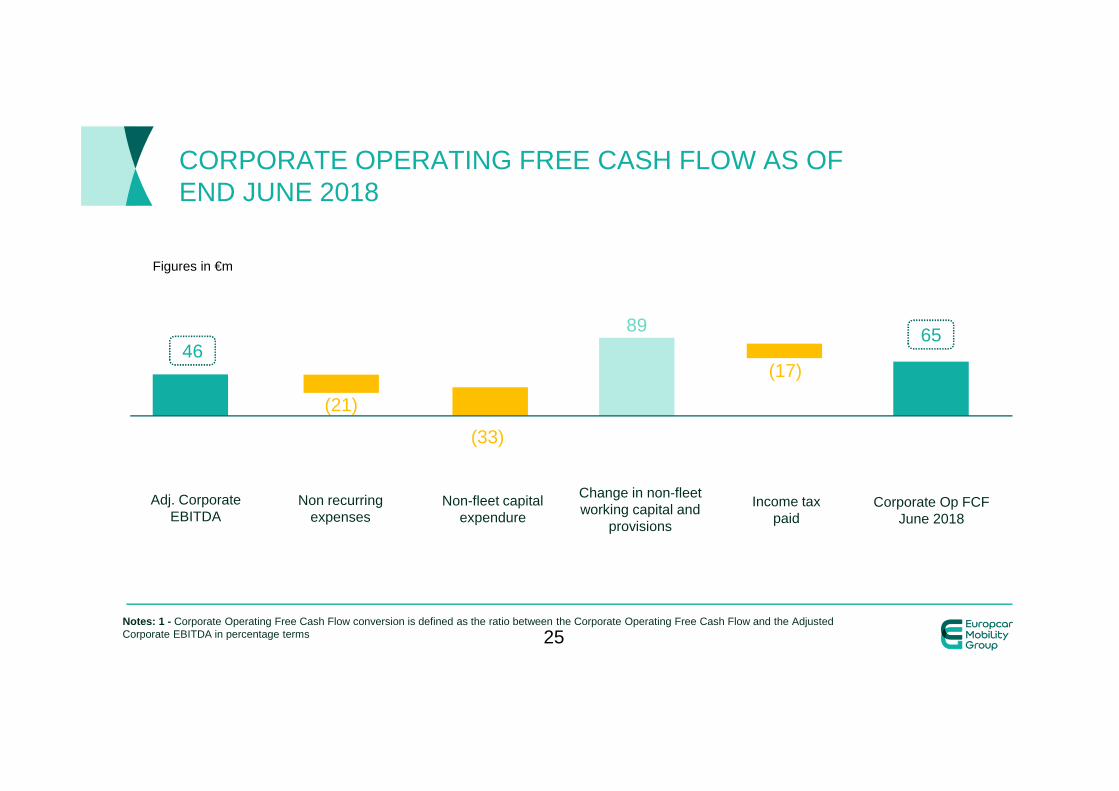
CORPORATE OPERATING FREE CASH FLOW AS OF END JUNE 2018
Notes: 1 - Corporate Operating Free Cash Flow conversion is defined as the ratio between the Corporate Operating Free Cash Flow and the Adjusted Corporate EBITDA in percentage terms
Figures in €m
46
(21)
(33)
65
(17)
89
Adj. Corporate EBITDA
Non recurringexpenses
Non-fleet capital expendure
Change in non-fleetworking capital and
provisions
Income taxpaid
Corporate Op FCF June 2018
25

Capital increaseliquidity and
share buy-back
CORPORATE NET DEBT AT €849M AS OF END JUNE 2018
Figures in €m
827
(65)
57
(65)
27 30 24 16 849
CorporateNet Debt
December 2017
Corporateoperating free
cash flow
Fleet financingtiming impact
Investingactivities
Cash intereston corporate
net debt
Dividends Transaction costs, Non fleet financing
& Forex
CorporateNet Debt
June 2018
26
Proforma Corporate Net Leverage 2.8x at end June 2018 with year end 2018 target below 2.5x

2018 Guidance & Outlook3
27

2018 GUIDANCE
ADJUSTED CORPORATE EBITDA EXCLUDING NEW MOBILITY
ADJUSTED CORPORATE OP. FCF CONVERSION EXCLUDING NEW MOBILITY
DIVIDEND PAYOUT RATIO
>3%
>€350m
>50%
>30%
ORGANIC REVENUE GROWTH
FY 2018FY 2018 GUIDANCE
28

• Striving to deliver operating leverage and costoptimization impact of +110bp/+130bp
• M&A run-rate synergies of >€30m for Goldcarand >€10m for Buchbinder, expected to improvemargins by +110bp/+130bp
• Projected margin investments in marketing & brands of -60bp/-80bp , to be fully financed by HQ efficiencies of +60bp/+80bp
11.8% >14%
ON TRACK TO DELIVER 2020 CORP. EBITDA MARGIN TARGET
29
2016 2020
Excl. New Mobility contribution
Leverage(cost savings + digitalization)
Leverage(cost savings + digitalization)
Scale up(growth initiatives + innovation)
Scale up(growth initiatives + innovation)

Q&A session4
30

Appendix
31

H1 2018 FINANCIALS
Revenue (€m and % growth) Adjusted Corporate EBITDA (€m and % margin)
Net income (€m and % margin) Corp. operating free cash flow (€m)
Notes: Revenue & Adjusted Corporate EBITDA figures are at constant exchange rate; Net Income and Corporate Operating Free Cash Flow are reported figures; Organic revenue growth is defined at constant currency and constant perimeter
+28%
+3.4% organic growth
Margin 5.5% 3.5%
Margin n.m. 1.5%
1,0171,297
H1 2017 H1 2018
56 46
H1 2017 H1 2018
(27)
20
H1 2017 H1 2018
88 65
H1 2017 H1 2018
32

H1 2018 KPIS
Rental day volume (million and % growth) Blended RPD (€ and % growth)
Utilization rate (% and increase in bps) Fleet costs per unit per month (€ and % growth)
Note: Figures at constant exchange rate
(80)bps (1)%
n.m.+32%
31.6 30.7
H1 2017 H1 2018
76.3% 75.5%
H1 2017 H1 2018
238 236
H1 2017 H1 2018
30.039.5
H1 2017 H1 2018
33

Rental Revenue (€m and % growth)
H1 2018 REVENUE BY BUSINESS UNIT
KPIs (% YoY organic growth)
Note: Figures at constant exchange rate
Cars Vans & Trucks Low Cost
Cars Vans & Trucks Low Cost
+13% +55% +251%
+2.6% organic growth
+6.3% organic growth
+6.1% organic growth799
902
H1 2017 H1 2018
104
161
H1 2017 H1 2018
44
153
H1 2017 H1 2018
(0.2%)
+2.8%
RPD Rental days
(4.5%)
+11.2%
RPD Rental days
+11.6%
(4.9%)
RPD
Rental days
34

KEY FINANCIAL METRICS FOR Q2 2018
* UK Pound, Australian Dollar and Danish Krone** Total revenues excluding petrol income increase 26.0% at constant currency, *** Total fleet Cars & vans at quarter end 372.2 k as of June 30, 2018 vs 284.4 k as of June 30, 2017.
All data in €m, except if noted Q2 2018 Q2 2017 Change Change at constant currency*
Revenues** 740 593 24.8% 25.7%
Rental Revenues 696 553 25.8% 26.7%
Rental Day Volume (million) 22.4 17.1 31.2%
Consolidated RPD (€) 31.0 32.3 -4.1% -3.4%
Average duration (day) 6.2 5.9 5.6%
Average Fleet (thousand)*** 318.3 241.8 31.6%
Average Per unit fleet costs per month (€) (232) (237) -2.3%
Financial utilization rate 77.4% 77.7% (0.3)pt
Adjusted Corporate EBITDA 71 63 13.4% 13.6%
Adjusted Corporate EBITDA Margin 9.6% 10.5% (1.0)pt
Corporate Free Cash Flow 142 117 21.2%
Last Twelve Months Adjusted Corporate EBITDA 254 255 - 0.6%
LTM Adjusted Corporate EBITDA Margin 9.5% 11.5% (2.0)pt
Operating Income IFRS 65 (9) -821.4%
Net Income IFRS 18 (46) n.m n.m
Corporate Net Debt at end of the period 849 104
Total Fleet Net Debt at the end of the period (inc. Operating leases) 5,224 4,037 29.4%
35

KEY FINANCIAL METRICS FOR H1 2018
All data in €m, except if noted 6M 2018 6M 2017 Change Change at constant currency*
Revenues** 1,297 1,028 26.2% 27.5%
Rental Revenues 1,215 956 27.1% 28.4%
Rental Day Volume (million) 39.5 30.0 31.8%
Consolidated RPD (€) 30.7 31.9 -3.6% -2.6%
Average duration (day) 6.2 5.8 6.3%
Average Fleet (thousand)*** 289.3 217.1 33.3%
Average Per unit fleet costs per month (€) (236) (241) -1.8%
Financial utilization rate 75.5% 76.3% (0.8)pt
Adjusted Corporate EBITDA 46 56 -17.6% -16.6%
Adjusted Corporate EBITDA Margin 3.6% 5.5% (1.9)pt
Corporate Free Cash Flow 65 90 -27.0%
Last Twelve Months Adjusted Corporate EBITDA 254 255 - 0.6%
LTM Adjusted Corporate EBITDA Margin 9.5% 11.5% (2.0)pt
Operating Income IFRS 105 32 229.7%
Net Income IFRS 20 (27) n.m n.m
Corporate Net Debt at end of the period 849 104
Total Fleet Net Debt at the end of the period (inc. Operating leases) 5,224 4,037 29.4%
* UK Pound, Australian Dollar and Danish Krone** Total revenues excluding petrol income increase 27.9% at constant currency, *** Total fleet Cars & vans at quarter end 372.2 k as of June 30, 2018 vs 284.4 k as of June 30, 2017.
36

MANAGEMENT P&L FOR Q2 2018
All data in €m Q2 2018 Q2 2017 Change
Change at constant currency
Revenues 740 593 24.8% 25.7%
Fleet holding costs excluding estimated interest included in operating leases (183.0) (135.8) 34.8% 35.7%
Fleet operating, rental, revenues and insurance-related costs (251.9) (209.5) 20.2% 21.1%
Margin after variable costs 305 248 23.2% 24.0%
Margin Rate after variable costs 41.3% 41.8% (0.5)pt
Personnel, network, IT and other HQ costs (204.8) (159.1) 28.7% 29.7%
Fleet financing costs (29.7) (26.1) 13.7% 14.3%
Adjusted Corporate EBITDA 71 63 13.4% 13.6%
Adjusted Corporate EBITDA Margin 9.6% 10.5% (1.0)pt
37

MANAGEMENT P&L FOR H1 2018
All data in €m 6M 2018 6M 2017 Change
Change at constant currency
Revenues 1,297 1,028 26.2% 27.5%
Fleet holding costs excluding estimated interest included in operating leases (334.3) (242.6) 37.8% 39.1%
Fleet operating, rental, revenues and insurance-related costs (456.3) (371.3) 22.9% 24.2%
Margin after variable costs 506 414 22.3% 23.5%
Margin Rate after variable costs 39.0% 40.3% (1.2)pt
Personnel, network, IT and other HQ costs (403.6) (307.9) 31.1% 32.5%
Fleet financing costs (56.1) (49.7) 12.9% 13.8%
Adjusted Corporate EBITDA 46 56 -17.6% -16.6%
Adjusted Corporate EBITDA Margin 3.6% 5.5% (1.9)pt
38

IFRS P&L H1 & Q2 2018
Q2 2018 Q2 2017 All data in €m 6M 2018 6M 2017
740.2 593.0 Total revenue 1,296.6 1,027.8
(196.3) (147.3) Fleet holding costs (359.4) (264.0)
(251.9) (209.5) Fleet operating, rental and revenue related costs (456.3) (371.3)
(134.2) (100.7) Personnel costs (257.0) (191.2)
(74.3) (61.9) Network and head office overhead (151.4) (120.6)
3.7 3.5 Other income and expense 4.8 3.9
(10.9) (7.6) Depreciation – excluding vehicle fleet (20.4) (14.2)
76.5 69.4 Recurring operating income 57.0 70.4
(11.8) (78.4) Other non-recurring income and expenses 47.9 (38.5)
64.6 (9.0) Operating income 104.9 31.8
(40.0) (28.9) Net financing costs (77.6) (58.0)
24.6 (37.8) Profit/(loss) before tax 27.3 (26.2)
(7.0) (5.0) Income tax (6.0) 5.0
(0.1) (2.7) Share of profit/(loss) of associates (1.2) (5.8)
17.6 (45.5) Net profit/(loss) 20.1 (27.0)
17.6 (45.4) Net profit/(loss) attributable to Europca r owners 20.1 (26.8)
39
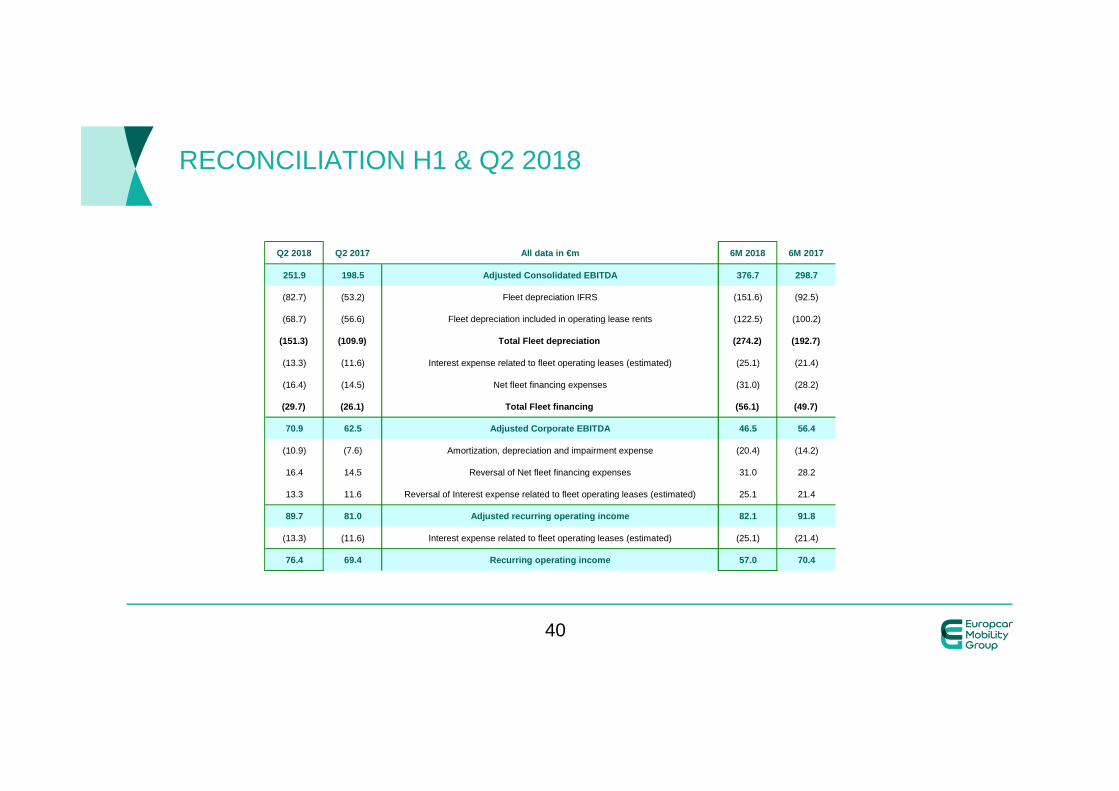
RECONCILIATION H1 & Q2 2018
Q2 2018 Q2 2017 All data in €m 6M 2018 6M 2017
251.9 198.5 Adjusted Consolidated EBITDA 376.7 298.7
(82.7) (53.2) Fleet depreciation IFRS (151.6) (92.5)
(68.7) (56.6) Fleet depreciation included in operating lease rents (122.5) (100.2)
(151.3) (109.9) Total Fleet depreciation (274.2) (192.7)
(13.3) (11.6) Interest expense related to fleet operating leases (estimated) (25.1) (21.4)
(16.4) (14.5) Net fleet financing expenses (31.0) (28.2)
(29.7) (26.1) Total Fleet financing (56.1) (49.7)
70.9 62.5 Adjusted Corporate EBITDA 46.5 56.4
(10.9) (7.6) Amortization, depreciation and impairment expense (20.4) (14.2)
16.4 14.5 Reversal of Net fleet financing expenses 31.0 28.2
13.3 11.6 Reversal of Interest expense related to fleet operating leases (estimated) 25.1 21.4
89.7 81.0 Adjusted recurring operating income 82.1 91. 8
(13.3) (11.6) Interest expense related to fleet operating leases (estimated) (25.1) (21.4)
76.4 69.4 Recurring operating income 57.0 70.4
40

MANAGEMENT CASH FLOW H1 & Q2 2018
All data in €m 6M 2018 6M 2017 Q2 2018 Q2 2017
Adjusted Corporate EBITDA 46 56 71 63
Non-recurring expenses (21) (39) (12) (79)
Non-fleet capital expenditure (net of proceeds from disposals) (33) (21) (21) (9)
Changes in non-fleet working capital and provisions 89 111 117 153
Income tax paid (17) (17) (14) (11)
Corporate free cash flow 65 90 142 117
Cash interest paid on corporate High Yield bonds (30) (17) (30) (17)
Cash flow before change in fleet asset base, financ ing and other investing activities 36 73 111 100
Change in fleet asset base, net of drawings on fleet financing and working capital facilities (45) (64) (91) (51)
Other investing activities 60 (76) 58 (76)
Capital increase (27) 192 (27) 171
Dividends (24) (59) (24) (59)
Change in Corporate High Yield (9) (0) (9) (0)
Transaction cost cash out and swap impact (15) 2 (12) 10
Net change in cash before FX effect (25) 67 5 94
Cash and cash equivalents at beginning of period 313 249 281 236
Scope variation - 3 - 3
Effect of foreign exchange conversions (1) (2) 1 (15)
Cash and cash equivalents at end of period 287 317 287 317
41

FINANCING STRUCTURE AS OF JUNE 30, 2018
Average Fleet net debt for 6M 2018
In balance sheet 2,315
Off Balance Sheet 1,990
Total Fleet net debt 4,305
Indebtedness at the testing date 1,303
Total value of the net assets 1,463
Loan to value ratio 89.1%
aver
age
LTV
42
€million Pricing MaturityJune. 30,
2018 Dec. 31, 2017
High Yield Senior Notes (a) 4.125% 2024 600 600
High Yield Senior Notes (a) 5.75% 2022 600 600
Senior Revolving Facility (€500m) E+250bps (b) 2022 304 160
FCT Junior Notes, accrued interest not yet due, capitalized financing costs and other
(363) (270)
1,140 1,090
(291) (263)
(A) 849 827
€million Pricing MaturityJune. 30,
2018 Dec. 31, 2017
High Yield EC Finance Notes (a) 2.375% 2022 500 350
Senior asset revolving facility (€1.7bn SARF) (c) E+130bps 2022 629 739
FCT Junior Notes, accrued interest, financing capitalized costs and other
351 260
UK, Australia and other fleet financing facilities Various (d) 1,271 1,081
Gross financial fleet debt 2,751 2,430
(83) (143)
2,669 2,287
OF
F
BS 2,555 1,774
(B) 5,224 4,061
(A)+(B) 6,073 4,888
IN B
alan
ce S
heet
TOTAL FLEET NET DEBT (incl. op leases)
TOTAL NET DEBT
Gross Corporate debt
CORPORATE NET DEBT
Short-term Investments and Cash in operating and holding entities
IN B
alan
ce S
heet
Fleet net debt in Balance sheet
Cash held in fleet financing entities and Short-term fleet investments
Debt equivalent of fleet operating leases - OFF Bal ance Sheet (e)

IFRS BALANCE SHEET END OF JUNE 2018
At At June 30, Dec. 31,
2018 2017Assets
Goodwill 1,122,486 1,122,839Intangible assets 848,453 838,033Property, plant and equipment 114,885 114,855Equity-accounted investments 1,390 4,036Other non-current financial assets 70,339 58,602Financial instruments non-current 4,640 226Deferred tax assets 63,496 58,542Total non-current assets 2,225,689 2,197,133
Inventory 31,926 24,330Rental fleet recorded on the balance sheet 3,045,279 2,339,313Rental fleet and related receivables 726,081 700,117Trade and other receivables 510,044 456,688Current financial assets 26,637 32,762Current tax assets 54,384 42,760Restricted cash 84,642 104,818Cash and cash equivalents 224,752 240,792Total current assets 4,703,745 3,941,580
Total assets 6,929,434 6,138,713
In € thousandsAt At
June 30, Dec. 31,2018 2017
Equity
Share capital 161,031 161,031Share premium 692,256 745,748Reserves (156,599) (107,407)Retained earnings (losses) 86,413 37,209Total equity attributable to the owners of ECG 783,1 01 836,581Non-controlling interests 728 763Total equity 783,829 837,344
Liabilities
Financial liabilities 1,722,814 1,570,141Non-current financial instruments 57,390 37,122Employee benefit liabilities 134,084 133,951Non-current provisions 5,279 8,680Deferred tax liabilities 137,542 137,166Other non-current liabilities 250 276Total non-current liabilities 2,057,359 1,887,336
Current portion of financial liabilities 2,170,054 1,950,262Employee benefits 3,149 3,149Current provisions 221,025 221,155Current tax liabilities 35,912 31,566Rental fleet related payables 945,658 604,196Trade payables and other liabilities 712,448 603,705Total current liabilities 4,088,246 3,414,033
Total liabilities 6,145,605 5,301,369 Total equity and liabilities 6,929,434 6,138,713
In € thousands
43

IFRS CASH FLOW Q2 2018
In € thousands First-half 2018 First-half 2017
Profit/(loss) before tax 27,271 (26,222)Reversal of the following itemsDepreciation and impairment expenses on property, plant and equipment 10,001 8,580Amortization and impairment expenses on intangible assets 9,488 5,726Changes in provisions and employee benefits (1) (4,408) 11,783Recognition of share-based payments 750 2,764Profit/(loss) on disposal of assets (2) (68,514) (30)Other non-cash items (1,399) (1,139)Total net interest costs 66,088 49,404Amortization of transaction costs 6,439 3,865Net financing costs 72,527 53,269Net cash from operations before changes in working capital 45,716 54,731
Changes to the rental fleet recorded on the balance sheet (3) (724,507) (612,182)Changes in fleet working capital 294,456 290,086Changes in non-fleet working capital 93,413 101,874Cash generated from operations (290,922) (165,491)
Income taxes received/paid (16,878) (17,148)Net interest paid (66,805) (49,386)Net cash generated from (used by) operating activit ies (374,605) (232,025)
Acquisition of intangible assets and property, plant and equipment (4) (34,218) (22,349)Proceeds from disposal of intangible assets and property, plant and equipment 2,420 1,287Other investments and loans (5) 60,799 (77,420)Net cash used by investing activities 29,001 (98,482)
Capital increase (net of related expenses) - 192,440Special distribution (24,228) (59,366)(Purchases) / Sales of treasury shares net (27,123) (520)Derivatives instruments (6) (6,082) (932)Insurance of bonds (7) 148,500 -Change in other borrowings 237,979 263,630Payment of transaction costs (8) (8,882) (563)Net cash generated from (used by) financing activit ies 320,164 394,689
Cash and cash equivalent at beginning of period 313,247 248,507Net increase/(decrease) in cash and cash equivalents after effect of foreign exchange differences (25,440) 65,834Changes in scope - 2,988Effect of foreign exchange differences (797) (783)Cash and cash equivalents at end of period 287,010 316,546
(1) Of which in 2018, the reversal of provision for tax risk in France. Of which in 2017, the reversal of provision for disputes with French Competition Authority for €45 million
(2) Mainly related to the profit on the sale of Car2Go
(3) Given the average holding period for the fleet, the Group reports vehicles as current assets at the beginning of the contract. Their change from period to period is therefore similar to operating flows generated by the activity
(4) Mainly related to IT cost capitalized (€15.2m) ; other & technical equipment for (€12.8m) and other IT projects for (€6.2m)
(5) In 2018, mainly related to the profit on the sale of Car2Go
(6) In 2018, payment of a premium following the restructuring of existing caps and the implementation of additional caps
(7) In 2018, the change is mainly due to the launch of a Senior Secured Notes at a rate of 2.375% of an amount of 150 million euros maturing in 2022
(8) In 2018, payment of transaction costs including €(4.2)m related to SARF, €(0.2)m of initial costs related to the revolving credit facility, €(1.3)m related to the bridging loan, €(0.6)m related to the new €150m bond issue and €(2.6)m related to other loans.
44

GLOSSARY (1/3)
• Business customers: include corporations, small and medium-sized businesses, government agencies and other organizations which rent cars as well as entities renting cars to provide vehicle replacement services
• Corporate countries: countries where Europcar owns and operates its own network, where corporate-operated stations are located (Germany, UK, France, Italy, Spain, Portugal, Belgium and Australia/New Zealand)
• Adjusted Corporate EBITDA: EBITDA less fleet depreciation, fleet operating lease rents and fleet financing costs
• Fleet: all vehicles operated by the car rental company available or not for rent which includes cars and vans
• Fleet Cost per Unit per month: defined as total monthly fleet costs (including fleet holding and fleet operating costs but excluding financial interests) divided by the average fleet over the period
• Fleet holding costs: include (A) Costs related to rental fleet agreements, which consist of (i) “depreciation” expense relating both to vehicles purchased with manufacturer or dealer buy-back commitments and to “at risk” vehicles (based, with respect to vehicles purchased with a buy-back commitment, on monthly depreciation rates negotiated under the buy-back agreements, net of volume rebates, and with respect to “at risk” vehicles, to the difference between the acquisition cost of the vehicles and the estimated residual value, the value of “at risk” vehicles being adjusted monthly on the basis of the vehicles’ market values) and (ii) charges under operating leases; (B) Acquisition and sale-related costs, which include principally (i) the cost of vehicle accessories; (ii) costs relating to the conditioning of new vehicles; and (iii) costs relating to disposal of used vehicles and of vehicles purchased in connection with buy-back programs; and (C) Taxes on vehicles.
45
GLOSSARY (2/3)
• Fleet operating, rental and revenue related costs: include (A) Fleet operating costs, which include repairs and maintenance costs and costs incurred for damaged and stolen cars, as well as the costs of reconditioning vehicles for repurchase by the car manufacturer or dealer; (B) insurance (the costs of car insurance covering civil liability and damage to vehicles, as well as self-insurance costs); (C) Revenue-related commissions and fees, which include commissions paid to agents, such as personnel costs and station overhead (excluding vehicle fleet), as well as commissions paid to travel agents, brokers and other commercial partners and fees and taxes paid for airport and train station concessions; and (D) Rental related costs, which include the cost of transferring vehicles from one site to another, vehicle washing costs and fuel costs.
• Fleet financial utilization rate: number of actual rental days as a percentage of the theoretical total potential number of days of the fleet. The theoretical total potential number of days of the fleet is equal to the number of vehicles held over the period, multiplied by the total number of days in the period
• Franchising: arrangement where the franchiser grants the franchisee the right to use its trademark or trade-name as well as certain business systems and processes, to produce and market a good or services according to certain specifications. In exchange, the franchisee usually pays the franchiser an entry fee plus a percentage of sales revenues as royalty
• GDS (Global Distribution System): computerized reservations systems operated by third parties and used by intermediaries such as travel agents and travel operators to make reservations with the Europcar Network
• GSA (General Sales Agent): general sales representative that promotes and sells the services offered by Europcar in a specific country or region in consideration of a commission
• GreenWay® system: software application, owned by Europcar, offering a comprehensive business solution mainly in the areas of fleet management, e-commerce, reservations and global distribution systems and rental operations
• Leisure customers: include not only individual travelers booking vacation car rentals but also people renting to meet other personal needs
46
GLOSSARY (3/3)
• Loan to value: corresponds to the indebtedness of Securitifleet Holding, the Securitifleet Companies and EC Finance Plc divided by the total value of the net assets on the balance sheets of these companies.
• Margin after variable costs: corresponds to the total revenues less Fleet holding costs and Fleet operating, rental and revenue related costs
• Net rates: brokers selling at any price, ie brokers revenue is the gap between Europcar’s selling price and their selling price (usually offered to TOs for package, brokers with Keddy and destinations where brokers are more present than Europcar)
• Operating lease vehicle: agreement by which a vehicle is leased to a car rental company, which pays periodically on a relatively short-term basis; at the end of the operating lease, title does not pass to the car rental company
• Rental Day Volume: number of vehicles rented over a period of time
• RCM: Revenue Capacity Management
• Retail rates: Europcar setting the price and paying a commission to brokers preventing them from selling at a lower price than Europcar’s
• RPD (Revenue Per Day): rental revenue divided by the Rental Day Volume
• Vehicle replacement: business involving principally the rental of cars to individuals whose rental charges are wholly or partially paid or reimbursed, by insurance companies, vehicle leasing companies and vehicle dealers and other entities offering vehicle replacement services, with whom Europcar has a direct contractual relationship
47