EUROMET gauge blocks comparison - BIPM · 2012-02-23 · EURAMET.L-K1.2: Final report Comparison of...
38
University of Zagreb Faculty of mechanical engineering and naval architecture Laboratory for precise measurements of length EURAMET comparison of gauge blocks by interferometry EURAMET #1138 EURAMET.L-K1.2 Final report Zagreb, December 2011 V. Mudronja, M. Katic
Transcript of EUROMET gauge blocks comparison - BIPM · 2012-02-23 · EURAMET.L-K1.2: Final report Comparison of...
University of Zagreb Faculty of mechanical engineering and naval architecture Laboratory for precise measurements of length
EURAMET comparison of gauge blocks by interferometry
EURAMET #1138 EURAMET.L-K1.2
Final report
Zagreb, December 2011 V. Mudronja, M. Katic

EURAMET.L-K1.2: Final report Comparison of gauge blocks by interferometry
1
Contents
1 Introduction .............................................................................................................................. 2
2 Organization ............................................................................................................................ 3
2.1 Participants ....................................................................................................................... 3
2.2 Time schedule .................................................................................................................. 3
3 Description of the Standards .................................................................................................... 4
4 Measurement instructions ........................................................................................................ 5
5 Measurement equipment used by participants ......................................................................... 6
6 Stability of the gauge blocks .................................................................................................... 6
7 Condition of gauge block surfaces ........................................................................................... 9
8 Analysis of results .................................................................................................................. 10
9 Results as reported by the participants .................................................................................. 12
9.1 Results of the 1 mm gauge block .................................................................................... 13
9.2 Results of the 5 mm gauge block .................................................................................... 14
9.3 Results of the 8 mm gauge block .................................................................................... 15
9.4 Results of the 10 mm gauge block .................................................................................. 16
9.5 Results of the 25 mm gauge block .................................................................................. 17
9.6 Results of the 40 mm gauge block .................................................................................. 18
9.7 Results of the 60 mm gauge block .................................................................................. 19
9.8 Results of the 90 mm gauge block .................................................................................. 20
10 Final results ........................................................................................................................ 21
10.1 Changes to the measurement results ............................................................................. 21
10.2 Final measurement results .............................................................................................. 21
10.3 Results of the 1 mm gauge block .................................................................................... 22
10.4 Results of the 5 mm gauge block .................................................................................... 23
10.5 Results of the 8 mm gauge block .................................................................................... 24
10.6 Results of the 10 mm gauge block .................................................................................. 25
10.7 Results of the 25 mm gauge block .................................................................................. 26
10.8 Results of the 40 mm gauge block .................................................................................. 27
10.9 Results of the 60 mm gauge block .................................................................................. 28
10.10 Results of the 90 mm gauge block .............................................................................. 29
11 Discussion of final measurement results ............................................................................ 30
APPENDIX 1: Key Comparison Reference Values ........................................................................ 32
APPENDIX 2: Comparison with Reference Values ....................................................................... 33
APPENDIX 2.1: Effect of the results to CMC claims ...................................................................... 37

EURAMET.L-K1.2: Final report Comparison of gauge blocks by interferometry
2
1 INTRODUCTION
During the EURAMET annual TCL meeting in Lisbon in October 2009 it was agreed to start
a EURAMET key comparison of gauge blocks by interferometry between a small number of
laboratories (institutes), in order to test the performance of new equipment or confirm existing
measurement procedures. It was the intention of Croatian National Laboratory for Length and
Egyptian National Institute of Standards to apply CMC values based on the results of this
comparison.
Initiative for this key comparison came from Croatian National Laboratory for Length (HMI/FSB-
LPMD), which acted as pilot laboratory, with participation of 4 other institutes:
- MKEH (HU)
- DFM (DK)
- GUM (PL)
- NIS (EG)
EURAMET.L-K1.2: Final report Comparison of gauge blocks by interferometry
3
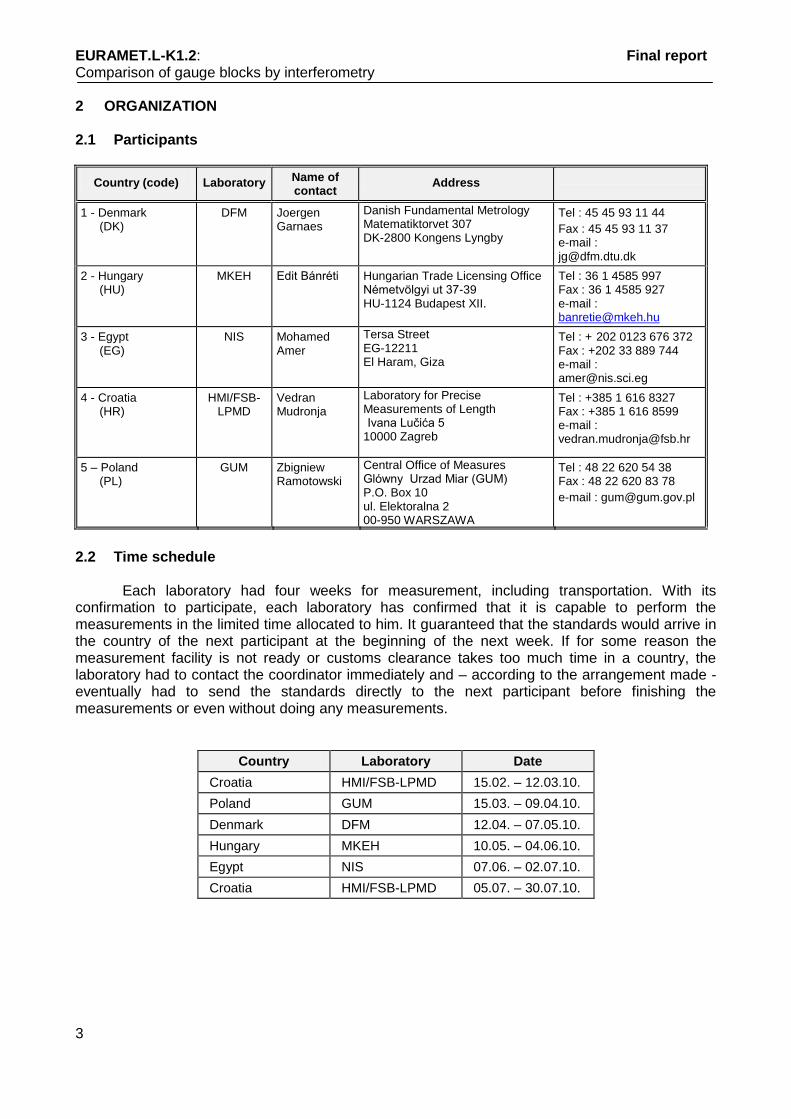
2 ORGANIZATION 2.1 Participants
Country (code) Laboratory Name of contact
Address
1 - Denmark (DK)
DFM Joergen Garnaes
Danish Fundamental Metrology Matematiktorvet 307 DK-2800 Kongens Lyngby
Tel : 45 45 93 11 44
Fax : 45 45 93 11 37 e-mail : [email protected]
2 - Hungary (HU)
MKEH Edit Bánréti Hungarian Trade Licensing Office Németvölgyi ut 37-39 HU-1124 Budapest XII.
Tel : 36 1 4585 997 Fax : 36 1 4585 927 e-mail : [email protected]
3 - Egypt (EG)
NIS Mohamed Amer
Tersa Street EG-12211 El Haram, Giza
Tel : + 202 0123 676 372 Fax : +202 33 889 744 e-mail : [email protected]
4 - Croatia (HR)
HMI/FSB-LPMD
Vedran Mudronja
Laboratory for Precise Measurements of Length Ivana Lučića 5 10000 Zagreb
Tel : +385 1 616 8327 Fax : +385 1 616 8599 e-mail : [email protected]
5 – Poland (PL)
GUM Zbigniew Ramotowski
Central Office of Measures Glówny Urzad Miar (GUM) P.O. Box 10 ul. Elektoralna 2 00-950 WARSZAWA
Tel : 48 22 620 54 38 Fax : 48 22 620 83 78
e-mail : [email protected]
2.2 Time schedule
Each laboratory had four weeks for measurement, including transportation. With its confirmation to participate, each laboratory has confirmed that it is capable to perform the measurements in the limited time allocated to him. It guaranteed that the standards would arrive in the country of the next participant at the beginning of the next week. If for some reason the measurement facility is not ready or customs clearance takes too much time in a country, the laboratory had to contact the coordinator immediately and – according to the arrangement made - eventually had to send the standards directly to the next participant before finishing the measurements or even without doing any measurements.
Country Laboratory Date
Croatia HMI/FSB-LPMD 15.02. – 12.03.10.
Poland GUM 15.03. – 09.04.10.
Denmark DFM 12.04. – 07.05.10.
Hungary MKEH 10.05. – 04.06.10.
Egypt NIS 07.06. – 02.07.10.
Croatia HMI/FSB-LPMD 05.07. – 30.07.10.

EURAMET.L-K1.2: Final report Comparison of gauge blocks by interferometry
4
3 DESCRIPTION OF THE STANDARDS 8 steel gauge blocks were measured. The gauge blocks were of rectangular cross section, according to the international standard ISO 3650:1998. Table 3.1. Steel gauge blocks:
Serial number Nominal length,
mm
Thermal expansion coeff.
10-6
K-1
Manufacturer
87656 1
11,9 ± 0,5 KOBA
87656 5
87656 8
87623 10
87680 25
87680 40
87680 60
87623 90

EURAMET.L-K1.2: Final report Comparison of gauge blocks by interferometry
5
4 MEASUREMENT INSTRUCTIONS
Before calibration the gauge blocks had to be inspected for damage of the measurement surfaces. Any scratches, rusty spots or other damages were to be documented by a drawing using the appropriate form.
Measurement item was the central length of the gauge blocks, as defined in the International Standard ISO 3650:1998. The gauge blocks had to be measured by interferometry, in their vertical position wrung to a flat plate. The central length of a gauge block is the perpendicular distance between the centre point of the free measuring surface and the plane surface of an auxiliary plate of the same material and surface texture upon which the other measuring surface has been wrung. The measurement result had to be reported as the deviation of central length from nominal length,
nominalmeasured Lll
The results of the measurements on both sides (l1 and l2) by wringing each measurement face
in turn upon the reference flat and the average of the two wringings had to be reported.
mark
Figure 4.1a :
Position of the gauge block for l1
The upper face is face 1
ma
rk
Figure 4.1b :
Position of the gauge block for l1 (L > 6 mm)
The upper face is face 1
The uncertainty of measurement had to be estimated according to the ISO Guide for the Expression of Uncertainty in Measurement (ISO/IEC Guide 98-3:2008).
EURAMET.L-K1.2: Final report Comparison of gauge blocks by interferometry
6
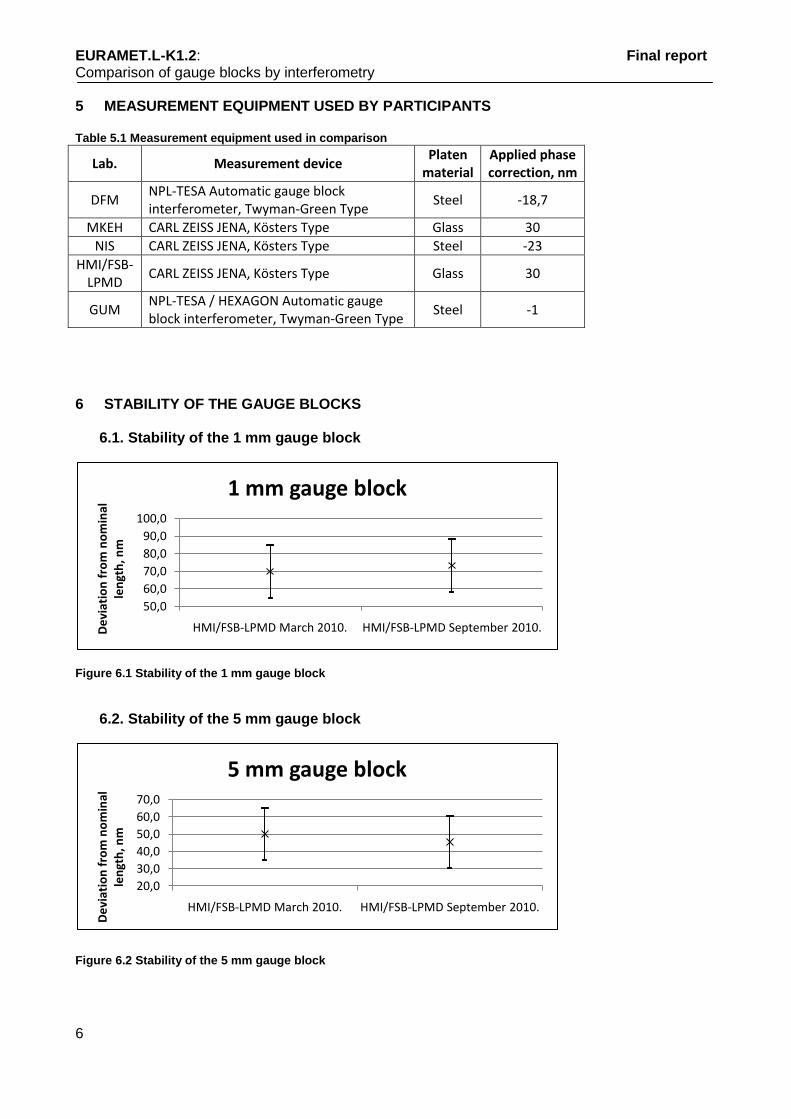
5 MEASUREMENT EQUIPMENT USED BY PARTICIPANTS Table 5.1 Measurement equipment used in comparison
Lab. Measurement device Platen
material Applied phase correction, nm
DFM NPL-TESA Automatic gauge block interferometer, Twyman-Green Type
Steel -18,7
MKEH CARL ZEISS JENA, Kösters Type Glass 30
NIS CARL ZEISS JENA, Kösters Type Steel -23
HMI/FSB-LPMD
CARL ZEISS JENA, Kösters Type Glass 30
GUM NPL-TESA / HEXAGON Automatic gauge block interferometer, Twyman-Green Type
Steel -1
6 STABILITY OF THE GAUGE BLOCKS
6.1. Stability of the 1 mm gauge block
Figure 6.1 Stability of the 1 mm gauge block
6.2. Stability of the 5 mm gauge block
Figure 6.2 Stability of the 5 mm gauge block
50,0
60,0
70,0
80,0
90,0
100,0
HMI/FSB-LPMD March 2010. HMI/FSB-LPMD September 2010.De
viat
ion
fro
m n
om
inal
le
ngt
h, n
m
1 mm gauge block
20,0
30,0
40,0
50,0
60,0
70,0
HMI/FSB-LPMD March 2010. HMI/FSB-LPMD September 2010.
De
viat
ion
fro
m n
om
inal
le
ngt
h, n
m
5 mm gauge block
EURAMET.L-K1.2: Final report Comparison of gauge blocks by interferometry
7
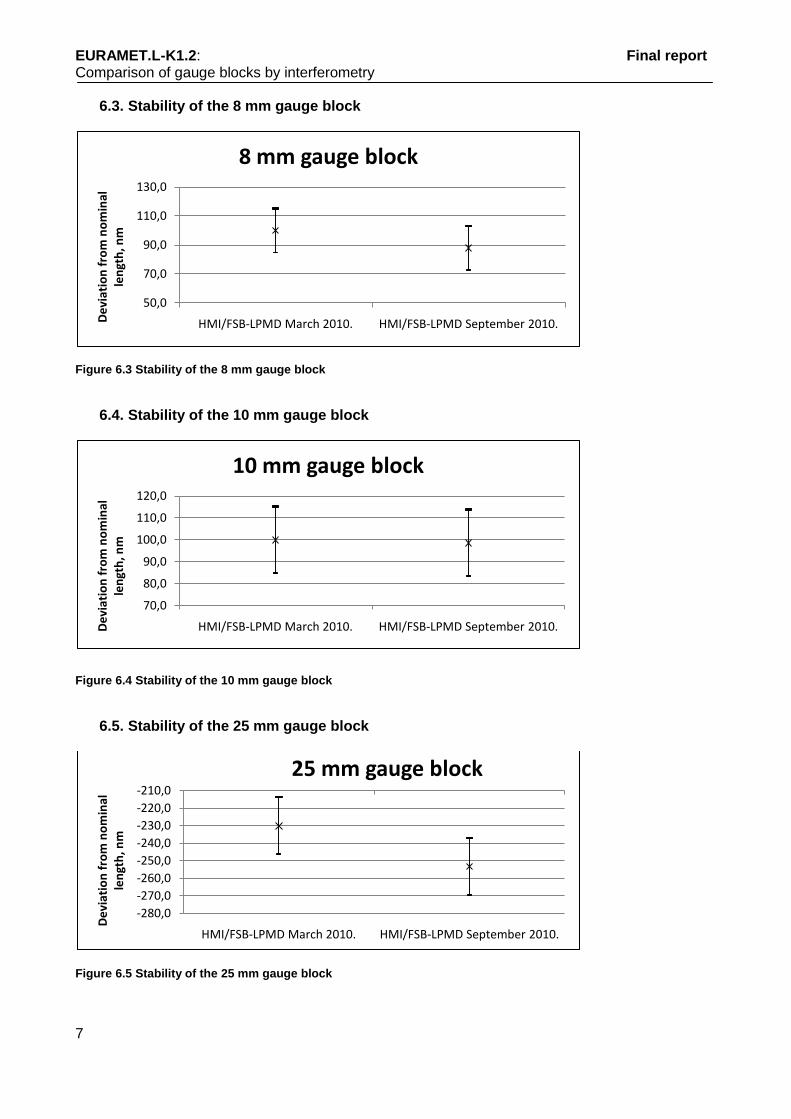
6.3. Stability of the 8 mm gauge block
Figure 6.3 Stability of the 8 mm gauge block
6.4. Stability of the 10 mm gauge block
Figure 6.4 Stability of the 10 mm gauge block
6.5. Stability of the 25 mm gauge block
Figure 6.5 Stability of the 25 mm gauge block
50,0
70,0
90,0
110,0
130,0
HMI/FSB-LPMD March 2010. HMI/FSB-LPMD September 2010.De
viat
ion
fro
m n
om
inal
le
ngt
h, n
m
8 mm gauge block
70,0
80,0
90,0
100,0
110,0
120,0
HMI/FSB-LPMD March 2010. HMI/FSB-LPMD September 2010.De
viat
ion
fro
m n
om
inal
le
ngt
h, n
m
10 mm gauge block
-280,0
-270,0
-260,0
-250,0
-240,0
-230,0
-220,0
-210,0
HMI/FSB-LPMD March 2010. HMI/FSB-LPMD September 2010.
De
viat
ion
fro
m n
om
inal
le
ngt
h, n
m
25 mm gauge block

EURAMET.L-K1.2: Final report Comparison of gauge blocks by interferometry
8
6.6. Stability of the 40 mm gauge block
Figure 6.6 Stability of the 40 mm gauge block
6.7. Stability of the 60 mm gauge block
Figure 6.7 Stability of the 60 mm gauge block
6.8. Stability of the 90 mm gauge block
Figure 6.8 Stability of the 90 mm gauge block
-10,00,0
10,020,030,040,050,0
HMI/FSB-LPMD March 2010. HMI/FSB-LPMD September 2010.
De
viat
ion
fro
m n
om
inal
le
ngt
h, n
m
40 mm gauge block
-370,0-360,0-350,0-340,0-330,0-320,0-310,0-300,0
HMI/FSB-LPMD March 2010. HMI/FSB-LPMD September 2010.
De
viat
ion
fro
m n
om
inal
le
ngt
h, n
m
60 mm gauge block
120,0130,0140,0150,0160,0170,0180,0190,0200,0
HMI/FSB-LPMD March 2010. HMI/FSB-LPMD September 2010.De
viat
ion
fro
m n
om
inal
le
ngt
h, n
m
90 mm gauge block
EURAMET.L-K1.2: Final report Comparison of gauge blocks by interferometry
9
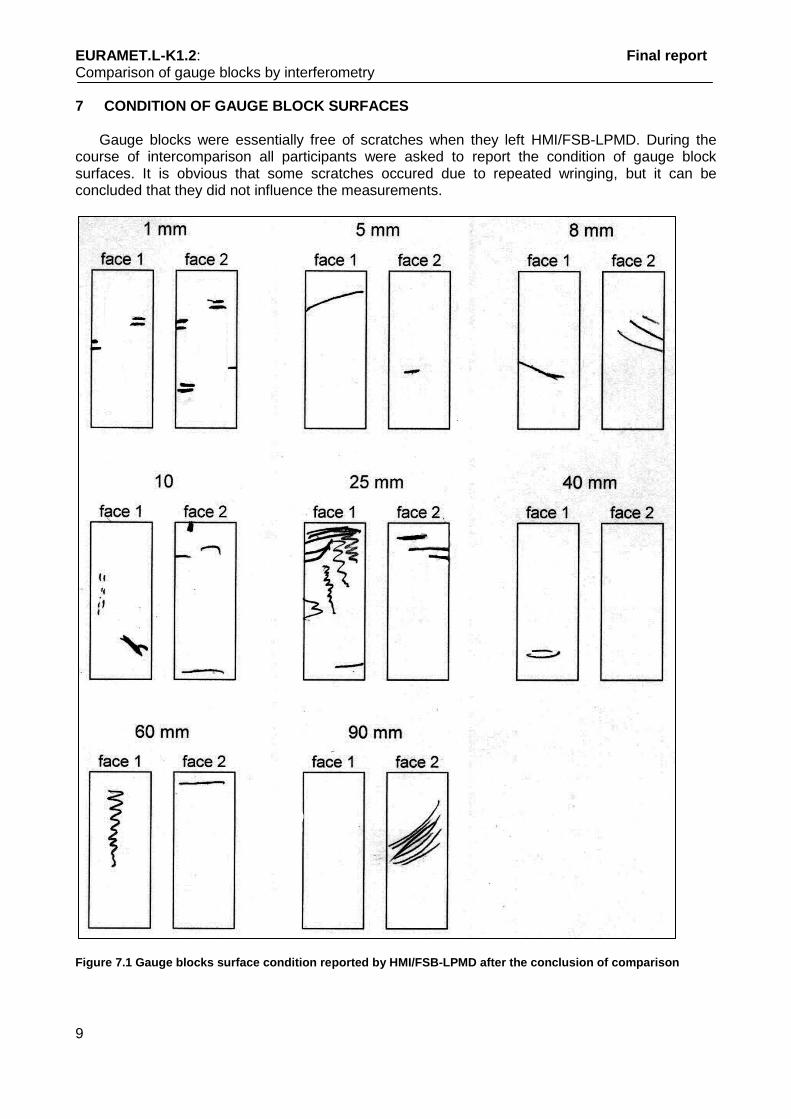
7 CONDITION OF GAUGE BLOCK SURFACES
Gauge blocks were essentially free of scratches when they left HMI/FSB-LPMD. During the course of intercomparison all participants were asked to report the condition of gauge block surfaces. It is obvious that some scratches occured due to repeated wringing, but it can be concluded that they did not influence the measurements.
Figure 7.1 Gauge blocks surface condition reported by HMI/FSB-LPMD after the conclusion of comparison

EURAMET.L-K1.2: Final report Comparison of gauge blocks by interferometry
10
8 ANALYSIS OF RESULTS The weighted mean is used as the reference value in the comparison. For each laboratory (i) the normalised weight, wi was calculated by the following formula:
i
ixu
Cw2
1 (1)
where u(xi) is the standard uncertainty given by the laboratory “i” and C is the normalizing factor and is calculated by the following formula:
n
i ixu
C
12
1
1 (2)
where n is the number of the laboratories. The weighted mean (reference value) is:
n
i
iiw xwx1
(3)
The uncertainty of the deviation from the weighted mean is:
)()()(2
int
2
wiwi xuxuxxu (4)
The analysis of the results of each participant can be done by calculating the deviation of the given
result from the weighted mean ( wi xx ) and the uncertainty of this deviation.
The statistical consistency of the results with the uncertainties given by the participants can be checked by the En value for each laboratory.
)()(2 2
int
2
wi
win
xuxu
xxE
(k=2) (5)
where wi xx is the deviation from the weighted mean for a result of a laboratory, uint is the so
called internal standard deviation that is based on the estimated standard uncertainties as reported by the participants:
Cxu w )(int (6)
En values are expected to be less than 1 for a coverage factor of k=2. The statistical consistency of the comparison can be analysed by the so called Birge ratio test. The Birge ratio compares the observed spread of the results with the spread expected from the individual reported uncertainties.

EURAMET.L-K1.2: Final report Comparison of gauge blocks by interferometry
11
The Birge ratio is:
)(
)(
int w
wextB
xu
xuR (7)
where uext is the so called external standard deviation and can be calculated by the following formula:
n
i i
n
i i
wi
wext
xu
xu
xx
Ixu
12
12
2
)(
1
)(
)(
1
1)( (8)
The Birge ratio has an expectation value of RB=1, when considering standard uncertainties. For a coverage factor of k = 2, the expectation value is increased and the data in a comparison are consistent provided that
)1/(81 IRB (9)
where I is the number of the results that are taken in the calculation. If the calculation of a gauge shows inconsistent dataset, the largest consistent subset is determined by elimination, starting with excluding the result having the largest En value that makes the largest contribution to the overall chi-squared value. The iteration runs until RB < RB crit. When a result xi is excluded from the reference value, it is not correlated to it and its En value is calculated by:
)()(2 2
int
2
wi
win
xuxu
xxE
(10)

EURAMET.L-K1.2: Final report Comparison of gauge blocks by interferometry
12
9 RESULTS AS REPORTED BY THE PARTICIPANTS Overview of measurement results as they were reported by the participating laboratories is given in Table 9.1. Weighted mean and its difference from reported results were calculated, along with corresponding En values (k=2), for each gauge block. A statistical consistency check was performed as described in Chapter 8. Results that were excluded from calculation in order to form a consistent subset are marked in colour, and their En values are given according to (10). Table 9.1 Reported measurement results, in nm, k=1
GUM DFM MKEH NIS HMI/FSB-
LPMD
DL uc DL uc DL uc DL uc DL uc
1 mm 56 11 82,3 11,5 30 15 41 16 73 15
5 mm 37 11 57,3 11,5 10 15 10,5 18 46 15
8 mm 90 11 112,3 11,6 70 15 50 19 88 15
10 mm 90 11 112,8 11,6 70 15 54 19 99 15
25 mm -258 14 -254,2 12,3 -250 19 -60 25 -253 16
40 mm -2 12 23,3 13,6 250 19 -149 30 14 18
60 mm -354 13 -313,7 15,8 300 24 59 36 -346 21
90 mm 147 14 194,3 19,9 210 32 -96 47 148 27

EURAMET.L-K1.2: Final report Comparison of gauge blocks by interferometry
13
9.1 Results of the 1 mm gauge block Table 9.1.1 Results as reported by the participants
Nominal L1 L2 L u, k=1 1 mm nm nm nm nm
GUM 57 56 56 11
DFM 73,3 91,3 82,3 11,5
MKEH 30 20 30 15
NIS 42 40 41 16
HMI/FSB-LPMD
70 76 73 15
Figure 9.1.1 Graphical representation of results
Table 9.1.2 Results calculated from participants‘ values
1 mm xi-xw En
GUM -3,5 -0,19 uint, nm 5,91
DFM 22,8 1,16 uext, nm 9,37
MKEH -29,5 -1,07 RB 1,58
NIS -18,5 -0,62 RB,crit 1,55
HMI/FSB-LPMD 13,5 0,49
xw, nm 59,50
Table 9.1.3 Results calculated from largest consistent subset
1 mm xi-xw En
GUM 4,7 0,27 uint, nm 6,89
DFM 31,0 1,68 uext, nm 8,63
MKEH -21,3 -0,80 RB 1,25
NIS -10,3 -0,36 RB,crit 1,62
HMI/FSB-LPMD
21,7 0,81 xw, nm 51,32
0
10
20
30
40
50
60
70
80
90
100
GUM DFM MKEH NIS LFSBDe
viat
ion
fro
m n
om
inal
len
gth
, nm
EURAMET.L-K1.2 1 mm gauge blockstandard uncertainty (k=1)
HMI/FSB- LPMD
EURAMET.L-K1.2: Final report Comparison of gauge blocks by interferometry
14
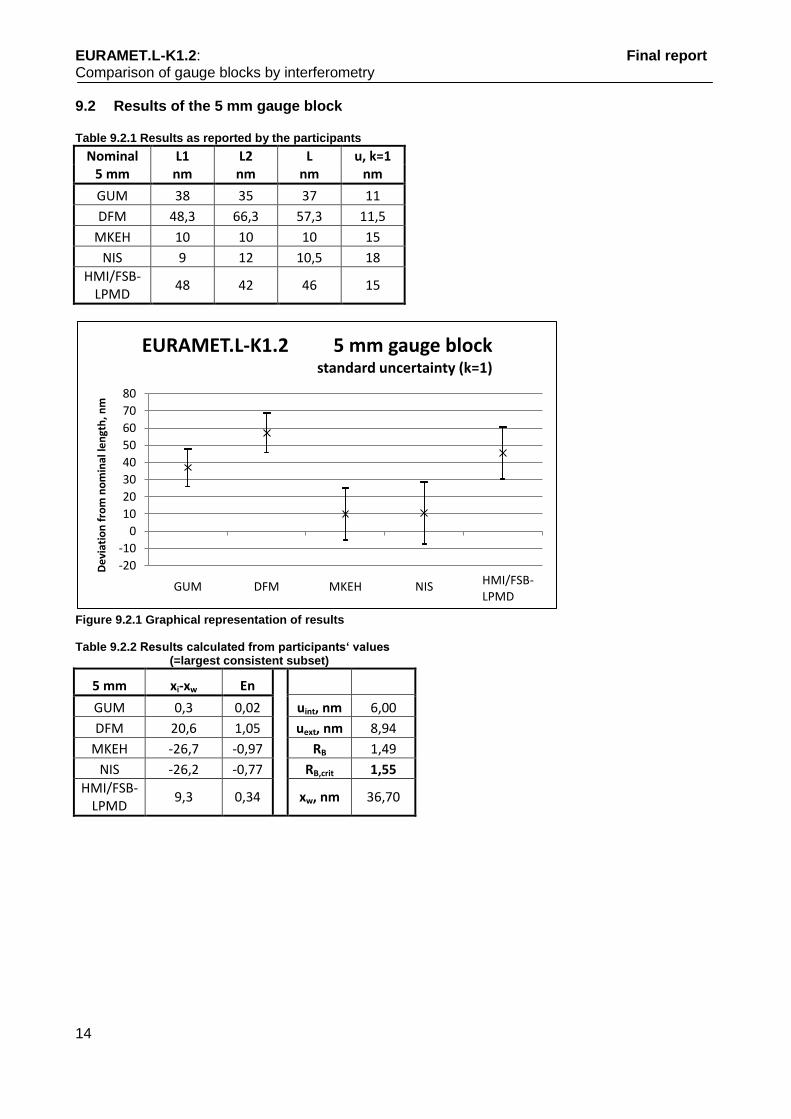
9.2 Results of the 5 mm gauge block Table 9.2.1 Results as reported by the participants
Nominal L1 L2 L u, k=1 5 mm nm nm nm nm
GUM 38 35 37 11
DFM 48,3 66,3 57,3 11,5
MKEH 10 10 10 15
NIS 9 12 10,5 18
HMI/FSB-LPMD
48 42 46 15
Figure 9.2.1 Graphical representation of results
Table 9.2.2 Results calculated from participants‘ values (=largest consistent subset)
5 mm xi-xw En
GUM 0,3 0,02 uint, nm 6,00
DFM 20,6 1,05 uext, nm 8,94
MKEH -26,7 -0,97 RB 1,49
NIS -26,2 -0,77 RB,crit 1,55
HMI/FSB-LPMD
9,3 0,34 xw, nm 36,70
-20
-10
0
10
20
30
40
50
60
70
80
GUM DFM MKEH NIS LFSB
De
viat
ion
fro
m n
om
inal
len
gth
, nm
EURAMET.L-K1.2 5 mm gauge blockstandard uncertainty (k=1)
HMI/FSB- LPMD

EURAMET.L-K1.2: Final report Comparison of gauge blocks by interferometry
15
9.3 Results of the 8 mm gauge block Table 9.3.1 Results as reported by the participants
Nominal L1 L2 L u, k=1 8 mm nm nm nm nm
GUM 92 89 90 11
DFM 102,3 122,3 112,3 11,6
MKEH 70 60 70 15
NIS 52 48 50 19
HMI/FSB-LPMD
87 88 88 15
Figure 9.3.1 Graphical representation of results
Table 9.3.2 Results calculated from participants‘ values
8 mm xi-xw En
GUM 1,6 0,09 uint, nm 6,05
DFM 23,9 1,21 uext, nm 9,49
MKEH -18,4 -0,67 RB 1,57
NIS -38,4 -1,07 RB,crit 1,55
HMI/FSB-LPMD -0,4 -0,02
xw, nm 88,43
Table 9.3.3 Results calculated from largest consistent subset
8 mm xi-xw En
GUM 10,5 0,62 uint, nm 7,08
DFM 32,8 1,78 uext, nm 8,23
MKEH -9,5 -0,36 RB 1,16
NIS -29,5 -0,84 RB,crit 1,62
HMI/FSB-LPMD
8,5 0,32 xw, nm 79,53
0
20
40
60
80
100
120
140
GUM DFM MKEH NIS LFSBDe
viat
ion
fro
m n
om
inal
len
gth
, nm
EURAMET.L-K1.2 8 mm gauge blockstandard uncertainty (k=1)
HMI/FSB- LPMD
EURAMET.L-K1.2: Final report Comparison of gauge blocks by interferometry
16
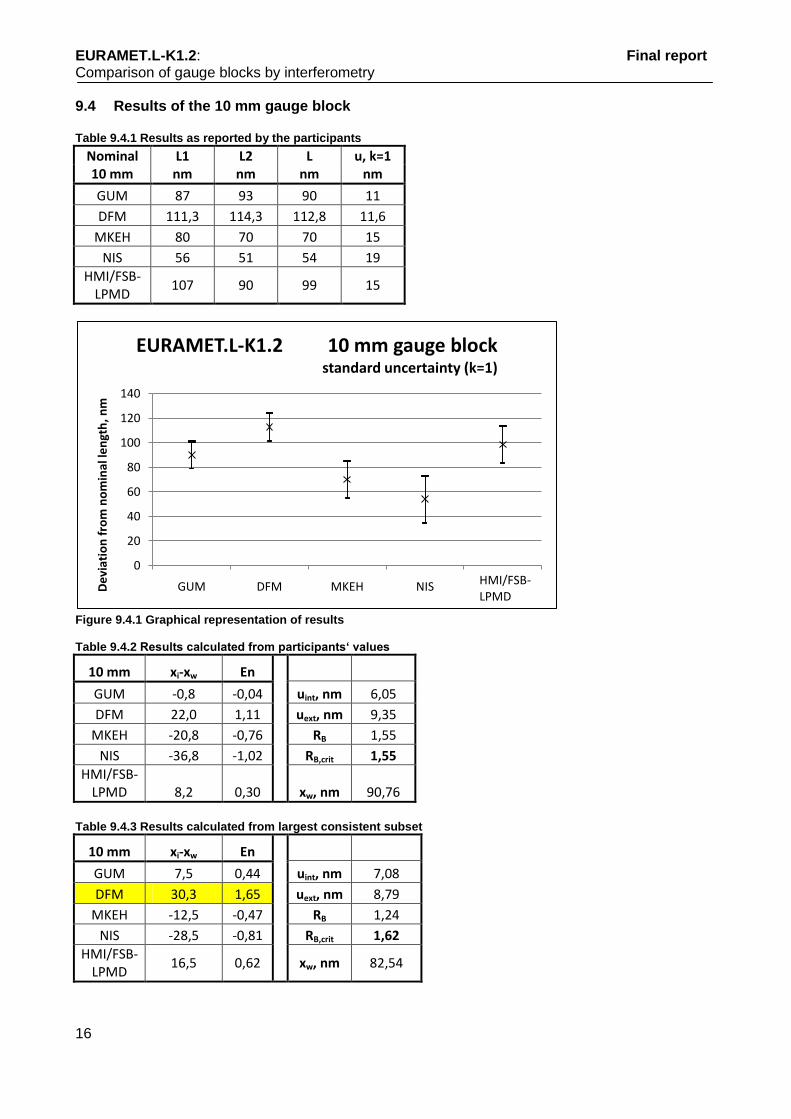
9.4 Results of the 10 mm gauge block Table 9.4.1 Results as reported by the participants
Nominal L1 L2 L u, k=1 10 mm nm nm nm nm
GUM 87 93 90 11
DFM 111,3 114,3 112,8 11,6
MKEH 80 70 70 15
NIS 56 51 54 19
HMI/FSB-LPMD
107 90 99 15
Figure 9.4.1 Graphical representation of results
Table 9.4.2 Results calculated from participants‘ values
10 mm xi-xw En
GUM -0,8 -0,04 uint, nm 6,05
DFM 22,0 1,11 uext, nm 9,35
MKEH -20,8 -0,76 RB 1,55
NIS -36,8 -1,02 RB,crit 1,55
HMI/FSB-LPMD 8,2 0,30
xw, nm 90,76
Table 9.4.3 Results calculated from largest consistent subset
10 mm xi-xw En
GUM 7,5 0,44 uint, nm 7,08
DFM 30,3 1,65 uext, nm 8,79
MKEH -12,5 -0,47 RB 1,24
NIS -28,5 -0,81 RB,crit 1,62
HMI/FSB-LPMD
16,5 0,62 xw, nm 82,54
0
20
40
60
80
100
120
140
GUM DFM MKEH NIS LFSBDe
viat
ion
fro
m n
om
inal
len
gth
, nm
EURAMET.L-K1.2 10 mm gauge blockstandard uncertainty (k=1)
HMI/FSB- LPMD
EURAMET.L-K1.2: Final report Comparison of gauge blocks by interferometry
17
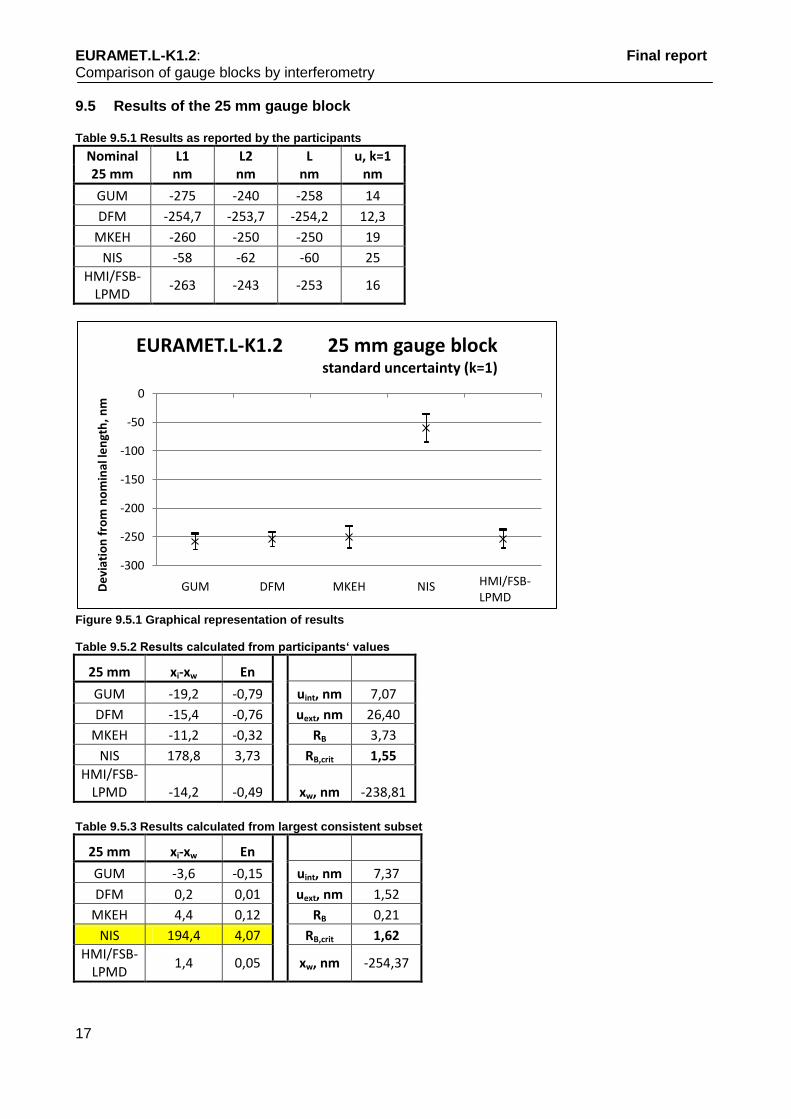
9.5 Results of the 25 mm gauge block Table 9.5.1 Results as reported by the participants
Nominal L1 L2 L u, k=1 25 mm nm nm nm nm
GUM -275 -240 -258 14
DFM -254,7 -253,7 -254,2 12,3
MKEH -260 -250 -250 19
NIS -58 -62 -60 25
HMI/FSB-LPMD
-263 -243 -253 16
Figure 9.5.1 Graphical representation of results
Table 9.5.2 Results calculated from participants‘ values
25 mm xi-xw En
GUM -19,2 -0,79 uint, nm 7,07
DFM -15,4 -0,76 uext, nm 26,40
MKEH -11,2 -0,32 RB 3,73
NIS 178,8 3,73 RB,crit 1,55
HMI/FSB-LPMD -14,2 -0,49
xw, nm -238,81
Table 9.5.3 Results calculated from largest consistent subset
25 mm xi-xw En
GUM -3,6 -0,15 uint, nm 7,37
DFM 0,2 0,01 uext, nm 1,52
MKEH 4,4 0,12 RB 0,21
NIS 194,4 4,07 RB,crit 1,62
HMI/FSB-LPMD
1,4 0,05 xw, nm -254,37
-300
-250
-200
-150
-100
-50
0
GUM DFM MKEH NIS LFSBDe
viat
ion
fro
m n
om
inal
len
gth
, nm
EURAMET.L-K1.2 25 mm gauge blockstandard uncertainty (k=1)
HMI/FSB- LPMD
EURAMET.L-K1.2: Final report Comparison of gauge blocks by interferometry
18
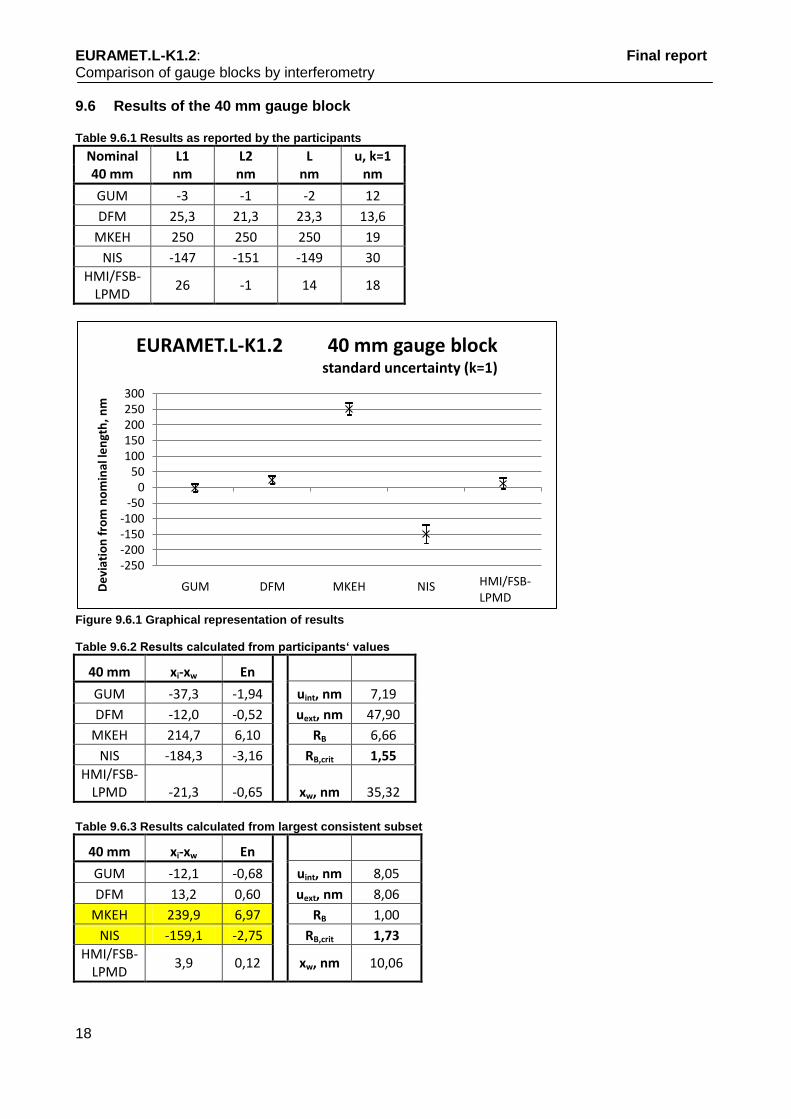
9.6 Results of the 40 mm gauge block Table 9.6.1 Results as reported by the participants
Nominal L1 L2 L u, k=1 40 mm nm nm nm nm
GUM -3 -1 -2 12
DFM 25,3 21,3 23,3 13,6
MKEH 250 250 250 19
NIS -147 -151 -149 30
HMI/FSB-LPMD
26 -1 14 18
Figure 9.6.1 Graphical representation of results
Table 9.6.2 Results calculated from participants‘ values
40 mm xi-xw En
GUM -37,3 -1,94 uint, nm 7,19
DFM -12,0 -0,52 uext, nm 47,90
MKEH 214,7 6,10 RB 6,66
NIS -184,3 -3,16 RB,crit 1,55
HMI/FSB-LPMD -21,3 -0,65
xw, nm 35,32
Table 9.6.3 Results calculated from largest consistent subset
40 mm xi-xw En
GUM -12,1 -0,68 uint, nm 8,05
DFM 13,2 0,60 uext, nm 8,06
MKEH 239,9 6,97 RB 1,00
NIS -159,1 -2,75 RB,crit 1,73
HMI/FSB-LPMD
3,9 0,12 xw, nm 10,06
-250-200-150-100
-500
50100150200250300
GUM DFM MKEH NIS LFSBDe
viat
ion
fro
m n
om
inal
len
gth
, nm
EURAMET.L-K1.2 40 mm gauge blockstandard uncertainty (k=1)
HMI/FSB- LPMD
EURAMET.L-K1.2: Final report Comparison of gauge blocks by interferometry
19
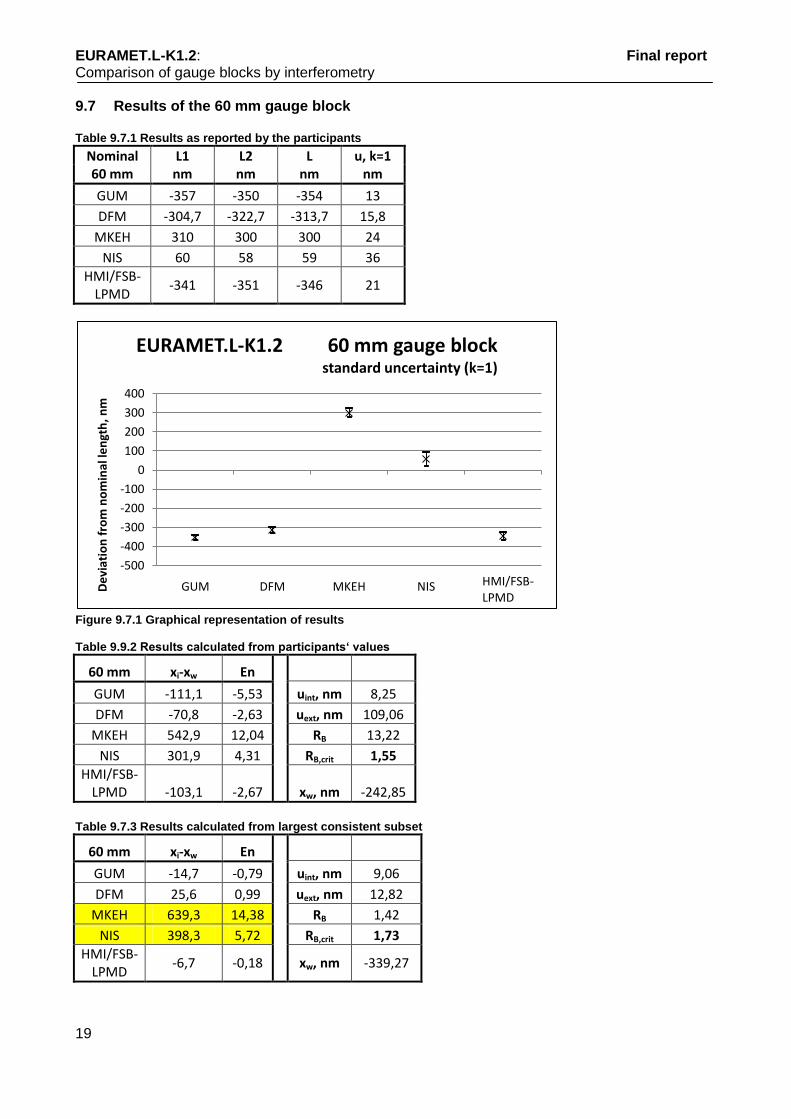
9.7 Results of the 60 mm gauge block Table 9.7.1 Results as reported by the participants
Nominal L1 L2 L u, k=1 60 mm nm nm nm nm
GUM -357 -350 -354 13
DFM -304,7 -322,7 -313,7 15,8
MKEH 310 300 300 24
NIS 60 58 59 36
HMI/FSB-LPMD
-341 -351 -346 21
Figure 9.7.1 Graphical representation of results
Table 9.9.2 Results calculated from participants‘ values
60 mm xi-xw En
GUM -111,1 -5,53 uint, nm 8,25
DFM -70,8 -2,63 uext, nm 109,06
MKEH 542,9 12,04 RB 13,22
NIS 301,9 4,31 RB,crit 1,55
HMI/FSB-LPMD -103,1 -2,67
xw, nm -242,85
Table 9.7.3 Results calculated from largest consistent subset
60 mm xi-xw En
GUM -14,7 -0,79 uint, nm 9,06
DFM 25,6 0,99 uext, nm 12,82
MKEH 639,3 14,38 RB 1,42
NIS 398,3 5,72 RB,crit 1,73
HMI/FSB-LPMD
-6,7 -0,18 xw, nm -339,27
-500
-400
-300
-200
-100
0
100
200
300
400
GUM DFM MKEH NIS LFSBDe
viat
ion
fro
m n
om
inal
len
gth
, nm
EURAMET.L-K1.2 60 mm gauge blockstandard uncertainty (k=1)
HMI/FSB- LPMD

EURAMET.L-K1.2: Final report Comparison of gauge blocks by interferometry
20
9.8 Results of the 90 mm gauge block Table 9.8.1 Results as reported by the participants
Nominal L1 L2 L u, k=1 90 mm nm nm nm nm
GUM 142 151 147 14
DFM 201,3 187,3 194,3 19,9
MKEH 210 210 210 32
NIS -87 -105 -96 47
HMI/FSB-LPMD
142 154 148 27
Figure 9.8.1 Graphical representation of results
Table 9.8.2 Results calculated from participants‘ values
90 mm xi-xw En
GUM -6,9 -0,35 uint, nm 9,79
DFM 40,4 1,16 uext, nm 29,28
MKEH 56,1 0,92 RB 2,99
NIS -249,9 -2,72 RB,crit 1,55
HMI/FSB-LPMD -5,9 -0,12
xw, nm 153,94
Table 9.8.3 Results calculated from largest consistent subset
90 mm xi-xw En
GUM -18,3 -0,93 uint, nm 10,01
DFM 29,0 0,84 uext, nm 14,39
MKEH 44,7 0,74 RB 1,44
NIS -261,3 -2,84 RB,crit 1,62
HMI/FSB-LPMD
-17,3 -0,34 xw, nm 165,28
-200
-150
-100
-50
0
50
100
150
200
250
300
GUM DFM MKEH NIS LFSBDe
viat
ion
fro
m n
om
inal
len
gth
, nm
EURAMET.L-K1.2 90 mm gauge blockstandard uncertainty (k=1)
HMI/FSB- LPMD
EURAMET.L-K1.2: Final report Comparison of gauge blocks by interferometry
21
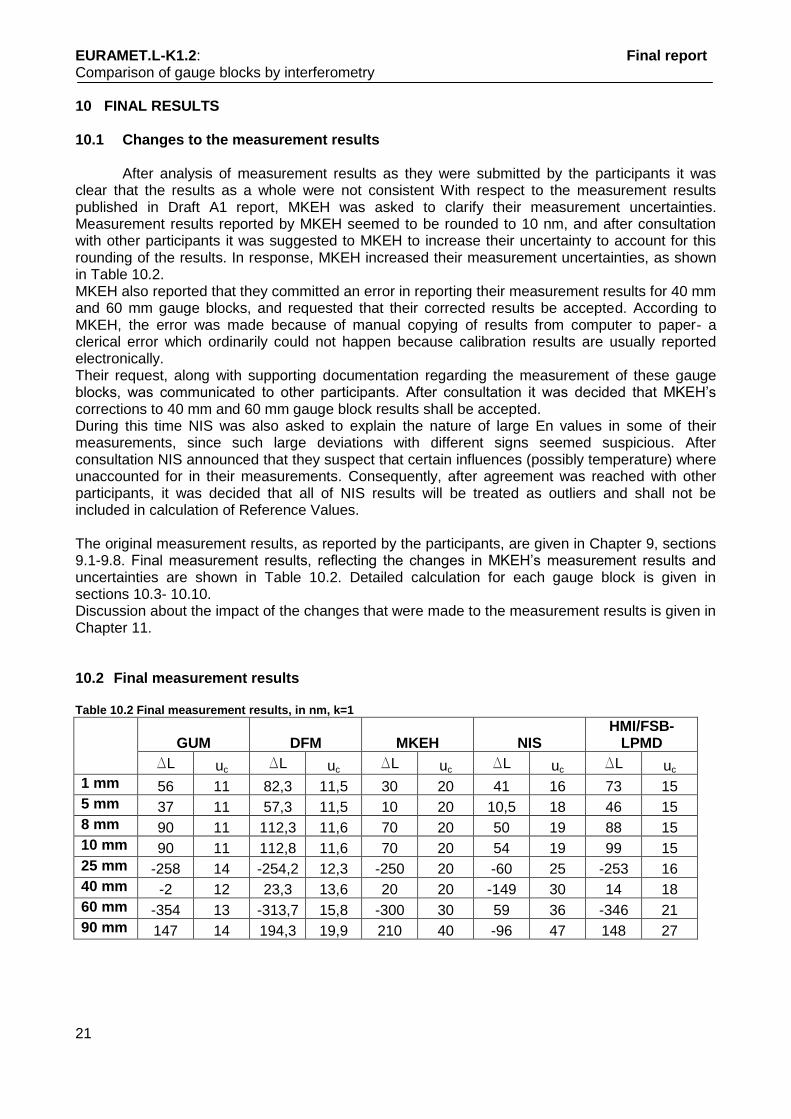
10 FINAL RESULTS 10.1 Changes to the measurement results After analysis of measurement results as they were submitted by the participants it was clear that the results as a whole were not consistent With respect to the measurement results published in Draft A1 report, MKEH was asked to clarify their measurement uncertainties. Measurement results reported by MKEH seemed to be rounded to 10 nm, and after consultation with other participants it was suggested to MKEH to increase their uncertainty to account for this rounding of the results. In response, MKEH increased their measurement uncertainties, as shown in Table 10.2. MKEH also reported that they committed an error in reporting their measurement results for 40 mm and 60 mm gauge blocks, and requested that their corrected results be accepted. According to MKEH, the error was made because of manual copying of results from computer to paper- a clerical error which ordinarily could not happen because calibration results are usually reported electronically. Their request, along with supporting documentation regarding the measurement of these gauge blocks, was communicated to other participants. After consultation it was decided that MKEH‟s corrections to 40 mm and 60 mm gauge block results shall be accepted. During this time NIS was also asked to explain the nature of large En values in some of their measurements, since such large deviations with different signs seemed suspicious. After consultation NIS announced that they suspect that certain influences (possibly temperature) where unaccounted for in their measurements. Consequently, after agreement was reached with other participants, it was decided that all of NIS results will be treated as outliers and shall not be included in calculation of Reference Values. The original measurement results, as reported by the participants, are given in Chapter 9, sections 9.1-9.8. Final measurement results, reflecting the changes in MKEH‟s measurement results and uncertainties are shown in Table 10.2. Detailed calculation for each gauge block is given in sections 10.3- 10.10. Discussion about the impact of the changes that were made to the measurement results is given in Chapter 11. 10.2 Final measurement results Table 10.2 Final measurement results, in nm, k=1
GUM DFM MKEH NIS HMI/FSB-
LPMD
DL uc DL uc DL uc DL uc DL uc
1 mm 56 11 82,3 11,5 30 20 41 16 73 15
5 mm 37 11 57,3 11,5 10 20 10,5 18 46 15
8 mm 90 11 112,3 11,6 70 20 50 19 88 15
10 mm 90 11 112,8 11,6 70 20 54 19 99 15
25 mm -258 14 -254,2 12,3 -250 20 -60 25 -253 16
40 mm -2 12 23,3 13,6 20 20 -149 30 14 18
60 mm -354 13 -313,7 15,8 -300 30 59 36 -346 21
90 mm 147 14 194,3 19,9 210 40 -96 47 148 27

EURAMET.L-K1.2: Final report Comparison of gauge blocks by interferometry
22
10.3 Results of the 1 mm gauge block Table 10.3.1 Final results
Nominal L1 L2 L u, k=1 1 mm nm nm nm nm
GUM 57 56 56 11
DFM 73,3 91,3 82,3 11,5
MKEH 30 20 30 20
HMI/FSB-LPMD
70 76 73,0 15
Figure 10.3.1 Graphical representation of results
Table 10.3.2 Results calculated from participants‘ values (=largest consistent subset)
1 mm xi-xw En uint, nm 6,63
GUM -9,2 -0,52 uext, nm 9,59
DFM 17,1 0,91 RB 1,45
MKEH -35,2 -0,93 RB,crit 1,62
HMI/FSB-LPMD
7,8 0,29 xw, nm 65,20
NIS -24,2 -0,83
0
10
20
30
40
50
60
70
80
90
100
GUM DFM MKEH LFSBDe
viat
ion
fro
m n
om
inal
len
gth
, nm
EURAMET.L-K1.2 1 mm gauge blockstandard uncertainty (k=1)
HMI/FSB- LPMD

EURAMET.L-K1.2: Final report Comparison of gauge blocks by interferometry
23
10.4 Results of the 5 mm gauge block Table 10.4.1 Final results
Nominal L1 L2 L u, k=1 5 mm nm nm nm nm
GUM 38 35 37 11
DFM 48,3 66,3 57,3 11,5
MKEH 10 10 10 20
HMI/FSB-LPMD
48 42 46,0 15
Figure 10.4.1 Graphical representation of results
Table 10.4.2 Results calculated from participants‘ values (=largest consistent subset)
5 mm xi-xw En uint, nm 6,63
GUM -5,5 -0,32 uext, nm 8,21
DFM 14,8 0,79 RB 1,24
MKEH -32,5 -0,86 RB,crit 1,62
HMI/FSB-LPMD
3,5 0,13 xw, nm 42,53
NIS -32,0 -0,96
-10
0
10
20
30
40
50
60
70
80
GUM DFM MKEH LFSB
De
viat
ion
fro
m n
om
inal
len
gth
, nm
EURAMET.L-K1.2 5 mm gauge blockstandard uncertainty (k=1)
HMI/FSB- LPMD

EURAMET.L-K1.2: Final report Comparison of gauge blocks by interferometry
24
10.5 Results of the 8 mm gauge block Table 10.5.1 Final results
Nominal L1 L2 L u, k=1 8 mm nm nm nm nm
GUM 92 89 90 11
DFM 102,3 122,3 112,3 11,6
MKEH 70 60 70 20
HMI/FSB-LPMD
87 88 88,0 15
Figure 10.5.1 Graphical representation of results
Table 10.5.2 Results calculated from participants‘ values (=largest consistent subset)
8 mm xi-xw En uint, nm 6,65
GUM -4,7 -0,27 uext, nm 7,87
DFM 17,6 0,92 RB 1,18
MKEH -24,7 -0,66 RB,crit 1,62
HMI/FSB-LPMD
-6,7 -0,25 xw, nm 94,72
NIS -44,7 -1,26
40
50
60
70
80
90
100
110
120
130
GUM DFM MKEH LFSBDe
viat
ion
fro
m n
om
inal
len
gth
, nm
EURAMET.L-K1.2 8 mm gauge blockstandard uncertainty (k=1)
HMI/FSB- LPMD
EURAMET.L-K1.2: Final report Comparison of gauge blocks by interferometry
25
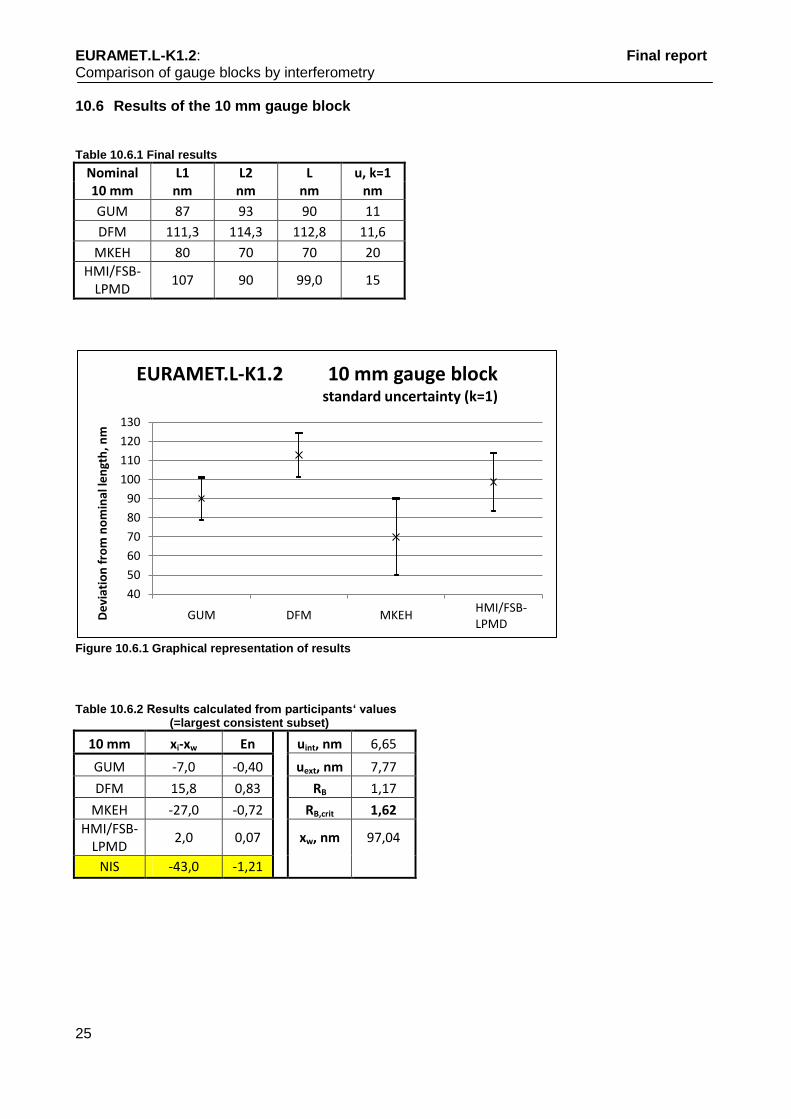
10.6 Results of the 10 mm gauge block Table 10.6.1 Final results
Nominal L1 L2 L u, k=1 10 mm nm nm nm nm
GUM 87 93 90 11
DFM 111,3 114,3 112,8 11,6
MKEH 80 70 70 20
HMI/FSB-LPMD
107 90 99,0 15
Figure 10.6.1 Graphical representation of results
Table 10.6.2 Results calculated from participants‘ values (=largest consistent subset)
10 mm xi-xw En uint, nm 6,65
GUM -7,0 -0,40 uext, nm 7,77
DFM 15,8 0,83 RB 1,17
MKEH -27,0 -0,72 RB,crit 1,62
HMI/FSB-LPMD
2,0 0,07 xw, nm 97,04
NIS -43,0 -1,21
40
50
60
70
80
90
100
110
120
130
GUM DFM MKEH LFSBDe
viat
ion
fro
m n
om
inal
len
gth
, nm
EURAMET.L-K1.2 10 mm gauge blockstandard uncertainty (k=1)
HMI/FSB- LPMD

EURAMET.L-K1.2: Final report Comparison of gauge blocks by interferometry
26
10.7 Results of the 25 mm gauge block Table 10.7.1 Final results
Nominal L1 L2 L u, k=1 25 mm nm nm nm nm
GUM -275 -240 -258 14
DFM -254,7 -253,7 -254,2 12,3
MKEH -260 -250 -250 20
HMI/FSB-LPMD
-263 -243 -253,0 16
Figure 10.7.1 Graphical representation of results
Table 10.7.2 Results calculated from participants‘ values (=largest consistent subset)
25 mm xi-xw En uint, nm 7,43
GUM -3,6 -0,15 uext, nm 1,50
DFM 0,2 0,01 RB 0,20
MKEH 4,4 0,12 RB,crit 1,62
HMI/FSB-LPMD
1,4 0,05 xw, nm -254,43
NIS 194,4 4,07
-280
-270
-260
-250
-240
-230
-220
-210
-200
GUM DFM MKEH LFSBDe
viat
ion
fro
m n
om
inal
len
gth
, nm
EURAMET.L-K1.2 25 mm gauge blockstandard uncertainty (k=1)
HMI/FSB- LPMD

EURAMET.L-K1.2: Final report Comparison of gauge blocks by interferometry
27
10.8 Results of the 40 mm gauge block Table 10.8.1 Final results
Nominal L1 L2 L u, k=1 40 mm nm nm nm nm
GUM -3 -1 -2 12
DFM 25,3 21,3 23,3 13,6
MKEH 30 20 20 20
HMI/FSB-LPMD
26 -1 14,0 18
Figure 10.8.1 Graphical representation of results
Table 10.8.2 Results calculated from participants‘ values (=largest consistent subset)
40 mm xi-xw En uint, nm 7,47
GUM -13,4 -0,72 uext, nm 6,42
DFM 11,9 0,52 RB 0,86
MKEH 8,6 0,23 RB,crit 1,62
HMI/FSB-LPMD
2,6 0,08 xw, nm 11,45
NIS -160,4 -2,76
-20
-10
0
10
20
30
40
50
GUM DFM MKEH LFSBDe
viat
ion
fro
m n
om
inal
len
gth
, nm
EURAMET.L-K1.2 40 mm gauge blockstandard uncertainty (k=1)
HMI/FSB- LPMD

EURAMET.L-K1.2: Final report Comparison of gauge blocks by interferometry
28
10.9 Results of the 60 mm gauge block Table 10.9.1 Final results
Nominal L1 L2 L u, k=1 60 mm nm nm nm nm
GUM -357 -350 -354 13
DFM -304,7 -322,7 -313,7 15,8
MKEH -310 -300 -300 30
HMI/FSB-LPMD
-341 -351 -346,0 21
Figure 10.9.1 Graphical representation of results
Table 10.9.2 Results calculated from participants‘ values (=largest consistent subset)
60 mm xi-xw En uint, nm 8,67
GUM -18,0 -0,93 uext, nm 11,82
DFM 22,3 0,84 RB 1,36
MKEH 36,0 0,63 RB,crit 1,62
HMI/FSB-LPMD
-10,0 -0,26 xw, nm -335,99
NIS 395,0 5,65
-370-360-350-340-330-320-310-300-290-280-270-260
GUM DFM MKEH LFSBDe
viat
ion
fro
m n
om
inal
len
gth
, nm
EURAMET.L-K1.2 60 mm gauge blockstandard uncertainty (k=1)
HMI/FSB- LPMD

EURAMET.L-K1.2: Final report Comparison of gauge blocks by interferometry
29
10.10 Results of the 90 mm gauge block Table 10.10.1 Final results
Nominal L1 L2 L u, k=1 90 mm nm nm nm nm
GUM 142 151 147 14
DFM 201,3 187,3 194,3 19,9
MKEH 210 210 210 40
HMI/FSB-LPMD
142 154 148,0 27
Figure 10.10.1 Graphical representation of results
Table 10.10.2 Results calculated from participants‘ values (=largest consistent subset)
90 mm xi-xw En uint, nm 10,19
GUM -16,6 -0,87 uext, nm 13,76
DFM 30,7 0,90 RB 1,35
MKEH 46,4 0,60 RB,crit 1,62
HMI/FSB-LPMD
-15,6 -0,31 xw, nm 163,64
NIS -259,6 -2,83
120130140150160170180190200210220230240250260
GUM DFM MKEH LFSBDe
viat
ion
fro
m n
om
inal
len
gth
, nm
EURAMET.L-K1.2 90 mm gauge blockstandard uncertainty (k=1)
HMI/FSB- LPMD
EURAMET.L-K1.2: Final report Comparison of gauge blocks by interferometry
30
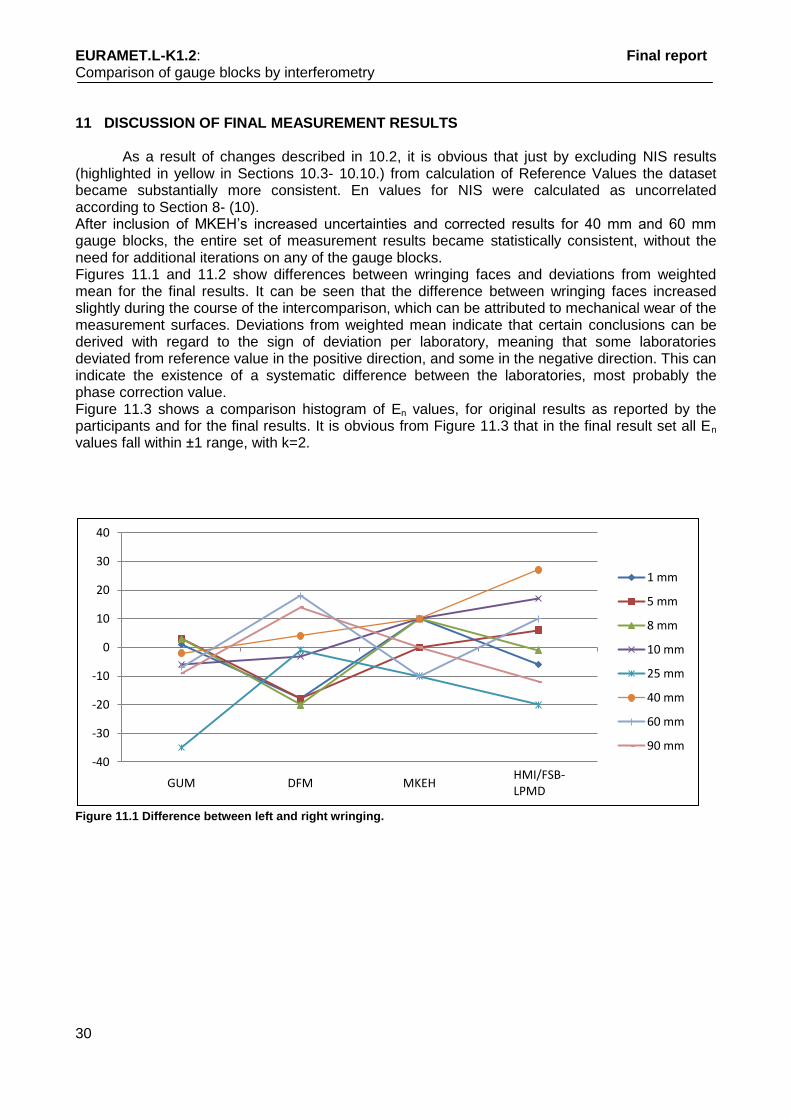
11 DISCUSSION OF FINAL MEASUREMENT RESULTS As a result of changes described in 10.2, it is obvious that just by excluding NIS results (highlighted in yellow in Sections 10.3- 10.10.) from calculation of Reference Values the dataset became substantially more consistent. En values for NIS were calculated as uncorrelated according to Section 8- (10). After inclusion of MKEH‟s increased uncertainties and corrected results for 40 mm and 60 mm gauge blocks, the entire set of measurement results became statistically consistent, without the need for additional iterations on any of the gauge blocks. Figures 11.1 and 11.2 show differences between wringing faces and deviations from weighted mean for the final results. It can be seen that the difference between wringing faces increased slightly during the course of the intercomparison, which can be attributed to mechanical wear of the measurement surfaces. Deviations from weighted mean indicate that certain conclusions can be derived with regard to the sign of deviation per laboratory, meaning that some laboratories deviated from reference value in the positive direction, and some in the negative direction. This can indicate the existence of a systematic difference between the laboratories, most probably the phase correction value. Figure 11.3 shows a comparison histogram of En values, for original results as reported by the participants and for the final results. It is obvious from Figure 11.3 that in the final result set all En values fall within ±1 range, with k=2.
Figure 11.1 Difference between left and right wringing.
-40
-30
-20
-10
0
10
20
30
40
GUM DFM MKEH LFSB
1 mm
5 mm
8 mm
10 mm
25 mm
40 mm
60 mm
90 mm
HMI/FSB- LPMD

EURAMET.L-K1.2: Final report Comparison of gauge blocks by interferometry
31
Figure 11.2 Deviations from weighted means.
Figure 11.3 Histogram of En values
-40,0
-30,0
-20,0
-10,0
0,0
10,0
20,0
30,0
40,0
50,0
60,0
GUM DFM MKEH LFSB
1 mm
5 mm
8 mm
10 mm
25 mm
40 mm
60 mm
90 mm
0
1
2
3
4
5
6
7
8
-3-2
,5 -2-1
,5 -1-0
,5 00
,5 11
,5 22
,5 33
,5 44
,5 55
,5 66
,5 77
,5 88
,5 99
,5 10
10
,5 11
11
,5 12
12
,5 13
13
,5 14
14
,5
Fre
qu
en
cy
En values
Original resultsFinal results
HMI/FSB- LPMD

EURAMET.L-K1.2: Final report Comparison of gauge blocks by interferometry
32
APPENDIX 1: KEY COMPARISON REFERENCE VALUES
In order to satisfy the requirements of the Mutual Recognition Arrangement, the „Key Comparison Reference Values‟ have been evaluated according to the method described in Chapter 8: the weighted mean was determined and the deviations from the weighted mean were then calculated. The uncertainty of the weighted mean is based on the internal standard deviation of the final measurement results. The results of the pilot laboratory contribute only once to the calculation of the reference values. This excludes the preliminary „stability‟ measurements of the gauge blocks, performed by the pilot laboratory. Table A1 shows the Key Comparison Reference Values and their standard uncertainties. Table A1 Key Comparison Reference Values and associated standard uncertainty (k=1).
Serial number
Nominal length (mm)
Reference value (nm)
Reference value uncertainty (nm)
87656 1 65,2 6,6
87656 5 42,5 6,6
87656 8 94,7 6,7
87623 10 97 6,7
87680 25 -254,4 7,4
87680 40 11,5 7,5
87680 60 -336 8,7
87623 90 163,6 10,2

EURAMET.L-K1.2: Final report Comparison of gauge blocks by interferometry
33
APPENDIX 2: COMPARISON WITH REFERENCE VALUES
Table A2 shows the differences of measured values with respect to Key Comparison Reference Values and the expanded (k=2) uncertainties of these differences, calculated by:
)()(2)( 22
refirefi xuxuxxU
where u(xi) is the standard uncertainty of the laboratory result xi and u(xref) is the standard uncertainty of the reference value xref. Table A2 Differences of measured values and KCRV’s, with expanded uncertainties (k=2)
Lab. Gauge block
GUM DFM MKEH HMI/FSB-LPMD
1 mm xi-xref -9,2 17,1 -35,2 7,8
U(xi-xref) 17,6 18,8 37,7 26,9
5 mm xi-xref -5,5 14,8 -32,5 3,5
U(xi-xref) 17,6 18,8 37,7 26,9
8 mm xi-xref -4,7 17,6 -24,7 -6,7
U(xi-xref) 17,5 19 37,7 26,9
10 mm xi-xref -7,0 15,8 -27,0 2,0
U(xi-xref) 17,5 19 37,7 26,9
25 mm xi-xref -3,6 0,2 4,4 1,4
U(xi-xref) 23,7 19,6 37,1 28,3
40 mm xi-xref -13,4 11,9 8,6 2,6
U(xi-xref) 18,8 22,7 37,1 32,8
60 mm xi-xref -18,0 22,3 36,0 -10,0
U(xi-xref) 19,4 26,4 57,4 38,3
90 mm xi-xref -16,6 30,7 46,4 -15,6
U(xi-xref) 19,2 34,2 77,4 50
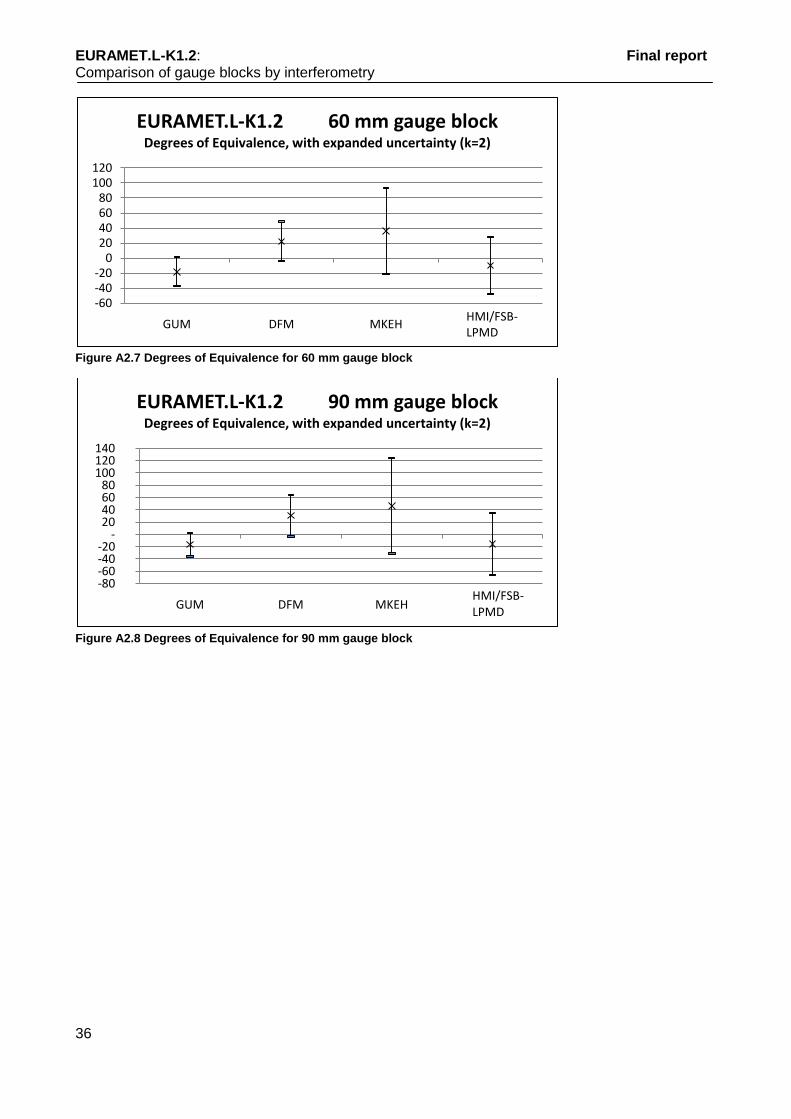
Figures A2.1 through A2.8 show the graphs of Degrees of Equivalence for the eight gauge blocks.

EURAMET.L-K1.2: Final report Comparison of gauge blocks by interferometry
34
Figure A2.1 Degrees of Equivalence for 1 mm gauge block
Figure A2.2 Degrees of Equivalence for 5 mm gauge block
Figure A2.3 Degrees of Equivalence for 8 mm gauge block
-80-70-60-50-40-30-20-10
010203040
GUM DFM MKEH LFSB
EURAMET.L-K1.2 1 mm gauge blockDegrees of Equivalence, with expanded uncertainty (k=2)
-80-70-60-50-40-30-20-10
010203040
GUM DFM MKEH LFSB
EURAMET.L-K1.2 5 mm gauge blockDegrees of Equivalence, with expanded uncertainty (k=2)
-70-60-50-40-30-20-10
010203040
GUM DFM MKEH LFSB
EURAMET.L-K1.2 8 mm gauge blockDegrees of Equivalence, with expanded uncertainty (k=2)
HMI/FSB- LPMD
HMI/FSB- LPMD
HMI/FSB- LPMD

EURAMET.L-K1.2: Final report Comparison of gauge blocks by interferometry
35
Figure A2.4 Degrees of Equivalence for 10 mm gauge block
Figure A2.5 Degrees of Equivalence for 25 mm gauge block
Figure A2.6 Degrees of Equivalence for 40 mm gauge block
-70-60-50-40-30-20-10
010203040
GUM DFM MKEH LFSB
EURAMET.L-K1.2 10 mm gauge blockDegrees of Equivalence, with expanded uncertainty (k=2)
-40-30-20-10
01020304050
GUM DFM MKEH LFSB
EURAMET.L-K1.2 25 mm gauge blockDegrees of Equivalence, with expanded uncertainty (k=2)
-40-30-20-10
01020304050
GUM DFM MKEH LFSB
EURAMET.L-K1.2 40 mm gauge blockDegrees of Equivalence, with expanded uncertainty (k=2)
HMI/FSB- LPMD
HMI/FSB- LPMD
HMI/FSB- LPMD
EURAMET.L-K1.2: Final report Comparison of gauge blocks by interferometry
36
Figure A2.7 Degrees of Equivalence for 60 mm gauge block
Figure A2.8 Degrees of Equivalence for 90 mm gauge block
-60-40-20
020406080
100120
GUM DFM MKEH LFSB
EURAMET.L-K1.2 60 mm gauge blockDegrees of Equivalence, with expanded uncertainty (k=2)
-80 -60 -40 -20
-20 40 60 80
100 120 140
GUM DFM MKEH LFSB
EURAMET.L-K1.2 90 mm gauge blockDegrees of Equivalence, with expanded uncertainty (k=2)
HMI/FSB- LPMD
HMI/FSB- LPMD
EURAMET.L-K1.2: Final report Comparison of gauge blocks by interferometry
37
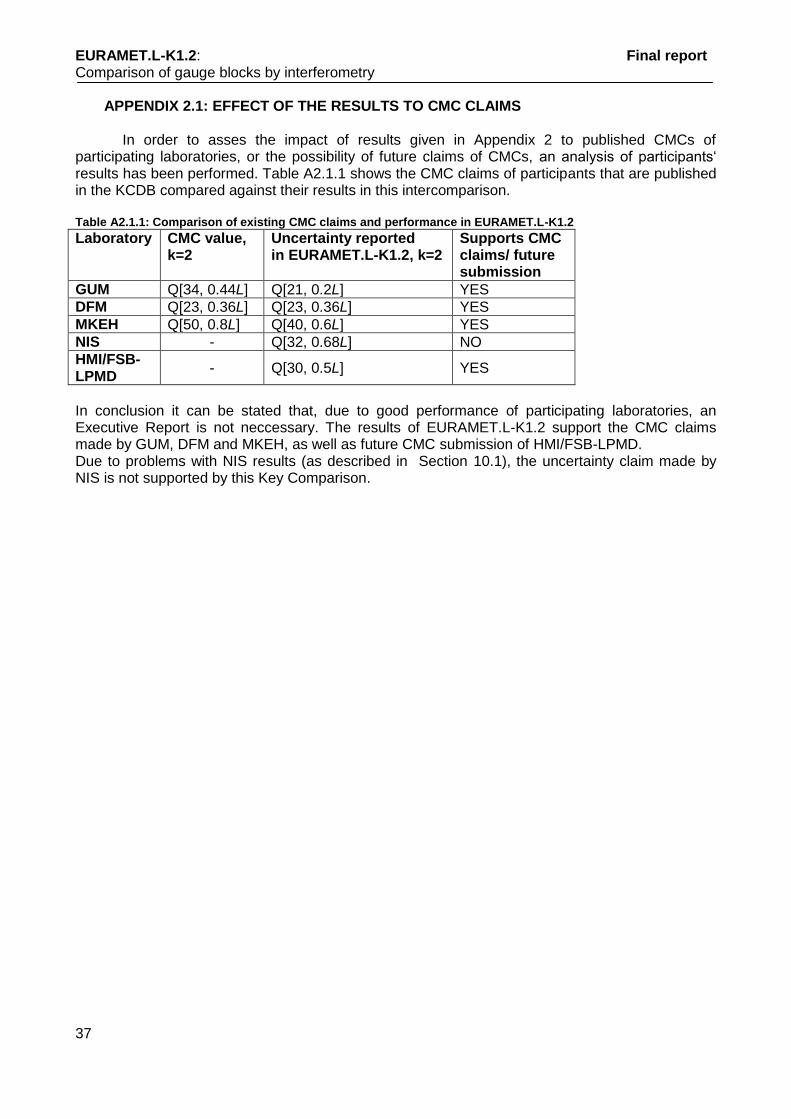
APPENDIX 2.1: EFFECT OF THE RESULTS TO CMC CLAIMS In order to asses the impact of results given in Appendix 2 to published CMCs of participating laboratories, or the possibility of future claims of CMCs, an analysis of participants„ results has been performed. Table A2.1.1 shows the CMC claims of participants that are published in the KCDB compared against their results in this intercomparison. Table A2.1.1: Comparison of existing CMC claims and performance in EURAMET.L-K1.2
Laboratory CMC value, k=2
Uncertainty reported in EURAMET.L-K1.2, k=2
Supports CMC claims/ future submission
GUM Q[34, 0.44L] Q[21, 0.2L] YES
DFM Q[23, 0.36L] Q[23, 0.36L] YES
MKEH Q[50, 0.8L] Q[40, 0.6L] YES
NIS - Q[32, 0.68L] NO
HMI/FSB-LPMD
- Q[30, 0.5L] YES
In conclusion it can be stated that, due to good performance of participating laboratories, an Executive Report is not neccessary. The results of EURAMET.L-K1.2 support the CMC claims made by GUM, DFM and MKEH, as well as future CMC submission of HMI/FSB-LPMD. Due to problems with NIS results (as described in Section 10.1), the uncertainty claim made by NIS is not supported by this Key Comparison.