EuroEyes International Eye Clinic Limited
28
EuroEyes International Eye Clinic Limited 2020 Annual Results Presentation
Transcript of EuroEyes International Eye Clinic Limited

EuroEyes International Eye Clinic Limited
2020 Annual Results Presentation

2
Disclaimer
This presentation is for reference purposes only. This presentation is prepared by EuroEyes International Eye Clinic Limited (“EuroEyes” or “the Group”)
for business communications and general reference of the Group and shall not constitute in whole or in part any offer to purchase or subscription for
shares in EuroEyes or any of its subsidiaries. The presentation shall not form any basis for any offer or commitment of any person(s) receiving it. Please
consult a professional advisor prior to use or reliance on any relevant data. The presentation is an introduction only and shall not form a full
description of the business, and current or past performance of the Group. The information and data presented or contained in these materials is
subject to change without notice and its accuracy is not guaranteed.
No representation or warranty, expressed or implied, is made on this presentation. The Group accepts no liability arising from the use of or reliance on
any information (whether financial or other data) presented or contained in this presentation.
No one shall in any way modify, copy, publicly display, publish or distribute such materials or otherwise use the materials for any public or commercial
purposes without the prior written consent of the Group.
3
2020 Company Performance Overview

4
Full Year 2020 Overview
Total Revenue Adjusted Gross Profit Adjusted Net Profit After Tax
18.3% YoY 40.4% YoY10.3% YoY
HK$ 473,818,000
+ HK$ 44,126,000
HK$ 214,100,000
+ HK$ 33,141,000
HK$ 70,614,000
+ HK$ 20,331,000
45.2% Margin 14.9% Margin
!Industry reports estimate a decline of 21% in total refractive
industry procedures in 2020 as compared to the prior year.

55
Strong Performance despite COVID-19 Pandemic
Factors for Strong Performance
People in home officehave lots of spare time
People are cash rich because theyare not able to go on holidays
People in Video-conferences stare at their own face
People wearing masks complain of foggy glasses

6
Group Revenue Development
(refractive surgery procedures, in thousands of HKD)
103.630
94.795
2019/Q1 2020/Q4
121.514
2020/Q2
100.59397.609
125.424
151.415
2019/Q2 2020/Q32019/Q3 2019/Q4 2020/Q1
98.944
+17,3%
+20,7%

7
Revenue country-by-country
(in thousands of HKD)
Revenue in Germany Revenue in the PRC Revenue in Denmark
HK$304,788,000+14.9% YoY
HK$108,114,000-4.7% YoY
HK$60,916,000+19.5% YoY
129.464
-0,4%YoY
2020 1H
+29,7%YoY
2020 2H
175.324
2020 2H
-30,7%YoY
+17,8%YoY
2020 1H
36.420
71.694
2020 2H
+39,0%YoY
22.949
-3,0%YoY
2020 1H
37.967

8
Capacity Utilization Rate
EuroEyes capacity utilization rate measures the proportion of potential surgery capacity that is actually realized
24.3%
21.3%
21.4%
21,640Surgeries
23.2%Utilization
Adj.Gross Profit Margin
45.2%
Adj.Net Profit Margin
14.9%
Revenue HK$ 473,818,000
9
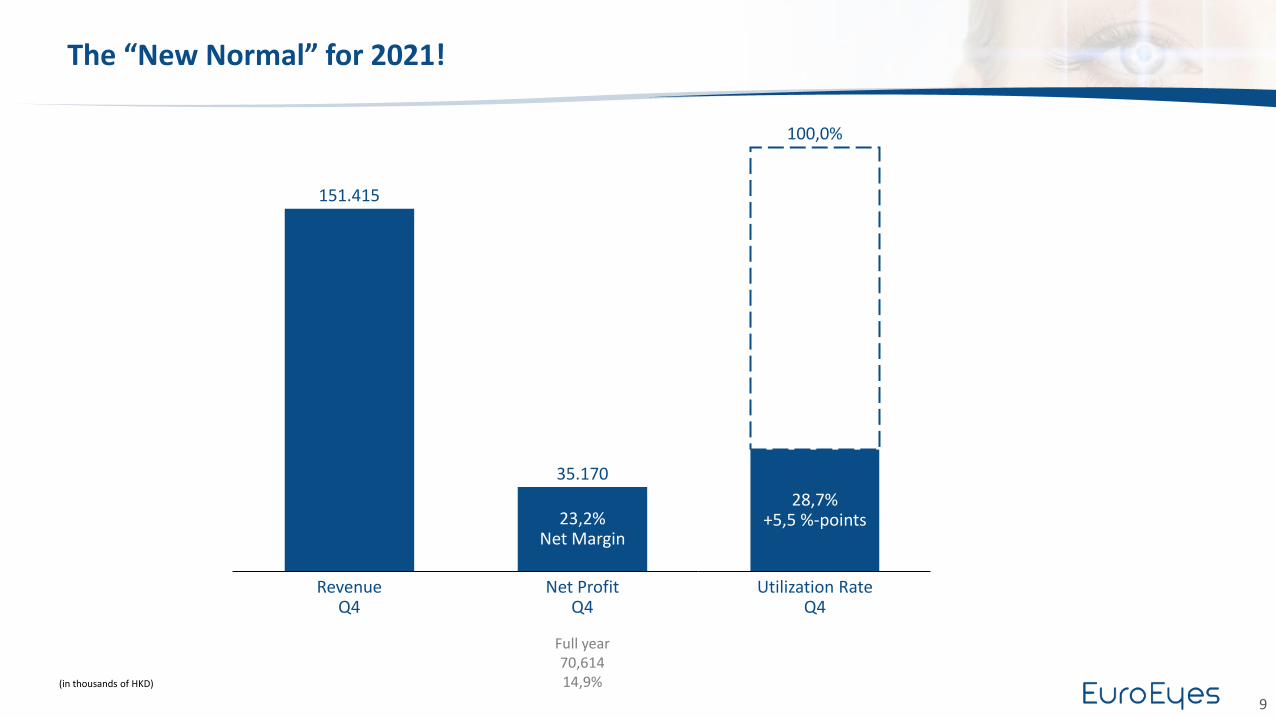
The “New Normal” for 2021!
(in thousands of HKD)
Net ProfitQ4
23,2%Net Margin
RevenueQ4
35.170
151.415
100,0%
Utilization RateQ4
28,7%+5,5 %-points
Full year70,61414,9%

10
Profitability of EuroEyes Compared to its Peers
Comparison of Profitability Between Different Eye Clinics in Asia and EuroEyes – Profit Before Tax Margin
Other Eye Clinics 2016 2017 2018 2019
Competitor A 13.94 12.5 12.6 13.8
Competitor B 18.8 12.8 9.9 6.8
Competitor C N/A 4.9 7.7 8.9
Competitor D N/A 15.1 13.3 15.8
Competitor E N/A -1.7 3.0 4.1
* The market data come from the information disclosed by listed peer companies or public information disclosed by unlisted peer companies.
202020172016 2018 2019
22,2%
16,4%
10,5%
18,0%
12,5%
19,9%
9,9%
17,5%MarketMedianAverage
8,9%EuroEyes

11
EuroEyes is Confident of Broadening its Scope of Services
▪ Acquisition of refractive eye clinics in Europe
▪ Acquisition of German Eye Hospitals to broaden our scope of service, offer in-patient treatment and gain surgeon training facilities
▪ 2 new eye consultation centres in Germany
▪ 2 new eye clinics in PRC (2021/2022)
Mergers & Acquisition Priorities Organic Growth
12
2020 Business Strategies & Highlights

1313
Every month we exceeded our prior year consultationbookings
Consultation No. 1,240February 2021
Germany – Record Level of Consultation Bookings

14
Germany – Record Level of Consultation Bookings
Mar AugJunJan Feb JulApr NovMay
2019
Sep Oct Dec
2020
2021
1.240

15
Denmark - 2021: New Danish Flagship Clinic in Copenhagen “Olympic” Stadium
(in thousands of HKD)
Revenue in Denmark
60.916
2018 2019 2020
36.880
50.977
+28,5%

16
PRC - Multichannel Cooperation to Increase Brand Awareness / Patient Source
Cooperation Detail
• Trial stage cooperation - EuroEyes will provide medical experts to assist iKang Healthcare Group expand scope of examination in the area of ophthalmology. Customers will have the chance to enjoy a more in-depth ophthalmology examination. Meanwhile, EuroEyes medical experts will focus on patients with refractive error, cataract or abnormalities in the retina such as diabetic retinopathy, early retina tear, macula degeneration etc.
• iKang Healthcare Group is a leading mid-to-high-end medical examination and health management company in China. Through multiple brands, it provides customers with high-quality health management services and medical services, such as medical examination, disease screening, dental services, private doctor services, workplace medical care, vaccination and anti-aging solutions.
• The cooperation will start in Beijing then to be expanded in Shanghai, Guangzhou and Shenzhen.
• By cooperating with local partners, EuroEyes is able to provide broader scope of services to ourpatients, such as myopia control for children. Better customer engagement in return will furtherimprove word of mouth effect.
• Meanwhile, EuroEyes is also actively promoting its brand and services by routine joint onlinelecture event. This enable EuroEyes to reach out to a broader scope of patients who havedemands for vision correction.

17
PRC – Chongqing Clinic Opening in April 2021
Chongqing Clinic
Located at Middle-high End Residential Area

18
PRC – Chonggqing Clinic Opening in April 2021
Construction work resumed – local COVID-19 restrictions
lifted
2019 December 2020 June 2020 December 2021 March
1
Construction work commenced
Local COVID-19 Pandemic restrictionAll construction work paused
Medical license granted
Construction work completed
3 4
Chongqing Clinic Timeline
2021 April
First Surgery
2 5
19
2020 Financial Overview

20
Full Year 2020 Overview
Key Financial Data in 2020
For the year ended
2020 2019 YoY Change
HKD‘000 HKD‘000 %
Revenue 473,818 429,692 10.3
Cost of Sales (259,718) (251,971) 3.1
Gross Profit 214,100 177,721 20.5
Gross Profit Margin (%) 45.2% 41.4% 3.8 p.p
Adjusted gross profit 214,100 180,959 18.3
Adjusted gross profit margin(%) 45.2% 42.1% 3.1 p.p
Net Profit/(Loss) After Tax 64,073 (-3,686) 1,838.3
Net Profit Margin (%) 13.5% (0.9)% 14.4 p.p
Adjusted net profit 70,614 50,283 40.4
Adjusted net profit margin(%) 14.9% 11.7% 3.2 p.p
Adjusted Net Profit Margin
(in %)
20202019 "New Normal"2020/Q4
14,9%
11,7%
23,2%
Industry reports estimate a decline of 21% in total refractive industry procedures in 2020 as compared to the prior year.

21
Earnings Performance by Geographical Regions and Types of Surgery
* Others - ICRS implantation, including ICRS implantation and PRK and LASEK/ other revenue
The Year ended 31 December
2020 2019 YoY Change
HKD’000 HKD’000 %
Surgery Revenue 462,353 415,993 11.1%
Refractive Laser Surgery 166,653 156,019 6.8%
ICL 68,285 58,910 15.9%
Lens Exchange Surgery 227,415 201,064 13.1%
Revenue by Geographical Regions Revenue by Type of surgery
Refractive Laser Surgery36.0%
ICL14.8%
Lens Exchange Surgery49.2%
64.3%
22.8%
12.9%
The Year ended 31 December
2020 2019 YoY Change
HKD’000 HKD’000 %
Total 473,818 429,692 10.3%
Germany 304,788 265,240 14.9%
PRC 108,114 113,475 -4.7%
Denmark 60,916 50,977 19.5%

22
Numbers of Surgery and Average Fee per Surgery
6,2988,052
9,649 10,294 11,007990
1,451
2,017 2,1092,729
4,841
5,466
5,7077,222
7,904
2016 2017 2018 2019 2020
Refractive Laser Surgery Phakic Lens (ICL) Surgery Lens Exchange Surgery
Number of Surgery
15,156 15,141
27,897
25,022
27,93328,772
2019 2020
Refractive Laser Surgery Phakic Lens (ICL) Surgery Lens Exchange Surgery
Average Fee per Eye
(in HKD)
Highlights of FY2020
YoY increase in total surgery performed
10.3%
average price of surgery
Stableincrease in number of ICL and lens
exchange surgery improves gross profit margin
Profitable Surgery

23
Cost of Sales Development
Cost of Sales by Nature
(in thousands of HKD) (in thousand of HKD)
Adjusted Gross Profit and Gross Profit Margin
259.718
2019 2020
Others
Depreciation
Raw Materials/Consumables
Salaries &Doctor’s Fees
32.355
251.971
55.119
74.741
89.756
31.385
54.526
77.925
95.882
+3,1%
+6,8%
+4,3%
-1,1%
-3,0%
20202016
32,6%
42,1%
35,4%
20182017
40,5%
2019
180.959
45,2%
85.119
115.733
161.100
214.100
+18,3%
25,9% CAGR
Gross Profit Margin Adjusted Gross Profit

24
Selling Expenses
Main Factors
Germany and PRC
▪ Optimized patient aquisition process
▪ Effective marketing strategy
▪ Reinforced word of mouth by continuously improving patient experience
Sales Expense Ratio
Denmark
▪ Expenses in celebrity strategy to drive up brand awareness and penetration ratio
2018 2019 2020
13,7%13,7%
5,1%
10,5%
18,3%
12,1%
9,5%Germany
25,4%
12,0%
PRC
15,6%
18,1%18,1%
Denmark
Group

25
Adjusted Net Profit after Tax
The Year ended 31 December
(in thousand of HKD)
43,5%CAGR
2019
6,4%
2016
6,7%
20182017
11,7%
12,8%
14,9%
2020
16.643
21.888
50.885 50.283
70.614
+40,4%
NetMargin
Net Profit After Tax
26
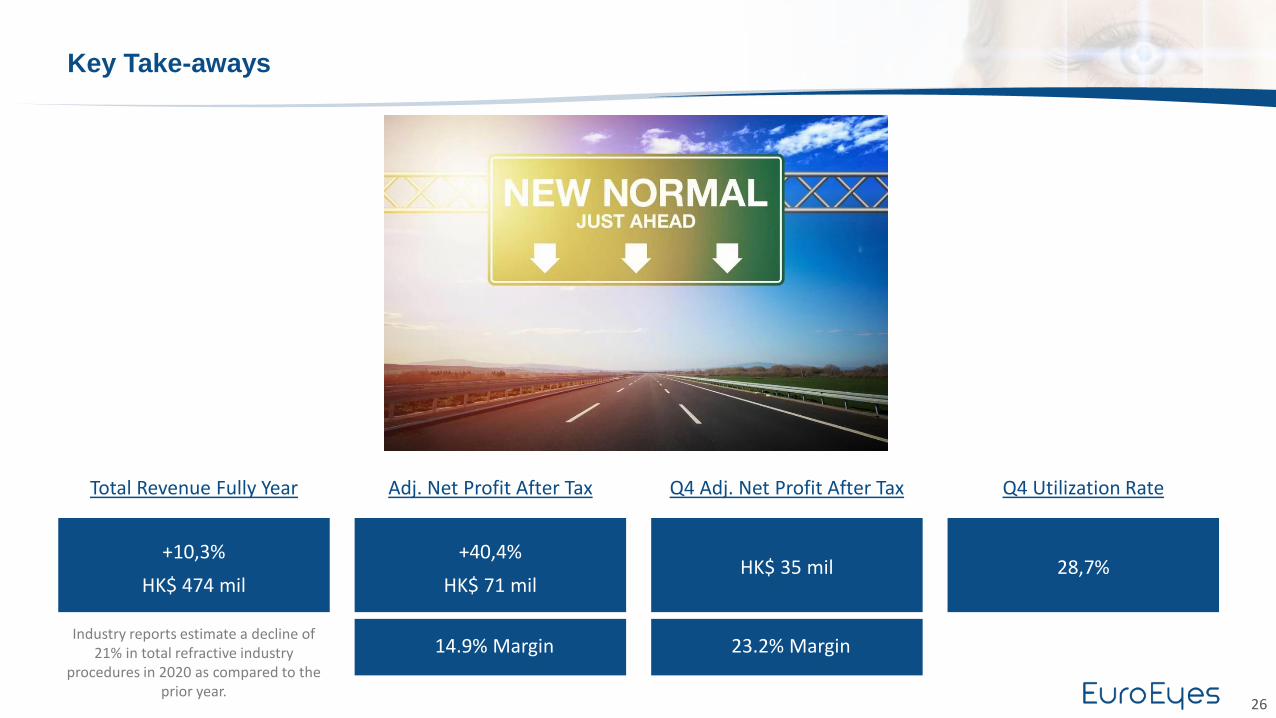
Key Take-aways
Adj. Net Profit After Tax
+40,4%
HK$ 71 mil
14.9% Margin
Total Revenue Fully Year
+10,3%
HK$ 474 mil
Industry reports estimate a decline of 21% in total refractive industry
procedures in 2020 as compared to the prior year.
Q4 Adj. Net Profit After Tax
HK$ 35 mil
23.2% Margin
Q4 Utilization Rate
28,7%

27
Thank You For Your Attention!

28
Non-IFRS Adjustments
The Year ended 31 December
2020 2019 2018 2017 2016
HK$‘000 HK$‘000 HK$‘000 HK$‘000 HK$‘000
Revenue 473,818 429,692 397,394 325,956 260,943
Reported gross profit 214,100 177,721 161,100 115,733 85,119
Adjustment – pre-operating expenses - 3.238 - - -
Adjusted gross profit 214,100 180,959 161,100 115,733 85,119
Adjusted gross profit margin (%) 45.2% 42.1% 40.50% 35.50% 32.60%
Reported net profit/(loss) 64,073 (3,686) 39,692 75,544 85,119
Adjustment – listing expenses - 42,219 11,193 - -
Adjustment – pre-operating expenses 532 7,573 - - -
Adjustment – Compensation from landlord for early termination of lease contract in Hamburg
- - - (53,666) -
Foreign exchange loss in relation to the proceeds from global offering
6,009 4,177 - - -
Adjusted net profit 70,614 50,283 50,885 22,888 16,643
Adjusted net profit margin (%) 14.9% 11.7% 12.80% 6.70% 6.40%