EUROCONTROL Low-Cost Carrier Market Updates3.amazonaws.com/zanran_storage/€¦ · EUROCONTROL...
18
EUROCONTROL Low-Cost Carrier Market Update June 2007
Transcript of EUROCONTROL Low-Cost Carrier Market Updates3.amazonaws.com/zanran_storage/€¦ · EUROCONTROL...

EUROCONTROL Low-Cost Carrier
Market Update June 2007

EUROCONTROL/STATFOR/Doc257
v1.0 12/09/07
EUROCONTROL Low-Cost Carrier Market Update June 2007
Summary:
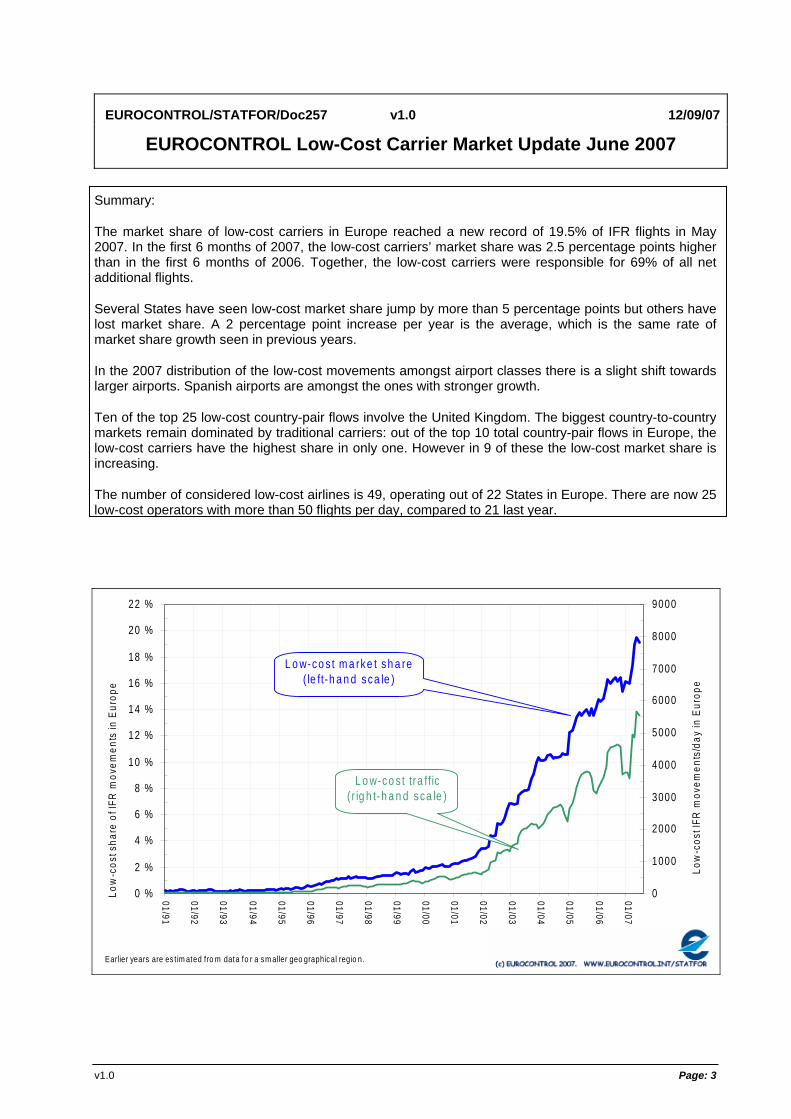
The market share of low-cost carriers in Europe reached a new record of 19.5% of IFR flights in May 2007. In the first 6 months of 2007, the low-cost carriers’ market share was 2.5 percentage points higher than in the first 6 months of 2006. Together, the low-cost carriers were responsible for 69% of all net additional flights.
Several States have seen low-cost market share jump by more than 5 percentage points but others have lost market share. A 2 percentage point increase per year is the average, which is the same rate of market share growth seen in previous years.
In the 2007 distribution of the low-cost movements amongst airport classes there is a slight shift towards larger airports. Spanish airports are amongst the ones with stronger growth.
Ten of the top 25 low-cost country-pair flows involve the United Kingdom. The biggest country-to-country markets remain dominated by traditional carriers: out of the top 10 total country-pair flows in Europe, the low-cost carriers have the highest share in only one. However in 9 of these the low-cost market share is increasing.
The number of considered low-cost airlines is 49, operating out of 22 States in Europe. There are now 25 low-cost operators with more than 50 flights per day, compared to 21 last year.
0 %
2 %
4 %
6 %
8 %
10 %
12 %
14 %
16 %
18 %
20 %
22 %
01/91
01/92
01/93
01/94
01/95
01/96
01/97
01/98
01/99
01/00
01/01
01/02
01/03
01/04
01/05
01/06
01/07
Low
-cos
t sha
re o
f IFR
mov
emen
ts in
Eur
ope
0
1000
2000
3000
4000
5000
6000
7000
8000
9000
Low
-cos
t IFR
mov
emen
ts/d
ay in
Eur
ope
Earlier years are es t im ated fro m data fo r a sm aller geo graphical regio n.
L o w-co s t m a rke t sh a re ( le ft-h a n d sca le )
L o w-co s t tra ff ic ( r ig h t-h a n d sca le )
v1.0 Page: 3


EUROCONTROL Low-Cost Carrier Market Update June 2007
1. INTRODUCTION
The Statistics and Forecast (STATFOR) Service of EUROCONTROL provides routine and on-demand air traffic statistics, forecasts and market analyses to internal and external EUROCONTROL stakeholders. The market analyses cover a wide range of topics of common interest to the air traffic industry, and draw on the EUROCONTROL archives of flight statistics.
This Low-cost Market Update is produced twice per year to present an overview of the situation and evolution of the low-cost market. This update covers the first six months of 2007. All of the statistics in this report are about flights, not passengers.
2. TERMINOLOGY
There is no single best definition of “low-cost” (or “no frills”). The list of airlines considered in this update as “low-cost” is detailed in the companion document Low-cost Airlines Panel v5.01. The panel is revised periodically. In this document “traditional” is used as the opposite of “low-cost”.
Both the electronic version of this document and the companion document can be found on the STATFOR web pages (http://www.eurocontrol.int/statfor/public/standard_page/analysis.html).
There are three dynamics influencing the growth of the low-cost market share
• Organic Growth: new low-cost flights created by existing or new low-cost airlines in routes where the demand was higher than the previous offer.
• Substitution: sometimes organic growth by low-cost carriers is coupled with reduction in service by traditional carriers. This substitution effect can produce change in market share for limited change in absolute number of flights.
• Re-branding: flights that were previously operated according to a traditional model but the airline changed it to a low-cost model. This can produce substantial change in market share with little change in the total number of flights.
1 Low-cost Panel V5, EUROCONTROL, STATFOR\Doc\258 Low-cost Panel Version 5, 12/09/07
EUROCONTROL/STATFOR/Doc257 v1.0 © EUROCONTROL Page:5

EUROCONTROL Low-Cost Carrier Market Update June 2007
3. MARKET SHARE IN EUROPE
The market share of low-cost carriers in Europe reached a new record of 19.5% of IFR flights in May 2007. In the first 6 months of 2007, the low-cost carriers’ market share was 2.5 percentage points higher than in the first 6 months of 2006. Together, the low-cost carriers were responsible for 69% of all net additional flights.
STATFOR updated its panel of low-cost airlines in March this year, which involved the inclusion of Brussels Airlines. So the jump in market share in March is not surprising. However, the continued growth of the share to reach the record value of 19.5% in May suggests an overall growth of the other low-cost operators.
In the first 6 months of 2007 the growth of the sector in percentage terms was 22% more low-cost flight movements than 12 months before. This percentage is equivalent to the 23% observed in the first 6 months of 2006 (also compared with 12 months before).
Compared with the same period 12 months before, the low-cost carriers added 2.5 percentage points to their market share. In terms of additional flight movements, this growth was equivalent to a large part (69%) of the net additional flight movements. See Figure 1, Figure 2 and Figure 3.
Figure 1 also shows that the low-cost flight movements are increasingly being influenced by seasonality, following the same pattern as traditional carriers. This seasonal pattern is emerging for three reasons: the blurring of the definition of “low-cost operator”, which therefore now includes a wider range of business models; slower rate of growth that comes with greater size; and even among larger carriers, a little less demand in the Winter.
Figure 1. Market share of low-cost airlines in Europe2 levels around 16% of all flights.
0 %
2 %
4 %
6 %
8 %
10 %
12 %
14 %
16 %
18 %
20 %
22 %
01/91
01/92
01/93
01/94
01/95
01/96
01/97
01/98
01/99
01/00
01/01
01/02
01/03
01/04
01/05
01/06
01/07
Low
-cos
t sha
re o
f IFR
mov
emen
ts in
Eur
ope
0
1000
2000
3000
4000
5000
6000
7000
8000
9000
Low
-cos
t IFR
mov
emen
ts/d
ay in
Eur
ope
Earlier years are es t im ated fro m data fo r a sm aller geo graphical regio n.
L o w-co s t m a rke t sh a re ( le ft-h a n d sca le )
L o w-co s t tra ff ic ( r ig h t-h a n d sca le )
2 For the purposes of this study the definition of Europe is limited to the EUROCONTROL Statistical Reference Area (ESRA). The ESRA is designed to include as much as possible of the ECAC area for which data are available from a range of sources within the Agency (CRCO, CFMU and STATFOR). It currently includes the following countries: Austria, Belgium, Bulgaria, Croatia, Cyprus, Czech Republic, Denmark, Finland, France, FYROM, Germany, Greece, Hungary, Ireland, Italy, Luxembourg, Malta, Moldova, Netherlands, Norway, Portugal, Romania, Slovakia, Slovenia, Spain, Sweden, Switzerland, Turkey and United Kingdom.
EUROCONTROL/STATFOR/Doc257 v1.0 © EUROCONTROL Page:6

EUROCONTROL Low-Cost Carrier Market Update June 2007
Figure 2 compares the first six months of 2007 with the same period in 2006, showing how average market share has jumped from 15.4% to 17.9%.
Figure 3 displays the evolution of growth in terms of additional flights per market segment.
Figure 2. The Low-Cost carriers continued to be a major driver of growth in the first six months of 2007. (Units are IFR flights/day.)
Period LCC Others Total Share LCC
Movements Growth
Jan – Jun 2006 3,879 21,257 25,136 15.4% +231%
Jan – Jun 2007 4,746 21,653 26,399 17.9% +22%
Net Additional Movements % of all net additional movements
867 69%
396 31%
1,263 2.5%
Figure 3. The low-cost segment is responsible for the majority of the additional flights.
EUROCONTROL/STATFOR/Doc257 v1.0 © EUROCONTROL Page:7

EUROCONTROL Low-Cost Carrier Market Update June 2007
4. NATIONAL MARKET SHARES
Several States have seen low-cost market share jump by more than 5 percentage points but others have lost market share. A 2 percentage point increase per year is the average, which is the same rate of market share growth seen in previous years.
Annex 1 gives the market share by State or region, both in terms of total IFR flight movements in the airspace and excluding overflights (so just showing locally-generated traffic). These are also illustrated in maps in Figure 6 and Figure 7, respectively.
Figure 4 shows the growth of the local low-cost market share per State or region (excluding overflights). More than half of the states are registering growth above the 2% percentage points and one quarter above 4% percentage points. The median growth of all States and regions is around 2% points, which is the same rate of market share growth seen in previous years. This growth rate corroborates the expectations of the base scenario of the STATFOR Medium-Term Forecast 2007-20133.
In some States a relatively small number of new flight movements can result in a high growth of the market share. To compensate for this, Figure 5 shows the same information but in terms of new locally-generated (i.e. excluding overflights) number of flight movements.
Figure 4. Most States are seeing low-cost growth, with 2 percentage points remaining the average increment (here excluding overflights).
3 Medium-Term Forecast Flight Movements 2007-2013 Volume 1, EUROCONTROL, STATFOR\Doc\230 MTF Report Feb07
EUROCONTROL/STATFOR/Doc257 v1.0 © EUROCONTROL Page:8

EUROCONTROL Low-Cost Carrier Market Update June 2007
Figure 5 Ten States added more than 50 new locally generated (excluding overflights) low-cost flights
EUROCONTROL/STATFOR/Doc257 v1.0 © EUROCONTROL Page:9

EUROCONTROL Low-Cost Carrier Market Update June 2007
Figure 6. Spain is the second country to have a low-cost share above 25% of the total IFR movements.
Low-Cost Market Share – Total IFR movements Jan – Jun 2007 ESRA
Canaries Santa Maria FIR
Figure 7. Excluding overflights, there are now 7 countries with share above 20%: Ireland, United Kingdom, Slovakia, Spain, Poland, Germany and Belgium/Luxembourg.
Low-Cost Market Share – Excluding overflights Jan – Jun 2007
ESRA
Santa Maria FIR Canaries
EUROCONTROL/STATFOR/Doc257 v1.0 © EUROCONTROL Page:10

EUROCONTROL Low-Cost Carrier Market Update June 2007
5. AIRPORTS
In the 2007 distribution of the low-cost movements amongst airport classes there is a slight shift towards larger airports. Spanish airports are amongst the ones with stronger growth.
Figure 8 compares the distribution of the low-cost flight movements amongst airport classes (according to their number of daily arrivals) during the first six months of 2006 and 2006. The comparison shows that between these two periods there was a slight shift towards larger airports. This will have been influenced by the re-labelling of Brussels Airlines flights, but also by the rapid growth at, for example, Madrid (see Figure 9).
Figure 8. 22% of low-cost carriers operations are at airports with less than 50 arrivals per day
Jan-Jun 2006 Jan-Jun 2007
EUROCONTROL/STATFOR/Doc257 v1.0 © EUROCONTROL Page:11

EUROCONTROL Low-Cost Carrier Market Update June 2007
Figure 9 lists the top 25 airports ranked according to the number of low-cost arrivals during the first 6 months of 2007. From this list, 9 are located in the United Kingdom, with three of them in the London area, and 6 are located in Germany. Together these 16 airports have 28% of all the low-cost flight movements, with 19% for the British airports and 9% for the German airports. These shares are gradually declining as the market becomes more disperse.
The highest jumps in the ranking were Brussels and Madrid. The first due to the introduction of Brussels Airlines in the low-cost panel, the second due to the introduction of Clickair, and Ryanair and EasyJet choosing Madrid as a base.
Figure 9. Nine United Kingdom airports had 19% of all low-cost flight movements during the first 6 months of 2007.
2007 Rank
2006 Rank Airport
Average Daily Low-Cost
Flight Arrivals
Share of Low-Cost flight arrivals in
ESRA
1 1 LONDON/STANSTED 236 5.0% 2 3 DUBLIN 122 2.6% 3 2 LONDON/GATWICK 120 2.6% 4 9 BARCELONA 100 2.1% 5 4 LONDON/LUTON 99 2.1% 6 8 MANCHESTER 97 2.1% 7 7 PALMA DE MALLORCA 96 2.1% 8 6 SCHIPHOL AMSTERDAM 93 2.0% 9 5 KOELN-BONN 91 1.9% 10 42 BRUSSELS NATIONAL 82 1.8% 11 10 EDINBURGH 75 1.6% 12 13 MUENCHEN 2 72 1.5% 13 11 TEGEL-BERLIN 71 1.5% 14 14 MALAGA 70 1.5% 15 15 OSLO/GARDERMOEN 69 1.5% 16 26 BIRMINGHAM 68 1.5% 17 21 DUESSELDORF 64 1.4% 18 44 MADRID BARAJAS 62 1.3% 19 25 GENEVE COINTRIN 60 1.3% 20 18 STUTTGART 59 1.3% 21 19 SCHOENEFELD-BERLIN 58 1.2% 22 28 GLASGOW 58 1.2% 23 17 BELFAST/ALDERGROVE 58 1.2% 24 16 LIVERPOOL 56 1.2% 25 27 ROMA CIAMPINO 54 1.2%
EUROCONTROL/STATFOR/Doc257 v1.0 © EUROCONTROL Page:12

EUROCONTROL Low-Cost Carrier Market Update June 2007
6. COUNTRY-PAIR FLOWS
Ten of the top 25 low-cost country-pair flows involve the United Kingdom. The biggest country-to-country markets remain dominated by traditional carriers: out of the top 10 total country-pair flows in Europe, the low-cost carriers have the highest share in only one. However in 9 of these the low-cost market share is increasing.
Figure 10 lists the top 25 country-pair flows for low-cost flight movements. From the 25 major low-cost flows, the United Kingdom is present in 10 of them; these 10 flows had 39% of all low-cost flight movements.
The flows Spain-Spain and Spain-Italy were the ones registering the most significant jumps in the rank.
Figure 10. Almost 40% of all low-cost flight movements during the first 6 months of 2007 were concentrated in 10 flows to and from the United Kingdom.
2007 Rank
2006 Rank Bidirectional Flow
Low-Cost Daily Flight Movements
Share of All Low-Cost
Movements in ESRA
1 1 United Kingdom – United Kingdom 569 12% 2 2 Spain – United Kingdom 366 7.9% 3 3 Germany - Germany 281 6.1% 4 4 Ireland – United Kingdom 196 4.2% 5 5 France – United Kingdom 173 3.7% 6 6 Germany - Spain 168 3.6% 7 7 Germany – United Kingdom 150 3.2% 8 8 Italy – United Kingdom 136 3.0% 9 9 Germany - Italy 118 2.6% 10 16 Spain - Spain 107 2.3% 11 19 Italy - Spain 85 1.8% 12 12 Italy - Italy 84 1.8% 13 11 Netherlands – United Kingdom 80 1.7% 14 13 Norway - Norway 75 1.6% 15 14 Turkey - Turkey 67 1.5% 16 15 Poland – United Kingdom 64 1.4% 17 17 Austria - Germany 64 1.4% 18 20 France - Germany 52 1.1% 19 10 Sweden - Sweden 52 1.1% 20 22 Lisbon FIR – United Kingdom 51 1.1% 21 24 Netherlands - Spain 49 1.1% 22 31 France - Spain 48 1.0% 23 25 Ireland - Ireland 47 1.0% 24 18 Switzerland – United Kingdom 47 1.0% 25 23 Germany - Turkey 47 1.0%
EUROCONTROL/STATFOR/Doc257 v1.0 © EUROCONTROL Page:13

EUROCONTROL Low-Cost Carrier Market Update June 2007
Figure 11 shows the country pair flows that have a high share of low-cost flight movements both in the first 6 months of 2006 and the first 6 months of 2007. In 2006 the number of flows with a share above the 60% was 7; in 2007 all the 10 flows have a share above 60%.
The comparison between the two periods shows that 8 of the flows present in the 2006 top 10 remain in the top 10 in 2007. The 2 new ones are Latvia United Kingdom and Ireland Poland.
Figure 12 shows the share of low-cost flight movements in the top 10 busiest flows in Europe and Figure 13 expands on Figure 12 to show the change of this share between the first 6 months of 2006 and 2007. From the 10 major overall flows only one has a low-cost share higher than 50% (UK Spain). However, 9 out of these 10 major flows had an increase in the low-cost share.
Figure 11. Low-cost flight movements are dominating an increasing number of routes.
EUROCONTROL/STATFOR/Doc257 v1.0 © EUROCONTROL Page:14

EUROCONTROL Low-Cost Carrier Market Update June 2007
Figure 12. Low-cost flight movements represent more than 50% of just one of the ten major flows in Europe. (IFR flight movements Jan-Jun 2007.)
Figure 13 Low-cost share is increasing in 9 of the of the 10 major country pair flows in Europe. (Change in market share in percentage points, Jan-Jun 2007 v Jan-Jun 2006.)
EUROCONTROL/STATFOR/Doc257 v1.0 © EUROCONTROL Page:15

EUROCONTROL Low-Cost Carrier Market Update June 2007
7. OPERATORS
The number of considered low-cost airlines is 49, operating out of 22 States in Europe. There are now 25 low-cost operators with more than 50 flights per day, compared to 21 last year.
The low-cost operators considered for this market update are listed in the companion document “Low-cost Airlines Panel v5.0”. This version of the panel was implemented on the 1st January 2007. The new panel adds: Clickair (Spain) and Brussels Airlines (Belgium). It loses Air Scotland and Evolavia.
In total the panel for 2007 includes 49 airlines. The United Kingdom is the State with largest representation, 8 airlines, followed by Germany with 6 and Sweden with 5 airlines. In total there are 22 countries with airlines represented in the panel.
Figure 14 shows the number of low-cost airlines according to their daily number of flights both in the first 6 months of 2006 and the first 6 months of 2007. There is a consolidation of the market with the number of airlines with less than 50 flights/day decreasing and the ones with more than 50 flights/day increasing.
Figure 14. There are now 25 low-cost airlines with more than 50 flights/day.4
4 1 ‘airline’ in the “10-50” category is in fact a grouping of 3 small airlines from the low-cost panel V5.
EUROCONTROL/STATFOR/Doc257 v1.0 © EUROCONTROL Page:16

EUROCONTROL Low-Cost Carrier Market Update June 2007
Annex 1. Low-cost market share per State
Low-Cost Market Share: all IFR movements Local Low-Cost Market Share: excluding overflights
2006 Jan-Jun 2007 Jan-Jun 2006 Jan-Jun 2007 Jan-Jun Traffic Zone Daily Mvts Share Daily Mvts Share
Share Growth
(% points) Daily Mvts Share Daily Mvts Share
Share Growth
(% points)
Albania 23 8.6% 44 13.3% 4.7% 0 0.7% 0 1.0% 0.3% Austria 399 14.2% 516 17.0% 2.8% 90 9.7% 126 12.9% 3.2% Belgium/Luxembourg 478 16.9% 676 22.9% 6.0% 95 9.3% 214 20.4% 11% Bosnia-Herzegovina 44 11.1% 73 15.4% 4.3% 0 0.9% 0 0.6% -0.3% Bulgaria 112 11.7% 129 12.2% 0.5% 6 3.9% 10 6.4% 2.5% Canary Islands 55 6.7% 85 10.4% 3.7% 55 7.7% 85 11.9% 4.2% Croatia 85 10.7% 141 14.8% 4.1% 15 9.2% 19 10.7% 1.5% Cyprus 12 2.2% 22 3.6% 1.4% 4 2.6% 7 4.7% 2.1% Czech Republic 271 17.0% 311 18.8% 1.7% 58 12.8% 75 15.3% 2.5% Denmark 250 15.4% 279 16.3% 0.9% 118 14.5% 114 13.3% -1.2% Estonia 17 3.7% 19 5.0% 1.3% 5 4.4% 5 6.5% 2.1% FYROM 28 10.2% 42 14.8% 4.6% 2 5.7% 1 3.1% -2.6% Finland 122 17.8% 106 15.6% -2.1% 113 19.2% 97 16.7% -2.5% France 1406 18.6% 1827 22.7% 4.1% 387 9.3% 515 12.0% 2.7% Germany 1448 18.3% 1755 21.2% 2.9% 966 18.6% 1156 21.4% 2.8% Greece 94 7.0% 141 9.5% 2.5% 53 6.7% 76 8.8% 2.1% Hungary 178 11.7% 193 12.6% 0.9% 54 15.8% 53 16.0% 0.1% Ireland 318 21.0% 378 24.0% 3.1% 299 41.6% 349 45.5% 3.9% Italy 646 15.2% 854 18.6% 3.3% 491 15.5% 645 18.8% 3.3% Latvia 28 6.1% 35 7.1% 1.0% 15 14.7% 19 17.9% 3.3% Lisbon FIR 133 12.5% 200 17.6% 5.1% 86 14.5% 123 19.4% 4.8% Lithuania 24 5.4% 38 7.5% 2.1% 4 3.9% 8 7.9% 4.0% Malta 3 1.5% 8 4.0% 2.4% 2 3.4% 6 8.6% 5.2% Netherlands 546 19.5% 652 21.9% 2.4% 220 16.0% 241 16.6% 0.6% Norway 156 11.2% 189 13.0% 1.8% 153 11.8% 183 13.6% 1.8% Poland 173 13.6% 220 15.4% 1.7% 131 21.6% 165 24.7% 3.0% Romania 78 7.5% 93 8.6% 1.1% 17 6.4% 38 12.1% 5.8% Santa Maria FIR 3 1.2% 6 2.2% 1.0% 1 0.9% 1 0.9% 0.0% Serbia &Montenegro 99 10.7% 164 15.1% 4.4% 4 2.8% 5 2.8% 0.0% Slovakia 137 16.6% 128 16.2% -0.4% 39 40.7% 32 34.1% -6.7% Slovenia 76 12.0% 116 15.5% 3.4% 3 3.8% 4 3.3% -0.4% Spain 879 20.5% 1208 25.8% 5.3% 734 21.9% 987 26.8% 4.9% Sweden 317 17.0% 310 16.1% -1.0% 213 18.6% 194 17.1% -1.6% Switzerland 496 17.9% 625 21.3% 3.4% 145 12.2% 168 13.4% 1.1% Turkey 153 8.9% 185 9.8% 0.9% 143 13.4% 170 14.2% 0.7% Ukraine 4 0.5% 5 0.5% 0.1% . . . . . United Kingdom 1879 28.6% 2216 32.5% 4.0% 1810 31.8% 2106 36.0% 4.2% ESRA 3879 15.4% 4746 18.0% 2.5% 3876 15.6% 4744 18.2% 2.6%
EUROCONTROL/STATFOR/Doc257 v1.0 © EUROCONTROL Page:17

© European Organisation for the Safety of Air Navigation (EUROCONTROL) September 2007
This document is published by EUROCONTROL in the interests of exchange of information. It may be copied in whole or in part, pcopyright notice and disclaimer are included. The information contained in this document may not be modified without prior written permisfrom EUROCONTROL.
roviding that the sion
ny legal EUROCONTROL makes no warranty, either implied or express, for the information contained in this document, neither does it assume aliability or responsibility for the accuracy, completeness or usefulness of this information.
For further information please contact,
STATFOR, the EUROCONTROL Statistics and Forecast Service
http://www.eurocontrol.int/statfor
+32 2 729 9818 – Miguel Rodrigues