EU imports of organic agri-food products
17
EU Agricultural Market Briefs are available on Europa: https://ec.europa.eu/info/food-farming-fisheries/farming/facts-and-figures/performance- agricultural-policy/studies-and-reports/market-analyses-and-briefs_en Agriculture and Rural Development EU Agricultural Market Briefs No 17 | June 2020 EU imports of organic agri-food products Key developments in 2019 Contents 1. Organic imports 2. Origin and destination of organic imports 3. Key imported organic products 4. Imports of organic cereals, oilseeds and sugar and derived products 5. Imports of organic fruit and vegetables 6. Imports of organic permanent crops (excluding fruit and nuts) 7. Imports of organic animal products While the EU market of organic agri-food products continues its growth, organic imports remained stable between 2018 and 2019. Looking more in detail into import categories, some shift occurred: a decrease in imports of organic cereals (including rice) and oilseeds (excluding soyabeans) was counterbalanced by increased imports of tropical fruit, oilcakes, soyabeans and sugar. Changes were also observed in the ranking of the main trading partners with Colombia and Kazakhstan entering the top ten suppliers of organic products to the EU. The main importing EU Member States in 2019 were the Netherlands, the United Kingdom and Germany. The present brief describes EU28 data on EU imports of agri-food products in 2019 and reflects on key developments compared to 2018. It characterises these imports in terms of origin and destination, as well as product categories. © Lei Ramirez_Unsplash
Transcript of EU imports of organic agri-food products
EU Agricultural Market Briefs are available on Europa:
https://ec.europa.eu/info/food-farming-fisheries/farming/facts-and-figures/performance-
agricultural-policy/studies-and-reports/market-analyses-and-briefs_en
Agriculture
and Rural
Development
EU Agricultural Market Briefs No 17 | June 2020
EU imports of organic agri-food products
Key developments in 2019
Contents
1. Organic imports
2. Origin and destination of
organic imports
3. Key imported organic
products
4. Imports of organic
cereals, oilseeds and
sugar and derived
products
5. Imports of organic fruit
and vegetables
6. Imports of organic
permanent crops
(excluding fruit and
nuts)
7. Imports of organic
animal products
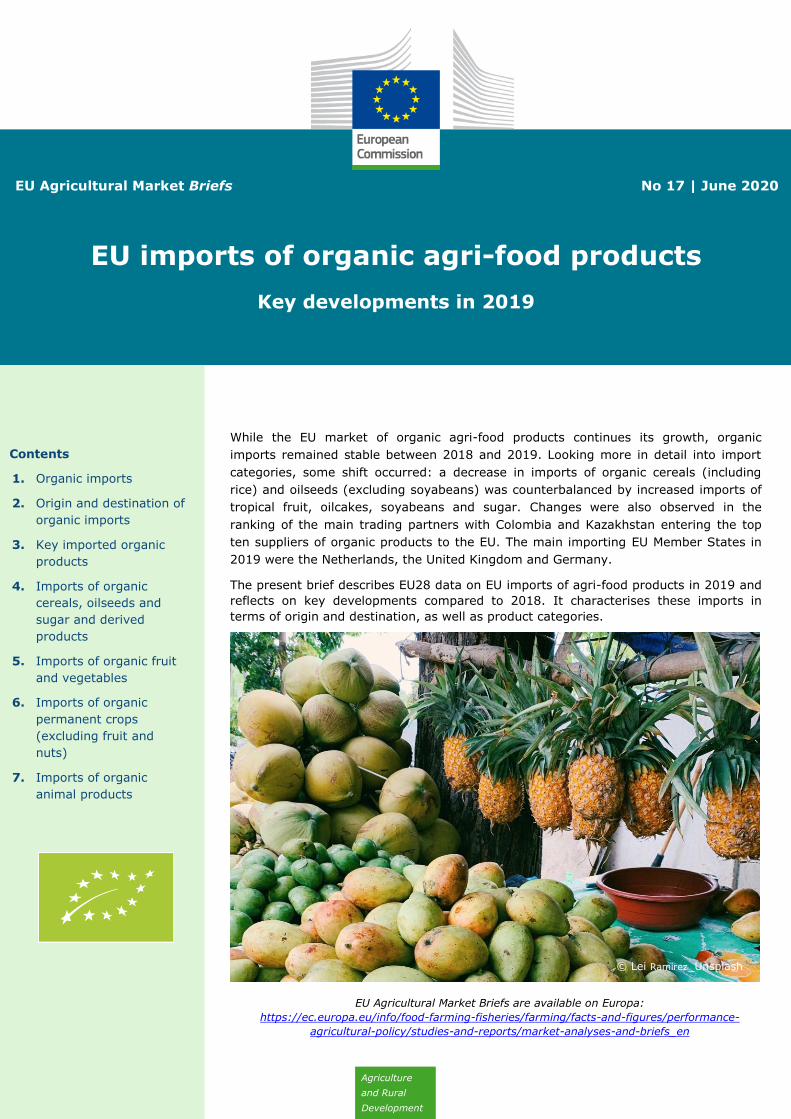
While the EU market of organic agri-food products continues its growth, organic
imports remained stable between 2018 and 2019. Looking more in detail into import
categories, some shift occurred: a decrease in imports of organic cereals (including
rice) and oilseeds (excluding soyabeans) was counterbalanced by increased imports of
tropical fruit, oilcakes, soyabeans and sugar. Changes were also observed in the
ranking of the main trading partners with Colombia and Kazakhstan entering the top
ten suppliers of organic products to the EU. The main importing EU Member States in
2019 were the Netherlands, the United Kingdom and Germany.
The present brief describes EU28 data on EU imports of agri-food products in 2019 and
reflects on key developments compared to 2018. It characterises these imports in
terms of origin and destination, as well as product categories.
© Lei Ramirez_Unsplash
EU imports of organic agri-food products – Key developments in 2019
2
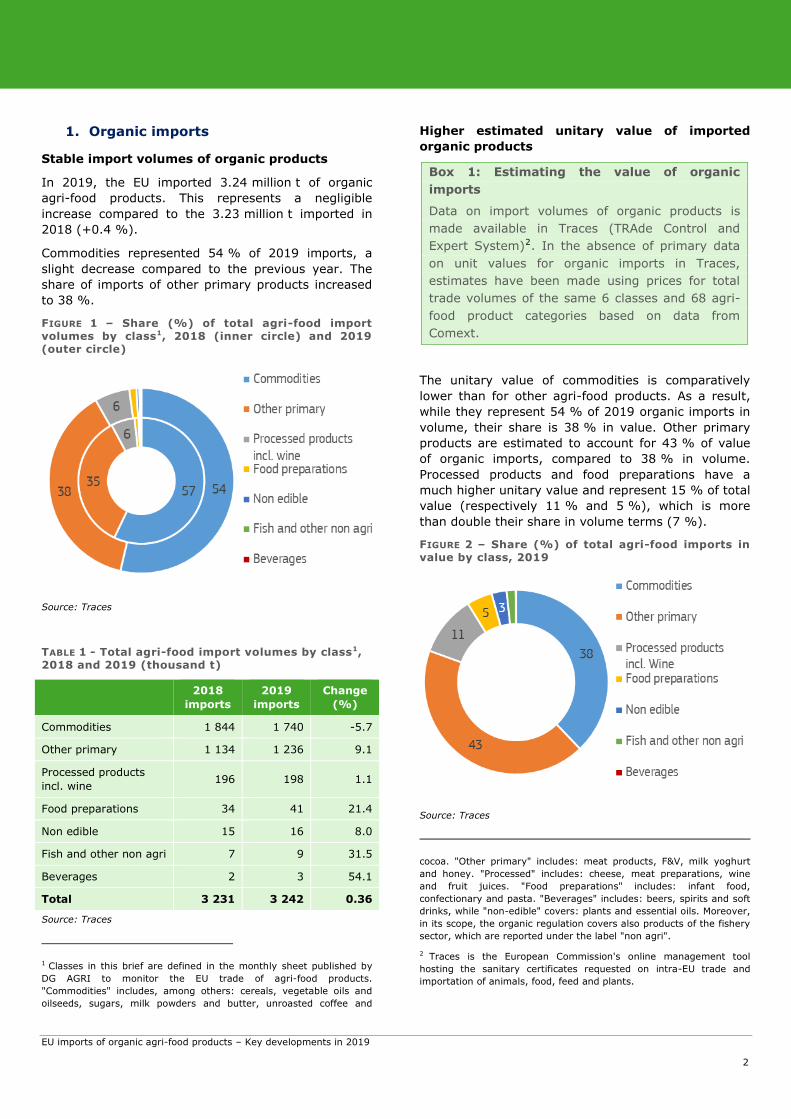
1. Organic imports
Stable import volumes of organic products
In 2019, the EU imported 3.24 million t of organic
agri-food products. This represents a negligible
increase compared to the 3.23 million t imported in
2018 (+0.4 %).
Commodities represented 54 % of 2019 imports, a
slight decrease compared to the previous year. The
share of imports of other primary products increased
to 38 %.
FIGURE 1 – Share (%) of total agri-food import volumes by class1, 2018 (inner circle) and 2019 (outer circle)
Source: Traces
TABLE 1 - Total agri-food import volumes by class1, 2018 and 2019 (thousand t)
2018
imports
2019
imports
Change
(%)
Commodities 1 844 1 740 -5.7
Other primary 1 134 1 236 9.1
Processed products
incl. wine 196 198 1.1
Food preparations 34 41 21.4
Non edible 15 16 8.0
Fish and other non agri 7 9 31.5
Beverages 2 3 54.1
Total 3 231 3 242 0.36
Source: Traces1
1 Classes in this brief are defined in the monthly sheet published by
DG AGRI to monitor the EU trade of agri-food products.
"Commodities" includes, among others: cereals, vegetable oils and
oilseeds, sugars, milk powders and butter, unroasted coffee and
Higher estimated unitary value of imported
organic products
Box 1: Estimating the value of organic
imports
Data on import volumes of organic products is
made available in Traces (TRAde Control and
Expert System)2. In the absence of primary data
on unit values for organic imports in Traces,
estimates have been made using prices for total
trade volumes of the same 6 classes and 68 agri-
food product categories based on data from
Comext.
The unitary value of commodities is comparatively
lower than for other agri-food products. As a result,
while they represent 54 % of 2019 organic imports in
volume, their share is 38 % in value. Other primary
products are estimated to account for 43 % of value
of organic imports, compared to 38 % in volume.
Processed products and food preparations have a
much higher unitary value and represent 15 % of total
value (respectively 11 % and 5 %), which is more
than double their share in volume terms (7 %).
FIGURE 2 – Share (%) of total agri-food imports in value by class, 2019
Source: Traces
cocoa. "Other primary" includes: meat products, F&V, milk yoghurt
and honey. "Processed" includes: cheese, meat preparations, wine
and fruit juices. "Food preparations" includes: infant food,
confectionary and pasta. "Beverages" includes: beers, spirits and soft
drinks, while "non-edible" covers: plants and essential oils. Moreover,
in its scope, the organic regulation covers also products of the fishery
sector, which are reported under the label "non agri".
2 Traces is the European Commission's online management tool
hosting the sanitary certificates requested on intra-EU trade and
importation of animals, food, feed and plants.
EU imports of organic agri-food products – Key developments in 2019
3
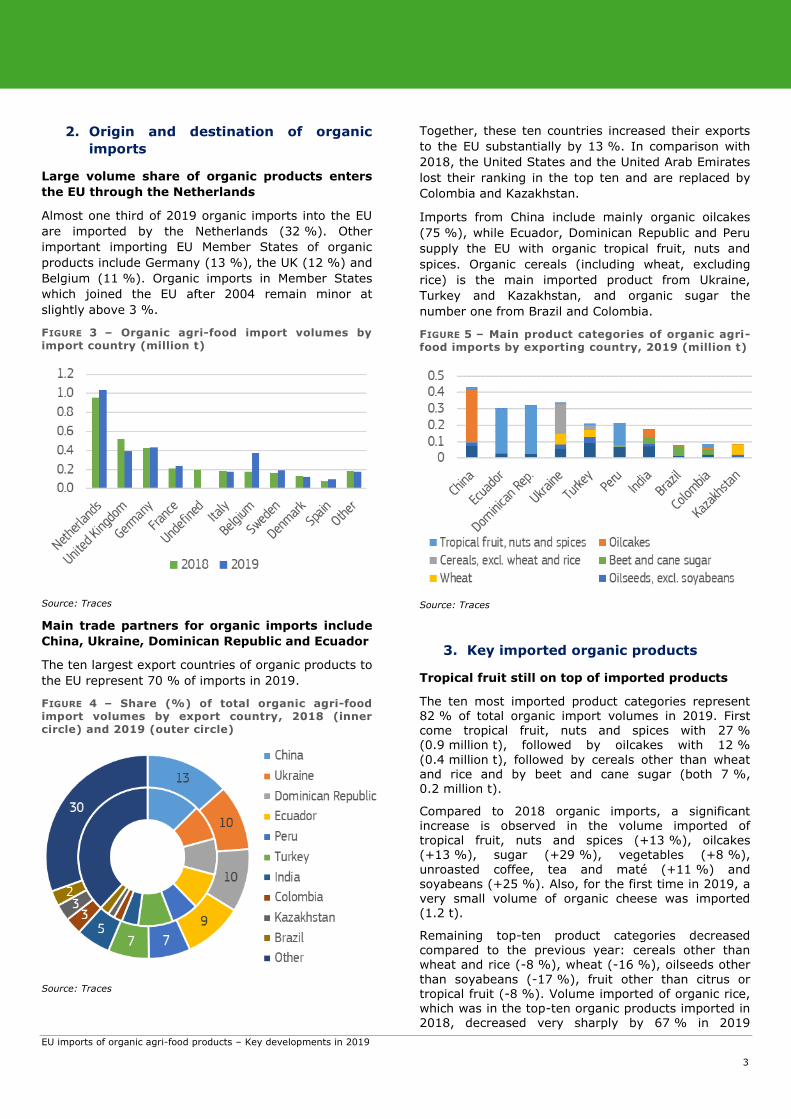
2. Origin and destination of organic
imports
Large volume share of organic products enters
the EU through the Netherlands
Almost one third of 2019 organic imports into the EU
are imported by the Netherlands (32 %). Other
important importing EU Member States of organic
products include Germany (13 %), the UK (12 %) and
Belgium (11 %). Organic imports in Member States
which joined the EU after 2004 remain minor at
slightly above 3 %.
FIGURE 3 – Organic agri-food import volumes by import country (million t)
Source: Traces
Main trade partners for organic imports include
China, Ukraine, Dominican Republic and Ecuador
The ten largest export countries of organic products to
the EU represent 70 % of imports in 2019.
FIGURE 4 – Share (%) of total organic agri-food import volumes by export country, 2018 (inner circle) and 2019 (outer circle)
Source: Traces
Together, these ten countries increased their exports
to the EU substantially by 13 %. In comparison with
2018, the United States and the United Arab Emirates
lost their ranking in the top ten and are replaced by
Colombia and Kazakhstan.
Imports from China include mainly organic oilcakes
(75 %), while Ecuador, Dominican Republic and Peru
supply the EU with organic tropical fruit, nuts and
spices. Organic cereals (including wheat, excluding
rice) is the main imported product from Ukraine,
Turkey and Kazakhstan, and organic sugar the
number one from Brazil and Colombia.
FIGURE 5 – Main product categories of organic agri-food imports by exporting country, 2019 (million t)
Source: Traces
3. Key imported organic products
Tropical fruit still on top of imported products
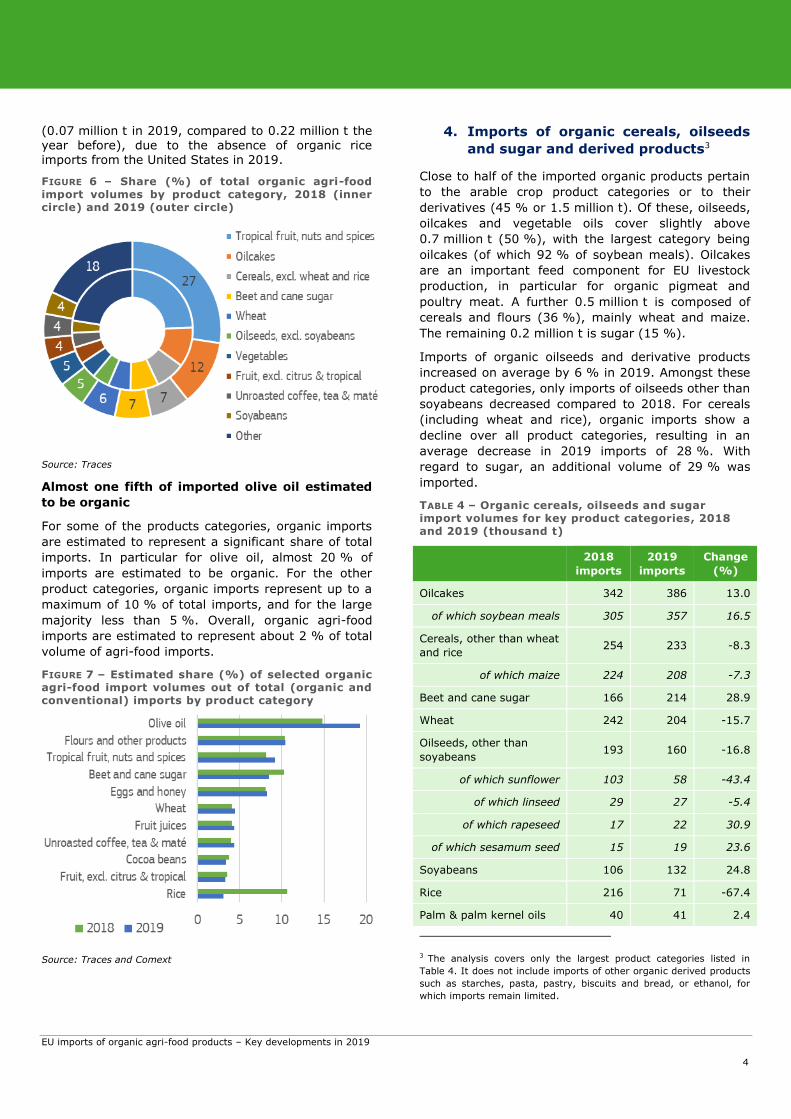
The ten most imported product categories represent 82 % of total organic import volumes in 2019. First come tropical fruit, nuts and spices with 27 % (0.9 million t), followed by oilcakes with 12 %
(0.4 million t), followed by cereals other than wheat and rice and by beet and cane sugar (both 7 %, 0.2 million t).
Compared to 2018 organic imports, a significant increase is observed in the volume imported of tropical fruit, nuts and spices (+13 %), oilcakes (+13 %), sugar (+29 %), vegetables (+8 %),
unroasted coffee, tea and maté (+11 %) and soyabeans (+25 %). Also, for the first time in 2019, a very small volume of organic cheese was imported (1.2 t).
Remaining top-ten product categories decreased compared to the previous year: cereals other than wheat and rice (-8 %), wheat (-16 %), oilseeds other
than soyabeans (-17 %), fruit other than citrus or tropical fruit (-8 %). Volume imported of organic rice, which was in the top-ten organic products imported in 2018, decreased very sharply by 67 % in 2019
EU imports of organic agri-food products – Key developments in 2019
4
(0.07 million t in 2019, compared to 0.22 million t the year before), due to the absence of organic rice imports from the United States in 2019.
FIGURE 6 – Share (%) of total organic agri-food import volumes by product category, 2018 (inner circle) and 2019 (outer circle)
Source: Traces
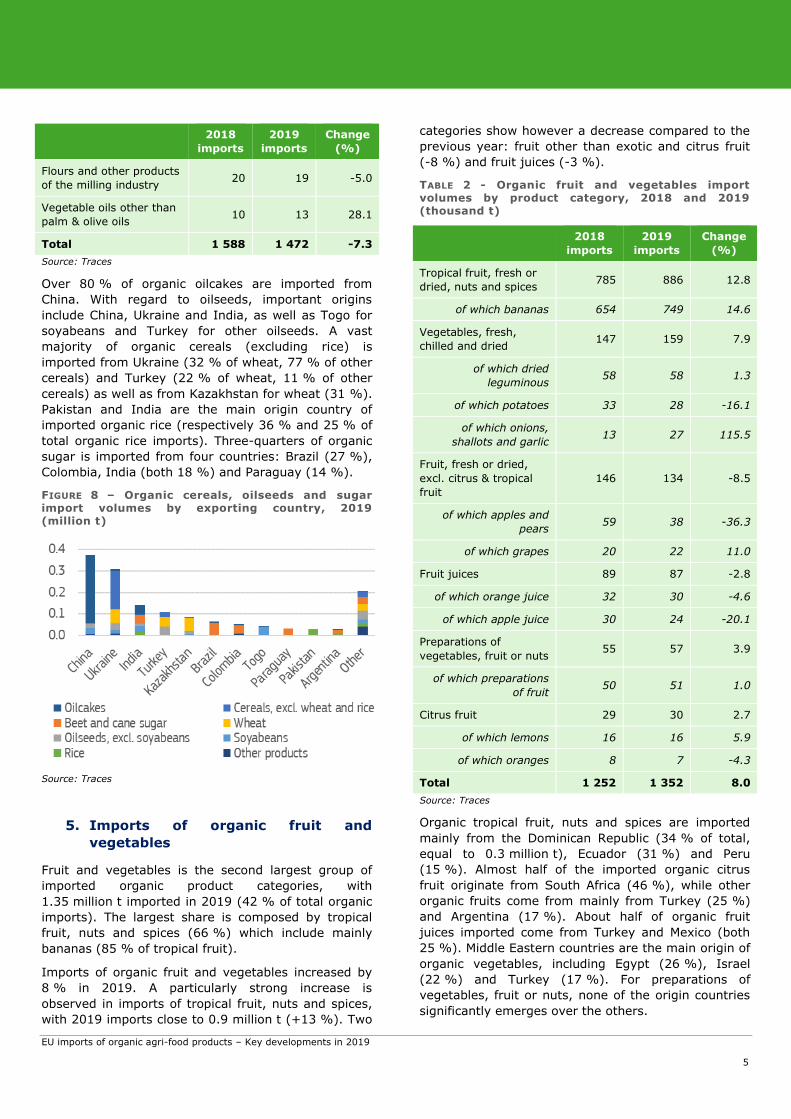
Almost one fifth of imported olive oil estimated
to be organic
For some of the products categories, organic imports
are estimated to represent a significant share of total
imports. In particular for olive oil, almost 20 % of
imports are estimated to be organic. For the other
product categories, organic imports represent up to a
maximum of 10 % of total imports, and for the large
majority less than 5 %. Overall, organic agri-food
imports are estimated to represent about 2 % of total
volume of agri-food imports.
FIGURE 7 – Estimated share (%) of selected organic agri-food import volumes out of total (organic and conventional) imports by product category
Source: Traces and Comext
4. Imports of organic cereals, oilseeds
and sugar and derived products3
Close to half of the imported organic products pertain
to the arable crop product categories or to their
derivatives (45 % or 1.5 million t). Of these, oilseeds,
oilcakes and vegetable oils cover slightly above
0.7 million t (50 %), with the largest category being
oilcakes (of which 92 % of soybean meals). Oilcakes
are an important feed component for EU livestock
production, in particular for organic pigmeat and
poultry meat. A further 0.5 million t is composed of
cereals and flours (36 %), mainly wheat and maize.
The remaining 0.2 million t is sugar (15 %).
Imports of organic oilseeds and derivative products
increased on average by 6 % in 2019. Amongst these
product categories, only imports of oilseeds other than
soyabeans decreased compared to 2018. For cereals
(including wheat and rice), organic imports show a
decline over all product categories, resulting in an
average decrease in 2019 imports of 28 %. With
regard to sugar, an additional volume of 29 % was
imported.
TABLE 4 – Organic cereals, oilseeds and sugar import volumes for key product categories, 2018 and 2019 (thousand t)
2018
imports
2019
imports
Change
(%)
Oilcakes 342 386 13.0
of which soybean meals 305 357 16.5
Cereals, other than wheat
and rice 254 233 -8.3
of which maize 224 208 -7.3
Beet and cane sugar 166 214 28.9
Wheat 242 204 -15.7
Oilseeds, other than
soyabeans 193 160 -16.8
of which sunflower 103 58 -43.4
of which linseed 29 27 -5.4
of which rapeseed 17 22 30.9
of which sesamum seed 15 19 23.6
Soyabeans 106 132 24.8
Rice 216 71 -67.4
Palm & palm kernel oils 40 41 2.4
3 The analysis covers only the largest product categories listed in
Table 4. It does not include imports of other organic derived products
such as starches, pasta, pastry, biscuits and bread, or ethanol, for
which imports remain limited.
EU imports of organic agri-food products – Key developments in 2019
5
2018
imports
2019
imports
Change
(%)
Flours and other products
of the milling industry 20 19 -5.0
Vegetable oils other than
palm & olive oils 10 13 28.1
Total 1 588 1 472 -7.3
Source: Traces
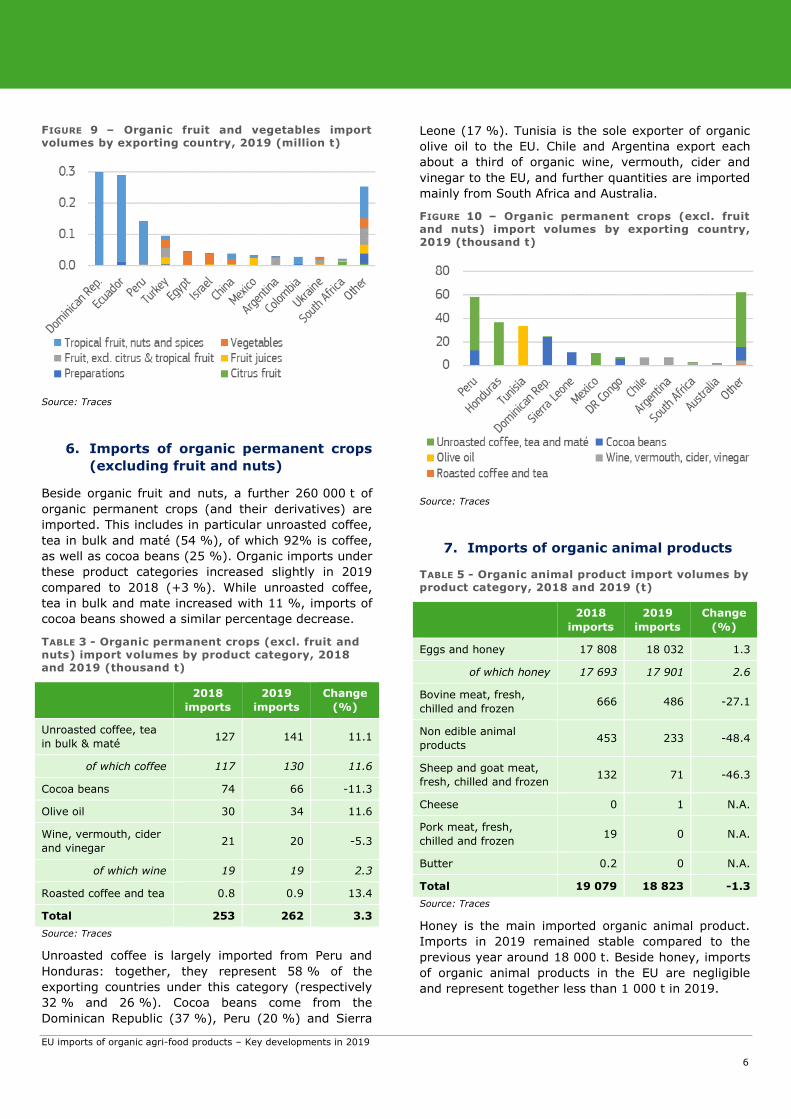
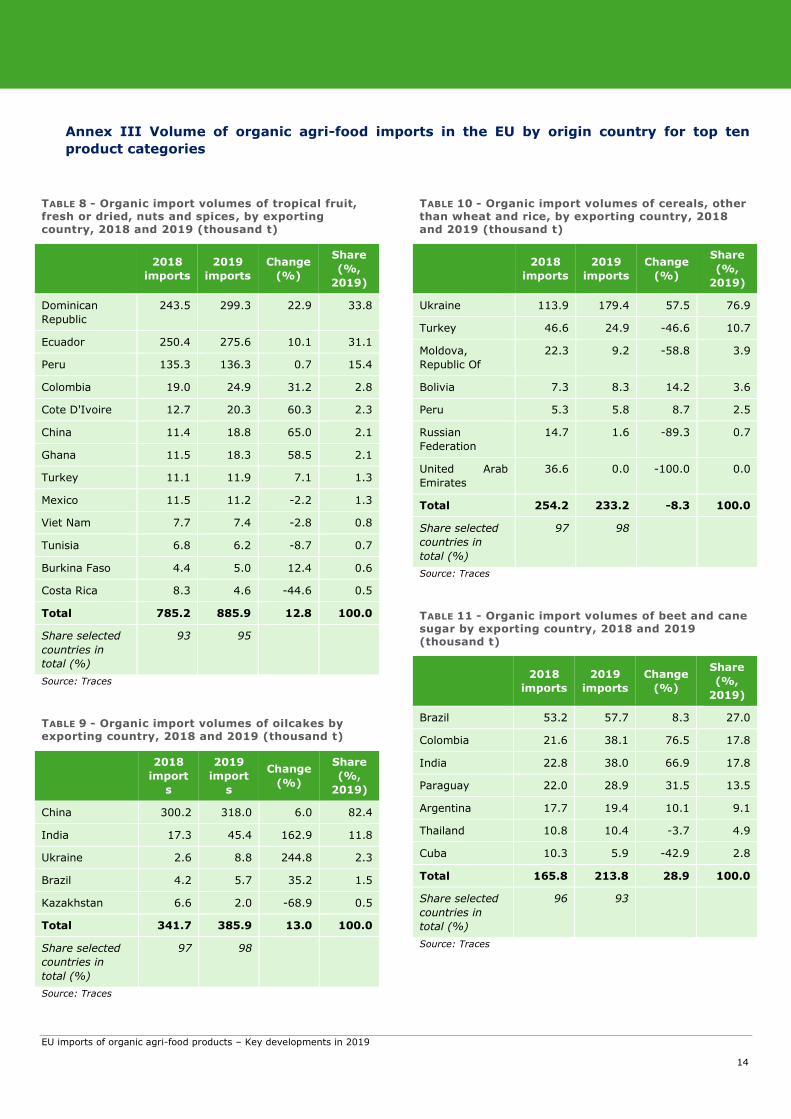
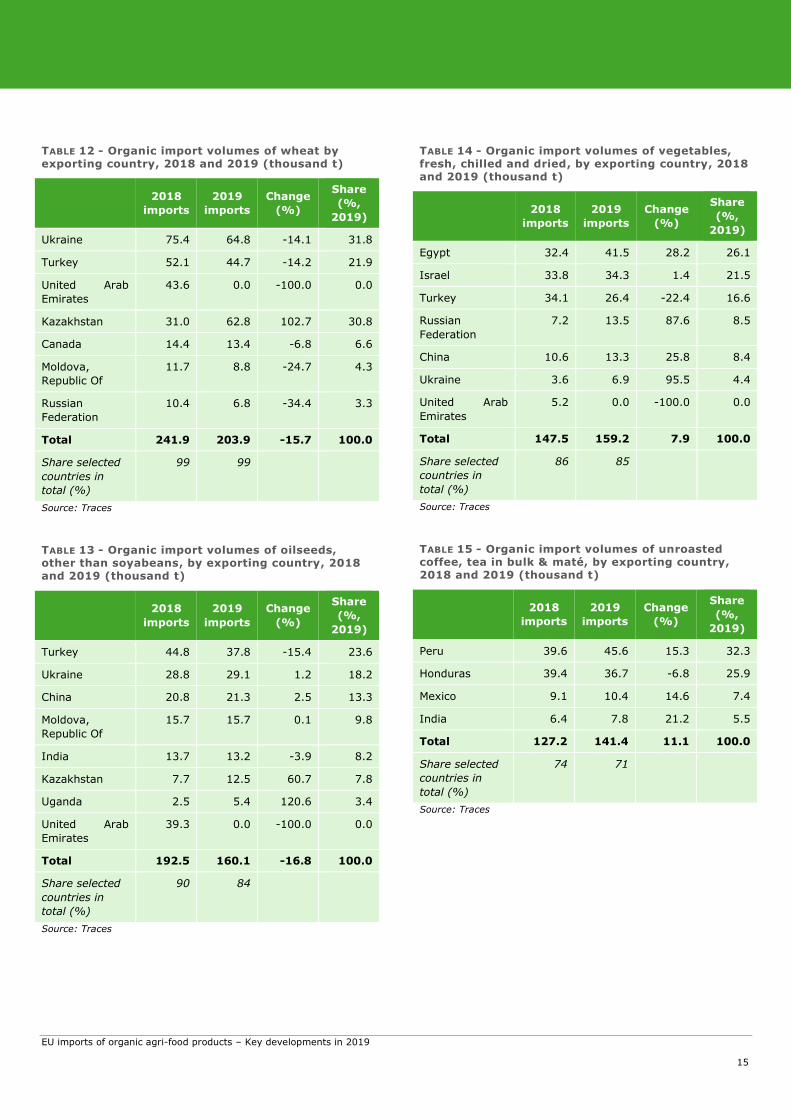
Over 80 % of organic oilcakes are imported from
China. With regard to oilseeds, important origins
include China, Ukraine and India, as well as Togo for
soyabeans and Turkey for other oilseeds. A vast
majority of organic cereals (excluding rice) is
imported from Ukraine (32 % of wheat, 77 % of other
cereals) and Turkey (22 % of wheat, 11 % of other
cereals) as well as from Kazakhstan for wheat (31 %).
Pakistan and India are the main origin country of
imported organic rice (respectively 36 % and 25 % of
total organic rice imports). Three-quarters of organic
sugar is imported from four countries: Brazil (27 %),
Colombia, India (both 18 %) and Paraguay (14 %).
FIGURE 8 – Organic cereals, oilseeds and sugar import volumes by exporting country, 2019 (million t)
Source: Traces
5. Imports of organic fruit and
vegetables
Fruit and vegetables is the second largest group of
imported organic product categories, with
1.35 million t imported in 2019 (42 % of total organic
imports). The largest share is composed by tropical
fruit, nuts and spices (66 %) which include mainly
bananas (85 % of tropical fruit).
Imports of organic fruit and vegetables increased by
8 % in 2019. A particularly strong increase is
observed in imports of tropical fruit, nuts and spices,
with 2019 imports close to 0.9 million t (+13 %). Two
categories show however a decrease compared to the
previous year: fruit other than exotic and citrus fruit
(-8 %) and fruit juices (-3 %).
TABLE 2 - Organic fruit and vegetables import volumes by product category, 2018 and 2019 (thousand t)
2018
imports
2019
imports
Change
(%)
Tropical fruit, fresh or
dried, nuts and spices 785 886 12.8
of which bananas 654 749 14.6
Vegetables, fresh,
chilled and dried 147 159 7.9
of which dried
leguminous 58 58 1.3
of which potatoes 33 28 -16.1
of which onions,
shallots and garlic 13 27 115.5
Fruit, fresh or dried,
excl. citrus & tropical
fruit
146 134 -8.5
of which apples and
pears 59 38 -36.3
of which grapes 20 22 11.0
Fruit juices 89 87 -2.8
of which orange juice 32 30 -4.6
of which apple juice 30 24 -20.1
Preparations of
vegetables, fruit or nuts 55 57 3.9
of which preparations
of fruit 50 51 1.0
Citrus fruit 29 30 2.7
of which lemons 16 16 5.9
of which oranges 8 7 -4.3
Total 1 252 1 352 8.0
Source: Traces
Organic tropical fruit, nuts and spices are imported
mainly from the Dominican Republic (34 % of total,
equal to 0.3 million t), Ecuador (31 %) and Peru
(15 %). Almost half of the imported organic citrus
fruit originate from South Africa (46 %), while other
organic fruits come from mainly from Turkey (25 %)
and Argentina (17 %). About half of organic fruit
juices imported come from Turkey and Mexico (both
25 %). Middle Eastern countries are the main origin of
organic vegetables, including Egypt (26 %), Israel
(22 %) and Turkey (17 %). For preparations of
vegetables, fruit or nuts, none of the origin countries
significantly emerges over the others.
EU imports of organic agri-food products – Key developments in 2019
6
FIGURE 9 – Organic fruit and vegetables import volumes by exporting country, 2019 (million t)
Source: Traces
6. Imports of organic permanent crops
(excluding fruit and nuts)
Beside organic fruit and nuts, a further 260 000 t of
organic permanent crops (and their derivatives) are
imported. This includes in particular unroasted coffee,
tea in bulk and maté (54 %), of which 92% is coffee,
as well as cocoa beans (25 %). Organic imports under
these product categories increased slightly in 2019
compared to 2018 (+3 %). While unroasted coffee,
tea in bulk and mate increased with 11 %, imports of
cocoa beans showed a similar percentage decrease.
TABLE 3 - Organic permanent crops (excl. fruit and nuts) import volumes by product category, 2018 and 2019 (thousand t)
2018
imports
2019
imports
Change
(%)
Unroasted coffee, tea
in bulk & maté 127 141 11.1
of which coffee 117 130 11.6
Cocoa beans 74 66 -11.3
Olive oil 30 34 11.6
Wine, vermouth, cider
and vinegar 21 20 -5.3
of which wine 19 19 2.3
Roasted coffee and tea 0.8 0.9 13.4
Total 253 262 3.3
Source: Traces
Unroasted coffee is largely imported from Peru and
Honduras: together, they represent 58 % of the
exporting countries under this category (respectively
32 % and 26 %). Cocoa beans come from the
Dominican Republic (37 %), Peru (20 %) and Sierra
Leone (17 %). Tunisia is the sole exporter of organic
olive oil to the EU. Chile and Argentina export each
about a third of organic wine, vermouth, cider and
vinegar to the EU, and further quantities are imported
mainly from South Africa and Australia.
FIGURE 10 – Organic permanent crops (excl. fruit and nuts) import volumes by exporting country, 2019 (thousand t)
Source: Traces
7. Imports of organic animal products
TABLE 5 - Organic animal product import volumes by product category, 2018 and 2019 (t)
2018
imports
2019
imports
Change
(%)
Eggs and honey 17 808 18 032 1.3
of which honey 17 693 17 901 2.6
Bovine meat, fresh,
chilled and frozen 666 486 -27.1
Non edible animal
products 453 233 -48.4
Sheep and goat meat,
fresh, chilled and frozen 132 71 -46.3
Cheese 0 1 N.A.
Pork meat, fresh,
chilled and frozen 19 0 N.A.
Butter 0.2 0 N.A.
Total 19 079 18 823 -1.3
Source: Traces
Honey is the main imported organic animal product.
Imports in 2019 remained stable compared to the
previous year around 18 000 t. Beside honey, imports
of organic animal products in the EU are negligible
and represent together less than 1 000 t in 2019.
EU imports of organic agri-food products – Key developments in 2019
7
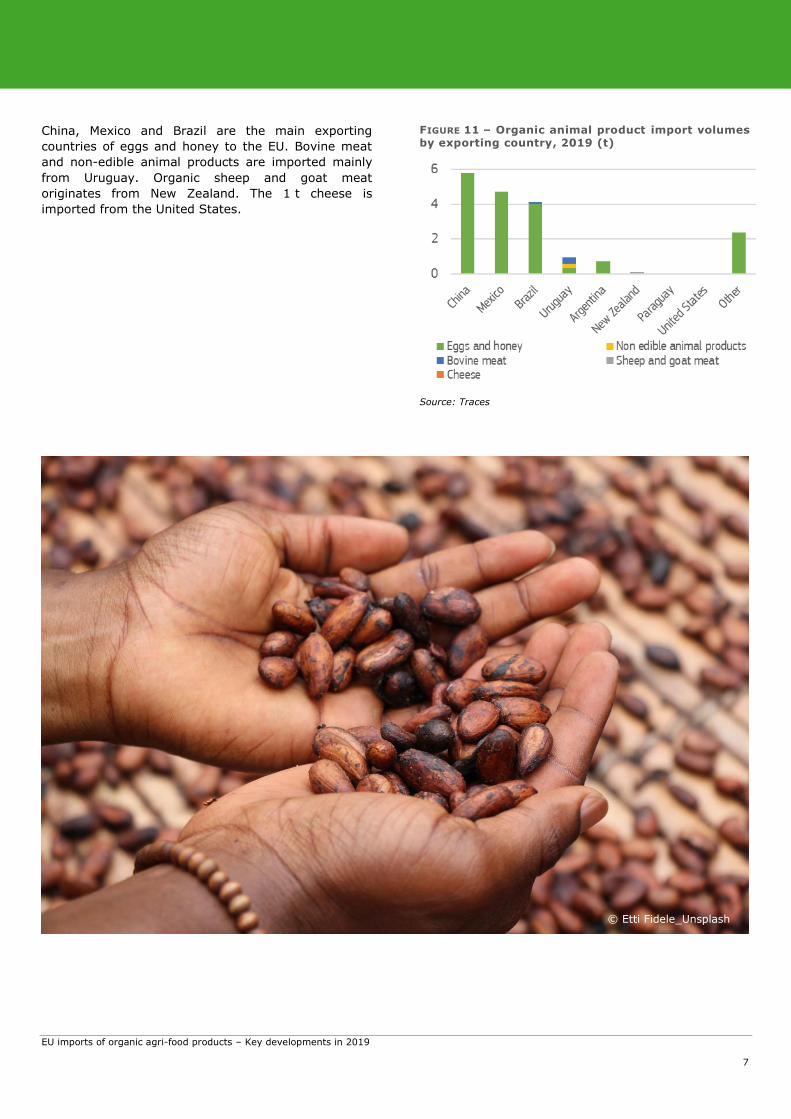
China, Mexico and Brazil are the main exporting
countries of eggs and honey to the EU. Bovine meat
and non-edible animal products are imported mainly
from Uruguay. Organic sheep and goat meat
originates from New Zealand. The 1 t cheese is
imported from the United States.
FIGURE 11 – Organic animal product import volumes by exporting country, 2019 (t)
Source: Traces
© Etti Fidele_Unsplash
EU imports of organic agri-food products – Key developments in 2019
8
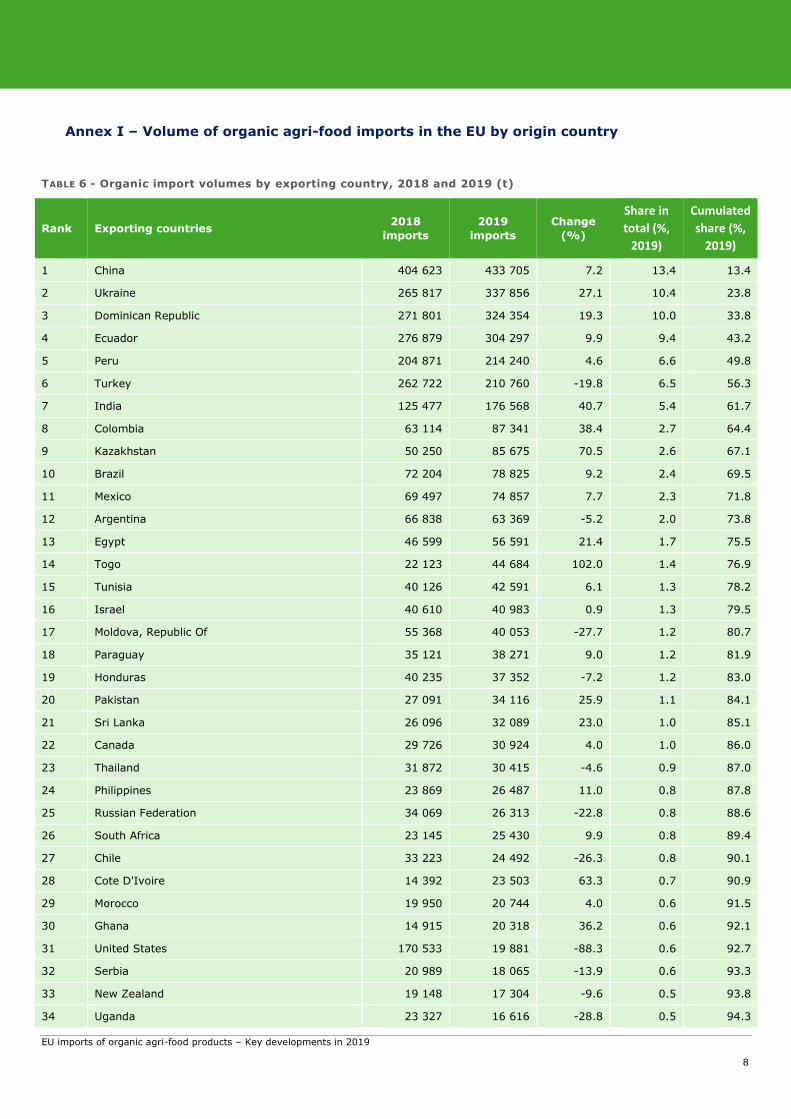
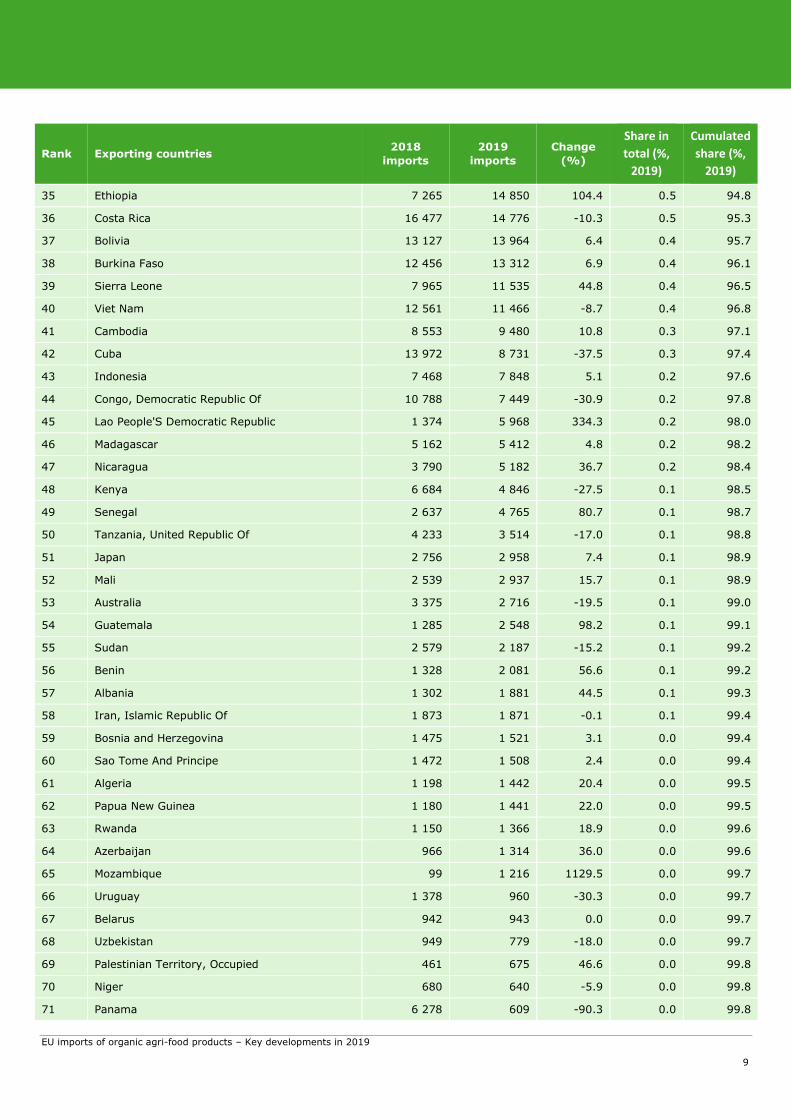
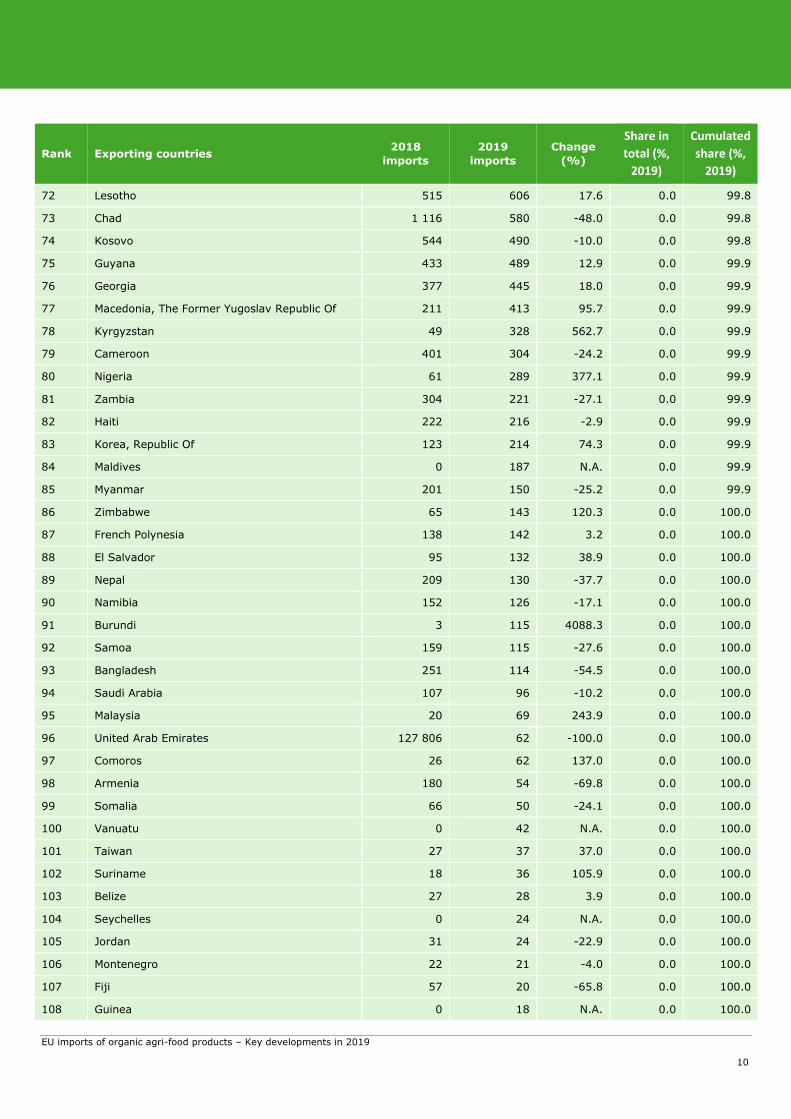
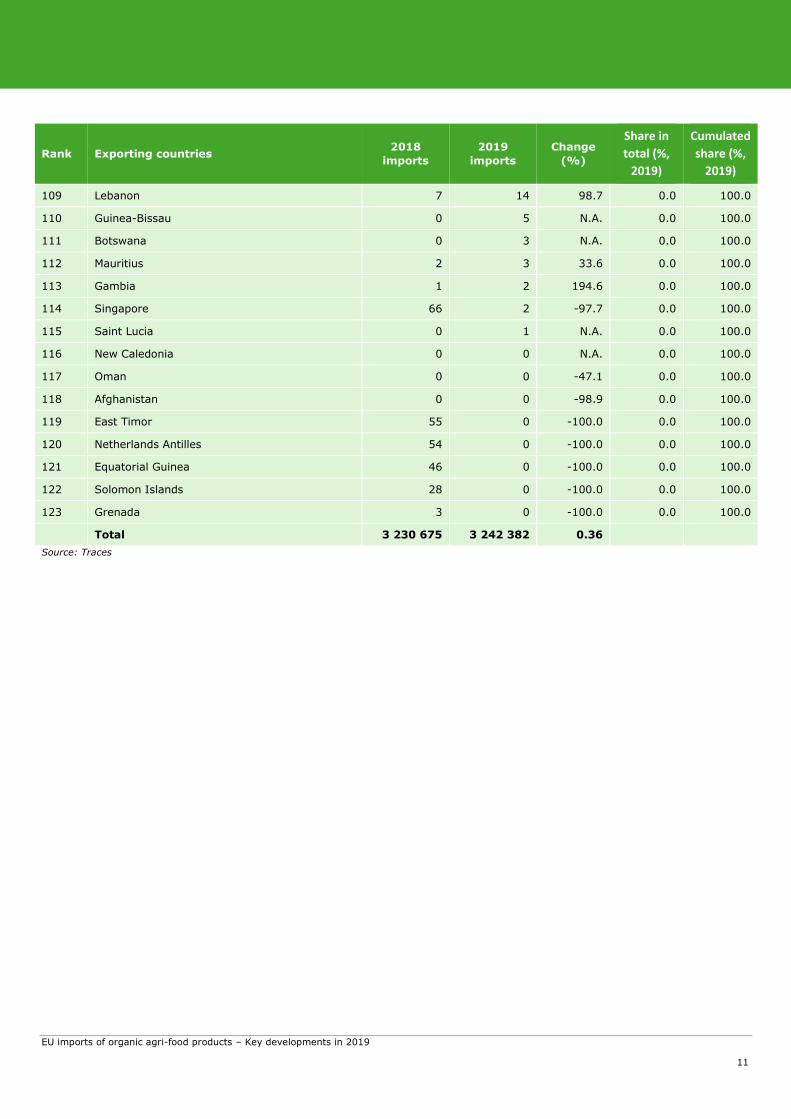
Annex I – Volume of organic agri-food imports in the EU by origin country
TABLE 6 - Organic import volumes by exporting country, 2018 and 2019 (t)
Rank Exporting countries 2018
imports
2019
imports
Change
(%)
Share in
total (%,
2019)
Cumulated
share (%,
2019)
1 China 404 623 433 705 7.2 13.4 13.4
2 Ukraine 265 817 337 856 27.1 10.4 23.8
3 Dominican Republic 271 801 324 354 19.3 10.0 33.8
4 Ecuador 276 879 304 297 9.9 9.4 43.2
5 Peru 204 871 214 240 4.6 6.6 49.8
6 Turkey 262 722 210 760 -19.8 6.5 56.3
7 India 125 477 176 568 40.7 5.4 61.7
8 Colombia 63 114 87 341 38.4 2.7 64.4
9 Kazakhstan 50 250 85 675 70.5 2.6 67.1
10 Brazil 72 204 78 825 9.2 2.4 69.5
11 Mexico 69 497 74 857 7.7 2.3 71.8
12 Argentina 66 838 63 369 -5.2 2.0 73.8
13 Egypt 46 599 56 591 21.4 1.7 75.5
14 Togo 22 123 44 684 102.0 1.4 76.9
15 Tunisia 40 126 42 591 6.1 1.3 78.2
16 Israel 40 610 40 983 0.9 1.3 79.5
17 Moldova, Republic Of 55 368 40 053 -27.7 1.2 80.7
18 Paraguay 35 121 38 271 9.0 1.2 81.9
19 Honduras 40 235 37 352 -7.2 1.2 83.0
20 Pakistan 27 091 34 116 25.9 1.1 84.1
21 Sri Lanka 26 096 32 089 23.0 1.0 85.1
22 Canada 29 726 30 924 4.0 1.0 86.0
23 Thailand 31 872 30 415 -4.6 0.9 87.0
24 Philippines 23 869 26 487 11.0 0.8 87.8
25 Russian Federation 34 069 26 313 -22.8 0.8 88.6
26 South Africa 23 145 25 430 9.9 0.8 89.4
27 Chile 33 223 24 492 -26.3 0.8 90.1
28 Cote D'Ivoire 14 392 23 503 63.3 0.7 90.9
29 Morocco 19 950 20 744 4.0 0.6 91.5
30 Ghana 14 915 20 318 36.2 0.6 92.1
31 United States 170 533 19 881 -88.3 0.6 92.7
32 Serbia 20 989 18 065 -13.9 0.6 93.3
33 New Zealand 19 148 17 304 -9.6 0.5 93.8
34 Uganda 23 327 16 616 -28.8 0.5 94.3
EU imports of organic agri-food products – Key developments in 2019
9
Rank Exporting countries 2018
imports
2019
imports
Change
(%)
Share in
total (%,
2019)
Cumulated
share (%,
2019)
35 Ethiopia 7 265 14 850 104.4 0.5 94.8
36 Costa Rica 16 477 14 776 -10.3 0.5 95.3
37 Bolivia 13 127 13 964 6.4 0.4 95.7
38 Burkina Faso 12 456 13 312 6.9 0.4 96.1
39 Sierra Leone 7 965 11 535 44.8 0.4 96.5
40 Viet Nam 12 561 11 466 -8.7 0.4 96.8
41 Cambodia 8 553 9 480 10.8 0.3 97.1
42 Cuba 13 972 8 731 -37.5 0.3 97.4
43 Indonesia 7 468 7 848 5.1 0.2 97.6
44 Congo, Democratic Republic Of 10 788 7 449 -30.9 0.2 97.8
45 Lao People'S Democratic Republic 1 374 5 968 334.3 0.2 98.0
46 Madagascar 5 162 5 412 4.8 0.2 98.2
47 Nicaragua 3 790 5 182 36.7 0.2 98.4
48 Kenya 6 684 4 846 -27.5 0.1 98.5
49 Senegal 2 637 4 765 80.7 0.1 98.7
50 Tanzania, United Republic Of 4 233 3 514 -17.0 0.1 98.8
51 Japan 2 756 2 958 7.4 0.1 98.9
52 Mali 2 539 2 937 15.7 0.1 98.9
53 Australia 3 375 2 716 -19.5 0.1 99.0
54 Guatemala 1 285 2 548 98.2 0.1 99.1
55 Sudan 2 579 2 187 -15.2 0.1 99.2
56 Benin 1 328 2 081 56.6 0.1 99.2
57 Albania 1 302 1 881 44.5 0.1 99.3
58 Iran, Islamic Republic Of 1 873 1 871 -0.1 0.1 99.4
59 Bosnia and Herzegovina 1 475 1 521 3.1 0.0 99.4
60 Sao Tome And Principe 1 472 1 508 2.4 0.0 99.4
61 Algeria 1 198 1 442 20.4 0.0 99.5
62 Papua New Guinea 1 180 1 441 22.0 0.0 99.5
63 Rwanda 1 150 1 366 18.9 0.0 99.6
64 Azerbaijan 966 1 314 36.0 0.0 99.6
65 Mozambique 99 1 216 1129.5 0.0 99.7
66 Uruguay 1 378 960 -30.3 0.0 99.7
67 Belarus 942 943 0.0 0.0 99.7
68 Uzbekistan 949 779 -18.0 0.0 99.7
69 Palestinian Territory, Occupied 461 675 46.6 0.0 99.8
70 Niger 680 640 -5.9 0.0 99.8
71 Panama 6 278 609 -90.3 0.0 99.8
EU imports of organic agri-food products – Key developments in 2019
10
Rank Exporting countries 2018
imports
2019
imports
Change
(%)
Share in
total (%,
2019)
Cumulated
share (%,
2019)
72 Lesotho 515 606 17.6 0.0 99.8
73 Chad 1 116 580 -48.0 0.0 99.8
74 Kosovo 544 490 -10.0 0.0 99.8
75 Guyana 433 489 12.9 0.0 99.9
76 Georgia 377 445 18.0 0.0 99.9
77 Macedonia, The Former Yugoslav Republic Of 211 413 95.7 0.0 99.9
78 Kyrgyzstan 49 328 562.7 0.0 99.9
79 Cameroon 401 304 -24.2 0.0 99.9
80 Nigeria 61 289 377.1 0.0 99.9
81 Zambia 304 221 -27.1 0.0 99.9
82 Haiti 222 216 -2.9 0.0 99.9
83 Korea, Republic Of 123 214 74.3 0.0 99.9
84 Maldives 0 187 N.A. 0.0 99.9
85 Myanmar 201 150 -25.2 0.0 99.9
86 Zimbabwe 65 143 120.3 0.0 100.0
87 French Polynesia 138 142 3.2 0.0 100.0
88 El Salvador 95 132 38.9 0.0 100.0
89 Nepal 209 130 -37.7 0.0 100.0
90 Namibia 152 126 -17.1 0.0 100.0
91 Burundi 3 115 4088.3 0.0 100.0
92 Samoa 159 115 -27.6 0.0 100.0
93 Bangladesh 251 114 -54.5 0.0 100.0
94 Saudi Arabia 107 96 -10.2 0.0 100.0
95 Malaysia 20 69 243.9 0.0 100.0
96 United Arab Emirates 127 806 62 -100.0 0.0 100.0
97 Comoros 26 62 137.0 0.0 100.0
98 Armenia 180 54 -69.8 0.0 100.0
99 Somalia 66 50 -24.1 0.0 100.0
100 Vanuatu 0 42 N.A. 0.0 100.0
101 Taiwan 27 37 37.0 0.0 100.0
102 Suriname 18 36 105.9 0.0 100.0
103 Belize 27 28 3.9 0.0 100.0
104 Seychelles 0 24 N.A. 0.0 100.0
105 Jordan 31 24 -22.9 0.0 100.0
106 Montenegro 22 21 -4.0 0.0 100.0
107 Fiji 57 20 -65.8 0.0 100.0
108 Guinea 0 18 N.A. 0.0 100.0
EU imports of organic agri-food products – Key developments in 2019
11
Rank Exporting countries 2018
imports
2019
imports
Change
(%)
Share in
total (%,
2019)
Cumulated
share (%,
2019)
109 Lebanon 7 14 98.7 0.0 100.0
110 Guinea-Bissau 0 5 N.A. 0.0 100.0
111 Botswana 0 3 N.A. 0.0 100.0
112 Mauritius 2 3 33.6 0.0 100.0
113 Gambia 1 2 194.6 0.0 100.0
114 Singapore 66 2 -97.7 0.0 100.0
115 Saint Lucia 0 1 N.A. 0.0 100.0
116 New Caledonia 0 0 N.A. 0.0 100.0
117 Oman 0 0 -47.1 0.0 100.0
118 Afghanistan 0 0 -98.9 0.0 100.0
119 East Timor 55 0 -100.0 0.0 100.0
120 Netherlands Antilles 54 0 -100.0 0.0 100.0
121 Equatorial Guinea 46 0 -100.0 0.0 100.0
122 Solomon Islands 28 0 -100.0 0.0 100.0
123 Grenada 3 0 -100.0 0.0 100.0
Total 3 230 675 3 242 382 0.36
Source: Traces
EU imports of organic agri-food products – Key developments in 2019
12
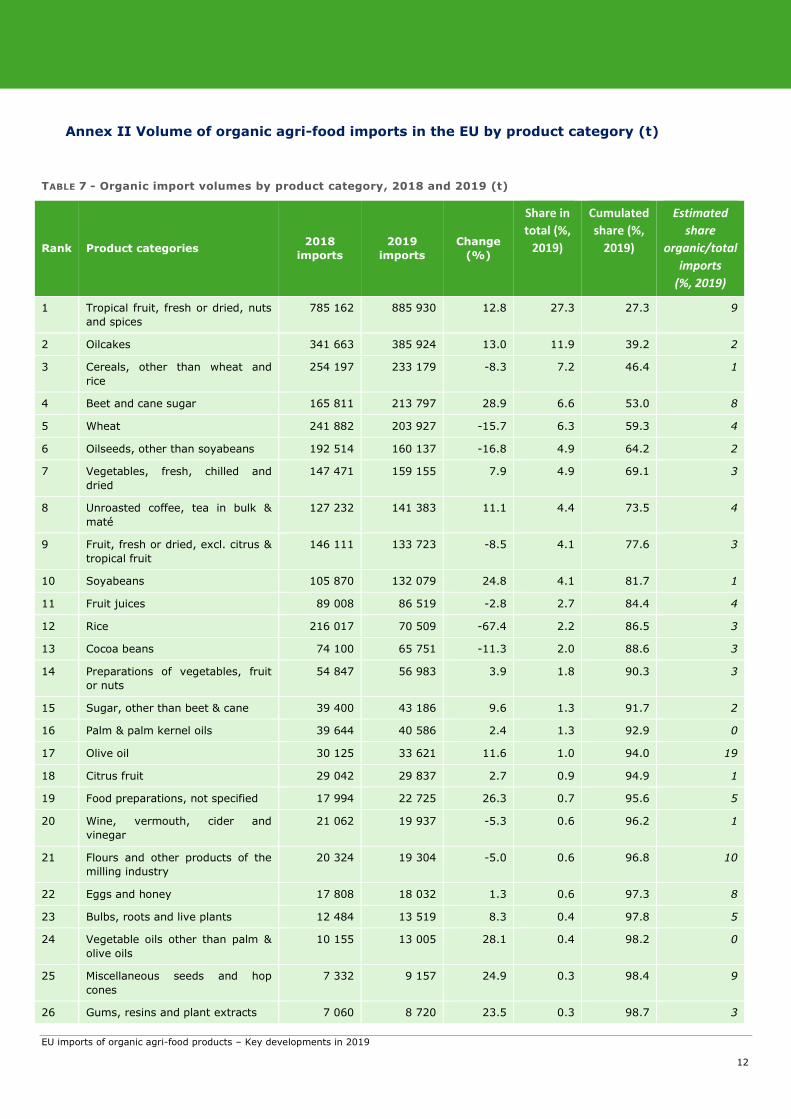
Annex II Volume of organic agri-food imports in the EU by product category (t)
TABLE 7 - Organic import volumes by product category, 2018 and 2019 (t)
Rank Product categories 2018
imports
2019
imports
Change
(%)
Share in
total (%,
2019)
Cumulated
share (%,
2019)
Estimated
share
organic/total
imports
(%, 2019)
1 Tropical fruit, fresh or dried, nuts
and spices
785 162 885 930 12.8 27.3 27.3 9
2 Oilcakes 341 663 385 924 13.0 11.9 39.2 2
3 Cereals, other than wheat and
rice
254 197 233 179 -8.3 7.2 46.4 1
4 Beet and cane sugar 165 811 213 797 28.9 6.6 53.0 8
5 Wheat 241 882 203 927 -15.7 6.3 59.3 4
6 Oilseeds, other than soyabeans 192 514 160 137 -16.8 4.9 64.2 2
7 Vegetables, fresh, chilled and
dried
147 471 159 155 7.9 4.9 69.1 3
8 Unroasted coffee, tea in bulk &
maté
127 232 141 383 11.1 4.4 73.5 4
9 Fruit, fresh or dried, excl. citrus &
tropical fruit
146 111 133 723 -8.5 4.1 77.6 3
10 Soyabeans 105 870 132 079 24.8 4.1 81.7 1
11 Fruit juices 89 008 86 519 -2.8 2.7 84.4 4
12 Rice 216 017 70 509 -67.4 2.2 86.5 3
13 Cocoa beans 74 100 65 751 -11.3 2.0 88.6 3
14 Preparations of vegetables, fruit
or nuts
54 847 56 983 3.9 1.8 90.3 3
15 Sugar, other than beet & cane 39 400 43 186 9.6 1.3 91.7 2
16 Palm & palm kernel oils 39 644 40 586 2.4 1.3 92.9 0
17 Olive oil 30 125 33 621 11.6 1.0 94.0 19
18 Citrus fruit 29 042 29 837 2.7 0.9 94.9 1
19 Food preparations, not specified 17 994 22 725 26.3 0.7 95.6 5
20 Wine, vermouth, cider and
vinegar
21 062 19 937 -5.3 0.6 96.2 1
21 Flours and other products of the
milling industry
20 324 19 304 -5.0 0.6 96.8 10
22 Eggs and honey 17 808 18 032 1.3 0.6 97.3 8
23 Bulbs, roots and live plants 12 484 13 519 8.3 0.4 97.8 5
24 Vegetable oils other than palm &
olive oils
10 155 13 005 28.1 0.4 98.2 0
25 Miscellaneous seeds and hop
cones
7 332 9 157 24.9 0.3 98.4 9
26 Gums, resins and plant extracts 7 060 8 720 23.5 0.3 98.7 3
EU imports of organic agri-food products – Key developments in 2019
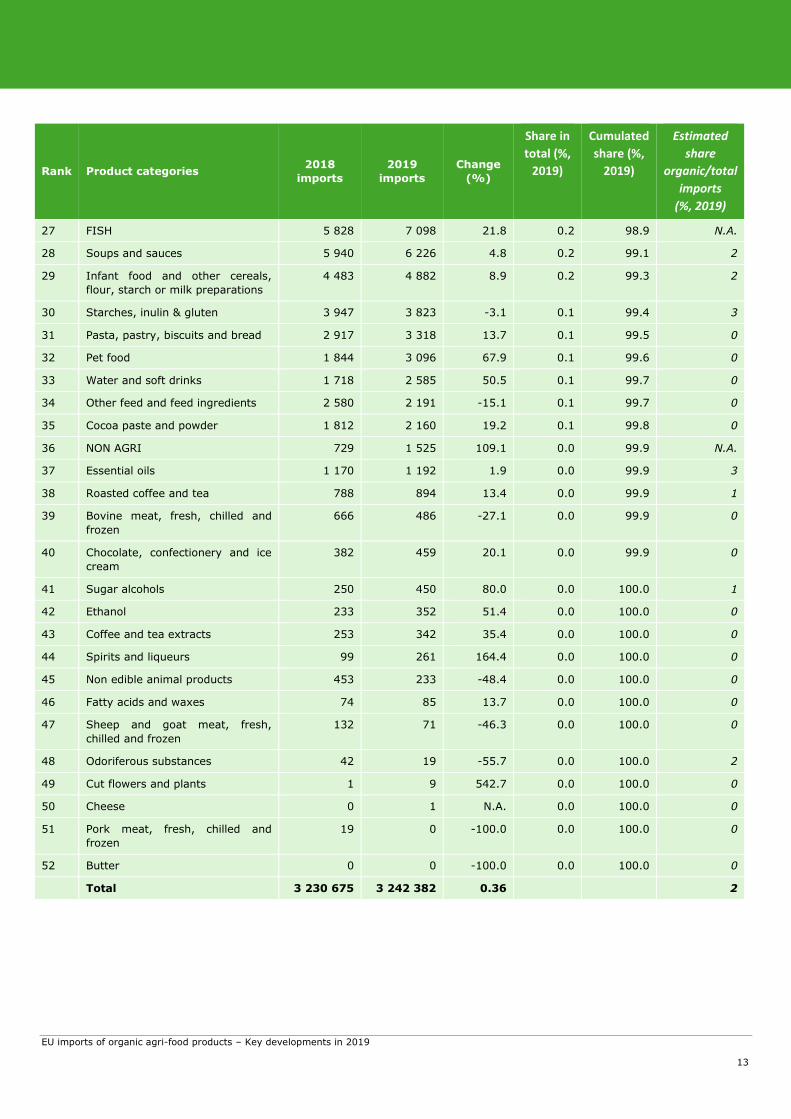
13
Rank Product categories 2018
imports
2019
imports
Change
(%)
Share in
total (%,
2019)
Cumulated
share (%,
2019)
Estimated
share
organic/total
imports
(%, 2019)
27 FISH 5 828 7 098 21.8 0.2 98.9 N.A.
28 Soups and sauces 5 940 6 226 4.8 0.2 99.1 2
29 Infant food and other cereals,
flour, starch or milk preparations
4 483 4 882 8.9 0.2 99.3 2
30 Starches, inulin & gluten 3 947 3 823 -3.1 0.1 99.4 3
31 Pasta, pastry, biscuits and bread 2 917 3 318 13.7 0.1 99.5 0
32 Pet food 1 844 3 096 67.9 0.1 99.6 0
33 Water and soft drinks 1 718 2 585 50.5 0.1 99.7 0
34 Other feed and feed ingredients 2 580 2 191 -15.1 0.1 99.7 0
35 Cocoa paste and powder 1 812 2 160 19.2 0.1 99.8 0
36 NON AGRI 729 1 525 109.1 0.0 99.9 N.A.
37 Essential oils 1 170 1 192 1.9 0.0 99.9 3
38 Roasted coffee and tea 788 894 13.4 0.0 99.9 1
39 Bovine meat, fresh, chilled and
frozen
666 486 -27.1 0.0 99.9 0
40 Chocolate, confectionery and ice
cream
382 459 20.1 0.0 99.9 0
41 Sugar alcohols 250 450 80.0 0.0 100.0 1
42 Ethanol 233 352 51.4 0.0 100.0 0
43 Coffee and tea extracts 253 342 35.4 0.0 100.0 0
44 Spirits and liqueurs 99 261 164.4 0.0 100.0 0
45 Non edible animal products 453 233 -48.4 0.0 100.0 0
46 Fatty acids and waxes 74 85 13.7 0.0 100.0 0
47 Sheep and goat meat, fresh,
chilled and frozen
132 71 -46.3 0.0 100.0 0
48 Odoriferous substances 42 19 -55.7 0.0 100.0 2
49 Cut flowers and plants 1 9 542.7 0.0 100.0 0
50 Cheese 0 1 N.A. 0.0 100.0 0
51 Pork meat, fresh, chilled and
frozen
19 0 -100.0 0.0 100.0 0
52 Butter 0 0 -100.0 0.0 100.0 0
Total 3 230 675 3 242 382 0.36 2
EU imports of organic agri-food products – Key developments in 2019
14
Annex III Volume of organic agri-food imports in the EU by origin country for top ten
product categories
TABLE 8 - Organic import volumes of tropical fruit, fresh or dried, nuts and spices, by exporting country, 2018 and 2019 (thousand t)
2018
imports
2019
imports
Change
(%)
Share
(%,
2019)
Dominican
Republic
243.5 299.3 22.9 33.8
Ecuador 250.4 275.6 10.1 31.1
Peru 135.3 136.3 0.7 15.4
Colombia 19.0 24.9 31.2 2.8
Cote D'Ivoire 12.7 20.3 60.3 2.3
China 11.4 18.8 65.0 2.1
Ghana 11.5 18.3 58.5 2.1
Turkey 11.1 11.9 7.1 1.3
Mexico 11.5 11.2 -2.2 1.3
Viet Nam 7.7 7.4 -2.8 0.8
Tunisia 6.8 6.2 -8.7 0.7
Burkina Faso 4.4 5.0 12.4 0.6
Costa Rica 8.3 4.6 -44.6 0.5
Total 785.2 885.9 12.8 100.0
Share selected
countries in
total (%)
93 95
Source: Traces
TABLE 9 - Organic import volumes of oilcakes by exporting country, 2018 and 2019 (thousand t)
2018
import
s
2019
import
s
Change
(%)
Share
(%,
2019)
China 300.2 318.0 6.0 82.4
India 17.3 45.4 162.9 11.8
Ukraine 2.6 8.8 244.8 2.3
Brazil 4.2 5.7 35.2 1.5
Kazakhstan 6.6 2.0 -68.9 0.5
Total 341.7 385.9 13.0 100.0
Share selected
countries in
total (%)
97 98
Source: Traces
TABLE 10 - Organic import volumes of cereals, other than wheat and rice, by exporting country, 2018 and 2019 (thousand t)
2018
imports
2019
imports
Change
(%)
Share
(%,
2019)
Ukraine 113.9 179.4 57.5 76.9
Turkey 46.6 24.9 -46.6 10.7
Moldova,
Republic Of
22.3 9.2 -58.8 3.9
Bolivia 7.3 8.3 14.2 3.6
Peru 5.3 5.8 8.7 2.5
Russian
Federation
14.7 1.6 -89.3 0.7
United Arab
Emirates
36.6 0.0 -100.0 0.0
Total 254.2 233.2 -8.3 100.0
Share selected
countries in
total (%)
97 98
Source: Traces
TABLE 11 - Organic import volumes of beet and cane sugar by exporting country, 2018 and 2019 (thousand t)
2018
imports
2019
imports
Change
(%)
Share
(%,
2019)
Brazil 53.2 57.7 8.3 27.0
Colombia 21.6 38.1 76.5 17.8
India 22.8 38.0 66.9 17.8
Paraguay 22.0 28.9 31.5 13.5
Argentina 17.7 19.4 10.1 9.1
Thailand 10.8 10.4 -3.7 4.9
Cuba 10.3 5.9 -42.9 2.8
Total 165.8 213.8 28.9 100.0
Share selected
countries in
total (%)
96 93
Source: Traces
EU imports of organic agri-food products – Key developments in 2019
15
TABLE 12 - Organic import volumes of wheat by exporting country, 2018 and 2019 (thousand t)
2018
imports
2019
imports
Change
(%)
Share
(%,
2019)
Ukraine 75.4 64.8 -14.1 31.8
Turkey 52.1 44.7 -14.2 21.9
United Arab
Emirates
43.6 0.0 -100.0 0.0
Kazakhstan 31.0 62.8 102.7 30.8
Canada 14.4 13.4 -6.8 6.6
Moldova,
Republic Of
11.7 8.8 -24.7 4.3
Russian
Federation
10.4 6.8 -34.4 3.3
Total 241.9 203.9 -15.7 100.0
Share selected
countries in
total (%)
99 99
Source: Traces
TABLE 13 - Organic import volumes of oilseeds, other than soyabeans, by exporting country, 2018 and 2019 (thousand t)
2018
imports
2019
imports
Change
(%)
Share
(%,
2019)
Turkey 44.8 37.8 -15.4 23.6
Ukraine 28.8 29.1 1.2 18.2
China 20.8 21.3 2.5 13.3
Moldova,
Republic Of
15.7 15.7 0.1 9.8
India 13.7 13.2 -3.9 8.2
Kazakhstan 7.7 12.5 60.7 7.8
Uganda 2.5 5.4 120.6 3.4
United Arab
Emirates
39.3 0.0 -100.0 0.0
Total 192.5 160.1 -16.8 100.0
Share selected
countries in
total (%)
90 84
Source: Traces
TABLE 14 - Organic import volumes of vegetables, fresh, chilled and dried, by exporting country, 2018 and 2019 (thousand t)
2018
imports
2019
imports
Change
(%)
Share
(%,
2019)
Egypt 32.4 41.5 28.2 26.1
Israel 33.8 34.3 1.4 21.5
Turkey 34.1 26.4 -22.4 16.6
Russian
Federation
7.2 13.5 87.6 8.5
China 10.6 13.3 25.8 8.4
Ukraine 3.6 6.9 95.5 4.4
United Arab
Emirates
5.2 0.0 -100.0 0.0
Total 147.5 159.2 7.9 100.0
Share selected
countries in
total (%)
86 85
Source: Traces
TABLE 15 - Organic import volumes of unroasted coffee, tea in bulk & maté, by exporting country, 2018 and 2019 (thousand t)
2018
imports
2019
imports
Change
(%)
Share
(%,
2019)
Peru 39.6 45.6 15.3 32.3
Honduras 39.4 36.7 -6.8 25.9
Mexico 9.1 10.4 14.6 7.4
India 6.4 7.8 21.2 5.5
Total 127.2 141.4 11.1 100.0
Share selected
countries in
total (%)
74 71
Source: Traces
EU imports of organic agri-food products – Key developments in 2019
16
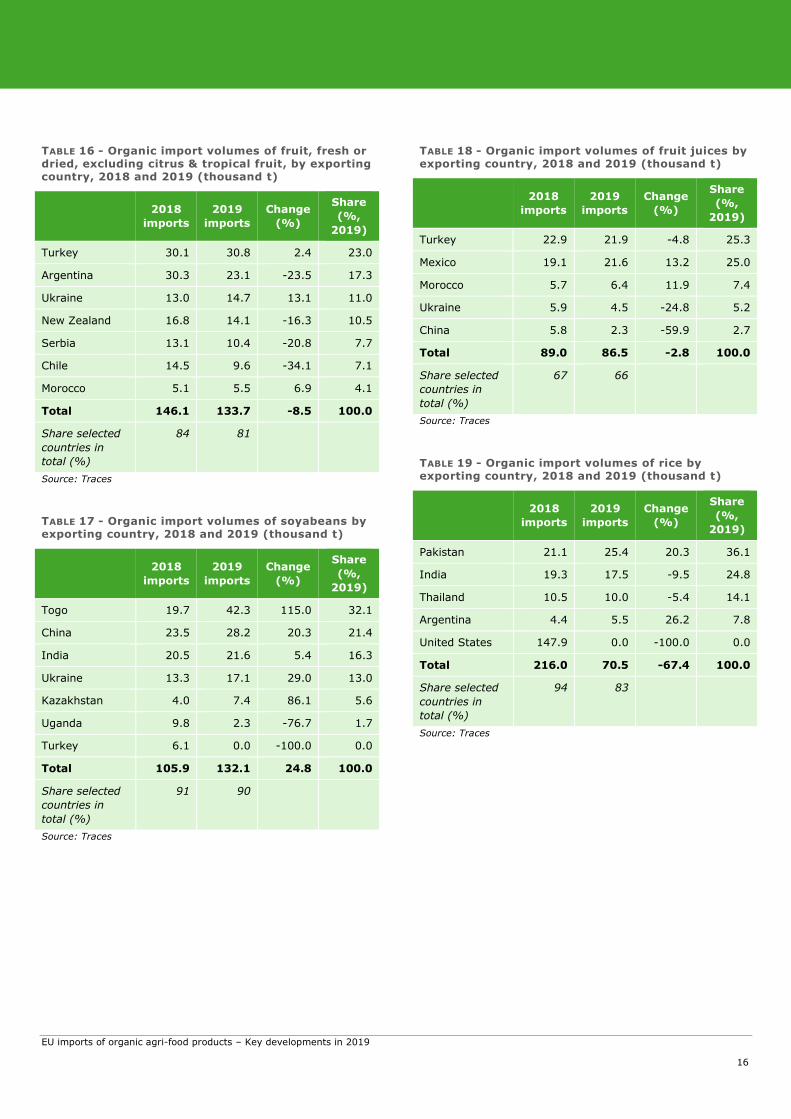
TABLE 16 - Organic import volumes of fruit, fresh or dried, excluding citrus & tropical fruit, by exporting country, 2018 and 2019 (thousand t)
2018
imports
2019
imports
Change
(%)
Share
(%,
2019)
Turkey 30.1 30.8 2.4 23.0
Argentina 30.3 23.1 -23.5 17.3
Ukraine 13.0 14.7 13.1 11.0
New Zealand 16.8 14.1 -16.3 10.5
Serbia 13.1 10.4 -20.8 7.7
Chile 14.5 9.6 -34.1 7.1
Morocco 5.1 5.5 6.9 4.1
Total 146.1 133.7 -8.5 100.0
Share selected
countries in
total (%)
84 81
Source: Traces
TABLE 17 - Organic import volumes of soyabeans by exporting country, 2018 and 2019 (thousand t)
2018
imports
2019
imports
Change
(%)
Share
(%,
2019)
Togo 19.7 42.3 115.0 32.1
China 23.5 28.2 20.3 21.4
India 20.5 21.6 5.4 16.3
Ukraine 13.3 17.1 29.0 13.0
Kazakhstan 4.0 7.4 86.1 5.6
Uganda 9.8 2.3 -76.7 1.7
Turkey 6.1 0.0 -100.0 0.0
Total 105.9 132.1 24.8 100.0
Share selected
countries in
total (%)
91 90
Source: Traces
TABLE 18 - Organic import volumes of fruit juices by exporting country, 2018 and 2019 (thousand t)
2018
imports
2019
imports
Change
(%)
Share
(%,
2019)
Turkey 22.9 21.9 -4.8 25.3
Mexico 19.1 21.6 13.2 25.0
Morocco 5.7 6.4 11.9 7.4
Ukraine 5.9 4.5 -24.8 5.2
China 5.8 2.3 -59.9 2.7
Total 89.0 86.5 -2.8 100.0
Share selected
countries in
total (%)
67 66
Source: Traces
TABLE 19 - Organic import volumes of rice by exporting country, 2018 and 2019 (thousand t)
2018
imports
2019
imports
Change
(%)
Share
(%,
2019)
Pakistan 21.1 25.4 20.3 36.1
India 19.3 17.5 -9.5 24.8
Thailand 10.5 10.0 -5.4 14.1
Argentina 4.4 5.5 26.2 7.8
United States 147.9 0.0 -100.0 0.0
Total 216.0 70.5 -67.4 100.0
Share selected
countries in
total (%)
94 83
Source: Traces
EU imports of organic agri-food products – Key developments in 2019
17
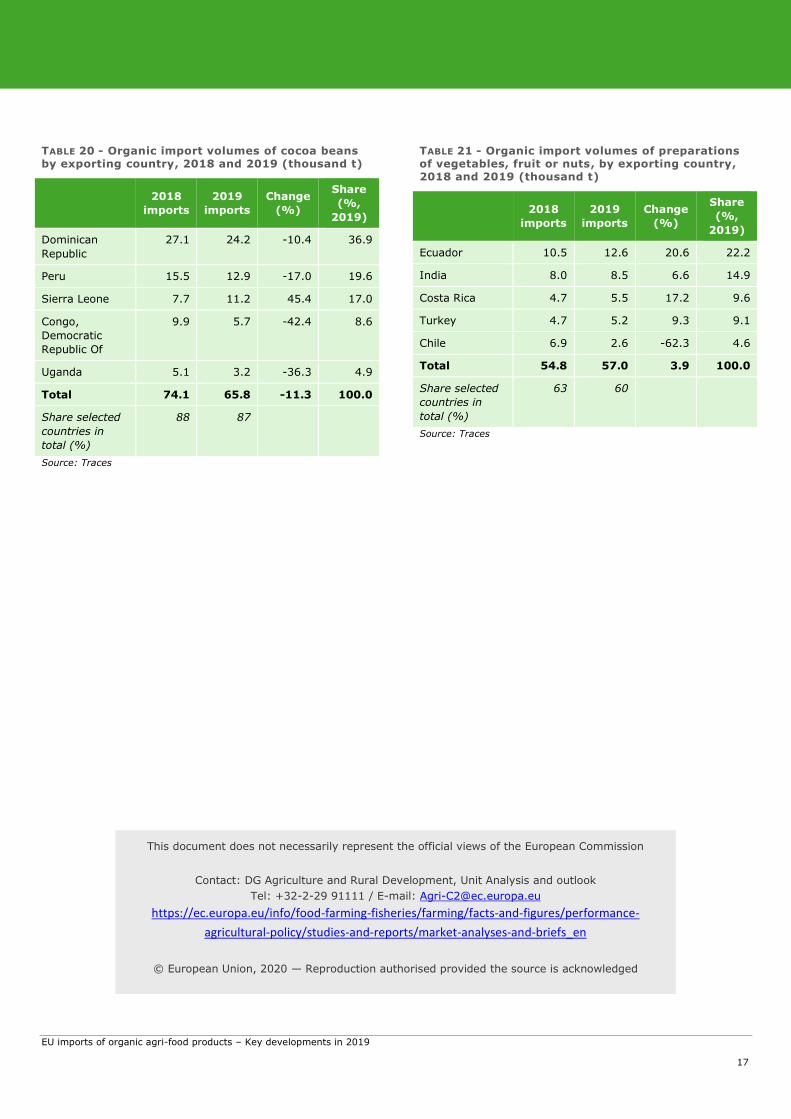
TABLE 20 - Organic import volumes of cocoa beans by exporting country, 2018 and 2019 (thousand t)
2018
imports
2019
imports
Change
(%)
Share
(%,
2019)
Dominican
Republic
27.1 24.2 -10.4 36.9
Peru 15.5 12.9 -17.0 19.6
Sierra Leone 7.7 11.2 45.4 17.0
Congo,
Democratic
Republic Of
9.9 5.7 -42.4 8.6
Uganda 5.1 3.2 -36.3 4.9
Total 74.1 65.8 -11.3 100.0
Share selected
countries in
total (%)
88 87
Source: Traces
TABLE 21 - Organic import volumes of preparations of vegetables, fruit or nuts, by exporting country, 2018 and 2019 (thousand t)
2018
imports
2019
imports
Change
(%)
Share
(%,
2019)
Ecuador 10.5 12.6 20.6 22.2
India 8.0 8.5 6.6 14.9
Costa Rica 4.7 5.5 17.2 9.6
Turkey 4.7 5.2 9.3 9.1
Chile 6.9 2.6 -62.3 4.6
Total 54.8 57.0 3.9 100.0
Share selected
countries in
total (%)
63 60
Source: Traces
This document does not necessarily represent the official views of the European Commission
Contact: DG Agriculture and Rural Development, Unit Analysis and outlook
Tel: +32-2-29 91111 / E-mail: [email protected]
https://ec.europa.eu/info/food-farming-fisheries/farming/facts-and-figures/performance-
agricultural-policy/studies-and-reports/market-analyses-and-briefs_en
© European Union, 2020 — Reproduction authorised provided the source is acknowledged