EU energy among Lisbon, Moskow and Kyoto
27
EU energy among Lisbon, Moskow and Kyoto Dr.Ionut PURICA IPE Academy of Romania
-
Upload
aileen-rodriguez -
Category
Documents
-
view
19 -
download
4
description
EU energy among Lisbon, Moskow and Kyoto. Dr.Ionut PURICA IPE Academy of Romania. Topics for discussion. Energy Trends in EU Energy Market in a regional context Surrounded – integrated corporate action New Technologies – real options Some Romanian data Conclusions. - PowerPoint PPT Presentation
Transcript of EU energy among Lisbon, Moskow and Kyoto

EU energy among Lisbon, Moskow and Kyoto
Dr.Ionut PURICA
IPE Academy of Romania

Topics for discussion
• Energy Trends in EU
• Energy Market in a regional context
• Surrounded – integrated corporate action
• New Technologies – real options
• Some Romanian data
• Conclusions
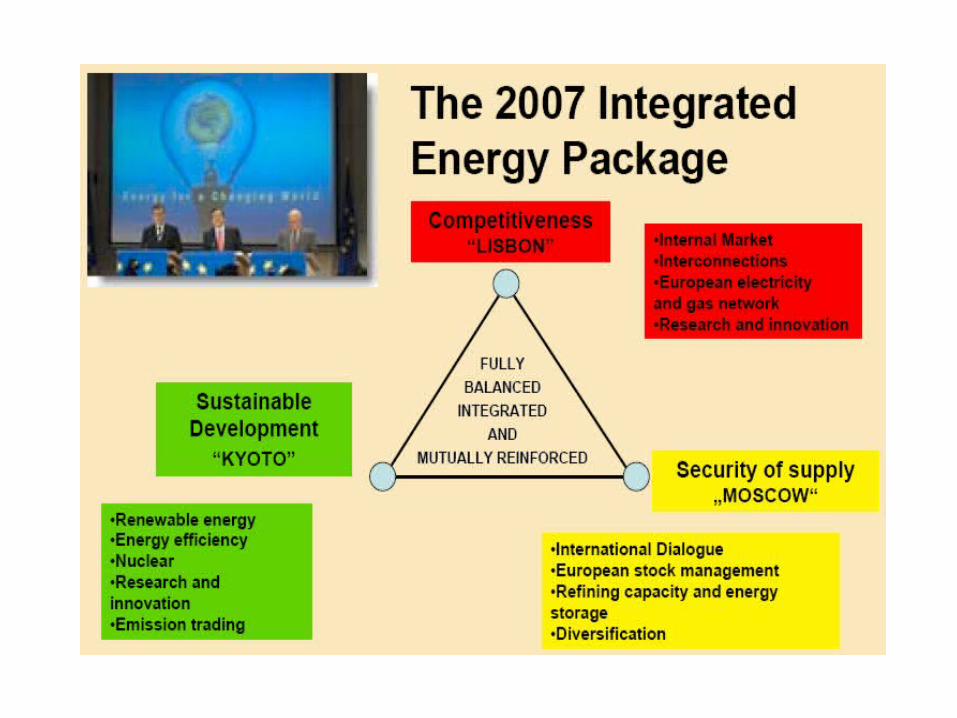
Energy trends in the EU
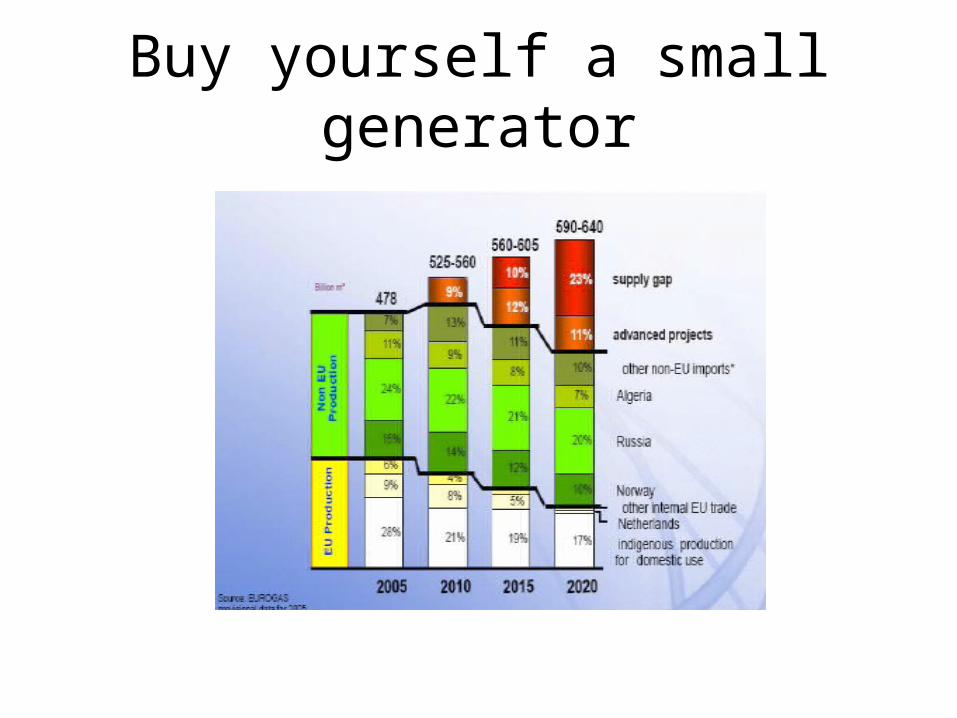
Buy yourself a small generator
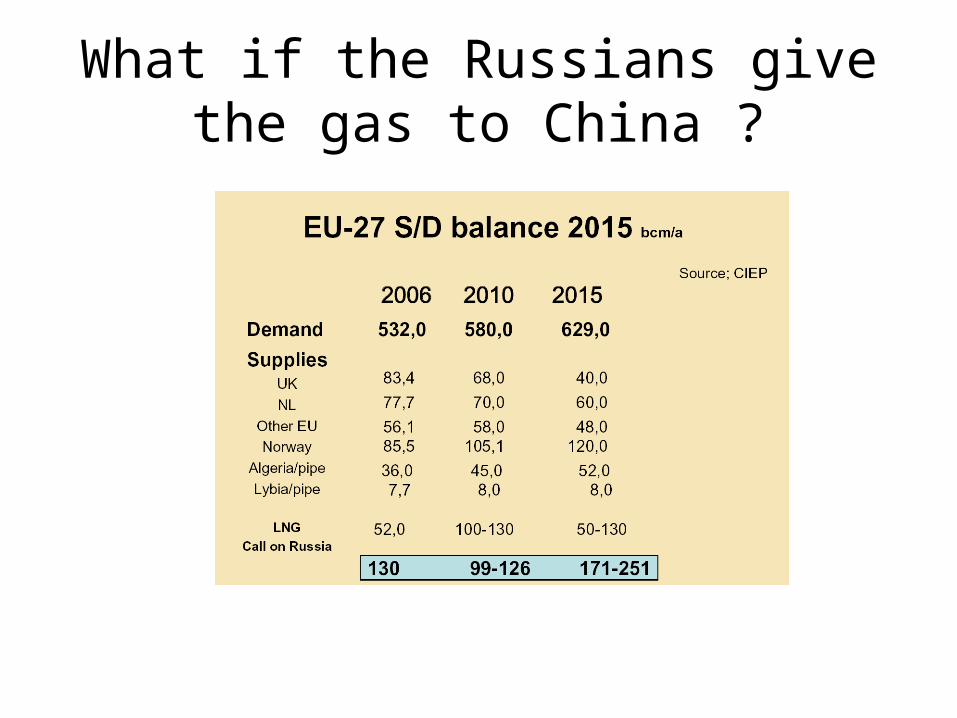
What if the Russians give the gas to China ?

Energy Market in a regional context
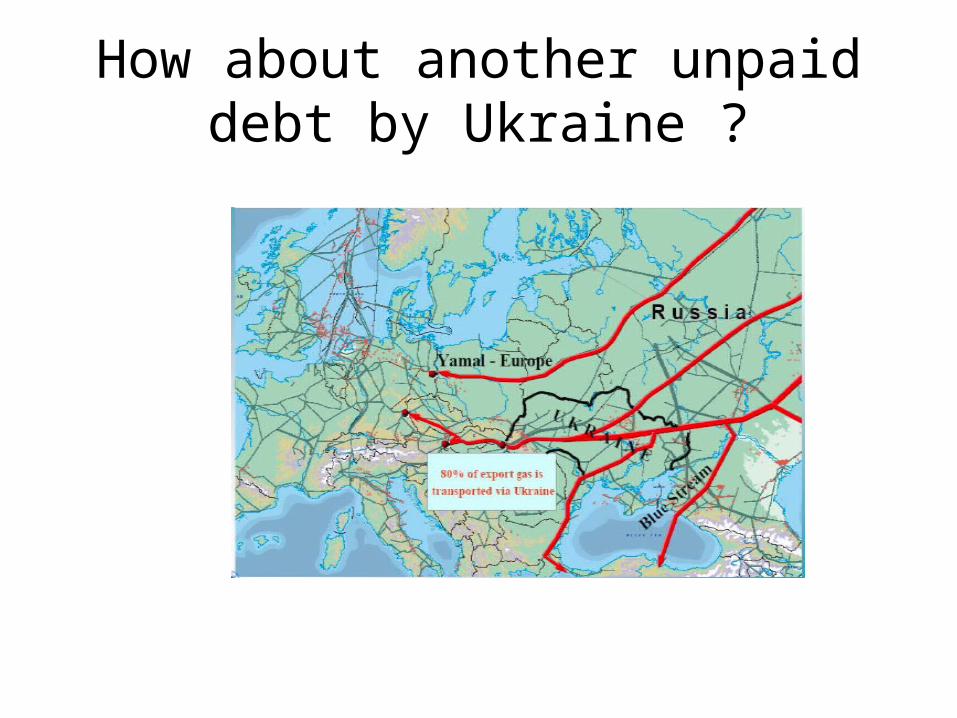
How about another unpaid debt by Ukraine ?

New Infrastructure towards the EU-27(bcm/a)Pipelines,Existing (2006), under construction/planned (2015)• Russia– EU-2006: 176– 2015: - FRG +55, Bulgaria +30• Norway– EU-2006: 128– 2015: UK +11, TBD:<20, Swe/DK:+8• Algeria– EU-2006: 40– 2015: Spain +13, Italy +13• Lybia– EU-2006: 9• Iran/Caspian– 2015: Bulgaria 23Total (2006) 344 – (2015) +92-173

Complex traffic risks in the Baltic both surface and submarine

State of health of NABUCO

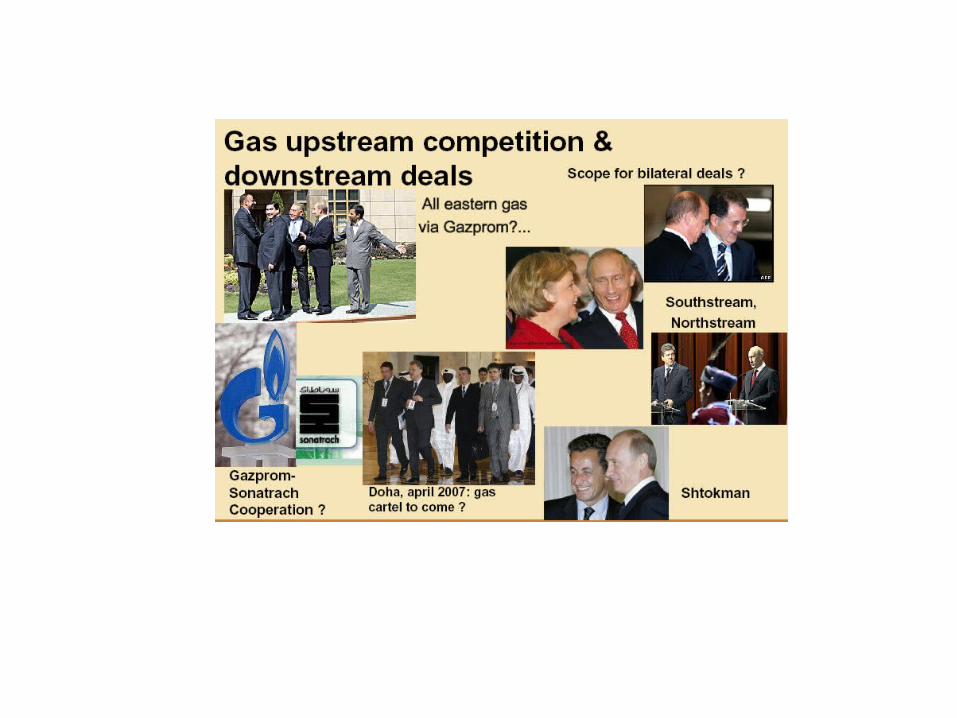
Surrounded – integrated corporate action

North Stream operational at end 2011; South Stream allowed by Turkey to pass in its waters in Dec.2011:“Best Christmas present to Russia”- Vladimir Putin
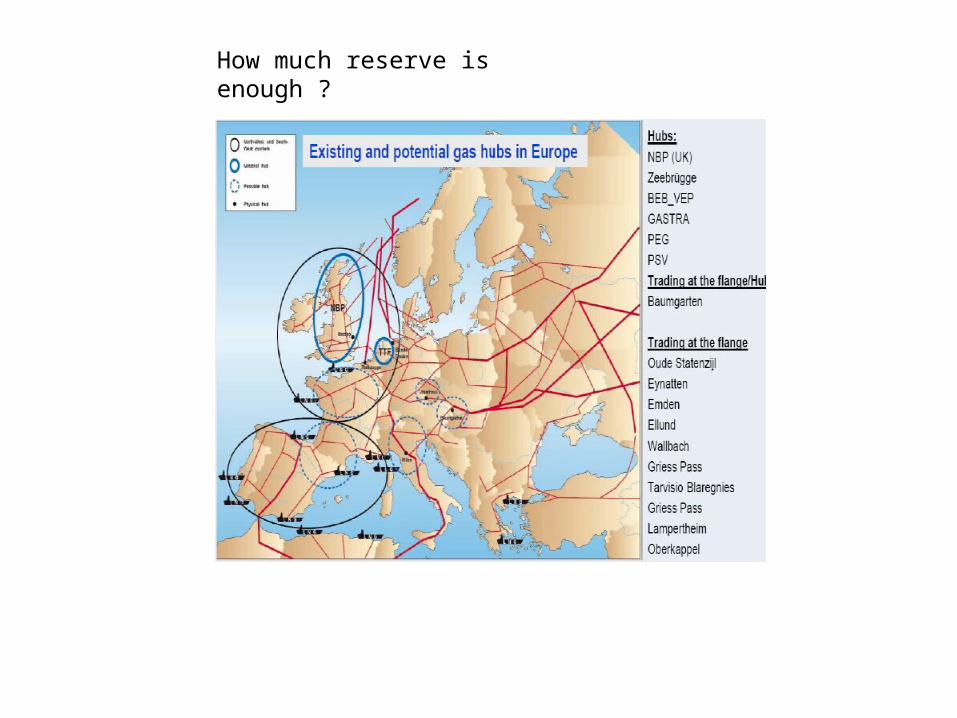
How much reserve is enough ?

LNG gas capacityLikely/possible
2007 2010 2015
Belgium 6,5 9,1 9,1
France 15,6 23,9 26,4-59,4
UK 9,0 44,0 49,7-54,7
NL 0,0 1,0 17,0-27,0
Italy 3,5 16,5 23,5-47,5
Spain 50,5 57,3 64,3
Portugal 5,5 5,5-8,5 5,5-8,5
Greece 2,6 2,6 2,6
Ireland 0,0 0,0 2,5
Croatia 0,0 0,0 10,0
Germany 0,0 5,0 10,0
Total 93,2 159,8-167,8 198-299,5

Gas Markets in Europe
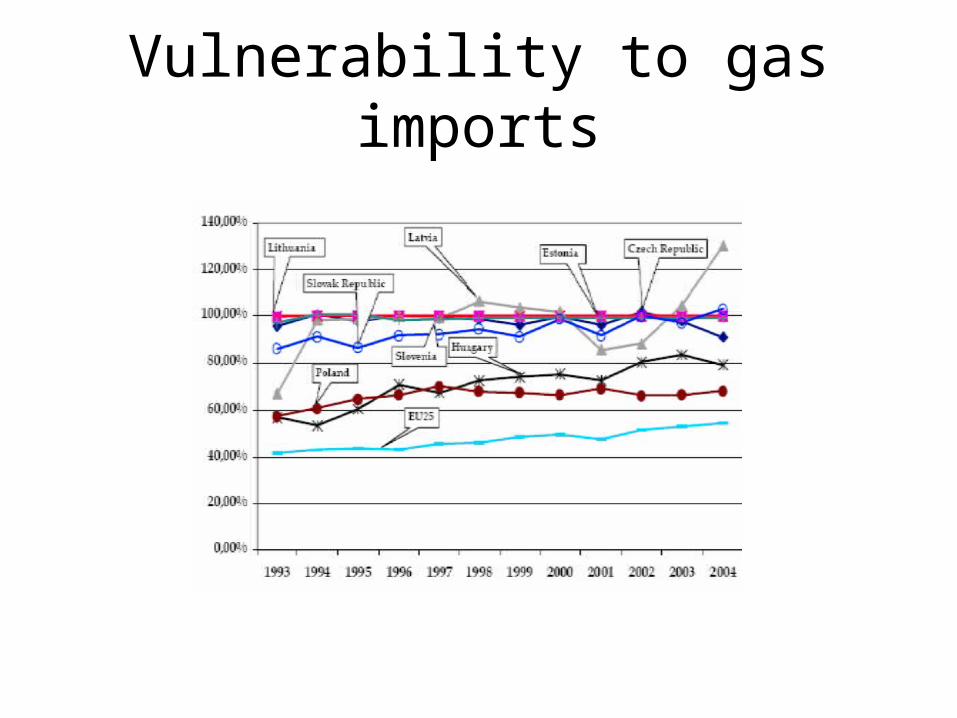
Vulnerability to gas imports
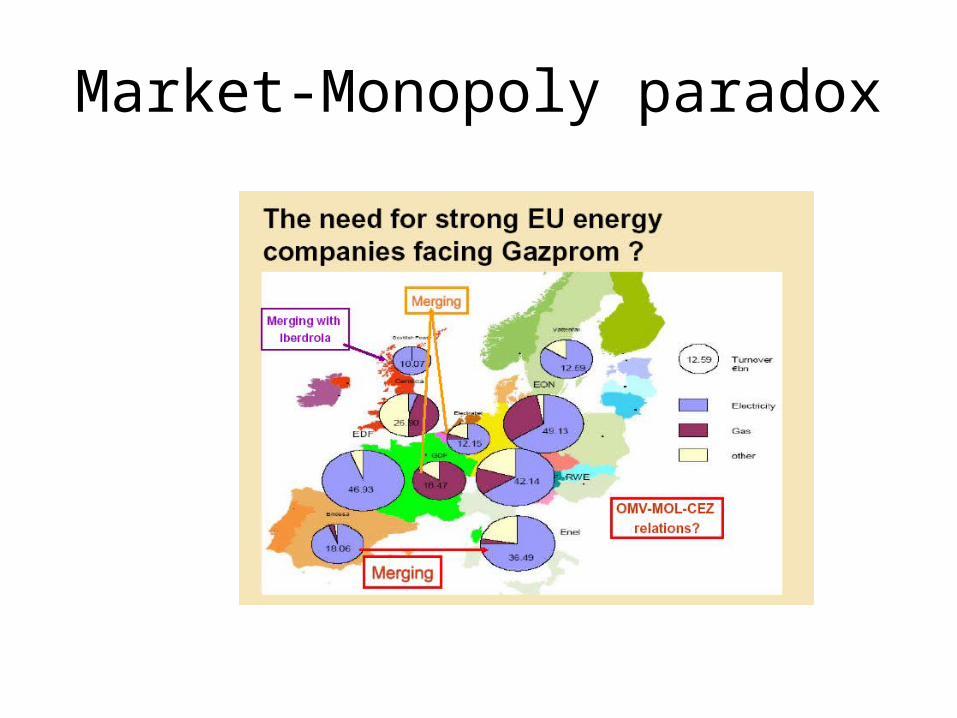
Market-Monopoly paradox

New Technologies – real options

How to reduce CO2 without more gas consumption?

Nuclear Power in the World
-5
0
5
10
15
20
25
30
35
40
45
1966
1968
1970
1972
1974
1976
1978
1980
1982
1984
1986
1988
1990
1992
1994
1996
1998
2000
2002
2004
Inc
rem
en
tal n
uc
lea
r p
ow
er
ca
pa
cit
y
ad
dit
ion
s in
GW
e
-300
0
300
600
900
1,200
1,500
1,800
2,100
2,400
2,700
To
tal n
uc
lea
r p
ow
er
ge
ne
rati
on
in T
Wh

Nuclear power in electricity generation
0
10
20
30
40
50
60
70
80
FRANCE
LITH
UANIA
SLOVAKIA
BELGIU
M
SWEDEN
UKRAINE
BULGARIA
SWIT
ZERLA
ND
SLOVENIA
ARMENIA
S. KOREA
HUNGARY
GERMANY
CZECH R
EP
JAPAN
FINLA
ND
SPAIN
TAIW
ANUSA
UK
RUSSIA
CANADA
ROMANIA
ARGENTINA
S. AFR
ICA
MEXIC
O
NETHERLA
NDS
BRAZIL
INDIA
PAKISTAN
CHINA
Pe
rce
nta
ge
of
ele
ctr
icit
y f
rom
nu
cle
ar
po
we
r

Should we begin to ‘Think Big’ ?

Have we got enough time ?

Conclusions
• EU energy strategy should be viewed at continental level
• Environmental measures should include technologies not only markets
• North-South view may shed new solutions in the East of the EU
• Global corporate strategy needed for energy companies
• Development within 3 x 20%: mobilizing local domain objectives without a global view

The road ahead for EU energy
Be it that you live interesting times (Chinese curse)