EU Budget 2018
92
Budget EU Budget 2018 FINANCIAL REPORT
Transcript of EU Budget 2018

EU Budget 2018 - Financial Report
BudgetBudget
EU Budget 2018 FINANCIAL REPORT

Printed by the Publications Offi ce of the European Union in Luxembourg
The European Commission is not liable for any consequence stemming from the reuse of this publication.
Luxembourg: Publications Offi ce of the European Union, 2019
© European Union, 2019 Reuse is authorised provided the source is acknowledged. The reuse policy of European Commission documents is regulated by Decision 2011/833/EU (OJ L 330, 14.12.2011, p. 39).For any use or reproduction of photos or other material that is not under the copyright of the European Union, permission must be sought directly from the copyright holders.
Print ISSN 1830-7280 ISBN 978-92-76-03078-2 doi:10.2761/081551 KV-AI-19-001-EN-C PDF ISSN 2443-7891 ISBN 978-92-76-03079-9 doi:10.2761/027405 KV-AI-19-001-EN-N

EU Budget 2018Financial Report


3
Contents
Foreword ��������������������������������������������������������������������������������������������������������������������������������������������������������5
What did the EU budget achieve in 2018? �������������������������������������������������������������������������������������7
SECTION I — 2018 EU BUDGET ��������������������������������������������������������������������������������������������������������11Key features of the EU budget �������������������������������������������������������������������������������������������������������������������������������������������� 12How is the EU budget adopted?������������������������������������������������������������������������������������������������������������������������������������������ 20How is the EU budget managed? ��������������������������������������������������������������������������������������������������������������������������������������� 23How is the EU budget controlled? �������������������������������������������������������������������������������������������������������������������������������������� 28The EU accountability cycle �������������������������������������������������������������������������������������������������������������������������������������������������� 31
SECTION II — REVENUE �����������������������������������������������������������������������������������������������������������������������33What are the own resources? ����������������������������������������������������������������������������������������������������������������������������������������������� 35What are the other sources of revenue? ������������������������������������������������������������������������������������������������������������������������ 37What are the current options for reforming the own-resources system? ������������������������������������������������������ 38
SECTION III — TREASURY MANAGEMENT �������������������������������������������������������������������������������������43Treasury flows ������������������������������������������������������������������������������������������������������������������������������������������������������������������������������ 45
SECTION IV — EXPENDITURE �������������������������������������������������������������������������������������������������������������47What was the EU’s expenditure for 2018 by Member State?������������������������������������������������������������������������������ 48Competitiveness for growth and jobs ������������������������������������������������������������������������������������������������������������������������������ 51Economic, social and territorial cohesion ����������������������������������������������������������������������������������������������������������������������� 53Sustainable growth: natural resources ���������������������������������������������������������������������������������������������������������������������������� 55Security and citizenship ���������������������������������������������������������������������������������������������������������������������������������������������������������� 57Global Europe ������������������������������������������������������������������������������������������������������������������������������������������������������������������������������� 59Administration ������������������������������������������������������������������������������������������������������������������������������������������������������������������������������ 61
SECTION V — ANNEXES �����������������������������������������������������������������������������������������������������������������������63Annex 1� 2007-2013 and 2014-2020 financial frameworks ����������������������������������������������������������������������������� 64Annex 2� 2018 expenditure and revenue by programme, heading, type of source and
Member State ���������������������������������������������������������������������������������������������������������������������������������������������������������� 66Annex 3� Operating budgetary balances ������������������������������������������������������������������������������������������������������������������������ 72Annex 4� Recoveries and financial corrections������������������������������������������������������������������������������������������������������������� 76Annex 5� Borrowing and lending activities ��������������������������������������������������������������������������������������������������������������������� 79Annex 6� Glossary ����������������������������������������������������������������������������������������������������������������������������������������������������������������������� 83

List of country codes
Member State Code
Belgium BE
Bulgaria BG
Czechia CZ
Denmark DK
Germany DE
Estonia EE
Ireland IE
Greece EL
Spain ES
France FR
Croatia HR
Italy IT
Cyprus CY
Latvia LV
Member State Code
Lithuania LT
Luxembourg LU
Hungary HU
Malta MT
Netherlands NL
Austria AT
Poland PL
Portugal PT
Romania RO
Slovenia SI
Slovakia SK
Finland FI
Sweden SE
United Kingdom UK

5
Foreword
Foreword
Günther H� Oettinger, Commissioner for Budget
and Human Resources, European Commission
The 2018 financial report of the European Union provides an overview of EU funding during that year and recalls key features of the EU budget� In June 2019 EU citizens demonstrated their growing interest in the future of Europe by voting in the European Parliament elections� For the first time in many years participation increased, and more than 50 % of the voting population expressed their preferences� The elections showed, however, the importance of explaining better what the EU is doing and what it delivers� This applies in particular to the EU budget�
The EU budget allows the Union to make a big difference for millions of EU citizens by translating commonly agreed political ambitions into tangible results on the ground� 2018 was the fifth year of implementation of the current multiannual financial framework� One important priority was to provide a European response to the new challenges, from migration management to the protection of the EU’s external borders and the security of its citizens, and to simultaneously guarantee strategic investment and sustainable growth, to support economic cohesion and to create jobs, in particular for young people�
The implementation of the EU budget in 2018 totalled EUR 173�1 billion in commitment appropriations and EUR 156�7 billion in payment appropriations� Nearly half of the funds (EUR 87�4 billion in commitments) were aimed at stimulating growth, employment and competitiveness� The European Fund for Strategic Investments, the Connecting Europe Facility and the European Structural and Investment Funds all had a major role to play� I invite you to discover the stories behind many EU investments on the InvestEU portal (https://europa�eu/investeu)�
The EU budget also offered strong support in other priority areas such as the EU’s comprehensive approach to migration, the security union, cutting-edge research, the EU’s external action and achieving cross-cutting policy objectives such as climate action and biodiversity� In 2018 the amount allocated to climate mainstreaming was more than EUR 32 billion, 20 % of the total budget�

6
EU budget 2018 — Financial report
2018 was also a year for looking ahead� The Commission made its proposals for the next multiannual financial framework (2021-2027) in May and June of that year following an extensive spending review (1) analysing the performance of all programmes� The Commission has proposed a modern budget for a Union that protects, empowers and defends, and a budget that is balanced and realistic�
Agreeing on the future budget in a timely fashion will be important to empower the incoming Commission of Ursula von der Leyen to deliver added value for all EU citizens�
(1) https://eur-lex�europa�eu/legal-content/EN/TXT/PDF/?uri=CELEX:52018SC0171&from=EN

7
What did the EU budget achieve in 2018?
2018 was the fifth year of implementation of the current multiannual financial framework� It delivered results in a number of important areas, from investment and innovation to tackling climate change, supporting young Europeans and addressing migration and security (2)�
Boosting investment and therefore growth and jobs
The European Fund for Strategic Investments was extended from mid 2018 until the end of 2020 with a new investment target of EUR 500 billion� It is expected that this plan will help create an estimated 1�4 million new jobs by 2020, while the EU’s gross domestic product will be boosted by an estimated 1�3 %� Thanks to these investments 30 million Europeans benefit from better healthcare�
The Connecting Europe Facility (transport) partially funded a new tunnel under the 18 km-wide Fehmarn Strait, between Rødby in Denmark and Puttgarden in Germany� Travel time between Copenhagen and Hamburg will be reduced by around 1 hour for cars, and by 2 hours for rail freight transport�
Supporting innovation
Using Horizon 2020 funding, the Joint Research Centre has developed and is operating the only worldwide automatic tsunami alert system� It can quickly calculate the estimated wave height and travel time and automatically send an alert message through the Global Disaster Alert and Coordination System�
Supporting young Europeans
Between July and October 2018 around 15 000 young people were able to explore Europe by rail with a DiscoverEU travel pass� During the year around 800 000 people were learning, working or volunteering abroad thanks to funding from Erasmus+� Since 2014 more than 3�5 million young people have received an offer of employment, education, a traineeship or an apprenticeship each year thanks to the youth employment initiative�
Stimulating job creation and sustainable growth via the cohesion policy
Since 2014, EU investment in transport, with the goal of removing bottlenecks, has helped to repair or improve 7 500 km of old roads and financed the building of 3 100 km of new roads�
(2) The information in this section is taken from the 2018 integrated financial and accountability package�
© bernardbodo
What did the EU budget achieve in 2018?

8
EU budget 2018 — Financial report
The European Social Fund supported 1�1 million small and medium-sized enterprises (SMEs), leading directly to the creation of 420 000 new jobs by 2020 and helping more than 7�4 million unemployed people find a job and over 8�9 million people gain new qualifications�
Helping to ensure safe, high-quality food
Since 2014 the European Agricultural Fund for Rural Development has helped modernise the agricultural holdings of more than 51 400 young farmers, helped train more than 1 million participants, supported organic farming on close to 16 million hectares and invested over EUR 255 million in renewable energy production�
Achieving cross-cutting objectives: climate action and biodiversity
The EU budget is also an important tool for achieving cross-cutting policy objectives such as climate action and biodiversity� In 2018 the amount allocated to climate action was more than EUR 32 billion, or 20�7 % of the total budget, while the total cumulative amount (2014-2018) was more than EUR 141 billion by the end of the year�
In 2018 a total of EUR 552 million went to the LIFE programme� Through it the EU budget supports environmental and nature-conservation projects and climate action, including major investment in projects that enable more plastic to be reused�
About 690 project applications for traditional projects financed under LIFE focusing on climate action objectives were received during the first 5 years of programme implementation, and about 133 projects were co-financed following the first four calls for proposals (2014, 2015, 2016 and 2017)�
Considering that the average duration of traditional LIFE projects is 4-5 years, very few projects were finalised in 2018, thus making it difficult to assess results at this early stage� The ongoing projects are contributing to the shift towards a resource-efficient, low-carbon and climate-resilient economy, and to the protection of the environment, including biodiversity and Natura 2000, by, among other things:
• improving the conservation status of 186 wildlife species and 106 different habitats within an area the size of Poland;
• reducing CO2 emissions by about 13 million tonnes per year, an amount comparable to the CO2 emissions by Lithuania in 2015;
• reducing energy consumption by about 1 000 000 MWh per year, which represents the average annual electricity consumption of about 280 000 homes;
• reducing the amount of waste that is not appropriately managed by around 1 million tonnes per year, corresponding approximately to the total municipal waste produced by Slovenia in 2016�
© ipopba —
Fotolia

9
What did the EU budget achieve in 2018?
Between 2014 and 2020 the European Regional Development Fund and Cohesion Fund plan to invest EUR 57�3 billion into climate-related goals� The investments are supporting the shift towards a low-carbon economy, for example with projects enabling the renovation of housing for 875 000 families who will benefit from reduced energy use and connecting 3�3 million additional energy users to smart grids� Projects are also supporting additional renewable-energy production capacity (7 670 MW)�
Providing an essential contribution to migration policy
In 2018, by providing extra emergency assistance to Greece, blankets, winter jackets and other winter supply kits were provided at reception facilities� Police personnel could also be paid from this emergency assistance, to increase the security of migrants and staff�
Operations run by the European Border and Coast Guard Agency have helped rescue 690 000 people at sea since 2015�
Thanks to the EU Facility for Refugees in Turkey, 136 new schools have been built, 410 000 refugee children are now attending school and 60 000 students have joined catch-up classes� In addition, 178 healthcare centres are now operational and 650 000 child refugees were vaccinated between January 2016 and December 2018�
Making the EU a safer place to live and work
In 2018 the largest EU civil protection operation yet helped Sweden to fight forest fires: over 360 firefighting personnel, seven planes, six helicopters and 67 vehicles were mobilised� The Connecting Europe Facility (telecommunications) set up a voluntary cooperation platform to strengthen preparedness for and the response to cyberattacks� By doing so the EU is contributing to an EU-wide solution to a threat that does not respect national borders�
Acting as a strong global player
In 2018 more than EUR 1�4 billion was spent on humanitarian aid in more than 90 countries, with a significant part being spent on supporting conflict-affected populations in Syria and refugees in neighbouring countries�
© ipopba —
Fotolia


2018 EU BUDGETSECTION I

12
EU budget 2018 — Financial report
Key features of the EU budget
Unlike national budgets, the EU budget is an investment budget: it does not fund social protection, primary education or national defence, but invests in the key areas that provide added European value by boosting growth and competitiveness� It intervenes only when it is more effective to spend money at a global level than at a local, regional or national level� The EU budget is always balanced: it can neither run a deficit nor borrow money�
When talking about the EU budget one must bear in mind the difference between a long-term budget and an annual budget�
• Long-term budget� As the EU budget is mainly an investment budget it needs to be decided on a long-term basis to ensure stability� The long-term budget is also called the multiannual financial framework (MFF)�
• Annual budget� Each annual budget is adopted within the limits of the MFF and usually remains below the MFF expenditure ceilings to guarantee flexibility� MFF ceilings can be compared to credit-card limits for a period of 1 year�
How does the long-term EU budget work?Since 1988 EU leaders have agreed on long-term spending plans — now known as MFFs — that provide a stable basis for the appropriate planning and implementation of programmes over a period of at least 5, and usually 7, years� The MFF allows the EU to fund policies with added European value�
The long-term EU budget is limited by ceilings
The MFF lays down the maximum annual amounts (ceilings) the EU may spend under different categories of expenditure (headings)�
These ceilings set limits for each of the 7 years�
• For commitment appropriations for each heading: pledges to provide funding for the future year�
• For payment appropriations: actual money to be paid to its various recipients for pledges made during the year or in the past�
The total annual ceilings are expressed in absolute amounts (in millions of euros) and as a percentage of EU gross national income (GNI)� The latter is updated annually on the basis of the latest available GNI forecasts in order to control the respect of maximum percentages fixed for both commitments and payments�

13
SECTION I — 2018 EU BUDGET
Competitiveness for growth and jobsEUR 142.1
Education EnergyIndustry and small and medium enterprisesNetworks and technology Research and inn
Law-makingInstitutions’ cost and staff
ovation TransportOthers
Economic, social and territorial cohesionEUR 371.4
Research and innovationInformation and communications technology Small and medium enterprisesLow-carbon economy Climate change and riskEnvironment and resource e ciencyTransport and energyEmployment Social inclusion Vocational trainingOther
Sustainable growth: natural resourcesEUR 420
AgricultureRural developmentFisheriesEnvironment and others
Security and citizenshipEUR 17.7
Migration and home a airs Health and food safety CultureJustice Others
AdministrationEUR 69.6
EUR 1 087
39 %
34 %6 %
6 %
13 %
2 %
Global EuropeEUR 66.3
Development and international cooperation Humanitarian aidNeighbourhood and enlargement Foreign policy instruments Others
EU budget 2014-2020In billion EUR and in percentage, current prices
The long-term EU budget sets up priorities for the European Unionfor 7 years
For the 2014-2020 period the MFF enables the European Union to spend up to EUR 1 087 billion in commitments and EUR 1 026 billion in payments (in current prices)�
The EU’s expenditure for 2014-2020 is divided into five broad categories, or ‘headings’� Only a small proportion (around 6 %) is dedicated to ‘Administration’, i�e� the costs of the EU’s staff and headquarters� The categories of spending and the respective ceilings for EU spending (commitments) are shown below�
The 2014–2020 MFF brought in a whole set of new programmes that cover the EU’s political priorities for this period: research and innovation (Horizon 2020), connecting together the transport, energy and IT infrastructure of all Member States (Connecting Europe Facility), education (Erasmus+), job opportunities for young people (youth employment initiative) and the competitiveness of SMEs (COSME), to name just a few�
Note: Commitments adjusted for 2018 and following years�Source: European Commission

14
EU budget 2018 — Financial report
FLEXIBILITYFLEXIBILITY
Between headings andyear but within the ceilings
Over and abovethe ceilings Flexibility Instrument
Solidarity instruments:Emergency Aid Reserve European Union Solidarity FundEuropean Globalisation Adjustment Fund
Global margin for payments
Contingency margin
Global margin for commitments
The long-term EU budget allows flexibility
The MFF provides for some flexibility to mobilise the funds necessary to react to unforeseen events� Taking into account past experience, the scope for intervention for some special instruments, such as the Emergency Aid Reserve, has been broadened, the maximum allocation has been increased and the carrying over of unused amounts to the following year(s) has been allowed under the 2014-2020 MFF�
For new initiatives/priorities within the MFF that were not provided for (between headings and years, but within the ceilings)
• Global margin for commitments� The transfer of commitment margins from the previous year�
• Global margin for payments� The transfer of payment margins from the previous year, together with underspending from the previous year�
• Contingency margin� The use of commitment or payment margins from current/future years across headings for new initiatives� This is a last-resort instrument to react to unforeseen circumstances and amounts to 0�03 % of the EU’s GNI�
To bring aid/solidarity in case of unforeseen events (over and above ceilings)
• Flexibility Instrument� An envelope of EUR 600 million per year for expenses that cannot be covered by the EU budget without exceeding the ceilings� The Flexibility Instrument has been mobilised frequently during the MFF, mainly to finance immediate budgetary measures to address the challenges of migration and security threats�
• Solidarity instruments�
– The Emergency Aid Reserve for humanitarian, civilian crisis management and protection operations in non-EU countries� For example, it was mobilised in 2017 and 2018 to provide funding for healthcare, nutrition and food security, sanitation and water in Rohingya refugee camps in Bangladesh�
– The EU Solidarity Fund to release emergency financial aid following a major disaster in a Member State or candidate country, such as forest fires in Spain and Portugal and floods in Lithuania in 2018�
– The European Globalisation Adjustment Fund to help workers reintegrate into the labour market after they have been made redundant� In 2018, EUR 4�5 million from the fund helped 730 displaced workers in the Portuguese clothing sector�

15
SECTION I — 2018 EU BUDGET
2 3 45
H5H4
H3H2
H1bH1a
3 45
H5H4
H3H2
H1bH1a
3 45
H5H4H3
H2H1b
H1a
Global margin for commitments
Global margin for payments
Contingency margin(last resort)
YEAR03
YEAR05
YEAR06
YEAR07
YEAR02
YEAR04
fixed ceiling
budget
GMC
GMP
margin
transfer of unused commitment margins from the past
new initiative/priority
€€€€€€€€€€€€
transfer commitment or payment margins for the current or the future year for new initiatives
(either short or long term)
compensation
YEAR03
YEAR05
YEAR06
YEAR07
YEAR02
YEAR01
YEAR01
YEAR04
transfer unspent payments from the past
€€ €€ €€ €€ €€ €€
YEAR03
YEAR05
YEAR06
YEAR07
YEAR02
YEAR04
€€€€€€€€€€€€
fixed ceiling
fixed ceiling
€€
margin
budget
marginunderspending
budget
YEAR01
fixed ceiling
margin
budget
YEAR01
Source: European Commission, DG Budget�
MARGINS

16
EU budget 2018 — Financial report
The long-term EU budget can be revised
The MFF can be revised in the event of unforeseen circumstances� The framework may also be revised if new rules or programmes managed by Member States (mainly in the areas of cohesion and agricultural policy) are implemented after the adoption of a specific MFF�
As a result of the agreement on relevant legal acts in 2014, during the first year of the current MFF, a significant number of programmes could not be adopted� Therefore, EUR 21 billion had to be transferred to 2015, 2016 and 2017 by means of a revision of the MFF (3)� In total, EUR 4�5 billion was transferred to 2016, of which EUR 4�3 billion came under Heading 2 ‘Sustainable growth: natural resources’ and EUR 0�2 billion came under Heading 3 ‘Security and citizenship’, and EUR 107�5 million was transferred to 2017, of which EUR 43�5 million came under Heading 1b ‘Economic, social and territorial cohesion’ and EUR 64 million came under Heading 3 ‘Security and citizenship’�
Midterm review
During its midterm review the EU revised the MFF for 2014-2020 to meet new priorities� Following the agreement by the Council and the consent of the European Parliament the new MFF regulation entered into force on 14 July 2017�
The revised MFF increased the resources assigned for the EU’s main priorities by EUR 6 billion for the years 2017-2020� The European Union can now devote more resources to help boost jobs and growth and to address the migration crisis� It has also strengthened its capacity to react to unexpected events�
Technical adjustment
For the 2014-2020 MFF a fixed deflator of 2 % per year was applied for the whole period to express the ceilings in current prices�
The European Commission makes a technical adjustment to the MFF each year to take account of the changes in EU GNI based on the latest available economic forecasts�
The technical adjustment for 2018 was published in September 2017� The technical adjustment for 2019 was published in May 2018�
What will the next long-term EU budget be about?
The next MFF will run from 2021 until 2027, and is designed to ensure an EU that empowers, protects and defends� In May 2018 the Commission made its proposal for the next long-term EU budget�
(3) Council Regulation (EU, Euratom) 2015/623 of 21 April 2015 amending Regulation (EU, Euratom) No 1311/2013 laying down the multiannual financial framework for the years 2014-2020 (OJ L 103, 22�4�2015, p� 1)�

17
SECTION I — 2018 EU BUDGET
To tackle the foreseen and unforeseen global challenges the EU budget needs to have means commensurate to its ambitions� The Commission proposed to increase the funding for research, youth, climate action, migration and borders, security and external actions� These sectors are key to helping Europe remain a global leader for a sustainable and green future and contribute to making the world safer through development assistance and humanitarian aid�
Single market, innovation and digital
EUR 27.5
EUR 123
EUR 378.9
EUR 85.3
EUR 34.9
EUR 442.4
EUR 1 279.4
Research and innovationEuropean strategic investments
Single marketSpace
Cohesion and valuesRegional development
and cohesionEconomic and monetary union
Investing in people, social cohesion and values
Natural resources and environment
Agriculture and maritime policyEnvironment and climate action
EUR 187.4
Migration and border managementMigrationBorder management
Security and defenceSecurityDefenceCrisis response
Neighbourhood and the world
European public administrationEuropean public administration
Source: European Commission, MFF package proposed by the Commission, May 2018�
Single market, innovation and digital
Migration and border management
Cohesion and values
Security and defence
Natural resources and environment
Neighbourhood and the world
Research, innovation and digital
Increase under the new long-term EU budget
Strengthened support for political priorities under the new long-term budget
x 1.6
x 1.3
Combined increase = + EUR 109 billion
25 % of the multiannual financial framework 2021-2027, EU-27 = EUR 320 billion
20 % of multiannual financial framework 2014-2020, EU-28 = EUR 206 billion
x 1.7
x 1.6
x 2.2
x 2.6
x 1.8
Youth
LIFE climate and environment
Migration and borders
Security
External action
Climate mainstreamingcontributing to climate objectives
Combined increase = + EUR 114 billion
Contributing to EU added value
EU budget 2021-2027 In billion EUR and in percentage, current prices
NB: Compared to the 2014-2020 MFF in the EU-27, including the European Development Fund�Source: European Commission, MFF package proposed by the Commission, May 2018�

18
EU budget 2018 — Financial report
The Commission proposed to have a more modern, simple and flexible budget�
• Modern� The Commission proposed to further cut red tape for beneficiaries and managing authorities by making rules more coherent on the basis of a single rulebook� This also means setting clearer objectives and focusing more on performance�
• Simple� The structure of the budget should be clearer and more closely aligned with the EU’s priorities� The Commission proposed to streamline the number of programmes by reducing the number of them by more than a third (from 58 currently to 37 in the future), bringing funding sources together and radically streamlining the use of financial instruments�
• Flexible� The Commission’s proposal included increased flexibility within and between programmes to better manage crises, tackle unforeseen events and respond to emergencies in areas such as security and migration�
In the meantime the Commission proposed to put in place a new mechanism to protect the EU budget from financial risks linked to generalised deficiencies regarding the rule of law in the Member States� This would allow the EU to suspend, reduce or restrict access to funding in a manner proportionate to the nature, gravity and scope of the rule-of-law deficiencies� Such a decision would be proposed by the Commission and adopted by the Council through reverse qualified-majority voting�
How does the annual budget work?Every year the Commission prepares a draft EU budget in accordance with the priorities of the EU leaders for the coming year�
The annual budget is usually below the MFF ceilings, and cannot exceed them (as absolute amounts or as percentages of GNI), in order to provide for some margin to cope with unforeseen needs, except where special instruments are used over and above annual ceilings�
Key features of the adopted budget in 2018
The adopted budget reflects the priorities set up by the long-term budget�
Making our economy stronger
In 2018 nearly half of the funds — EUR 77�5 billion in commitments — were dedicated to making our economy stronger, our universities more competitive and our companies better equipped to compete in the global market place� EUR 354 million was provided to support SMEs (COSME programme) and EUR 11�2 billion went to Horizon 2020 (the EU’s research and innovation funding programme)� A total of EUR 55�5 billion went towards boosting growth, creating jobs and fostering convergence in all Member States and regions via the European Structural and Investment Funds�
More money for young people
Young people got more support and better opportunities to find jobs thanks to EUR 350 million for the youth employment initiative, a key action that sought to address the challenge of youth unemployment in the Member States�

19
SECTION I — 2018 EU BUDGET
Agriculture
Support for EU farmers amounted to EUR 59 billion�
Flexibility of the annual budget
The annual budget also takes into account the economic and political context, which was sometimes not foreseen at the moment the long-term budget was adopted�
Juncker plan
For instance, EUR 2 billion was allocated in 2018 to the European Fund for Strategic Investments, the core of the Juncker plan, which was decided upon at the beginning of the MFF to make the EU more competitive�
Defence
Further to the launch of the European Defence Fund, which was decided upon after the adoption of the current long-term budget, EUR 40 million from the 2018 adopted budget was budgeted to fund collaborative research in innovative defence technologies and products� With EUR 25 million already allocated in 2017, the total EU budget devoted to defence research until 2019 amounted to EUR 90 million�
Tackling migration
Since 2015 Europe has faced the biggest migration crisis since the Second World War� To react to this unforeseen crisis nearly EUR 4�1 billion of the 2018 adopted budget was dedicated to managing migration and tackling security challenges� With the bulk of funding already frontloaded, the total for these policy areas amounted to EUR 22 billion between 2015 and 2018�

20
EU budget 2018 — Financial report
How is the EU budget adopted?
The long-term budget must be adopted on the basis of unanimity by the Member States after obtaining the consent of the European Parliament� The current long-term budget was adopted for the 2014-2020 period�
For the annual budget the procedure is a little bit different� Every year the Parliament and the EU Member States agree on what proportion of the 7-year budget will be spent over the following 12 months� They also decide on where the money will go� This procedure takes into account the positions of the institutions that represent the EU citizens and the Member States, and involves the following steps�
1� The European Commission proposes a draft annual budget�2� The draft budget must be approved by the national governments in the Council of the
European Union and then by the European Parliament, which is elected by EU citizens�3� Both the Parliament and the Council can amend the draft�4� The final version is approved both by a simple majority in the Parliament and by
a qualified majority in the Council (55 % of Member States, representing at least 65 % of the EU population)�
When the Parliament and the Council do not manage to agree on a common text they engage in a negotiation process known as the ‘conciliation procedure’, which lasts 21 days�
Annual budgetary procedure
European Commission proposes
European Parliament (EP) approves EP amends
BUDGET ADOPTED
BUDGET ADOPTED
Council disagrees
CONCILIATION 21 days
Joint text
Council accepts
Drast budget New proposal BUDGET REJECTED
Council’s position Council approves, EP rejects
Council and EP rejectNo joint text
Source: European Commission, DG Budget�

21
SECTION I — 2018 EU BUDGET
Main steps in the adoption of the 2018 EU budget
The Commission’s draft budget
On 30 May 2017 the Commission proposed a 2018 EU budget focused on jobs, investment, migration and security amounting to EUR 161 billion in commitments (up 1�4 % from 2017) and EUR 145 billion in payments (up 8�1 % from 2017, due to the 2014-2020 EU structural and investment programmes reaching cruising speed in 2018 after a slow start in their first years)�
Amending letter
In October 2017 the Commission presented amending letter No 1/2018�
This letter notably covered the following�
• The updating of the estimated needs, assigned revenue and appropriations for agricultural expenditure (a decrease in commitment and payment appropriations of EUR 53�9 million for the European Agricultural Guarantee Fund)�
• The decrease in the appropriations entered in reserve for the European Union Solidarity Fund to take into account the frontloading decided upon by the Parliament and the Council in the decision to mobilise funds for Italy following earthquakes that took place between August 2016 and January 2017 in the regions of Abruzzo, Lazio, Marche and Umbria�
The positions of the Parliament and the Council
The Council formally adopted its position on 4 September 2017, while the Parliament adopted its position in its plenary session on 25 October 2017� Differences between the positions of the Parliament and the Council were addressed in a conciliation procedure� In 2018 the 21-day conciliation procedure ran from 31 October to 20 November�
Adopted budget
An agreement was reached on 18 November 2017, and the 2018 EU budget was adopted by both the Parliament and the Council on 30 November�
In the 2018 adopted budget the overall level of commitment appropriations was set at EUR 160�1 billion� The overall level of payment appropriations was set at EUR 144�7 billion�

22
EU budget 2018 — Financial report
From the draft budget to the agreed initial budget for 2018 (million EUR)
Commitments million EUR
MFF Description Final budget 2017
MFF ceiling
Draft budget
Council’s position
EP’s position
Adopted budget 2018
Difference
1 2 3 4 5 9 (9)/(1) = (10)
1a Competitiveness for growth and jobs 21 312 21 239 21 846 21 091 23 236 22 001 3.2 %Margin 52 806 – 1 339
1b Economic, social and territorial cohesion 54 087 55 181 55 408 55 408 55 783 55 532 2.7 %
Margin (after the use of flexibility instrument)
6 6 – 368
2 Sustainable growth: natural resources 58 569 60 267 59 500 59 279 59 647 59 285 1.2 %
Margin 767 988 620 982
3 Security and citizenship 4 284 2 656 3 473 3 442 3 595 3 493 – 18.5 %
Margin – 121
4 Global Europe 10 437 9 825 9 588 9 503 9 825 9 569 – 8.3 %
Margin 237 322 0 256
5 Administration 9 395 10 346 9 687 9 627 9 716 9 666 2.9 %
Margin 89 149 60 362
Total commitment appropriations 158 084 159 514 159 502 158 350 161 801 159 547 0.9 %
Margin 1 151 2 272 – 1 148 1 600
Special instruments 1 748 797 567 797 567 – 67.6 %
GRAND TOTAL 159 831 160 299 158 917 162 598 160 114 0.2 %
Final budget 2017, without carry-over� Administration comprises expenditure of all EU insititutions�Draft budget: includes amending letter No 1/2018
The adopted commitment appropriations represented 1�02% of GNI�
Payments million EUR
MFF Description Final budget 2017
Draft budget
Council’s position
EP’s position
Adopted budget 2018
Difference
1 3 4 5 9 (9)/(1) = (10)
1a Competitiveness for growth and jobs 19 321 20 087 19 892 20 794 20 097 4.0 %
1b Economic. social and territorial cohesion 30 073 46 763 46 523 47 001 46 527 54.7 %
2 Sustainable growth: natural resources 54 121 56 306 56 089 56 435 56 084 3.6 %
3 Security and citizenship 3 224 2 964 2 944 3 046 2 981 – 7.6 %
4 Global Europe 9 056 8 946 8 931 9 100 8 906 – 1.7 %
5 Administration 9 395 9 690 9 630 9 717 9 666 2.9 %
Total payments appropriations 125 190 144 756 144 010 146 092 144 261 15.2 %
Margin (after the use of flexibility instrument) 10 476 10 555 9 140 10 982
Special instruments 1 581 508 420 620 420 – 73.5 %
GRAND TOTAL 126 771 145 264 144 430 146 712 144 681 14.1 %
Final budget 2017, without carry-over� Administration comprises expenditure of all EU insititutions�Draft budget: includes amending letter No 1/2018
The adopted payment appropriations represented 0�92% of GNI�

23
SECTION I — 2018 EU BUDGET
How is the EU budget managed?
What are the changes affecting the EU budget every year?Once a new year has started some ‘operations’ may affect the budget�
• Carry-overs are amounts from the previous year’s budget that have not been used and that are therefore carried over to the current financial year� For certain types of appropriations this carry-over is automatic; others require a decision from the Commission� In 2018 this decision was made on 7 February 2018�
• Transfers between budget items are by definition neutral in their effect on the overall budget� They may increase the amount of appropriations available in operational budget lines when reserves are released� Decisions relating to transfers are generally made by the Parliament and the Council, but institutions are allowed to carry out internal transfers under specified conditions�
• Amending budgets take into account political, economic or administrative needs that could not have been foreseen at the point at which the budget was prepared and adopted� They may also ensure more precise and economical financing of the EU budget by the Member States� Six amending budgets were adopted in 2018 (see table on next page)�
• Assigned revenue includes appropriations corresponding to the following�
– Contributions received from countries that are not EU Member States (countries that are members of the European Free Trade Association (EFTA (4)), part of the European Economic Area (EEA) (5), candidate countries or non-EU countries)� These countries contribute to certain programmes and, in exchange, may participate in them�
– Amounts recovered from Member States, international institutions or private entities and reassigned to the programmes to which they were initially allocated or to specific actions managed by the EU�
(4) EFTA is an intergovernmental trade organisation and free trade area consisting of four European states: Iceland, Liechtenstein, Norway and Switzerland�
(5) The EEA, established in 1992, is an international agreement that enables the extension of the European Union’s single market to three EFTA states (Iceland, Liechtenstein and Norway)�
CHANGES AFFECTING THE BUDGET EVERY YEAR
Assigned revenueRevenue coming from outside the EU(EFTA-EEA, candidate countries, non-EU countries, others)+ recoveries
Amending budgetComplementing/reducing annual budgetsHave to be adopted following the same process as annual budget(aster Parliament and Council approval)
TransfersTransfers between budget items
PASTYEAR
CURRENTYEAR
€ €
Carry-overAmount not used for the previous budget added to this year’s budget
Changes affecting the budget every year
Source: European Commission, DG Budget�

24
EU budget 2018 — Financial report
Summary table of amending budgets in 2018 (million EUR)
Amending budgets
Main subject Official Journal Impact on commitment
appropriations
Impact on payment
appropriations
1/2018 Mobilisation of the European Union Solidarity Fund relating to earthquakes in Greece, hurricanes in Saint Martin and Guadeloupe in France and forest fires in Portugal and Spain in 2017.
OJ L 191, 27.7.2018
97.65 97.65
2/2018 Surplus 2017. OJ L 213, 22.8.2018
3/2018 Amendment of the Commission decision on the EU Facility for Refugees in Turkey to allocate an additional EUR 3 billion (a ‘second tranche’) to the facility over the 2018-2019 period.
OJ L 213, 22.8.2018
500.00 0.00
4/2018 Mobilisation of the European Union Solidarity Fund relating to floods in Bulgaria and Lithuania, earthquakes in Greece and exceptionally violent storms and heavy rainfall in Poland in 2017.
OJ L 266, 24.10.2018
33.99 33.99
5/2018 • Cancellation of the reserve related to support for Turkey from the Instrument for Pre-Accession Assistance (IPA II).
• Reinforcement of the European Neighbourhood Instrument (ENI) to fund additional actions linked to the Central Mediterranean migratory route.
• Reinforcement of humanitarian aid.
OJ L 289, 16.11.2018
0.00 0.00
6/2018 Update of the expenditure and revenue sides of the budget.• Expenditure side: need for more resources for Headings 1a
‘Competitiveness for growth and jobs’ and 2 ‘Sustainable growth — natural resources’.
• Revenue side: revised forecast of own resources and budgeting of the relevant UK corrections and their financing.
OJ L 52, 22.2.2019
– 48.67 – 44.70
TOTAL 582.97 86.94

25
SECTION I — 2018 EU BUDGET
Changes in payment appropriations by heading in 2018 (million EUR)
Payment appropriations
MFF heading Budget appropriations Additional appropriations Total appropriations
available
Initial adopted budget
Amending budgets and
transfers
Final adopted budget
Carry-overs
Assigned revenue
7 8 9 = 7 + 8 10 11 12 = 9 + 10 + 11
1 Smart and inclusive growth 66 624 108 66 733 120 14 064 80 917
1a: Competitiveness for growth and jobs
20 097 57 20 155 108 4 811 25 073
1b: Economic, social and territorial cohesion
46 527 51 46 578 13 9 253 55 844
2 Sustainable growth: natural resources
56 084 157 56 241 663 2 744 59 648
of which: Market-related expenditure and direct payments
43 189 (9) 43 180 656 1 601 45 436
3 Security and citizenship 2 981 32 3 013 16 276 3 305
4 Global Europe 8 906 (93) 8 813 315 1 659 10 788
5 Administration 9 666 0 9 667 854 834 11 355
of which: Administrative expenditure of the institutions
4 015 0 4 015 507 441 4 963
6 Compensations 0 0 0 0 0 0
8 Negative reserve and deficit carried over from the previous financial year
0 0 0 0 0 0
9 Special instruments 420 (118) 302 0 38 340
Total 144 681 87 144 768 1 970 19 616 166 353
From an accounting point of view the budget out-turn is, in general terms, the difference between total revenue and total expenditure, with a positive difference thus indicating a surplus� Payments cannot exceed receipts� The voted budget for payment appropriations was subsequently reduced by an amending budget�
Active budget management 2000-2018 (million EUR)The figures include assigned revenue appropriation and implementation�
0
20 000
40 000
60 000
80 000
100 000
120 000
140 000
160 000
180 000
2000 2001 2002 2003 2004 2005 2006 2007 2008 2009 2010 2011 2012 2013 2014 2015 2016 2017 2018
Final budgetImplemented budgetSurplus

26
EU budget 2018 — Financial report
The implementation of the EU budget is framed by the financial regulationThe financial regulation sets out the principles and procedures for implementing the EU budget� Over the last 30 years the number of general financial rules contained in the financial regulation has sharply increased� In addition, many sectoral financial rules have emerged�
A first step towards more coherent and simpler financial rules was achieved in 2012� Recent revisions have aligned the financial regulation with the 2014-2020 MFF (2013 revision) and with the new EU procurement directives (2015 revision)�
However, there was still room for further simplification� Following a Commission initiative in 2016, the Parliament and the Council agreed in December 2017 on a significant reform simplifying the rules under which citizens, non-governmental organisations, SMEs, international organisations and other beneficiaries receive EU funding�
The new financial regulation entered into force on 2 August 2018�
Previous complex rules and procedures that hampered EU funding are now replaced by the following�
The other changes are as follows�
• A single rulebook for budgetary guarantees and financial instruments� In the next MFF, for 2021-2027, a single InvestEU programme will ensure more efficient management and offer a ‘one-stop shop’ for those seeking financing will and facilitate the combination of EU funds and their transfer between management modes�
• The amount of information required to apply for EU funding is decreasing, with extended validity and a ‘single audit’ approach that eliminates duplication of controls and reduces their overall cost�
BEFORE AFTER
a single rule book common rules reduced by half less bureaucracy and a stronger focus on results
Financial regulation Multiannual financial framework | Common provisions regulation | Rules of application | Interpretive notes | Internal rules | Notes | Circulars | Manuals | Internal procedures
Financial regulationMultiannual financial frameworkCommon provisions regulation
GuidelinesInternal rules

27
SECTION I — 2018 EU BUDGET
• More targeted controls and audits allow for better protection of EU funds�
• The fight against fraud is strengthened by ensuring that EU funds are not misused by shell companies or intermediaries established in tax havens�
• The conflict-of-interest rules are now extended to Member States’ authorities that are implementing EU funds� The voluntary disclosure of stakeholders is also envisaged�
This significant reform addresses the main concerns expressed during EU-wide public consultations and delivers on the Commission’s priorities, i�e� to simplify procedures, cut red tape, increase transparency and shift the focus towards achieving results and adding European value� It is a solid basis for preparing the next generation of EU programmes, making sure that every euro from the EU budget delivers maximum added value�
Who manages the EU budget?The EU budget is mainly implemented by the Commission and the Member States�
In 2014-2018:
• 18 % of the EU budget was managed directly by the Commission (its headquarters in Brussels and Luxembourg, and the EU delegations to non-EU countries), along with other EU bodies such as executive agencies;
• 8 % was managed indirectly by other international organisations, decentralised agencies, joint undertakings, national agencies, special EU bodies or non-EU countries;
• 74 % was managed by Member States, in partnership with the Commission and under shared management, in areas such as agriculture, cohesion policy, growth and employment, however the ultimate responsibility for implementing the budget lies with the Commission�
DIRECT MANAGEMENT European Commission, including its delegations and executive agencies
SHARED MANAGEMENT Member States
INDIRECT MANAGEMENT International organisations, decentralised agencies and joint undertakings, national agencies, specialised Union bodies, non-EU countries
18 %
8 %
74 %
BUDGET MANAGEMENT MODES
Source: European Commission, DG Budget�

28
EU budget 2018 — Financial report
How is the EU budget controlled?
The EU is accountable to its citizens, via their representatives in the Parliament and the Council, for the money invested in EU programmes� As a steward of the EU budget the Commission has a duty to report on how it has carried out this responsibility� The annual accounts document is key with regard to this transparency and accountability obligation�
The EU accounts are prepared according to the highest standards, the International Public Sector Accounting Standards, ensuring that the accounts provide relevant, reliable, comparable and understandable financial information for citizens�
Transparent reportingThe annual accounts provide information on the financial position (the balance sheet) of the EU, with detailed explanations of its assets, liabilities, financial commitments and obligations� They also show how the EU budget was implemented during the year�
To clearly present this important information the accounts comprise two main elements:
• consolidated financial statements that show the EU’s assets and liabilities and the revenues and expenses for the period;
• budget implementation reports�
The annual accounts are audited by the EU’s external auditor, the European Court of Auditors, which gives its opinion both in a public report and directly to the Parliament and the Council, thus making the accounts available to citizens� For 12 years in a row the EU has received a clean opinion on the reliability of the accounts�
Efficient financial management and control systemsIn order to maintain the highest standards in financial management the Commission is constantly improving its rules and procedures, organisational fitness and agility� The aim is to further increase efficiency and lower administrative burdens, review the cost of checks/audits (controls) and shorten the time required to provide grants and pay beneficiaries�
The Commission’s persistent efforts, in cooperation with Member States, to improve the financial management of programmes and to keep the error level below 2 % (materiality threshold) have led to declining levels of error over the past several years�
The Commission estimates the levels of error that would remain at the end of the programmes after all corrective mechanisms have been implemented (risk at closure)� This approach reflects the multiannual nature of the programmes and the check/audit cycle, which covers more than just the year of funding and implementation of the projects� For the 2018 expenditure the risk at closure is estimated to be 0�8 % of the expenditure�

29
SECTION I — 2018 EU BUDGET
Protecting the EU budgetThe Commission and the Member States work together to make sure that taxpayers’ money is spent well and in an appropriate manner� There are different types of safeguards in place: preventive and corrective measures�
• Preventive measures� The Commission puts a great deal of emphasis on preventive measures, such as sharing good practices, providing guidance and training and mandatory control and audit structures in Member States, as well as the interruption and suspension of payments� The preventive measures serve as incentives for Member States to reduce irregular payments� Confirmed preventive measures in 2018 amounted to EUR 449 million�
• Corrective measures� The Commission applies corrective mechanisms as a last resort in cases where preventive mechanisms have not been effective� They typically include financial corrections and the recovery of irregular expenditure declared by Member States or beneficiaries� Confirmed corrective measures in 2018 amounted to EUR 1�2 billion� However, ex post controls cannot be applied to all payments from the EU budget as the cost-effectiveness of controls needs to be taken into account� Therefore, a risk-based approach as regards ex post controls is applied� For more information see Annex 4�
The budgetary discharge procedureIn line with the principles of sound financial management, funds must be spent in an effective, efficient and economic manner� An accountability framework based on comprehensive reporting, external audit and political control exists to provide reasonable assurance that EU funds are spent well in a proper manner�
European Commission
Who
HowReporting process
European Court of Auditors
reports
European Court of Auditors
Vote in the Parliament
European Parliament
Recommendation by
the Council
Council
Discharge to the
Commissiongiven by the
European Parliament
MAIN STEPS
Source: European Commission, DG Budget�

30
EU budget 2018 — Financial report
Every year the European Court of Auditors examines the reliability of the accounts, whether all revenue has been received and all expenditure incurred in a lawful and regular manner and whether the financial management has been sound� The publication of the annual report of the European Court of Auditors is the starting point for the discharge procedure� The auditors also prepare special reports on specific spending or policy areas, or on budgetary or management issues�
The decision on the discharge is also based on the Commission’s integrated financial and accountability reporting, on hearings of Commissioners and on the replies provided to written questions addressed to the Commission�
The annual discharge procedure allows the Parliament and the Council to hold the Commission politically accountable for the implementation of the EU budget� The Parliament decides, after a recommendation by the Council, on whether or not to provide its final approval, known as ‘granting discharge’, on the way the Commission implemented the EU budget in a given year�
The European Parliament will decide on the discharge for the 2018 budget in spring 2020�
accountability reportsby the
Commission
replies from the Commission to questionnaires
reports from the European
Court of Auditors
exchanges of views with
Commissioners about the EU
budget
the recommendation from the Council
When deciding on the discharge, the European Parliament takes into account
Source: European Commission, DG Budget�

31
SECTION I — 2018 EU BUDGET
The EU accountability cycle
European Court of Auditors publishes:
1 annual report including a statement of assurance covering the annual accounts and the legality and regularity of revenue and expenditure;
2 special reports.
1 European Parliament, upon a Council recommendation, decides whether to grant, refuse or postpone the discharge.
2 Both institutions make requests to the Commission.
3 Decision on discharge is based on the IFAR, the European Court of Auditors’ annual and special reports, hearings of relevant Commissioners and written questions addressed to the Commission.
European Commission submits the integrated financial and accountability reporting (IFAR).
European Commission, Member States and other partners (non-EU countries and international organisations) implement the EU budget.
European Parliament and Council approve the EU budget.
year n – 1 year n
year n + 1
year n + 1
year n + 1 year n + 2
year n – 1 year n
year n + 1CYCLE
Repor
ts
Lessons learned
Implementation
THE EU ACCOUNTABILITY
yea
r n +
2
Source: European Commission, DG Budget�


REVENUESECTION II

34
EU budget 2018 — Financial report
According to the equilibrium principle, the total budgeted EU revenue must equal the total budgeted EU expenditure� When determining Member States’ own-resource contributions the starting point is the total amount of authorised expenditure�
A small part of this amount is covered by other revenue (taxes levied on the salaries of EU staff, interest on late payments, fines and contributions from non-EU countries to certain programmes, etc�)� The remainder is mostly financed by Member States’ own-resource contributions, which accounted for around 90 % of all revenue in 2018�
While the EU budget must always be in balance, at the end of the year there can sometimes be a positive difference (surplus) in comparison to the budget estimates, carried over to the next year�
In 2018 the EU had own resources of EUR 142�4 billion and other revenue of EUR 15�7 billion� The surplus carried over from 2017 was EUR 0�6 billion� The total revenue amounted to EUR 158�7 billion�

35
SECTION II — REVENUE
What are the own resources?
The bulk of the EU funding comes from own resources: funds that Member States make available in advance for the EU� Own resources can be divided into the following categories�
• Traditional own resources (TORs), including customs duties and sugar levies, collected on behalf of the EU by the Member States� As of 2018 the sugar-sector levies no longer apply (6)�
• The value added tax (VAT) own resource: a small proportion of the VAT collected by each Member State�
• The GNI own resource, which is a proportion of Member States’ national gross income, depending on how wealthy they are� It serves as the balancing resource� It finances all spending not covered by other sources of revenue so that revenue and expenditure are always in balance�
The total amount of own resources cannot exceed 1�20 % of EU GNI based on the statistical reporting system of the European system of integrated economic accounts 2010�
The key for determining the own resources is the own-resources decision� The current decision (7) was agreed on 26 May 2014 and, ratified by all Member States, entered into force on 1 October 2016, with retroactive effect from 1 January 2014�
Traditional own resources (customs duties and sugar levies)TORs are levied on economic operators and collected by Member States on behalf of the EU� These payments accrue directly to the EU budget after a 20 % deduction that Member States retain as collection costs� Customs duties are levied on imports of agricultural and non-agricultural products from non-EU countries, at rates based on the common customs tariff�
In 2018 the EU’s revenue from customs duties was EUR 20 317 million (12�8 % of its total revenue)� EUR 85 million was reimbursed to the Member States for collected sugar levies for previous years� The total revenue from TORs (customs duties and sugar levies) was EUR 20 232 million (12�8 % of the EU’s total revenue)�
Value added tax own resourceThe VAT bases of all Member States are first harmonised in accordance with EU rules� They are then capped at 50 % of the GNI base (in order to remedy the regressive aspects of the VAT-based own resource)� Finally, a uniform rate of 0�3 % is levied on each Member State’s harmonised VAT base, with the exception of Germany, the Netherlands and Sweden, which benefit from the reduced call rate of 0�15 %�
In 2018 four Member States saw their VAT contribution reduced thanks to this 50 % cap (Croatia, Cyprus, Luxembourg and Malta)�
The EU’s total revenue from the VAT own resource was EUR 17 625 million (11�1 % of total revenue) in 2018�
(6) Article 124 of Regulation (EU) No 1308/2013 (OJ L 347, 20�12�2013, p� 671)�(7) Council Decision 2014/335/EU, Euratom of 26 May 2014 on the system of own resources of the European Union (OJ L 168,
7�6�2014, p� 105)�

36
EU budget 2018 — Financial report
Gross national income own resourceThe GNI own resource balances budget revenue and expenditure, financing the part of the budget not covered by other revenue� The amount of the GNI own resource needed therefore depends on the difference between total expenditure and the sum of all other revenues�
The same percentage is levied on each Member State’s GNI, established in accordance with EU rules� The rate is fixed as part of the budgetary procedure� In 2018 Denmark, the Netherlands and Sweden benefited from an annual gross reduction in their GNI-based contribution (of EUR 130 million, EUR 695 million and EUR 185 million respectively — all amounts are expressed in 2011 prices)�
In 2018 the rate of call of GNI was 0�6624841 % (8) and the total amount of the GNI resource levied was EUR 105 780 million (representing 65�9 % of total revenue) (9)�
The United Kingdom correctionThe current United Kingdom correction mechanism was introduced in 1985 to reduce the net contribution of the United Kingdom to the funding of the EU budget� This mechanism has been modified on several occasions to take into account changes made to the system of EU budget financing, but the essential principles remain the same�
The calculation is rather complex� It involves determining the United Kingdom’s contribution as if the own-resources system of the 1980s still prevailed (hence based on VAT); correcting it for fair burden sharing of the cost of expansion (enlargement) of the EU to include new members (excluding the agricultural payment); and neutralising the effect of the introduction of the GNI contribution and the change in the collection cost of the TORs� Two thirds of the difference between what the United Kingdom contributes and what it receives from the EU budget is refunded to the United Kingdom by way of a reduction in its contribution to the EU budget�
The cost of the United Kingdom correction is borne by the other 27 Member States in proportion to their GNI� However, the share of Germany, the Netherlands, Austria and Sweden is reduced by three quarters of their normal share and the cost of this reduction is redistributed across the remaining 23 Member States�
The United Kingdom correction in 2018 was EUR 5 026�5 million�
Opt-out for Denmark, Ireland and the United KingdomDenmark, Ireland and the United Kingdom are exempt from financing specific parts of security and citizenship policies, for which they have an opt-out in the Amsterdam Treaty, with the exception of the related administrative costs�
The Commission calculates this adjustment during the year following the financial year concerned�
(8) Amending budget No 6/2017 (OJ L 21, 25�1�2018,p� 7, Table 3)�(9) The GNI resource adjustment for the impact of non-participation of certain Member States in freedom, security and justice
policies is included�

37
SECTION II — REVENUE
Revenue other than own resources includes tax and other deductions from EU staff remunerations; contributions from non-EU countries to certain programmes (e�g� relating to research); interest on late payments and fines; and other diverse items� In 2018 other revenue totalled EUR 15 731�7 million�
SurplusAs the balance from the previous year’s budget is usually positive in comparison to the budget estimates there is usually a surplus at the end of the year� This positive difference is returned to the Member States in the form of reduced contributions the following year� In 2018 the surplus carried over from 2017 was EUR 555�5 million�
DonationsAccording to the financial regulation the Commission may accept or reject any donation made to the EU, including foundations, subsidies, gifts and bequests�
The acceptance of donations with a value of EUR 50 000 or more that involve a financial charge, including follow-up costs, exceeding 10 % of the value of the donation made is subject to the authorisation of the Parliament and the Council�
Donations occur very rarely� In 2018 the Commission was not required to take any decisions on donations�
FinesFines imposed on companies for infringing EU competition rules are also a source of revenue�
In 2018 the European Commission imposed 32 individual fines on companies for breaching competition law� These related to 13 separate cases and had a combined value of EUR 6�5 billion� Of the 32 fines, 17 with a total worth of EUR 630�4 million have not been contested by the companies and are thus final� In the other cases the companies have submitted appeals to the General Court�
When a company served with a fine decides to appeal against the Commission’s decision before the Court, the fine must be covered either by a provisional payment or by a financial guarantee� Of all pending fines from 2018 and earlier, as at 31 December 2018, approximately EUR 9�4 billion was covered by guarantees and provisional cash payments had been made in respect of approximately EUR 3�1 billion (representing a coverage of 98 % of the total amount of fines due)�
Revenues received by way of fines must not be recorded as budgetary revenue as long as the decisions imposing them can still be annulled by the Court of Justice� Provisional payments must therefore be kept off-budget� The legal proceedings may take up to 8 years� Depending on the final judgment, any fines provisionally paid, including earned interest, are either transferred to the EU’s income account and booked in the budget as other revenue or reimbursed to the companies�
Revenue earned from fines in 2018 resulted from a combination of fines imposed during 2018 that were not contested and fines imposed in earlier years for which legal proceedings finished during 2018� In total this revenue was worth EUR 1�1 billion, which represented around 0�8 % of the EU budget in 2018�
What are the other sources of revenue?

38
EU budget 2018 — Financial report
To reduce the weight of the GNI contribution for the Member States, the Commission, in its proposal for the next MFF in May 2018, suggested introducing a basket of new own resources consisting of:
• 20 % of the revenues from the emissions trading system;
• a 3 % call rate applied to the new common consolidated corporate tax base (to be phased in once the necessary legislation has been adopted);
• a national contribution calculated on the basis of the amount of non-recycled plastic packaging waste in each Member State (EUR 0�80 per kilo)�
These new own resources will represent about 12 % of the total EU budget and could contribute up to EUR 22 billion per year to funding the new priorities�
Evolution of the revenue sources of the EU budget
Source: Proposal of the Commission for the next MFF, May 2018 (10)�
(10) Figures relating to 2018 have been updated� (Source: 2018 annual accounts�)
What are the current options for reforming the own-resources system?
14 %
16 %
57 %
2 %
1 %
6 %
4 %2027
11 %
10 %
13 %
66 %
2018
Traditional own resources (mainly customs duties)
Statistical value added tax-based own resource
Own resource based on gross national income
Other (surplus, fines, etc.)
Own resource based on the auctioning revenue of the EU emissions trading system
Simplified value added tax-based own resource
Own resource based on non-recycled plastic packaging waste
Own resource based on the common consolidated corporate tax base

39
SECTION II — REVENUE
National contribution per Member State and traditional own resources collected on behalf of the EU in 2018 (million EUR)
GNI VAT own
resource
GNI own
resource
UK correction
Lump sum reduction
granted to DK, NL, AT and SE
TOTALnational
contribution
Traditional own
resources (TOR), net
(80 %)
TOTALown
resources
(1) (2) (*) (3) (**) (4) (**) (5)=(1)+(2)+(3)+(4) % % GNI (6) (7)=(5)+(6) % % GNI
456 719.2 BE 589.6 2 977.8 241.0 31.4 3 839.8 3.1 % 0.84 % 2 084.1 5 923.9 4.2 % 1.30 %
55 442.5 BG 78.9 375.2 29.4 3.7 487.1 0.4 % 0.88 % 96.4 583.5 0.4 % 1.05 %
196 265.8 CZ 254.0 1 343.4 109.1 13.6 1 720.1 1.4 % 0.88 % 266.6 1 986.8 1.4 % 1.01 %
304 814.1 DK 345.9 2 148.1 167.6 – 120.4 2 541.2 2.1 % 0.83 % 337.5 2 878.7 2.0 % 0.94 %
3 458 382.0 DE 2 085.1 22 621.8 320.0 239.7 25 266.7 20.7 % 0.73 % 3 999.8 29 266.5 20.6 % 0.85 %
25 086.6 EE 36.5 159.1 12.9 1.7 210.2 0.2 % 0.84 % 33.0 243.2 0.2 % 0.97 %
253 084.6 IE 250.1 1 900.2 152.2 17.7 2 320.2 1.9 % 0.92 % 285.1 2 605.3 1.8 % 1.03 %
183 070.3 EL 163.2 1 212.8 99.0 12.7 1 487.7 1.2 % 0.81 % 180.2 1 667.9 1.2 % 0.91 %
1 207 884.0 ES 1 629.0 7 952.7 648.3 83.9 10 313.9 8.4 % 0.85 % 1 528.1 11 842.0 8.3 % 0.98 %
2 407 643.7 FR 3 218.1 15 888.4 1 300.1 166.9 20 573.5 16.8 % 0.85 % 1 647.0 22 220.5 15.6 % 0.92 %
50 545.7 HR 78.1 341.7 27.5 3.5 450.8 0.4 % 0.89 % 36.7 487.5 0.3 % 0.96 %
1 773 423.1 IT 2 321.8 11 811.4 958.9 123.0 15 215.1 12.5 % 0.86 % 1 817.0 17 032.1 12.0 % 0.96 %
20 170.8 CY 31.2 136.6 11.1 1.4 180.3 0.1 % 0.89 % 23.1 203.4 0.1 % 1.01 %
29 278.7 LV 36.3 181.0 14.8 2.0 234.0 0.2 % 0.80 % 42.7 276.7 0.2 % 0.94 %
43 095.5 LT 53.7 276.2 23.0 3.0 355.8 0.3 % 0.83 % 91.3 447.1 0.3 % 1.04 %
41 326.9 LU 62.0 271.0 21.2 2.7 356.9 0.3 % 0.86 % 20.1 377.0 0.3 % 0.91 %
126 623.4 HU 154.1 846.2 66.9 8.6 1 075.8 0.9 % 0.85 % 193.1 1 268.9 0.9 % 1.00 %
11 269.7 MT 17.8 77.7 6.3 0.8 102.6 0.1 % 0.91 % 12.9 115.4 0.1 % 1.02 %
781 670.0 NL 485.1 4 992.6 70.8 – 703.8 4 844.7 4.0 % 0.62 % 2 502.9 7 347.7 5.2 % 0.94 %
384 734.1 AT 518.3 2 695.5 36.5 26.8 3 277.1 2.7 % 0.85 % 209.7 3 486.8 2.4 % 0.91 %
476 348.9 PL 588.1 3 106.0 256.0 33.1 3 983.2 3.3 % 0.84 % 735.0 4 718.2 3.3 % 0.99 %
196 467.1 PT 301.5 1 279.4 104.9 13.6 1 699.4 1.4 % 0.86 % 175.9 1 875.3 1.3 % 0.95 %
198 572.1 RO 239.1 1 296.5 105.4 13.7 1 654.7 1.4 % 0.83 % 175.8 1 830.5 1.3 % 0.92 %
45 343.3 SI 63.7 294.8 24.0 3.2 385.7 0.3 % 0.85 % 70.4 456.1 0.3 % 1.01 %
88 419.7 SK 96.4 611.9 49.1 6.2 763.6 0.6 % 0.86 % 93.4 857.0 0.6 % 0.97 %
232 880.0 FI 301.5 1 573.5 127.1 16.3 2 018.3 1.7 % 0.87 % 138.2 2 156.5 1.5 % 0.93 %
474 569.3 SE 316.6 3 103.3 44.4 – 160.8 3 303.5 2.7 % 0.70 % 494.1 3 797.6 2.7 % 0.80 %
2 363 581.3 UK 3 309.0 15 017.4 – 5 026.5 162.0 13 461.9 11.0 % 0.57 % 2 941.6 16 403.5 11.5 % 0.69 %
15 886 712.5 EU-28 17 624.8 104 492.1 0.9 5.9 122 123.7 100 % 0.77 % 20 231.6 142 355.4 100 % 0.90 %
Surplus from previous year 555.5
Surplus external aid guarantee fund 0.0
Other revenue 15 731.7
Total revenue 158 642.6
(*) For simplicity of presentation the GNI-based own resource includes the adjustment of the reimplementation of the 2014 own-resources decision, netting of adjustments to the VAT and GNI-based own resources for previous financial years and the freedom, security and justice adjustment�
(**) Totals for UK correction payments and GNI reduction granted to DK, NL, AT and SE are not equal to zero on account of exchange-rate differences�

40
EU budget 2018 — Financial report
EU revenue 2018 (after United Kingdom correction)
EU revenue 2000-2018 (million EUR)
0
10 000
20 000
30 000
40 000
50 000
60 000
70 000
80 000
90 000
100 000
110 000
120 000
130 000
140 000
150 000
160 000
2000 2001 2002 2003 2004 2005 2006 2007 2008 2009 2010 2011 2012 2013 2014 2015 2016 2017
Surplus from previous yearOtherGNI own resourceVAT own resourceTOR
2018
Surplus from previous year;0.4 %
TOR; 12.8 %
VAT own resource; 11.1 %
Other; 9.9 %
GNI own resource; 65.9 %

41
SECTION II — REVENUE
National contribution per Member State and traditional own resources collected on behalf of the EU in 2018 (million EUR)
0
5 000
10 000
15 000
20 000
25 000
BE BG CZ DK DE EE IE EL ES FR HR IT CY LV LT LU HU MT NL AT PL PT RO SI SK FI SE UK
GNI own resourceVAT own resourceTraditional own resources (TOR), net (80 %)
30 000
UK correction(EUR 5 026.5 million)
UK payments(a�er correction):EUR 16 403.5 million

TREASURY MANAGEMENT
SECTION III

TREASURY MANAGEMENT
SECTION III

44
EU budget 2018 — Financial report
Own resources, the main source of EU revenue, are credited twice a month to the Commission’s accounts held with Member States’ treasuries or central banks� From there the Commission transfers the necessary funds to its accounts with commercial banks, from which most payments are made to EU beneficiaries� However, the Commission only transfers the funds needed to carry out its daily payments� The replenishment of accounts with commercial banks is made on a just-in-time basis and is managed via the Commission’s treasury cash management system�
Member States make their contributions to the budget in their national currencies, while most of the Commission’s payments are denominated in euros� The Commission therefore needs to make foreign-exchange transactions in order to convert contributions from Member States that have not yet adopted the euro and to be able to make payments in non-EU currencies�
Source: European Commission, DG Budget�
In 2018, 0�2 % of nearly 2�5 million payments made were executed through treasuries and central banks, representing 64 % of the total amount paid (EUR 152 billion)� The remaining 99�8 % of payments were made through commercial banks (representing 36 % of the total amount paid)� The Commission’s funds are mainly kept in accounts held with Member States’ treasuries and with central banks�
Over EUR 150 billion
Over 2,5 million
transactions/year
Within and outside EU worldwide
In all currencies
Over EUR 150 billion
Member States(28)
Direct beneficiaries (over 500 000)
Other debtors

45
SECTION III — TREASURY MANAGEMENT
Treasury flows
Source: European Commission, DG Budget�
Contributions from the Member States
Commission accounts with central banks, Member States’ treasuries
0.2 % of payements executed through central banks and treasuries
99.8 % of payments executed through commercial banksCommission
accounts with commercial banks
Cash managementby European Commission
Payment executionby European Commission
BeneficiariesCustoms duties collected by Member States
Cashing of recovery orders


EXPENDITURESECTION IV

48
EU budget 2018 — Financial report
What was the EU’s expenditure for 2018 by Member State?
The calculation of the United Kingdom rebate requires that EU expenditure be assigned to specific Member States wherever possible in order to compare what the EU spent in the United Kingdom relative to the remaining 27 Member States� This allocation of expenditure to Member States is merely an accounting process� It does not reflect the benefits that each Member State derives from membership of the EU� This is partially related to the limitations of the accounting system and the allocation methodology (described in more detail in Annex 3)� Moreover, and more importantly, there are numerous other non-pecuniary and indirect benefits gained from EU policies — such as those relating to the single market and economic integration, trade and political stability and security — that are not taken into account in the allocation-of-expenditure exercise�
In 2018, EUR 130�4 billion out of EUR 156�7 billion (83�2 % of total EU expenditure) was allocated to Member States� For further details on the methodology used in allocating expenditure see the notes relating to the tables in the annexes�
The chart below shows the EU expenditure allocated to each Member State as a percentage of national GNI� This gives an indication of the relative importance of EU expenditure for each Member State�
2018 EU budget — payments executed (million EUR)
1a Competitiveness for growth and jobs;21 408, 14 %
Total
156 673
3 Security and citizenship;3 108, 2 %
1b Economic, social and territorial cohesion;54 468, 35 %
2 Sustainable growth:natural resources;
58 046, 37 %
4 Global Europe; 9 519, 6 %
Special instruments; 180, 0 %
5 Administration (all institutions); 9 944, 6 %

49
SECTION IV — EXPENDITURE
Expenditure by Member State in 2018 (million EUR) (11)
Methodological note on the allocation of expenditure in 2018Executed EU expenditure came to a total of EUR 144�5 billion in 2018 excluding the expenditure related to assigned revenue (12) (EUR 12�1 billion) and including that relating to EFTA contributions (EUR 368 million), or EUR 156�7 billion including expenditure related to assigned revenue and expenditure related to revenue from EFTA contributions� Of this total expenditure EUR 130�4 billion (83�2 %) was allocated to Member States and EUR 9�2 billion to non-EU countries�
In addition, EUR 5 billion was allocated to beneficiaries whose countries cannot be determined (covering groups of countries or international organisations)�
Expenditure allocated to non-EU countries in 2018 (EUR 9�2 billion) mainly related to the EU’s role as a global player (EUR 7�3 billion)� Significant amounts were also allocated to large infrastructure projects (EUR 62 million), research and innovation (EUR 837 million), Erasmus+ (EUR 166 million), fisheries (EUR 95 million) and other programmes and actions (EUR 733 million)�
(11) Excluding implementation financed by assigned revenue�(12) Assigned revenue is revenue earmarked for a specific purpose, such as income from foundations, subsidies, gifts and bequests,
including the assigned revenue specific to each institution (Article 21 of the financial regulation)�
0 %
1 %
2 %
3 %
4 %
5 %
6 %
0
2 000
4 000
6 000
8 000
10 000
12 000
14 000
16 000
18 000
PL FR ES DE IT BE UK HU PT EL RO CZ NL SK BG LT IE LU AT SE FI DK LV HR SI EE CY MT
9. Special instruments8. Negative reserve6. Compensations5. Administration4. Global Europe3. Security and citizenship2. Natural resources1b. Cohesion1a. Competitiveness% GNI
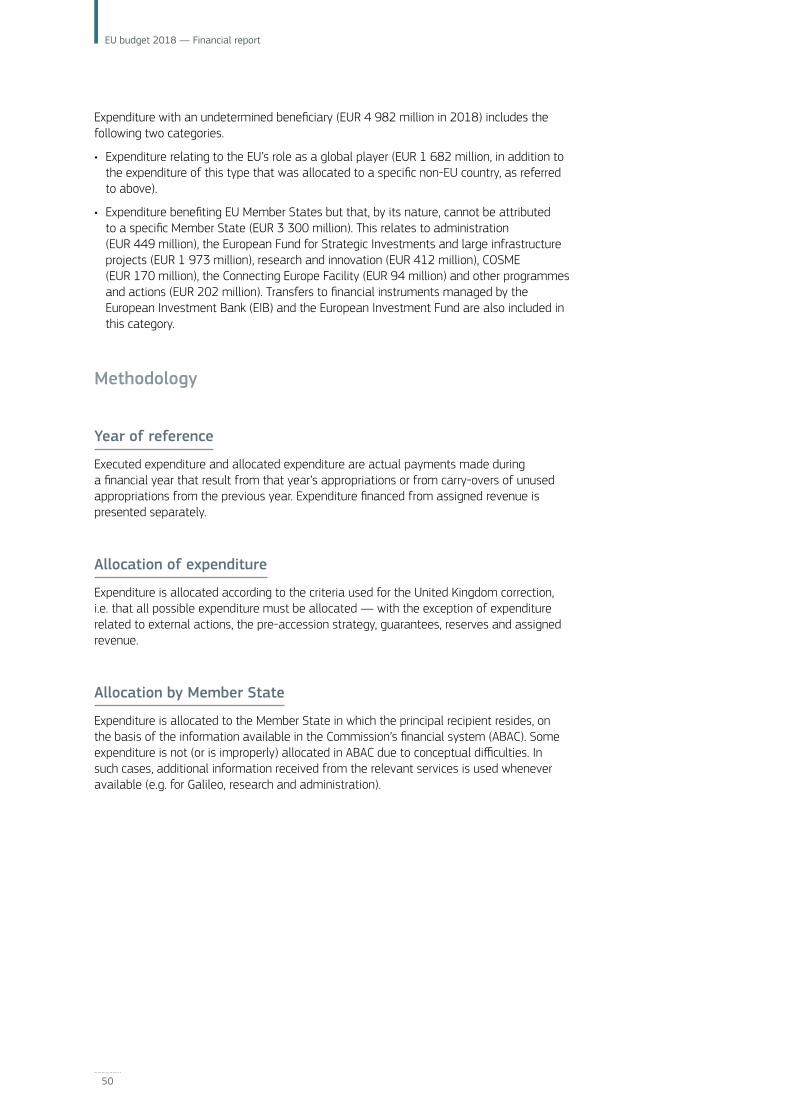
50
EU budget 2018 — Financial report
Expenditure with an undetermined beneficiary (EUR 4 982 million in 2018) includes the following two categories�
• Expenditure relating to the EU’s role as a global player (EUR 1 682 million, in addition to the expenditure of this type that was allocated to a specific non-EU country, as referred to above)�
• Expenditure benefiting EU Member States but that, by its nature, cannot be attributed to a specific Member State (EUR 3 300 million)� This relates to administration (EUR 449 million), the European Fund for Strategic Investments and large infrastructure projects (EUR 1 973 million), research and innovation (EUR 412 million), COSME (EUR 170 million), the Connecting Europe Facility (EUR 94 million) and other programmes and actions (EUR 202 million)� Transfers to financial instruments managed by the European Investment Bank (EIB) and the European Investment Fund are also included in this category�
Methodology
Year of reference
Executed expenditure and allocated expenditure are actual payments made during a financial year that result from that year’s appropriations or from carry-overs of unused appropriations from the previous year� Expenditure financed from assigned revenue is presented separately�
Allocation of expenditure
Expenditure is allocated according to the criteria used for the United Kingdom correction, i�e� that all possible expenditure must be allocated — with the exception of expenditure related to external actions, the pre-accession strategy, guarantees, reserves and assigned revenue�
Allocation by Member State
Expenditure is allocated to the Member State in which the principal recipient resides, on the basis of the information available in the Commission’s financial system (ABAC)� Some expenditure is not (or is improperly) allocated in ABAC due to conceptual difficulties� In such cases, additional information received from the relevant services is used whenever available (e�g� for Galileo, research and administration)�

51
SECTION IV — EXPENDITURE
Competitiveness for growth and jobs
Heading 1a
Highlights
As of April 2018 Galileo is integrated into every new type of car sold in Europe, supporting the eCall emergency-response system�
The European High-Performance Computing Joint Undertaking began operations in November 2018� It will pool EU and participating countries’ resources to build in Europe a world-class supercomputing and data infrastructure and a competitive innovation ecosystem in relevant technologies and applications�
Between July and October 2018 around 15 000 young people were able to explore Europe by rail with a DiscoverEU travel pass�
EUR 40 million was allocated in 2018 to collaborative research in innovative defence technologies and products�
When President Juncker set out his political guidelines at the start of his mandate he said that ‘My first priority as Commission President will be to strengthen Europe’s competitiveness and to stimulate investment for the purposes of job creation�’ The Commission has delivered on its promise to get more people into work� More EU citizens are in work than ever before, with 12�4 million new jobs created since 2014, unemployment down to 6�8 % and youth unemployment (14 %) back to its 2008 level� Investment has almost returned to pre-crisis levels and public finances have improved in terms of debt and deficit levels�
The expenditure allocated to budget Heading 1a ‘Competitiveness for growth and jobs’ plays an important role in boosting growth and creating jobs in the EU�
Heading 1a includes investments in research and innovation; education and training; strategic infrastructures; energy; transport and telecommunications networks; industry and SMEs; EU information systems in the field of taxation; customs; and statistics�
The main programmes financed under Heading 1a are Horizon 2020; large infrastructure projects such as Galileo (global satellite navigation) and the European Geostationary Navigation Overlay Service (EGNOS); ITER (fusion energy); Erasmus+ (education, training, young people and sport); the Connecting Europe Facility (transport, energy and telecommunications); and COSME (supporting the competitiveness of enterprises and SMEs)�
© OHB
© vladim
ircaribb — Fotolia
© nd3000-Fotolia
@Sikov-Fotolia

52
EU budget 2018 — Financial report
Heading 1a — payments executed in 2018 (million EUR)
Payments in 2018 covered both current programmes and the completion of previous programmes� The pie chart only includes the names of current programmes�
Heading 1a — expenditure by Member State in 2018 (13)
(13) Excluding implementation financed by assigned revenue�
0.0 %
0.5 %
1.0 %
1.5 %
2.0 %
2.5 %
0.0 billion EUR
0.5 billion EUR
1.0 billion EUR
1.5 billion EUR
2.0 billion EUR
2.5 billion EUR
3.0 billion EUR
FR UK ITBE ES NL SEAT HUELFIDK PT LUPL SK BGIE CZ LTRO SI EECY HRLV MT
in billion EUR% GNI
DE
European Fund for Strategic Investments (EFSI);2 038
European satellite navigation systems(EGNOS and Galileo); 964
International Thermonuclear Experimental Reactor (ITER); 666
European Earth-observationprogramme (Copernicus); 576European Solidarity Corps (ESC);26
Nuclear safety anddecommissioning; 196
Pilot projects and preparatory actions; 49
Horizon 2020; 11 319
Actions financed under the prerogatives ofthe Commission and specific competences conferredto the Commission; 121
Euratom research andtraining programme; 317
Competitiveness of enterprisesand small and medium-sized
enterprises (COSME); 300
Education, training and sport (Erasmus+); 2 366
Employment and social innovation(EaSI); 120
Customs, Fiscalis and anti-fraud;120
Energy; 264
Transport; 1 137
Information and communicationstechnology (ICT); 80
Energy projects to aid economic recovery (EERP); 159
Decentralised agencies; 322
Other actions and programmes; 269
Totalcompetitiveness
21 408
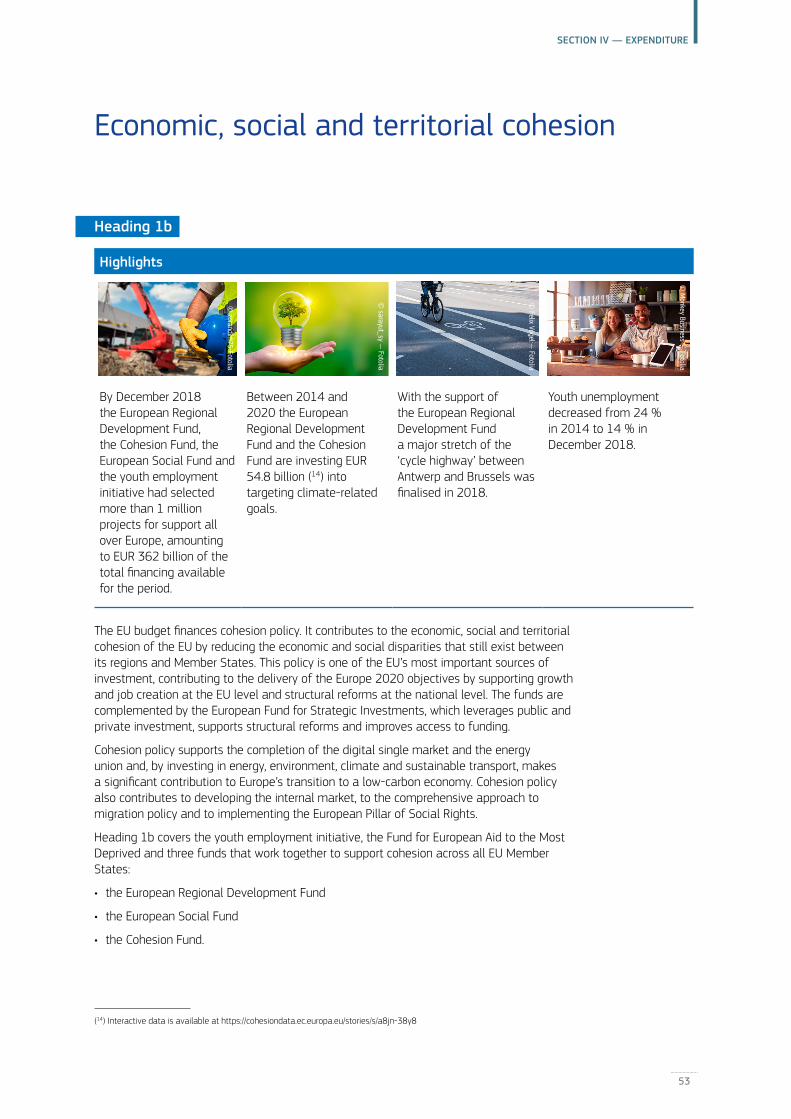
53
SECTION IV — EXPENDITURE
Heading 1b
Highlights
By December 2018 the European Regional Development Fund, the Cohesion Fund, the European Social Fund and the youth employment initiative had selected more than 1 million projects for support all over Europe, amounting to EUR 362 billion of the total financing available for the period�
Between 2014 and 2020 the European Regional Development Fund and the Cohesion Fund are investing EUR 54�8 billion (14) into targeting climate-related goals�
With the support of the European Regional Development Fund a major stretch of the ‘cycle highway’ between Antwerp and Brussels was finalised in 2018�
Youth unemployment decreased from 24 % in 2014 to 14 % in December 2018�
The EU budget finances cohesion policy� It contributes to the economic, social and territorial cohesion of the EU by reducing the economic and social disparities that still exist between its regions and Member States� This policy is one of the EU’s most important sources of investment, contributing to the delivery of the Europe 2020 objectives by supporting growth and job creation at the EU level and structural reforms at the national level� The funds are complemented by the European Fund for Strategic Investments, which leverages public and private investment, supports structural reforms and improves access to funding�
Cohesion policy supports the completion of the digital single market and the energy union and, by investing in energy, environment, climate and sustainable transport, makes a significant contribution to Europe’s transition to a low-carbon economy� Cohesion policy also contributes to developing the internal market, to the comprehensive approach to migration policy and to implementing the European Pillar of Social Rights�
Heading 1b covers the youth employment initiative, the Fund for European Aid to the Most Deprived and three funds that work together to support cohesion across all EU Member States:
• the European Regional Development Fund
• the European Social Fund
• the Cohesion Fund�
(14) Interactive data is available at https://cohesiondata�ec�europa�eu/stories/s/a8jn-38y8
Economic, social and territorial cohesion
© zorandim
75-Fotolia
© sarayut_sy —
Fotolia
© Felix Vogel —
Fotolia
© M
onkey Business — Fotolia

54
EU budget 2018 — Financial report
Regional convergence (less-developed regions);28 099
TotalCohesion
EUR 54 468
Pilot projects and preparatory actions; 9
Transition regions; 4 223
Competitiveness (more-developed regions); 9 115
Outermost and sparsely populated regions; 283
Cohesion Fund; 9 229European territorial cooperation; 1 190
Technical assistance; 196
Fund for European Aid to the Most Deprived (FEAD); 354
Youth employment initiative (specific top-up allocation); 1 020
Contribution to the Connecting Europe Facility (CEF); 752
Despite having started more slowly than in 2007-2013, the rate of project selection in the current programming period has now caught up� By December 2018 the European Regional Development Fund, the Cohesion Fund, the European Social Fund and the youth employment initiative had selected more than 1 million projects for support all over Europe, amounting to EUR 362 billion of the total financing available for the period� This level of project selection over 2014-2018 is comparable to the same time frame of the 2007-2013 period�
Heading 1b — payments executed in 2018 (million EUR)
Payments in 2018 covered both current programmes and the completion of previous programmes� The pie chart only includes the names of current programmes�
Heading 1b — expenditure by Member State in 2018 (15)
(15) Excluding implementation financed by assigned revenue�
in billion EUR% GNI
0.0 %
0.5 %
1.0 %
1.5 %
2.0 %
2.5 %
3.0 %
3.5 %
4.0 %
4.5 %
0.0 billion EUR
1.0 billion EUR
2.0 billion EUR
3.0 billion EUR
4.0 billion EUR
5.0 billion EUR
6.0 billion EUR
7.0 billion EUR
8.0 billion EUR
9.0 billion EUR
10.0 billion EUR
11.0 billion EUR
12.0 billion EUR
PL HU ES PT IT DE CZ FR RO SK EL LT UK BG LV HR SI BE EE SE FI IE AT NL CY DK MT LU

55
SECTION IV — EXPENDITURE
Heading 2
Highlights
In 2018 some 6�5 million farmers benefited from direct payments, with this support constituting 38 % of their farming income�
Exceptional support measures were also adopted in 2018 to compensate farmers in France and Italy for the health and veterinary restrictions to address avian influenza�
A total of EUR 522 million was allocated to the LIFE programme during the year� Through this programme the EU budget supports environmental and nature conservation projects and climate action�
Within the framework of the LIFE programme the first-ever EU initiative to address the decline of wild pollinating insects was launched in 2018�
The EU budget promotes the sound management of natural resources� The common agricultural policy encourages the production of safe, high-quality food and promotes European farm products and innovation in food and farm processing� It provides important financial support to EU farmers� It encourages the diversification of the rural economy and the protection of the environment and biodiversity�
Heading 2 ‘Sustainable growth: natural resources’ covers the two pillars of the common agricultural policy�
• Pillar I consists of the market support measures and the direct payments financed by the European Agricultural Guarantee Fund�
• Pillar II comprises the rural development support financed by the European Agricultural Fund for Rural Development�
The heading also covers the European Maritime and Fisheries Fund and the international dimension of the common fisheries policy, along with activities in the fields of climate and environment through LIFE, the programme for the environment and climate action�
Sustainable growth: natural resources
© nd3000 —
Fotolia
© Pixabay
© European Union
© Pixabay

56
EU budget 2018 — Financial report
TotalSustainable growth:natural resources
EUR 58 046
Decentralised agencies; 66
Pilot projects and preparatory actions; 7Other actions and measures; 6
Actions financed under the prerogatives of the Commission and specific competences conferred to the Commission; 0
Sustainable fisheries partnership agreements (SFPAs) and compulsory contributions to regional fisheries management organisations (RFMOs) and to other
international organisations; 97
European Maritime and Fisheries Fund (EMFF); 774
European Agricultural Fund for Rural Development (EAFRD);
12 467
Environment and climate action (LIFE); 317
European Agricultural Guarantee Fund (EAGF) — market-related expenditure and direct payments; 44 310
Heading 2 — payments executed in 2018 (million EUR)
Heading 2 — expenditure by Member State in 2018 (16)
(16) Excluding implementation financed by assigned revenue�
0.0 %
0.5 %
1 %
1.5 %
2.5 %
2.0 %
3.0 %
0.0 billion EUR
2.0 billion EUR
4.0 billion EUR
6.0 billion EUR
8.0 billion EUR
10.0 billion EUR
FR DEES IT PL UK RO EL HU IE PT AT CZ DKBG NLFISE LT SKBE LVHR EE SI CY LU MT
in billion EUR% GNI

57
SECTION IV — EXPENDITURE
Security and citizenship
Heading 3
Highlights
In 2018 the total number of irregular border crossings detected at the external borders was around 150 000, a 25 % decrease compared to 2017 and the lowest level in 5 years�
The European Border and Coast Guard Agency altogether deployed around 11 000 border guards during the year in operations to help patrol the EU’s external borders, mainly in Bulgaria, Greece, Spain and Italy� This made it possible to rescue 37 000 migrants, catch almost 1 200 people smugglers and coordinate/organise the return of almost 14 000 migrants�
Overall, the MEDIA programme supported the theatrical release of 563 films across borders in 2018�
The EU Civil Protection Mechanism was activated five times in 2018 to respond to forest fires in Greece, Latvia, Portugal and Sweden�
The Juncker Commission made security a top priority from day one� But over recent years security threats have evolved� EU Member States have already worked together to ensure an effective response to diverse security threats, including new forms of terrorist attack, radicalisation, new types of organised crime and cybersecurity threats� They will need to continue doing so in the future�
Security threats know no borders and are becoming increasingly international� The complex nature of these challenges is such that no Member State can or should be made to meet them on its own� The EU budget supports Member States in their responsibilities and efforts�
Heading 3 ‘Security and citizenship’ includes justice and home affairs; migration and border protection; health and food safety; consumer protection; and culture�
The main programmes financed under Heading 3 are the justice programme; rights, equality and citizenship; the Asylum, Migration and Integration Fund; the Internal Security Fund; food and feed; health; the consumer programme; and creative Europe�
© European Border and
Coast Guard Agency
© European Border and
Coast Guard Agency
© Destina —
Fotolia
© European Union

58
EU budget 2018 — Financial report
TotalSecurity andcitizenship
EUR 3 108
Pilot projects and preparatory actions; 11
Decentralised agencies; 846
Health; 61
Food and feed; 247Europe for citizens; 29
Union Civil Protection Mechanism; 34
Justice; 47
Actions financed under the prerogatives of the Commission and specific competences
conferred to the Commission; 93
Rights, equality and citizenship; 73
IT systems; 13
Internal Security Fund; 454Instrument for Emergency Support within the Union (IES);
226
Creative Europe; 206
Consumer; 28
Asylum, Migration and Integration Fund (AMF); 738
Heading 3 — payments executed in 2018 (million EUR)
Payments in 2018 covered both current programmes and the completion of previous programmes� The pie chart only includes the names of current programmes�
Heading 3 — expenditure by Member State in 2018 (17)
(17) Excluding implementation financed by assigned revenue�
0.00 %
0.15 %
0.10 %
0.05 %
0.20 %
0.25 %
0.35 %
0.30 %
0.40 %
0.0 billion EUR
0.20 billion EUR
0.25 billion EUR
0.15 billion EUR
0.10 billion EUR
0. 5 billion EUR
0.30 billion EUR
0.35 billion EUR
0.40 billion EUR
EL IT NLBE ES FR UKDE SEPL MTAT EEBGPT HULURO LT FI IE CZDKLV HR SKSI CY
in billion EUR% GNI
0.45 %0.45 billion EUR

59
SECTION IV — EXPENDITURE
Global Europe
Heading 4
Highlights
In 2018 more than EUR 1�4 billion was spent on humanitarian aid in more than 90 countries� A significant part of this amount was spent on supporting conflict-affected populations in Syria and refugees in neighbouring countries�
More than half of the budget for humanitarian aid during the year went to the most vulnerable countries, and an additional 33�9 % was allocated to ‘forgotten crises’�
Thanks to the EU Facility for Refugees in Turkey, 136 new schools have been built, 410 000 refugee children are now attending school and 60 000 students have joined catch-up classes� In addition, 178 healthcare centres are now operational�
Another EUR 15 million was committed in 2018 to help create the necessary conditions for the voluntary, safe and dignified return of Rohingya refugees who have fled from Myanmar/Burma to Bangladesh�
Heading 4 ‘Global Europe’ covers all external actions (or foreign policy) carried out by the EU� It includes neighbourhood and enlargement, development assistance, humanitarian aid and the response to crises, with the exception of development cooperation with the African, Caribbean and Pacific countries and with the overseas countries and territories of the EU, for which the European Development Fund provides aid�
Many of the main actions under Heading 4 in 2018 were linked to major humanitarian crises, not least the ongoing migration challenges in Europe’s immediate neighbourhood� As an example of its response to major crises, the EU continued to deliver life-saving assistance and support to millions of people across Syria� The EU is also addressing the root causes of migration through development cooperation and assistance with a longer-term focus�
The main programmes financed under Heading 4 are the European Neighbourhood Instrument; the Development Cooperation Instrument; the Partnership Instrument; humanitarian aid; the common foreign and security policy; and the Instrument for Pre-accession Assistance�
© 2018 European Union
© 2018 European Union
© European Union
© European Union

60
EU budget 2018 — Financial report
Instrument for Pre-accession assistance (IPA II); 1 446
European NeighbourhoodInstrument (ENI); 2 145
TotalGlobal Europe
EUR 9 519
Actions financed under the prerogatives ofthe Commission and specific competences conferredto the Commission; 61
Development Cooperation Instrument(DCI); 2 684
Partnership Instrument (PI); 130
European Instrument forDemocracy and Human Rights
(EIDHR); 191
Instrument contributing toStability and Peace (IcSP); 334
Humanitarian aid; 1 506
Common foreign and securitypolicy (CFSP); 316
European Fund for SustainableDevelopment (EFSD); 275
EU Aid Volunteers initiative (EUAV); 16Union Civil Protection Mechanism; 9
Guarantee Fund for External Actions; 138
Instrument for Nuclear SafetyCooperation (INSC); 40
Macro-financial assistance (MFA); 5
Decentralised agencies; 20Other actions and programmes; 197Pilot projects and preparatory actions; 8
Heading 4 — payments executed in 2018 (million EUR)
Payments in 2018 covered both current programmes and the completion of previous programmes� The pie chart only includes the names of current programmes�
Heading 4 — expenditure by Member State in 2018 (18)
(18) Excluding implementation financed by assigned revenue�
in billion EUR% GNI
0.00 %
0.01 %
0.02 %
0.00 billion EUR
0.01 billion EUR
0.01 billion EUR
0.02 billion EUR
0.02 billion EUR
0.03 billion EUR
0.03 billion EUR
RO HR BG HU

61
SECTION IV — EXPENDITURE
Administration
Heading 5
Highlights
The new financial regulation entered into force on 2 August 2018� It simplifies and streamlines the rules applicable to EU funding�
In 2018, for the second consecutive year, the European Court of Auditors gave a qualified (‘favourable, but …’) rather than an adverse (‘negative’) opinion on the legality and regularity of the EU’s 2017 budget payments�
During the year the Commission effectively recovered EUR 3�2 billion� These financial corrections and recoveries are essential preventive and corrective measures that protect the EU budget�
The Commission proposed a new long-term budget in 2018: ‘a modern budget for a Union that protects, empowers and defends’�
Heading 5 ‘Administration’ covers expenditure by all EU institutions� It includes staff salaries, pensions, buildings, information technology, security, training, publications and European Schools�
© European Union
© European Union
© Jakub Jirsák —
Fotolia
© European Union

62
EU budget 2018 — Financial report
Pensions; 1 879
TotalAdministration
EUR 9 944
Administrative expenditure ofthe other institutions; 4 140
European Schools; 188
Pilot projects andpreparatory actions; 3
Commission administrativeexpenditure; 3 734
Heading 5 — payments executed in 2018 (million EUR)
Heading 5 — expenditure by Member State in 2018 (19)
(19) Excluding implementation financed by assigned revenue�
0.0 %
2.0 %
1.5 %
1.0 %
0.5 %
2.5 %
3.0 %
4.0 %
3.5 %
4.5 %
0.0 billion EUR
3.0 billion EUR
3.5 billion EUR
2.5 billion EUR
2.0 billion EUR
1.5 billion EUR
1.0 billion EUR
0. 5 billion EUR
4.0 billion EUR
4.5 billion EUR
5.5 billion EUR
5.0 billion EUR in billion EUR% GNI
BE LU FR DE IT UK ES NL DK IE PT FI SE EL PL AT RO HU CZ BG SK LT SI EE HR LV MT CY

ANNEXESSECTION V

64
EU budget 2018 — Financial report
Annex 1
2007-2013 and 2014-2020 financial frameworks
Table 1� Multiannual financial framework (EU-28) Technical adjustment for 2019
(million EUR — current prices)
COMMITMENT APPROPRIATIONS
2014 2015 2016 2017 2018 2019 2020 Total 2014-2020
1. Smart and inclusive growth 52 756 77 986 69 304 73 512 76 420 79 924 83 661 513 563
1a: Competitiveness for growth and jobs
16 560 17 666 18 467 19 925 21 239 23 082 25 191 142 130
1b: Economic, social and territorial cohesion
36 196 60 320 50 837 53 587 55 181 56 842 58 470 371 433
2. Sustainable growth: natural resources
49 857 64 692 64 262 60 191 60 267 60 344 60 421 420 034
of which: Market-related expenditure and direct payments
43 779 44 190 43 951 44 146 44 163 43 881 43 888 307 998
3. Security and citizenship 1 737 2 456 2 546 2 578 2 656 2 801 2 951 17 725
4. Global Europe 8 335 8 749 9 143 9 432 9 825 10 268 10 510 66 262
5. Administration 8 721 9 076 9 483 9 918 10 346 10 786 11 254 69 584
of which: Administrative expenditure of the institutions
7 056 7 351 7 679 8 007 8 360 8 700 9 071 56 224
6. Compensations 29 0 0 0 0 0 0 29
TOTAL COMMITMENT APPROPRIATIONS
121 435 162 959 154 738 155 631 159 514 164 123 168 797 1 087 197
as a percentage of GNI 0.90 % 1.17 % 1.05 % 1.04 % 1.02 % 1.00 % 0.99 % 1.02 %
TOTAL PAYMENT APPROPRIATIONS
135 762 140 719 130 694 126 492 154 565 166 709 172 201 1 027 142
as a percentage of GNI 1.01 % 1.01 % 0.88 % 0.84 % 0.98 % 1.01 % 1.01 % 0.96 %
Margin available 0.22 % 0.22 % 0.35 % 0.39 % 0.22 % 0.19 % 0.19 % 0.26 %
Own resources ceiling as a percentage of GNI (*)
1.23 % 1.23 % 1.23 % 1.23 % 1.20 % 1.20 % 1.20 % 1.22 %
(*) The 2014 own-resources decision entered into force on 1 October 2016, after the 2017 technical adjustment was calculated, and was reflected as from the 2018 technical adjustment (communicated to the Council in May 2017)�

65
SECTION V — ANNEXES
Table 2� 2007-2013 financial framework, adjusted for 2013
(million EUR — current prices)
COMMITMENT APPROPRIATIONS
2007 2008 2009 2010 2011 2012 2013 Total 2007-2013
1. Sustainable growth 53 979 57 653 61 696 63 555 63 974 67 614 70 644 439 115
1a Competitiveness for growth and employment
8 918 10 386 13 269 14 167 12 987 14 853 15 670 90 250
1b Cohesion for growth and employment
45 061 47 267 48 427 49 388 50 987 52 761 54 974 348 865
2. Preservation and management of natural resources
55 143 59 193 56 333 59 955 59 888 60 810 61 289 412 611
of which: Market-related expenditure and direct payments
45 759 46 217 46 679 47 146 47 617 48 093 48 574 330 085
3. Citizenship. freedom. security and justice
1 273 1 362 1 518 1 693 1 889 2 105 2 407 12 247
3a Freedom, security and justice 637 747 867 1 025 1 206 1 406 1 661 7 549
3b Citizenship 636 615 651 668 683 699 746 4 698
4. EU as a global player 6 578 7 002 7 440 7 893 8 430 8 997 9 595 55 935
5. Administration (1) 7 039 7 380 7 525 7 882 8 091 8 523 8 492 54 932
6. Compensations 445 207 210 75 937
TOTAL COMMITMENT APPROPRIATIONS
124 457 132 797 134 722 140 978 142 272 148 049 152 502 975 777
as a percentage of GNI 1.02 % 1.08 % 1.16 % 1.18 % 1.15 % 1.13 % 1.15 % 1.12 %
TOTAL PAYMENT APPROPRIATIONS
122 190 129 681 120 445 134 289 133 700 141 360 144 285 925 950
as a percentage of GNI 1.00 % 1.05 % 1.04 % 1.12 % 1.08 % 1.08 % 1.08 % 1.06 %
Margin available 0.24 % 0.19 % 0.20 % 0.11 % 0.15 % 0.15 % 0.15 % 0.17 %
Own-resources ceiling as a percentage of GNI
1.24 % 1.24 % 1.24 % 1.23 % 1.23 % 1.23 % 1.23 % 1.23 %
(1) The expenditure on pensions included under the ceiling for this heading is calculated net of the staff contributions to the relevant scheme, within the limit of EUR 500 million at 2004 prices for the 2007-2013 period�

66
EU budget 2018 — Financial report
Annex 2
2018 expenditure and revenue by programme, heading, type of source and Member StateAnnex 2a� Expenditure in 2018 by heading
All types of appropriations (million EUR)1a. Competitiveness for growth and jobs Total payments (including assigned revenue)1.1.10 European Fund for Strategic Investments (EFSI) 2 0381.1.11 European satellite navigation systems (EGNOS and Galileo) 9641.1.12 International Thermonuclear Experimental Reactor (ITER) 6661.1.13 European Earth-observation programme (Copernicus) 5761.1.14 European Solidarity Corps (ESC) 261.1.2 Nuclear safety and decommissioning 1961.1.31 Horizon 2020 11 3191.1.32 Euratom research and training programme 3171.1.4 Competitiveness of enterprises and small and medium-sized enterprises (COSME) 3001.1.5 Education, training and sport (Erasmus+) 2 3661.1.6 Employment and social innovation (EaSI) 1201.1.7 Customs, Fiscalis and anti-fraud 1201.1.81 Energy 2641.1.82 Transport 1 1371.1.83 Information and communications technology (ICT) 801.1.9 Energy projects to aid economic recovery (EERP) 1591.1.DAG Decentralised agencies 3221.1.OTH Other actions and programmes 2691.1.PPPA Pilot projects and preparatory actions 491.1.SPEC Actions financed under the prerogatives of the Commission and specific competences conferred to the Commission 121Total — Competitiveness 21 408
1b. Economic, social and terrirorial cohesion1.2.11 Regional convergence (less-developed regions) 28 0991.2.12 Transition regions 4 2231.2.13 Competitiveness (more-developed regions) 9 1151.2.14 Outermost and sparsely populated regions 2831.2.15 Cohesion Fund 9 2291.2.2 European territorial cooperation 1 1901.2.31 Technical assistance 1961.2.4 Fund for European Aid to the Most Deprived (FEAD) 3541.2.5 Youth employment initiative (specific top-up allocation) 1 0201.2.6 Contribution to the Connecting Europe Facility (CEF) 7521.2.PPPA Pilot projects and preparatory actions 9Total — Cohesion 54 468
2. Sustainable growth: natural resources2.0.10 European Agricultural Guarantee Fund (EAGF) — market-related expenditure and direct payments 44 3102.0.20 European Agricultural Fund for Rural Development (EAFRD) 12 467
2.0.31 European Maritime and Fisheries Fund (EMFF) 7742.0.32 Sustainable fisheries partnership agreements (SFPAs) and compulsory contributions to regional fisheries
management organisations (RFMOs) and to other international organisations97
2.0.4 Environment and climate action (LIFE) 3172.0.DAG Decentralised agencies 662.0.OTH Other actions and measures 62.0.PPPA Pilot projects and preparatory actions 82.0.SPEC Actions financed under the prerogatives of the Commission and specific competences conferred to the Commission 0Total — Sustainable growth: natural resources 58 046

67
SECTION V — ANNEXES
3. Security and citizenship3.0.1 Asylum, Migration and Integration Fund (AMF) 7383.0.2 Internal Security Fund 4543.0.3 IT systems 133.0.4 Justice 473.0.5 Rights, equality and citizenship 733.0.6 Union Civil Protection Mechanism 343.0.7 Europe for citizens 293.0.8 Food and feed 2473.0.9 Health 613.0.10 Consumer 283.0.11 Creative Europe 2063.0.12 Instrument for Emergency Support within the Union (IES) 2263.0.DAG Decentralised agencies 8463.0.PPPA Pilot projects and preparatory actions 113.0.SPEC Actions financed under the prerogatives of the Commission and specific competences conferred to the Commission 93Total — Security and citizenship 3 108
4. Global Europe4.0.1 Instrument for Pre-accession Assistance (IPA II) 1 4464.0.2 European Neighbourhood Instrument (ENI) 2 1454.0.3 Development Cooperation Instrument (DCI) 2 6844.0.4 Partnership Instrument (PI) 1304.0.5 European Instrument for Democracy and Human Rights (EIDHR) 1914.0.6 Instrument contributing to Stability and Peace (IcSP) 3344.0.7 Humanitarian aid 1 5064.0.8 Common foreign and security policy (CFSP) 3164.0.9 Instrument for Nuclear Safety Cooperation (INSC) 404.0.10 Macro-financial assistance (MFA) 54.0.11 Guarantee Fund for External Actions 1384.0.12 Union Civil Protection Mechanism 94.0.13 EU Aid Volunteers initiative (EUAV) 164.0.14 European Fund for Sustainable Development (EFSD) 2754.0.DAG Decentralised agencies 204.0.OTH Other actions and programmes 1974.0.PPPA Pilot projects and preparatory actions 84.0.SPEC Actions financed under the prerogatives of the Commission and specific competences conferred to the Commission 61Total — Global Europe 9 519
5. Administration5.1.1 Pensions 1 8795.1.23 European Schools 1885.2.3DAG Decentralised agencies 05.2.3PPPA Pilot projects and preparatory actions 35.2.3X Commission administrative expenditure 3 7345.2.OI Administrative expenditure of the other institutions 4 140Total — Administration 9 944
6. Compensations6.0.1 Compensations 0Total — Compensations 0
9. Special instruments9.0.1 Emergency Aid Reserve (EAR) 09.0.2 European Globalisation Adjustment Fund (EGF) 289.0.3 European Union Solidarity Fund (EUSF) 152Total — Special instruments 180
TOTAL 156 673

68
EU budget 2018 — Financial report
Anne
x 2b
—EU
bud
get
reve
nue
2000
-201
8 (m
illio
n EU
R)
2000
-200
6EU
-15
EU-2
5
2000
2001
2002
2003
2004
2005
2006
Type
of r
even
uem
illio
n EU
R %
mill
ion
EUR
%m
illio
n EU
R %
mill
ion
EUR
%m
illio
n EU
R %
mill
ion
EUR
%m
illio
n EU
R %
(1) V
AT-b
ased
ow
n re
sour
ce(in
cludi
ng b
alan
ce fr
om
prev
ious
yea
rs)
35 1
92.5
38.0
31 3
20.3
33.2
22 3
88.2
23.5
21 2
60.1
22.7
13 9
12.2
13.4
16 0
18.0
15.0
17 2
06.2
15.9
(2) G
NP/G
NI-b
ased
ow
n re
sour
ce (*
***)
(****
*) (in
cludi
ng
bala
nce
from
pre
viou
s ye
ars)
37 5
80.5
40.5
34 8
78.8
37.0
45 9
47.6
48.1
51 2
35.2
54.8
68 9
82.0
66.6
70 8
60.6
66.2
70 1
32.1
64.7
(3) U
K co
rrect
ion
(*)-7
0.9
-0.1
-70.
3-0
.114
8.2
0.2
280.
10.
3-1
48.0
-0.1
-130
.7-0
.1-1
5.3
0.0
(4) O
ther
pay
men
ts fr
om/to
M
embe
r Sta
tes
(**)
0.0
0.0
0.0
0.0
---
---
-0.1
0.0
0.0
0.0
0.0
0.0
0.0
0.0
(5) T
otal
nat
iona
l con
tribu
tions
= (1
) + (2
) + (3
) + (4
)72
702
.078
.466
128
.870
.168
484
.071
.872
775
.377
.982
746
.279
.986
748
.081
.087
322
.980
.5
(6) T
radi
tiona
l ow
n re
sour
ces
15 2
67.1
16.5
14 5
89.2
15.5
9 21
4.0
9.7
10 8
57.2
11.6
12 3
07.1
11.9
14 0
63.1
13.1
15 0
28.3
13.9
Agric
ultu
ral d
utie
s1
198.
41.
31
132.
91.
21
180.
21.
21
349.
11.
41
751.
21.
71
801.
01.
71
722.
41.
6
Suga
r lev
ies
1 19
6.8
1.3
840.
00.
986
4.8
0.9
510.
90.
553
5.5
0.5
926.
80.
920
2.1
0.2
Cust
oms
dutie
s14
568
.315
.714
237
.415
.112
917
.513
.512
616
.213
.514
122
.813
.616
023
.015
.018
113
.116
.7
Amou
nts
reta
ined
. col
lect
ion
(***)
-1 6
96.3
-1.8
-1 6
21.0
-1.7
-5 7
48.6
-6.0
-3 6
19.1
-3.9
-4 1
02.4
-4.0
-4 6
87.7
-4.4
-5 0
09.4
-4.6
(7) T
otal
ow
n re
sour
ces
87 9
69.2
94.9
80 7
18.1
85.6
77 6
98.0
81.4
83 6
32.5
89.5
95 0
53.3
91.8
100
811.
194
.110
2 35
1.2
94.4
= (5
) + (6
) %
GNI
1.01
0.89
0.83
0.87
0.90
0.91
0.88
(8) S
urpl
us fr
om p
revi
ous
year
3 20
9.1
3.5
11 6
12.7
12.3
15 0
02.5
15.7
7 41
3.5
7.9
5 46
9.8
5.3
2 73
6.7
2.6
2 41
0.1
2.2
(9) O
ther
reve
nue
1 54
6.1
1.7
1 95
8.5
2.1
2 73
3.9
2.9
2 42
2.6
2.6
2 98
8.8
2.9
3 54
2.8
3.3
3 66
1.7
3.4
(10)
TOT
AL R
EVEN
UE92
724
.410
094
289
.310
095
434
.410
093
468
.610
010
3 51
1.9
100
107
090.
610
010
8 42
3.0
100
= (7
) + (8
) + (9
) %
GNI
1.06
1.04
1.02
0.98
0.98
0.97
0.93
p.m. E
U GN
I8
742
342.
19
063
438.
79
383
942.
79
573
255.
610
563
962
.711
021
731
.811
641
168
.6
(*)
The
fact
that
pay
men
ts fo
r the
UK
corre
ctio
n do
not
add
up
to z
ero
is d
ue to
exc
hang
e-ra
te d
iffer
ence
s�(**
) Th
e ca
tego
ry ‘O
ther
pay
men
ts f
rom
/to M
embe
r Sta
tes’
incl
udes
:
— 2
000-
2001
rest
itutio
ns to
Gre
ece,
Spa
in a
nd P
ortu
gal;
—
sin
ce 2
003
the
just
ice
and
hom
e aff
airs
adj
ustm
ent,
and
from
201
4 th
e fr
eedo
m, s
ecur
ity a
nd ju
stic
e ad
just
men
t (w
hich
doe
s no
t add
up
to z
ero,
on
acco
unt o
f ex
chan
ge-r
ate
diffe
renc
es;
—
adj
ustm
ent f
or th
e re
impl
emen
tatio
n of
the
2007
ow
n-re
sour
ces
deci
sion
and
201
4 ow
n-re
sour
ces
deci
sion
;
— re
duct
ion
in G
NI-
base
d ow
n re
sour
ce g
rant
ed to
Den
mar
k, th
e N
ethe
rland
s an
d Sw
eden
;
— n
ettin
g of
adj
ustm
ents
to th
e VA
T an
d G
NI-
base
d ow
n re
sour
ces
for p
revi
ous
finan
cial
yea
rs�
(***)
TOR
colle
ctio
n co
sts
(10
%, a
nd f
rom
200
1 un
til 2
014:
25
%, a
nd s
ince
201
4: 2
0 %
) hav
e be
en re
cord
ed a
s ne
gativ
e re
venu
e� 1
5 %
of
the
2001
am
ount
s w
ere
reco
rded
in 2
002�
(****
) ES
A95
GN
I rep
lace
d ES
A79
GN
P as
of
2002
�(**
***)
ESA2
010
GN
I rep
lace
d ES
A95
GN
I as
of 2
014�

69
SECTION V — ANNEXES
2007
-201
8
EU-2
7EU
-28
2007
2008
2009
2010
2011
2012
2013
2014
2015
2016
2017
2018
Type
of r
even
uem
illio
n EU
R %
mill
ion
EUR
%m
illio
n EU
R %
mill
ion
EUR
%m
illio
n EU
R %
mill
ion
EUR
%m
illio
n EU
R %
mill
ion
EUR
%m
illio
n EU
R %
mill
ion
EUR
%m
illio
n EU
R %
mill
ion
EUR
%
(1) V
AT-b
ased
ow
n re
sour
ce(in
cludi
ng b
alan
ce fr
om p
revi
ous
year
s)
19 4
40.8
16.5
19 0
07.7
15.6
12 7
96.2
10.9
12 4
70.5
9.8
14 7
98.9
11.4
14 8
71.2
10.7
14 0
19.7
9.4
17 6
67.4
12.3
18 0
87.0
12.4
15 8
95.1
11.0
16 9
47.3
12.2
17 6
24.8
11.1
(2) G
NP/G
NI-b
ased
ow
n re
sour
ce
(****
) (**
***)
(inclu
ding
bal
ance
fr
om p
revi
ous
year
s)
73 9
14.7
62.9
74 4
77.3
61.3
81 9
82.5
69.7
91 0
66.8
71.3
88 4
14.3
68.0
98 1
63.0
70.3
110
194.
673
.799
075
.668
.810
0 96
7.4
69.1
95 5
78.4
66.3
78 6
20.0
56.6
105
780.
066
.7
(3) U
K co
rrect
ion
(*)58
.90.
140
0.0
0.3
-321
.1-0
.3-1
14.8
-0.1
5.4
0.0
-56.
50.
016
9.9
0.1
-209
.3-0
.1-4
43.0
-0.3
626.
10.
410
2.9
0.1
0.9
0.0
(4) O
ther
pay
men
ts fr
om/to
M
embe
r Sta
tes
(**)
0.1
0.0
1.2
0.0
-78.
9-0
.1-6
.90.
0-1
.70.
0-1
.20.
0-5
.90.
0-1
.80.
0-7
.00.
0-1
9.5
0.0
-701
.6-0
.5-1
282
.0-0
.8
(5) T
otal
nat
iona
l con
tribu
tions
= (1
) + (2
) + (3
) + (4
)93
414
.579
.593
886
.277
.294
378
.780
.210
3 41
5.6
80.9
103
216.
979
.411
2 97
6.4
81.0
124
378.
383
.211
6 53
1.8
81.0
118
604.
381
.211
2 08
0.2
77.8
94 9
68.6
68.3
122
123.
777
.0
(6) T
radi
tiona
l ow
n re
sour
ces
16 5
73.0
14.1
17 2
82.9
14.2
14 5
28.2
12.4
15 6
59.3
12.3
16 7
77.7
12.9
16 4
53.4
11.8
15 3
65.3
10.3
16 4
29.5
11.4
18 7
30.4
12.8
20 0
94.1
13.9
20 4
59.1
14.7
20 2
31.6
12.8
Agric
ultu
ral d
utie
s1
872.
11.
61
703.
51.
40.
0--
-0.
0--
-0.
0--
-0.
0--
-0.
0--
-0.
0--
-0.
0--
-0.
0--
-0.
0--
-0.
0---
Suga
r lev
ies
-40.
90.
094
3.8
0.8
175.
50.
119
4.1
0.2
175.
60.
125
6.7
0.2
268.
80.
2-2
5.2
0.0
165.
00.
116
5.8
0.1
167.
10.
1-8
5.1
-0.1
Cust
oms
dutie
s20
266
.217
.220
396
.616
.819
195
.516
.320
684
.916
.222
194
.717
.121
681
.115
.520
218
.313
.5
21
998.
015
.324
850
.117
.026
659
.518
.525
406
.718
.325
395
.916
.0
Amou
nts
reta
ined
. col
lect
ion
(***)
-5 5
24.3
-4.7
-5 7
61.0
-4.7
-4 8
42.7
-4.1
-5 2
19.8
-4.1
-5 5
92.6
-4.3
-5 4
84.5
-3.9
-5 1
21.8
-3.4
-5 5
43.3
-3.9
-6 2
84.7
-4.3
-6 7
31.2
-4.7
-5 1
14.8
-3.7
-5 0
79.2
-3.2
(7) T
otal
ow
n re
sour
ces
109
987.
593
.611
1 16
9.1
91.4
108
906.
992
.611
9 07
4.9
93.2
119
994.
792
.312
9 42
9.8
92.8
139
743.
693
.513
2 96
1.3
92.4
137
334.
794
.013
2 17
4.3
91.7
115
427.
783
.014
2 35
5.4
89.7
= (5
) + (6
) %
GNI
0.88
0.89
0.93
0.97
0.95
1.00
1.07
0.96
0.94
0.89
0.76
0.90
(8) S
urpl
us fr
om p
revi
ous
year
1 84
7.6
1.6
1 52
8.8
1.3
1 79
6.2
1.5
2 25
3.6
1.8
4 53
9.4
3.5
1 49
7.0
1.1
1 05
3.6
0.7
1 00
5.4
0.7
1 43
4.6
1.0
10 5
65.8
7.3
6 40
4.5
4.6
555.
50.
4
(9) O
ther
reve
nue
5 72
7.9
4.9
8 88
6.4
7.3
6 92
2.5
5.9
6 46
6.8
5.1
5 46
5.9
4.2
8 61
3.8
6.2
8 70
6.4
5.8
9 97
3.4
6.9
7 25
8.2
5.0
1 34
9.1
0.9
17 1
91.0
12.4
15 7
31.7
9.9
(10)
TOT
AL R
EVEN
UE11
7 56
3.0
100
121
584.
410
011
7 62
5.6
100
127
795.
310
013
0 00
0.0
100
139
540.
510
014
9 50
3.7
100
143
940.
110
014
6 02
7.4
100
144
089.
210
013
9 02
3.2
100
158
642.
610
0
= (7
) + (8
) + (9
) %
GNI
0.95
0.97
1.00
1.04
1.02
1.08
1.14
1.03
1.00
0.97
0.91
1.00
p.m. E
U GN
I12
439
593
.212
486
466
.611
772
274
.312
307
018
.912
686
953
.912
923
080
.413
061
072
.613
921
700
.414
621
241
.514
790
681
.115
285
089
.915
886
712
.5
(*)
The
fact
that
pay
men
ts fo
r the
UK
corre
ctio
n do
not
add
up
to z
ero
is d
ue to
exc
hang
e-ra
te d
iffer
ence
s�(**
) Th
e ca
tego
ry ‘O
ther
pay
men
ts f
rom
/to M
embe
r Sta
tes’
incl
udes
:
— 2
000-
2001
rest
itutio
ns to
Gre
ece,
Spa
in a
nd P
ortu
gal;
—
sin
ce 2
003
the
just
ice
and
hom
e aff
airs
adj
ustm
ent,
and
from
201
4 th
e fr
eedo
m, s
ecur
ity a
nd ju
stic
e ad
just
men
t (w
hich
doe
s no
t add
up
to z
ero,
on
acco
unt o
f ex
chan
ge-r
ate
diffe
renc
es)
—
adj
ustm
ent f
or th
e re
impl
emen
tatio
n of
the
2007
ow
n-re
sour
ces
deci
sion
and
201
4 ow
n-re
sour
ces
deci
sion
;
— re
duct
ion
in G
NI-
base
d ow
n re
sour
ce g
rant
ed to
Den
mar
k, th
e N
ethe
rland
s an
d Sw
eden
;
— n
ettin
g of
adj
ustm
ents
to th
e VA
T an
d G
NI-
base
d ow
n re
sour
ces
for p
revi
ous
finan
cial
yea
rs�
(***)
TOR
colle
ctio
n co
sts
(10
%, a
nd f
rom
200
1 un
til 2
014:
25
%, a
nd s
ince
201
4: 2
0 %
) hav
e be
en re
cord
ed a
s ne
gativ
e re
venu
e� 1
5 %
of
the
2001
am
ount
s w
ere
reco
rded
in 2
002�
(****
) ES
A95
GN
I rep
lace
d ES
A79
GN
P as
of
2002
�(**
***)
ESA2
010
GN
I rep
lace
d ES
A95
GN
I as
of 2
014�

70
EU budget 2018 — Financial report
Anne
x 2c
� Exp
endi
ture
and
rev
enue
by
Mem
ber
Stat
e 20
18 (m
illio
n EU
R)Ex
plan
ator
y no
tes
on c
once
pts
used
in th
is a
nnex
can
be
foun
d in
the
glos
sary
(Ann
ex 6
)
1a. Competitiveness
1b. Cohesion
2. Natural resources
3. Security and citizenship
4. Global Europe
5. Administration
6. Compensations
8. Negative reserve
9. Special instruments
TOTAL
VAT-based own resource
GNI-based own resource
UK correction
Adjustment retro-active implementation of the 2014 own resources decision — NC
Netting of adjustments to the VAT and GNI-based own resources for previous financial years
Lump sum reduction granted to DK, NL and SE
FSJ adjustment for DK, IE and UK
National contribution
TOR collected on behalf of the EU (net, 80 %)
Total own resources
Sugar levies (gross, 100 %)
Customs duties (gross, 100 %)
TOR collection costs (20 %)
BE1
757.
453
3.9
707.
634
6.8
0.0
5 16
7.6
0.0
0.0
0.3
8 51
3.6
589.
63
009.
724
1.0
0.0
-36.
531
.44.
63
839.
82
084.
15
923.
9-5
.62
612.
2-5
22.4
BG72
.298
8.2
1 03
0.1
58.1
5.6
12.2
0.0
0.0
2.3
2 16
8.6
78.9
378.
829
.40.
0-4
.13.
70.
548
7.1
96.4
583.
50.
012
0.5
-24.
1
CZ12
7.9
2 77
7.0
1 18
4.9
17.5
0.0
15.9
0.0
0.0
0.0
4 12
3.2
254.
01
356.
010
9.1
0.0
-14.
513
.61.
91
720.
126
6.6
1 98
6.8
0.0
333.
3-6
6.7
DK31
1.0
68.3
940.
019
.20.
072
.70.
00.
00.
01
411.
234
5.9
2 18
8.4
167.
60.
0-2
5.0
-120
.4-1
5.3
2 54
1.2
337.
52
878.
7-3
.442
6.1
-85.
2
DE2
588.
62
804.
76
165.
626
1.4
0.0
233.
60.
00.
00.
012
053
.92
085.
122
866
.132
0.0
0.0
-279
.023
9.7
34.7
25 2
66.7
3 99
9.8
29 2
66.5
-28.
55
035.
3-1
007
.1
EE72
.137
5.2
266.
136
.70.
09.
30.
00.
00.
075
9.4
36.5
160.
812
.90.
0-1
.91.
70.
221
0.2
33.0
243.
20.
041
.2-8
.2
IE21
3.5
203.
91
560.
024
.50.
061
.80.
00.
00.
02
063.
725
0.1
1 92
8.2
152.
20.
0-2
0.0
17.7
-8.1
2 32
0.2
285.
12
605.
3-0
.735
7.3
-71.
5
EL26
8.7
1 42
9.2
2 70
8.6
424.
70.
032
.80.
00.
06.
14
870.
116
3.2
1 22
6.3
99.0
0.0
-15.
412
.71.
91
487.
718
0.2
1 66
7.9
0.0
225.
3-4
5.1
ES1
366.
54
263.
06
300.
522
1.1
0.0
116.
10.
00.
03.
212
270
.41
629.
08
039.
164
8.3
0.0
-98.
583
.912
.110
313
.91
528.
111
842
.00.
01
910.
1-3
82.0
FR2
533.
32
094.
59
505.
816
7.8
0.0
430.
30.
00.
046
.514
778
.33
218.
116
060
.01
300.
10.
0-1
96.0
166.
924
.420
573
.51
647.
022
220
.5-2
7.0
2 09
2.4
-418
.5
HR56
.755
2.4
480.
314
.57.
39.
10.
00.
00.
01
120.
378
.134
5.2
27.5
0.0
-4.0
3.5
0.5
450.
836
.748
7.5
0.0
45.9
-9.2
IT1
588.
63
218.
95
006.
731
7.2
0.0
205.
60.
00.
00.
010
337
.02
321.
811
937
.095
8.9
0.0
-143
.612
3.0
18.0
15 2
15.1
1 81
7.0
17 0
32.1
-6.7
2 27
9.7
-455
.9
CY74
.189
.979
.414
.60.
06.
00.
00.
00.
026
3.9
31.2
137.
911
.10.
0-1
.51.
40.
218
0.3
23.1
203.
40.
028
.8-5
.8
LV62
.365
0.7
450.
721
.40.
09.
10.
00.
017
.71
211.
836
.318
3.0
14.8
0.0
-2.3
2.0
0.3
234.
042
.727
6.7
0.0
53.3
-10.
7
LT98
.01
187.
971
8.1
39.8
0.0
10.0
0.0
0.0
16.9
2 07
0.6
53.7
279.
123
.00.
0-3
.43.
00.
435
5.8
91.3
447.
10.
011
4.1
-22.
8
LU20
8.7
64.5
61.0
40.7
0.0
1 63
3.4
0.0
0.0
0.0
2 00
8.3
62.0
273.
821
.20.
0-3
.22.
70.
435
6.9
20.1
377.
00.
025
.1-5
.0
HU98
.14
435.
41
715.
831
.80.
416
.60.
00.
00.
06
298.
115
4.1
854.
966
.90.
0-9
.98.
61.
21
075.
819
3.1
1 26
8.9
0.0
241.
4-4
8.3
MT
17.3
67.4
16.0
48.0
0.0
7.3
0.0
0.0
0.0
156.
017
.878
.56.
30.
0-0
.90.
80.
110
2.6
12.9
115.
40.
016
.1-3
.2
NL1
089.
917
2.3
877.
923
6.4
0.0
94.0
0.0
0.0
0.0
2 47
0.4
485.
15
045.
270
.80.
0-6
0.4
-703
.87.
74
844.
72
502.
97
347.
7-6
.53
136.
8-6
27.4
AT44
4.4
179.
81
238.
562
.70.
027
.30.
00.
00.
01
952.
651
8.3
2 72
2.2
36.5
0.0
-30.
526
.83.
83
277.
120
9.7
3 48
6.8
-2.5
265.
3-5
3.1
PL26
4.2
11 4
81.9
4 46
5.8
95.7
0.0
30.1
0.0
0.0
12.3
16 3
49.9
588.
13
138.
525
6.0
0.0
-37.
233
.14.
63
983.
273
5.0
4 71
8.2
0.0
918.
7-1
83.7
PT25
0.6
3 29
3.4
1 31
0.2
59.0
0.0
45.5
0.0
0.0
52.1
5 01
0.8
301.
51
293.
310
4.9
0.0
-15.
913
.62.
01
699.
417
5.9
1 87
5.3
0.0
219.
9-4
4.0
RO13
5.0
1 66
0.3
2 97
8.1
48.8
24.1
18.8
0.0
0.0
0.0
4 86
5.1
239.
11
310.
110
5.4
0.0
-15.
413
.71.
91
654.
717
5.8
1 83
0.5
0.0
219.
8-4
4.0
SI95
.155
0.0
256.
715
.40.
09.
60.
00.
00.
092
6.8
63.7
297.
924
.00.
0-3
.53.
20.
438
5.7
70.4
456.
10.
088
.0-1
7.6
SK16
8.3
1 61
4.3
653.
010
.20.
011
.40.
00.
00.
02
457.
296
.461
8.1
49.1
0.0
-7.1
6.2
0.9
763.
693
.485
7.0
0.0
116.
7-2
3.3
FI27
5.6
211.
391
0.8
37.2
0.0
42.9
0.0
0.0
0.0
1 47
7.7
301.
51
589.
812
7.1
0.0
-18.
616
.32.
42
018.
313
8.2
2 15
6.5
-0.5
173.
3-3
4.7
SE41
4.9
356.
991
5.4
86.3
0.0
40.8
0.0
0.0
0.0
1 81
4.2
316.
63
138.
344
.40.
0-3
9.7
-160
.84.
73
303.
549
4.1
3 79
7.6
-0.8
618.
6-1
23.7
UK1
658.
61
087.
83
600.
114
7.7
0.0
138.
90.
00.
00.
06
633.
13
309.
015
323
.6-5
026
.50.
0-2
03.8
162.
0-1
02.5
13 4
61.9
2 94
1.6
16 4
03.5
-2.9
3 68
0.7
-736
.1
EU-2
816
311
.646
412
.856
103
.82
904.
837
.48
508.
30.
00.
015
7.4
130
436.
217
624
.810
5 78
0.0
0.9
0.0
-1 2
92.0
5.9
4.0
122
123.
720
231
.614
2 35
5.4
-85.
125
395
.9-5
079
.2
non-
EU1
094.
213
.610
4.5
60.7
7 30
1.8
541.
30.
00.
00.
09
116.
1Su
rplu
s fr
om p
revi
ous
year
555.
5p.m
. am
ount
of U
K co
rrect
ion
(201
7; 2
nd u
pdat
e):
4 99
4.5
othe
r2
684.
413
0.0
11.0
25.5
1 68
2.3
448.
90.
00.
00.
04
982.
1Su
rplu
s EA
GGF-
Guar
ante
e0.
0
assig
ned
1 31
7.8
7 91
1.9
1 82
6.5
116.
849
7.8
444.
90.
00.
022
.412
138
.3Su
rplu
s ex
tern
al a
id g
uara
ntee
fund
0.0
TOTA
L21
408
.154
468
.458
045
.83
107.
89
519.
39
943.
50.
00.
017
9.8
156
672.
7Ot
her r
even
ue15
731
.7
TOTA
L15
8 64
2.6

71
SECTION V — ANNEXES
Anne
x 2d
� Exp
endi
ture
allo
cate
d fr
om r
elev
ant
assi
gned
rev
enue
s (*
) by
Mem
ber
Stat
es (m
illio
n EU
R)
Mar
ket-
rela
ted
expe
nditu
re a
nd d
irect
aid
sTo
tal n
atur
al re
sour
ces
(H2)
Tota
l coh
esio
n po
licy
(Hea
ding
1b)
Expe
nditu
res
allo
cate
d fr
om
the
adop
ted
appr
opria
tions
Expe
nditu
res
allo
cate
d fr
om
rele
vant
ass
igne
d re
venu
esTo
tal m
arke
t exp
endi
ture
an
d di
rect
aid
sEx
pend
iture
s al
loca
ted
from
th
e ad
opte
d ap
prop
riatio
nsEx
pend
iture
s al
loca
ted
from
re
leva
nt a
ssig
ned
reve
nues
Gran
d to
tal H
2Ex
pend
iture
allo
cate
d fr
om
the
adop
ted
appr
opria
tions
Expe
nditu
re a
lloca
ted
from
re
leva
nt a
ssig
ned
reve
nues
Gran
d to
tal h
eadi
ng 1
b
(1)
(2)
(3) =
(1) +
(2)
(4)
(5) =
(2)
(6) =
(4) +
(5)
(7)
(8)
(9) =
(7) +
(8)
BE55
9.4
68.3
627.
770
7.6
74.2
781.
853
3.9
33.1
567.
0
BG81
7.0
0.0
817.
01
030.
10.
01
030.
198
8.2
22.2
1 01
0.4
CZ85
2.3
0.8
853.
11
184.
93.
11
188.
12
777.
012
1.8
2 89
8.8
DK84
2.4
2.1
844.
594
0.0
29.8
969.
868
.30.
068
.3
DE4
994.
516
.65
011.
26
165.
633
.36
199.
02
804.
713
5.2
2 93
9.9
EE12
6.2
0.0
126.
226
6.1
6.6
272.
737
5.2
132.
750
7.9
IE1
220.
66.
71
227.
31
560.
010
.51
570.
520
3.9
16.4
220.
3
EL2
112.
37.
72
120.
02
708.
635
.92
744.
51
429.
220
3.9
1 63
3.1
ES5
315.
627
1.8
5 58
7.4
6 30
0.5
319.
56
620.
04
263.
01
421.
65
684.
5
FR7
773.
659
.97
833.
59
505.
821
8.8
9 72
4.6
2 09
4.5
380.
92
475.
4
HR24
9.6
0.3
249.
948
0.3
12.8
493.
255
2.4
46.5
598.
8
IT3
882.
844
6.2
4 32
9.0
5 00
6.7
730.
55
737.
23
218.
91
210.
54
429.
3
CY57
.90.
057
.979
.41.
380
.789
.978
.016
7.9
LV23
7.2
0.3
237.
545
0.7
9.6
460.
365
0.7
7.0
657.
7
LT49
2.3
0.0
492.
371
8.1
2.7
720.
91
187.
911
2.2
1 30
0.1
LU36
.20.
036
.361
.00.
061
.064
.56.
070
.5
HU1
320.
60.
61
321.
21
715.
81.
91
717.
74
435.
436
5.1
4 80
0.5
MT
5.4
0.0
5.4
16.0
1.8
17.8
67.4
9.3
76.7
NL76
9.5
11.0
780.
587
7.9
14.5
892.
317
2.3
3.2
175.
5
AT71
5.3
4.8
720.
21
238.
55.
31
243.
817
9.8
46.4
226.
1
PL3
434.
60.
43
435.
04
465.
814
.74
480.
511
481
.91
756.
613
238
.5
PT76
8.9
2.1
770.
91
310.
226
.21
336.
33
293.
438
5.1
3 67
8.5
RO1
812.
80.
01
812.
82
978.
14.
02
982.
11
660.
376
6.2
2 42
6.5
SI14
2.7
0.0
142.
725
6.7
4.2
260.
955
0.0
64.5
614.
6
SK44
8.3
0.2
448.
565
3.0
0.8
653.
81
614.
320
0.4
1 81
4.7
FI53
1.4
1.1
532.
591
0.8
4.7
915.
421
1.3
18.1
229.
4
SE69
6.3
1.7
698.
091
5.4
13.8
929.
235
6.9
8.1
365.
0
UK2
949.
423
9.1
3 18
8.6
3 60
0.1
246.
13
846.
21
087.
835
4.1
1 44
1.9
EU-2
843
165
.31
141.
844
307
.056
103
.81
826.
557
930
.346
412
.87
905.
054
317
.8
(*) E
xpen
ditu
re e
ffect
uate
d re
gula
rly f
rom
reve
nues
aris
ing
mai
nly
from
reco
verie
s es
tabl
ishe
d du
ring
the
clea
ring
exer
cise
� (N
B: T
hese
exp
endi
ture
s ar
e no
t par
t of
the
oper
ativ
e bu
dget
ary
bala
nce
calc
ulat
ion
beca
use
it is
not
fina
nced
by
own
reso
urce
s�)

72
EU budget 2018 — Financial report
Annex 3
Operating budgetary balances
Methodology and calculationMember States’ operating budgetary balances are calculated based on data on the allocation of EU expenditure by Member State and on Member States’ contributions to the EU budget� It is important to point out, however, that estimating operating budgetary balances is merely an accounting exercise that shows certain financial costs and benefits derived from the EU by each Member State� Furthermore, this accounting allocation is non-exhaustive and gives no indication of the many other benefits arising from EU policies, such as those relating to the single market and economic integration, not to mention political stability and security�
Because of the prevalence of this calculation in the perception of fair burden sharing in relation to the EU budget, it is important to clarify further that certain elements of EU added value are not captured by this methodology, such as:
• collective, cross-border and other indirect benefits arising from budgetary interventions and the supply and demand effects they trigger in Member States other than the immediate recipient of an allocation;
• synergies and global economies of scale resulting from EU cooperation at all levels instead of financing 28 separate policies or programmes;
• ‘multiplication effects’ of investment flows leveraged through the increased use of financial instruments and guarantee schemes underpinned by EU budget support�
The operating budgetary balance of each Member State is calculated as the difference between the operating expenditure (excluding administration) (20) allocated to each Member State and the adjusted ‘national contribution’ (21) of each Member State as follows:
OBBi = TAEi − H5i − TNCi × TAEEU − H5EU ,
TNCEU
where:OBBi = operating budgetary balance of Member State i, where i = 1.28;
TAEi = total allocated expenditure of Member State i, where i = 1.28 or i = EU for the EU as a whole;
H5i = administrative expenditure allocated to Member State i, where i = 1.28 or i = EU for the EU as a whole;
TNCi = total national contribution of Member State i, with i = 1.28 or i = EU for the EU as a whole.
(20) In accordance with point 75 of the conclusions of the 1999 European Council in Berlin: ‘When referring to budgetary imbalances, the Commission, for presentational purposes, will base itself on operating expenditure�’
(21) As in the case of the calculation of the United Kingdom correction it is not the actual ‘national contribution’ of Member States (i�e� own-resources payments, excluding TORs, e�g� customs duties and sugar levies) but the related allocation key (i�e� each Member State’s share of total ‘national contributions’) that is used for the calculation of operating budgetary balances� Total ‘national contributions’ are adjusted to equal total EU allocated operating expenditure, so that operating budgetary balances sum to zero� TORs are not included in the calculation of net balances� Since TORs are a direct result of the application of common policies (such as the common agricultural policy and the customs union) they are considered to be pure EU revenue rather than ‘national contributions’� Furthermore, the economic agent bearing the burden of the customs duty imposed is not always a resident of the Member State collecting the duty�

73
SECTION V — ANNEXES
Numerical example — 2018 operating budgetary balance of Belgium:
TAEBE = EUR 8 513�6 million; H5BE = EUR 5 167�6 million; TNCBE = EUR 3 839�8 million; TAEEU = EUR 130 436�2 million; H5EU = EUR 8 508�3 million; TNCEU = EUR 122 123�7 million:
OBBBE = 8 513.6 – 5 167.6 – 3 839.8 × 130 436.2 – 8 508.3
= EUR − 487.6 million122 123.7
Operating budgetary balances — listed below — show the relationship between a Member State’s share of total allocated EU operating expenditure and its share of ‘national contributions’�

74
EU budget 2018 — Financial report
Annex 3 — 2000-2018 Operating budgetary balances (excluding administrative expenditure and TOR, and including UK correction)
2000 2001 2002 2003 2004 2005 2006 2007 2008 2009 (*) 2010 2011 2012
million EUR
% GNI million EUR
% GNI million EUR
% GNI million EUR
% GNI million EUR
% GNI million EUR
% GNI million EUR
% GNI million EUR
% GNI million EUR
% GNI million EUR
% GNI million EUR
% GNI million EUR
% GNI million EUR
% GNI
BE – 323.2 – 0.13 % – 745.2 – 0.28 % – 517.7 – 0.19 % – 779.7 – 0.28 % – 536.1 – 0.18 % – 607.5 – 0.20 % – 709.9 – 0.22 % – 868.2 – 0.26 % – 720.6 – 0.21 % – 1 663.9 – 0.49 % – 1 466.4 – 0.41 % – 1 369.6 – 0.37 % – 1 493.7 – 0.40 %
BG n a n a n a n a n a n a n a n a n a n a n a n a n a n a + 335.1 + 1.17 % + 669.6 + 1.98 % + 624.2 + 1.83 % + 895.5 + 2.53 % + 725.4 + 1.95 % + 1 329.7 + 3.39 %
CZ n a n a n a n a n a n a n a n a + 272.2 + 0.31 % + 178.0 + 0.18 % + 386.2 + 0.34 % + 656.7 + 0.54 % + 1 178.0 + 0.80 % + 1 702.5 + 1.28 % + 2 079.3 + 1.50 % + 1 455.2 + 1.00 % + 3 045.2 + 2.15 %
DK + 239.6 + 0.14 % – 223.1 – 0.13 % – 169.1 – 0.09 % – 220.0 – 0.12 % – 224.6 – 0.11 % – 265.3 – 0.13 % – 505.2 – 0.23 % – 604.4 – 0.26 % – 543.2 – 0.23 % – 969.5 – 0.43 % – 615.3 – 0.25 % – 836.6 – 0.34 % – 1 126.0 – 0.45 %
DE – 8 232.4 – 0.41 % – 6 971.5 – 0.34 % – 4 954.0 – 0.24 % – 7 605.4 – 0.36 % – 7 140.4 – 0.32 % – 6 064.3 – 0.27 % – 6 325.2 – 0.27 % – 7 415.2 – 0.30 % – 8 774.3 – 0.35 % – 6 357.5 – 0.26 % – 9 223.6 – 0.36 % – 9 002.5 – 0.34 % – 11 953.8 – 0.44 %
EE n a n a n a n a n a n a n a n a + 145.0 + 1.57 % + 154.3 + 1.43 % + 176.4 + 1.39 % + 226.2 + 1.51 % + 227.4 + 1.47 % + 573.0 + 4.23 % + 672.7 + 4.96 % + 350.4 + 2.28 % + 785.3 + 4.74 %
IE + 1 719.5 + 1.89 % + 1 198.3 + 1.21 % + 1 574.1 + 1.45 % + 1 559.0 + 1.30 % + 1 593.8 + 1.24 % + 1 136.6 + 0.81 % + 1 080.5 + 0.69 % + 662.1 + 0.40 % + 566.1 + 0.36 % – 47.5 – 0.04 % + 803.9 + 0.60 % + 383.8 + 0.29 % + 670.6 + 0.50 %
EL + 4 380.6 + 3.19 % + 4 503.6 + 3.08 % + 3 375.7 + 2.17 % + 3 358.3 + 1.97 % + 4 163.3 + 2.28 % + 3 900.5 + 2.05 % + 5 102.3 + 2.50 % + 5 437.2 + 2.51 % + 6 279.7 + 2.78 % + 3 121.0 + 1.38 % + 3 597.4 + 1.67 % + 4 622.6 + 2.28 % + 4 544.9 + 2.33 %
ES + 5 263.6 + 0.84 % + 7 661.2 + 1.14 % + 8 859.4 + 1.23 % + 8 704.9 + 1.12 % + 8 502.3 + 1.02 % + 6 017.8 + 0.67 % + 3 811.7 + 0.39 % + 3 651.8 + 0.36 % + 2 813.2 + 0.27 % + 1 181.7 + 0.12 % + 4 100.9 + 0.40 % + 2 995.0 + 0.29 % + 3 999.0 + 0.39 %
FR – 676.6 – 0.05 % – 2 043.4 – 0.13 % – 2 218.4 – 0.14 % – 1 976.1 – 0.12 % – 3 050.7 – 0.18 % – 2 883.5 – 0.17 % – 3 012.5 – 0.16 % – 2 997.3 – 0.16 % – 3 842.7 – 0.20 % – 5 872.7 – 0.31 % – 5 534.8 – 0.28 % – 6 405.8 – 0.31 % – 8 297.5 – 0.40 %
HR n a n a n a n a n a n a n a n a n a n a n a n a n a n a n a n a n a n a n a n a n a n a n a n a n a n a
IT + 1 231.2 + 0.10 % – 2 030.9 – 0.16 % – 2 917.1 – 0.23 % – 849.8 – 0.06 % – 2 946.9 – 0.21 % – 2 199.0 – 0.15 % – 1 731.8 – 0.12 % – 2 013.5 – 0.13 % – 4 101.4 – 0.26 % – 5 058.5 – 0.33 % – 4 534.0 – 0.29 % – 5 933.0 – 0.38 % – 5 058.1 – 0.32 %
CY n a n a n a n a n a n a n a n a + 63.5 + 0.53 % + 90.3 + 0.69 % + 102.4 + 0.73 % – 10.5 – 0.07 % – 17.7 – 0.10 % – 2.3 – 0.01 % + 10.6 + 0.06 % + 6.9 + 0.04 % – 25.2 – 0.15 %
LV n a n a n a n a n a n a n a n a + 197.7 + 1.81 % + 263.9 + 2.07 % + 255.5 + 1.65 % + 488.8 + 2.40 % + 407.0 + 1.80 % + 501.5 + 2.52 % + 674.2 + 3.67 % + 731.3 + 3.59 % + 955.9 + 4.30 %
LT n a n a n a n a n a n a n a n a + 369.3 + 2.06 % + 476.4 + 2.31 % + 585.3 + 2.48 % + 793.2 + 2.87 % + 842.6 + 2.68 % + 1 493.3 + 5.51 % + 1 358.4 + 5.00 % + 1 368.0 + 4.59 % + 1 514.0 + 4.75 %
LU – 54.6 – 0.28 % – 140.0 – 0.70 % – 48.1 – 0.24 % – 57.2 – 0.29 % – 93.6 – 0.39 % – 86.8 – 0.33 % – 60.2 – 0.23 % – 139.8 – 0.46 % – 22.1 – 0.07 % – 100.2 – 0.43 % – 41.9 – 0.15 % – 75.0 – 0.26 % – 79.5 – 0.27 %
HU n a n a n a n a n a n a n a n a + 193.4 + 0.25 % + 590.1 + 0.70 % + 1 115.0 + 1.32 % + 1 605.9 + 1.74 % + 1 111.7 + 1.13 % + 2 719.4 + 3.11 % + 2 748.4 + 3.00 % + 4 418.3 + 4.71 % + 3 280.4 + 3.58 %
MT n a n a n a n a n a n a n a n a + 45.0 + 0.98 % + 90.0 + 1.91 % + 101.0 + 2.01 % + 28.1 + 0.52 % + 30.0 + 0.52 % + 8.6 + 0.16 % + 52.9 + 0.88 % + 67.0 + 1.05 % + 71.4 + 1.11 %
NL – 1 543.9 – 0.36 % – 2 259.9 – 0.50 % – 2 171.3 – 0.46 % – 1 942.2 – 0.40 % – 2 034.9 – 0.40 % – 2 636.6 – 0.51 % – 2 587.6 – 0.47 % – 2 864.3 – 0.49 % – 2 678.2 – 0.46 % + 117.7 + 0.02 % – 1 833.1 – 0.32 % – 2 214.0 – 0.37 % – 2 364.5 – 0.39 %
AT – 435.5 – 0.21 % – 542.4 – 0.26 % – 212.6 – 0.10 % – 330.9 – 0.15 % – 365.1 – 0.16 % – 277.9 – 0.11 % – 301.5 – 0.12 % – 563.2 – 0.21 % – 356.4 – 0.13 % – 402.1 – 0.15 % – 677.0 – 0.24 % – 805.1 – 0.27 % – 1 073.3 – 0.35 %
PL n a n a n a n a n a n a n a n a + 1 438.3 + 0.72 % + 1 853.2 + 0.77 % + 2 997.6 + 1.13 % + 5 136.4 + 1.71 % + 4 441.7 + 1.25 % + 6 337.1 + 2.11 % + 8 427.5 + 2.47 % + 10 975.1 + 3.09 % + 11 997.2 + 3.29 %
PT + 2 128.2 + 1.71 % + 1 773.8 + 1.35 % + 2 682.7 + 1.94 % + 3 476.3 + 2.45 % + 3 124.0 + 2.11 % + 2 378.0 + 1.56 % + 2 291.7 + 1.47 % + 2 474.4 + 1.51 % + 2 695.1 + 1.63 % + 2 150.7 + 1.33 % + 2 622.6 + 1.57 % + 2 983.7 + 1.81 % + 5 027.2 + 3.13 %
RO n a n a n a n a n a n a n a n a n a n a n a n a n a n a + 595.8 + 0.50 % + 1 581.0 + 1.16 % + 1 692.5 + 1.45 % + 1 245.2 + 1.01 % + 1 451.5 + 1.12 % + 2 031.6 + 1.57 %
SI n a n a n a n a n a n a n a n a + 109.7 + 0.41 % + 101.5 + 0.36 % + 142.8 + 0.47 % + 88.6 + 0.26 % + 113.8 + 0.31 % + 241.9 + 0.69 % + 424.1 + 1.21 % + 490.1 + 1.37 % + 572.2 + 1.64 %
SK n a n a n a n a n a n a n a n a + 169.2 + 0.52 % + 270.9 + 0.72 % + 323.2 + 0.75 % + 617.8 + 1.16 % + 725.6 + 1.15 % + 542.1 + 0.87 % + 1 349.6 + 2.10 % + 1 160.6 + 1.72 % + 1 597.0 + 2.30 %
FI + 275.9 + 0.21 % – 153.0 – 0.11 % – 4.9 – 0.00 % – 26.7 – 0.02 % – 69.6 – 0.05 % – 84.8 – 0.05 % – 241.0 – 0.14 % – 171.6 – 0.10 % – 318.5 – 0.17 % – 544.2 – 0.31 % – 300.2 – 0.17 % – 652.1 – 0.34 % – 658.8 – 0.34 %
SE – 1 058.7 – 0.40 % – 982.9 – 0.39 % – 750.4 – 0.28 % – 945.6 – 0.33 % – 1 059.8 – 0.36 % – 866.9 – 0.29 % – 856.6 – 0.27 % – 994.8 – 0.29 % – 1 463.1 – 0.42 % – 85.6 – 0.03 % – 1 211.4 – 0.34 % – 1 325.4 – 0.34 % – 1 925.1 – 0.46 %
UK – 2 913.7 – 0.18 % + 955.4 + 0.06 % – 2 528.4 – 0.15 % – 2 364.9 – 0.14 % – 2 864.9 – 0.16 % – 1 529.0 – 0.08 % – 2 140.2 – 0.11 % – 4 155.3 – 0.20 % – 844.3 – 0.05 % – 1 903.3 – 0.12 % – 5 625.9 – 0.32 % – 5 565.6 – 0.31 % – 7 366.1 – 0.38 %
EU 0.0 0.00 % 0.0 0.00 % 0.0 0.00 % 0.0 0.00 % 0.0 0.00 % 0.0 0.00 % 0.0 0.00 % 0.0 0.00 % 0.0 0.00 % 0.0 0.00 % 0.0 0.00 % 0.0 0.00 % 0.0 0.00 %
NOTESOperating budgetary balances’ are calculated, for a given Member State, as the difference between allocated operating expenditure (i�e� exluding administration) and own resources payments (excluding TOR)�
These payments are adjusted to sum up to total allocated operating expenditure (as for calculating the UK correction), so that operating budgetary balances add up to zero�
Please refer to the numerical example for details on the above calculations� Series as a percentage of GNI are calculated on the basis of GNI data, as published by DG Economic and Financial Affairs in its spring 2016 economic forecasts (GNI/ESA 2010)�

75
SECTION V — ANNEXES
2013 2014 2015 2016 (°) 2017 2018 2007 (**) 2008 (**) 2009 (***) 2014 (°°) 2015 (°°) 2016 (°°°)
million EUR
% GNI million EUR
% GNI million EUR
% GNI million EUR
% GNI million EUR
% GNI million EUR
% GNI million EUR
% GNI million EUR
% GNI million EUR
% GNI million EUR
% GNI million EUR
% GNI million EUR
% GNI
BE – 1 541.1 – 0.40 % – 1 478.1 – 0.37 % – 1 387.8 – 0.33 % – 1 533.9 – 0.36 % – 715.7 – 0.16 % – 487.6 – 0.11 % – 965.9 – 0.28 % – 838.7 – 0.24 % – 1 452.7 – 0.43 % – 1 598.2 – 0.40 % – 1 518.3 – 0.37 % – 1 161.4 – 0.28 %
BG + 1 529.0 + 3.91 % + 1 824.3 + 4.45 % + 2 279.4 + 5.33 % + 1 946.5 + 4.15 % + 1 471.3 + 2.92 % + 1 670.1 + 3.01 % + 327.7 + 1.15 % + 658.7 + 1.95 % + 642.2 + 1.88 % + 1 815.9 + 4.43 % + 2 273.8 + 5.31 % + 1 959.2 + 4.17 %
CZ + 3 401.1 + 2.44 % + 3 004.2 + 2.08 % + 5 699.4 + 3.77 % + 3 221.8 + 1.96 % + 2 479.5 + 1.37 % + 2 390.0 + 1.22 % + 625.6 + 0.51 % + 1 133.9 + 0.77 % + 1 776.8 + 1.34 % + 2 948.4 + 2.04 % + 5 631.2 + 3.72 % + 3 340.2 + 2.04 %
DK – 1 277.1 – 0.49 % – 836.0 – 0.32 % – 790.4 – 0.29 % – 638.9 – 0.22 % – 702.6 – 0.24 % – 1 198.6 – 0.39 % – 673.7 – 0.29 % – 625.2 – 0.26 % – 821.0 – 0.36 % – 769.5 – 0.29 % – 703.6 – 0.26 % – 783.7 – 0.28 %
DE – 13 824.8 – 0.49 % – 15 501.6 – 0.52 % – 14 306.8 – 0.46 % – 10 988.0 – 0.34 % – 10 675.4 – 0.32 % – 13 405.9 – 0.39 % – 6 521.5 – 0.26 % – 7 836.0 – 0.31 % – 8 107.3 – 0.33 % – 14 523.5 – 0.49 % – 13 210.6 – 0.43 % – 12 944.7 – 0.40 %
EE + 771.4 + 4.33 % + 473.8 + 2.49 % + 242.9 + 1.21 % + 478.8 + 2.34 % + 471.1 + 2.09 % + 540.3 + 2.15 % + 222.3 + 1.48 % + 222.0 + 1.44 % + 582.0 + 4.37 % + 469.0 + 2.46 % + 239.4 + 1.20 % + 486.2 + 2.37 %
IE + 279.1 + 0.20 % + 38.8 + 0.02 % + 349.3 + 0.19 % + 181.4 + 0.08 % – 172.6 – 0.07 % – 314.5 – 0.12 % + 619.0 + 0.38 % + 512.6 + 0.33 % + 47.0 + 0.04 % – 54.2 – 0.03 % + 268.1 + 0.15 % + 348.6 + 0.16 %
EL + 5 340.7 + 2.94 % + 5 162.6 + 2.89 % + 4 934.0 + 2.80 % + 4 286.3 + 2.43 % + 3 740.7 + 2.10 % + 3 352.0 + 1.83 % + 5 382.9 + 2.48 % + 6 201.0 + 2.75 % + 3 251.5 + 1.44 % + 5 130.2 + 2.88 % + 4 891.1 + 2.77 % + 4 346.0 + 2.47 %
ES + 3 058.3 + 0.30 % + 1 090.6 + 0.10 % + 4 527.4 + 0.42 % + 1 678.1 + 0.15 % + 729.4 + 0.06 % + 1 856.9 + 0.15 % + 3 379.4 + 0.33 % + 2 460.8 + 0.23 % + 1 794.3 + 0.17 % + 860.3 + 0.08 % + 4 273.2 + 0.40 % + 2 113.7 + 0.19 %
FR – 8 445.7 – 0.40 % – 7 164.6 – 0.33 % – 5 522.5 – 0.25 % – 9 216.3 – 0.41 % – 4 569.3 – 0.20 % – 6 192.6 – 0.26 % – 3 500.9 – 0.18 % – 4 494.9 – 0.23 % – 4 739.4 – 0.25 % – 7 763.0 – 0.36 % – 6 210.1 – 0.28 % – 8 173.6 – 0.36 %
HR + 49.6 + 0.12 % + 173.6 + 0.42 % + 226.7 + 0.52 % + 516.5 + 1.17 % + 261.9 + 0.55 % + 661.1 + 1.31 % n a n a n a n a n a n a + 167.3 + 0.40 % + 217.3 + 0.50 % + 529.5 + 1.20 %
IT – 3 789.9 – 0.24 % – 4 467.0 – 0.28 % – 2 638.7 – 0.16 % – 3 206.8 – 0.19 % – 3 577.8 – 0.21 % – 5 059.4 – 0.29 % – 2 479.7 – 0.16 % – 4 636.6 – 0.30 % – 4 079.2 – 0.27 % – 4 825.5 – 0.30 % – 3 274.0 – 0.20 % – 2 336.8 – 0.14 %
CY + 40.4 + 0.25 % + 114.8 + 0.69 % – 23.4 – 0.13 % + 21.2 + 0.12 % + 50.8 + 0.27 % + 77.9 + 0.39 % – 14.5 – 0.10 % – 23.1 – 0.14 % + 6.9 + 0.04 % + 110.7 + 0.67 % – 30.7 – 0.18 % + 30.9 + 0.18 %
LV + 801.2 + 3.44 % + 799.8 + 3.35 % + 759.4 + 3.12 % + 504.3 + 2.01 % + 527.3 + 1.98 % + 969.1 + 3.31 % + 483.7 + 2.38 % + 399.5 + 1.76 % + 513.6 + 2.58 % + 796.8 + 3.34 % + 754.7 + 3.10 % + 510.9 + 2.04 %
LT + 1 514.5 + 4.54 % + 1 543.2 + 4.38 % + 540.3 + 1.51 % + 1 142.8 + 3.09 % + 1 265.5 + 3.14 % + 1 705.5 + 3.96 % + 785.9 + 2.84 % + 832.3 + 2.65 % + 1 510.6 + 5.57 % + 1 537.5 + 4.37 % + 536.2 + 1.50 % + 1 154.6 + 3.12 %
LU – 69.4 – 0.22 % + 80.1 + 0.27 % – 94.0 – 0.27 % + 7.5 + 0.02 % + 13.9 + 0.04 % + 18.5 + 0.04 % – 147.8 – 0.49 % – 31.9 – 0.11 % – 82.8 – 0.35 % + 76.6 + 0.26 % – 99.0 – 0.29 % + 12.0 + 0.03 %
HU + 4 954.5 + 5.33 % + 5 681.6 + 5.64 % + 4 636.5 + 4.38 % + 3 580.9 + 3.30 % + 3 137.5 + 2.66 % + 5 207.4 + 4.11 % + 1 578.1 + 1.71 % + 1 078.9 + 1.09 % + 2 772.1 + 3.17 % + 5 654.6 + 5.62 % + 4 613.9 + 4.36 % + 3 625.1 + 3.34 %
MT + 88.0 + 1.31 % + 179.4 + 2.35 % + 31.7 + 0.37 % + 118.8 + 1.27 % + 104.7 + 1.00 % + 46.2 + 0.41 % + 26.7 + 0.49 % + 28.2 + 0.49 % + 11.7 + 0.21 % + 178.0 + 2.33 % + 30.4 + 0.35 % + 121.3 + 1.30 %
NL – 2 675.1 – 0.45 % – 4 711.1 – 0.71 % – 3 695.2 – 0.54 % – 308.7 – 0.04 % – 1 391.6 – 0.19 % – 2 460.5 – 0.31 % – 1 766.4 – 0.30 % – 1 551.0 – 0.27 % – 2 026.2 – 0.36 % – 3 708.1 – 0.56 % – 2 663.4 – 0.39 % – 2 071.5 – 0.30 %
AT – 1 251.7 – 0.40 % – 1 240.6 – 0.38 % – 851.1 – 0.25 % – 967.9 – 0.28 % – 933.1 – 0.25 % – 1 346.5 – 0.35 % – 545.5 – 0.20 % – 341.4 – 0.12 % – 431.5 – 0.16 % – 1 343.3 – 0.41 % – 962.2 – 0.29 % – 791.3 – 0.23 %
PL + 12 237.1 + 3.29 % + 13 748.0 + 3.47 % + 9 483.1 + 2.31 % + 6 973.1 + 1.71 % + 8 565.9 + 1.92 % + 12 343.1 + 2.59 % + 5 060.4 + 1.69 % + 4 330.3 + 1.22 % + 6 488.5 + 2.16 % + 13 676.1 + 3.45 % + 9 383.6 + 2.28 % + 7 125.8 + 1.75 %
PT + 4 416.7 + 2.72 % + 3 211.3 + 1.88 % + 981.2 + 0.56 % + 1 717.3 + 0.95 % + 2 437.2 + 1.29 % + 3 268.6 + 1.66 % + 2 433.4 + 1.48 % + 2 642.1 + 1.59 % + 2 242.8 + 1.39 % + 3 165.7 + 1.85 % + 930.7 + 0.53 % + 1 792.9 + 0.99 %
RO + 4 142.8 + 2.99 % + 4 519.9 + 3.09 % + 5 154.5 + 3.27 % + 5 961.6 + 3.62 % + 3 380.9 + 1.85 % + 3 194.2 + 1.61 % + 562.0 + 0.47 % + 1 537.9 + 1.13 % + 1 755.8 + 1.51 % + 4 498.4 + 3.07 % + 5 130.9 + 3.26 % + 5 993.9 + 3.64 %
SI + 429.2 + 1.22 % + 794.4 + 2.17 % + 578.9 + 1.51 % + 180.3 + 0.46 % + 145.1 + 0.34 % + 532.2 + 1.17 % + 80.3 + 0.24 % + 102.1 + 0.28 % + 261.6 + 0.75 % + 784.1 + 2.14 % + 567.5 + 1.48 % + 202.0 + 0.51 %
SK + 1 287.4 + 1.83 % + 1 010.1 + 1.37 % + 3 095.1 + 4.07 % + 1 986.0 + 2.49 % + 979.6 + 1.17 % + 1 683.4 + 1.90 % + 603.1 + 1.14 % + 705.7 + 1.12 % + 580.2 + 0.93 % + 993.6 + 1.35 % + 3 077.0 + 4.04 % + 2 018.6 + 2.53 %
FI – 604.0 – 0.31 % – 809.0 – 0.40 % – 488.3 – 0.23 % – 424.3 – 0.20 % – 275.4 – 0.12 % – 580.3 – 0.25 % – 223.2 – 0.12 % – 383.3 – 0.21 % – 430.3 – 0.25 % – 883.2 – 0.43 % – 570.4 – 0.27 % – 294.0 – 0.14 %
SE – 2 220.7 – 0.51 % – 2 312.7 – 0.52 % – 2 200.2 – 0.48 % – 946.4 – 0.20 % – 1 403.5 – 0.29 % – 1 524.8 – 0.32 % – 620.2 – 0.18 % – 1 090.7 – 0.32 % – 704.2 – 0.24 % – 1 982.5 – 0.45 % – 1 874.1 – 0.41 % – 1 569.1 – 0.33 %
UK – 8 641.7 – 0.46 % – 4 929.8 – 0.23 % – 11 521.4 – 0.46 % – 6 272.2 – 0.27 % – 5 345.1 – 0.23 % – 6 946.1 – 0.29 % – 4 711.3 – 0.23 % – 993.0 – 0.05 % – 1 362.9 – 0.09 % – 5 412.2 – 0.25 % – 11 702.5 – 0.46 % – 5 585.3 – 0.24 %
EU 0.0 0.00 % 0.0 + 0.00 % 0.0 + 0.00 % 0.0 + 0.00 % 0.0 + 0.00 % 0.0 + 0.00 % 0.0 0.0 0.0 0.0 0.0 0.0
(*) Including the adjustment relating to the implementation of the own-resources decision 2007(**) Including p�m� the retroactive effect of own-resources decision 2007(***) Without p�m� the adjustment relating to the implementation of the own-resources decision 2007
(°) Including the adjustment relating to the implementation of the 2014 own-resources decision� (°°) Including p�m� the retroactive effect of 2014 own-resources decision� (°°°) Without p�m� the adjustment relating to the implementation of the 2014 own-resources decision�

76
EU budget 2018 — Financial report
Annex 4
Recoveries and financial corrections
Summary of financial corrections and recoveries confirmed during 2018 (million EUR)
Financial corrections Recoveries 2018 total 2017 total
Agriculture:
EAGF 306 138 445 1 180
Rural development 195 178 372 338
Cohesion policy:
ERDF 286 - 286 246
Cohesion Fund 90 - 90 198
ESF 34 - 34 65
FIFG/EFF - - - 5
EAGGF Guidance - 3 3 1
Internal policy areas 2 247 249 391
External policy areas N/A 188 188 234
Administration N/A 3 3 3
Total confirmed in 2018 913 757 1 671
Total confirmed in 2017 1 729 933 2 662
These figures are taken from the 2018 Annual management and performance report for the EU budget�
The recovery of undue payments is the final stage in the operation of control systems� It is essential that recoveries be evaluated in order to demonstrate sound financial management� The aim of this annex is to provide the best possible estimate of the total amount of financial corrections and recoveries for 2018� Further details can be found in Annex 4 to the 2018 Annual management and performance report for the EU budget�
The table above lists the financial corrections and recoveries confirmed in 2018, resulting from audits carried out by the Commission, checks and audits carried out by the European Court of Auditors and investigations by the European Anti-Fraud Office� The figures include financial corrections confirmed during 2018, even if some of those corrections were not implemented in 2018�
There are a number of ways in which the Commission can recover undue payments if there is a clear case of a financial error or irregularity, depending on the fund concerned� These are explained below�
Net corrections leading to a reimbursement to the EU budget are characteristic of agriculture and rural development� With regard to agriculture, the European Agricultural Guarantee Fund and the European Agricultural Fund for Rural Development replaced the European Agricultural Guidance and Guarantee Fund� In the case of the European Agricultural Fund for Rural Development, financial corrections are almost always implemented by means of a recovery order� For the European Agricultural Guarantee Fund, financial corrections take the form of deductions from the monthly declarations�

77
SECTION V — ANNEXES
Financial corrections under the cohesion policy (for 2000-2006 and 2007-2013) are implemented as follows�
• The Member State accepts the correction required or proposed by the Commission� The Member State itself applies the financial correction, either through withdrawal or through recovery of funds paid� The amount may then be reused for other eligible operations that have incurred regular expenditure� In these cases there is no impact on the Commission’s accounts, as the level of EU funding for a specific programme is not reduced� The EU’s financial interests are thus protected against irregularities and fraud�
• The Member State disagrees with the correction required or proposed by the Commission, following a formal ‘contradictory’ procedure with the Member State� In this case the Commission adopts a formal financial correction decision and issues a recovery order to obtain repayment from the Member State� These cases lead to a net reduction in the EU’s contribution to the specific operational programme concerned�
The regulatory provisions for the 2014-2020 period significantly strengthen the Commission’s position on protecting the EU budget from irregular expenditure� During the accounting year the Commission retains 10 % of each interim payment until the finalisation of the national control cycle� The timely identification of deficiencies in the functioning of the management and control system and reporting of reliable error rates is in the Member States’ best interest, since the Commission will apply net financial corrections where audits by the EU or the European Court of Auditors detect a serious deficiency leading to a material level of risk in reimbursed expenditure that remained undetected, uncorrected and unreported by the Member State� In all other circumstances the Commission will continue to apply financial corrections as before, meaning that the Member State can still reuse the funds if it accepts the corrections and has sufficient additional new expenditure to replace the amounts withdrawn as irregular�

78
EU budget 2018 — Financial report
Summary of financial corrections confirmed during 2018 by Member State (million EUR)
EAGF Rural development
ERDF Cohesion Fund ESF Internal policy areas
TOTAL
BE 7 1 1 - 0 - 9
BG 4 5 - 2 - - 11
CZ 1 0 23 - 8 - 31
DK 1 3 - - - - 4
DE 1 1 - - - - 2
EE 0 0 - - - - 1
IE 0 0 - - - - 0
EL 30 18 14 1 20 - 83
ES 12 2 25 12 - - 50
FR 74 (27) 1 - 0 1 51
HR 0 13 - 0 - - 14
IT 56 17 104 - 5 0 182
CY 1 - - - 2 - 3
LV - - - - - - -
LT 0 - - - - - 0
LU - - - - - - -
HU 7 44 75 67 - - 194
MT - - - - - - -
NL 1 0 - - - - 1
AT 2 0 (0) - - - 2
PO 7 5 6 - - 0 18
PT 16 11 14 - - - 41
RO 26 88 - 8 - - 123
SI - - 17 - - - 17
SK 6 - - - - - 6
FI 0 1 (0) - - - 1
SE 3 6 - - - - 9
UK 52 3 0 - - - 55
Interreg (*) - - 6 - - - 6
306 195 286 90 34 2 913
(*) Interreg, funded by the European Regional Development Fund (ERDF), is one of the key instruments of the EU supporting cooperation across borders through project funding�Negative amounts displayed in the above table are in general due to Court of Justice judgments annulling financial correction decisions�These figures are taken from the 2018 Annual management and performance report for the EU budget�

79
SECTION V — ANNEXES
Annex 5
Borrowing and lending activities
BorrowingA number of EU and European Atomic Energy Community (Euratom) operations are carried out using borrowed funds� The EU and Euratom have access to the capital markets to fund various categories of loans�
Borrowing transactions in 2018
Balance of payments: none�EU macro-financial assistance (MFA): EUR 515 million�Euratom: EUR 50 million�European Financial Stabilisation Mechanism: EUR 4 500 million�
Table 1: Operations of the EU in 2018 (million EUR)
Instrument Beneficiary Disbursement date
Maturity Amount Total per programme
EFSM
Ireland — 2nd lengthening6.2.2018 4.4.2025 2 400
4 5006.3.2018 4.4.2033 1 000
Ireland — 3rd lengthening 29.6.2018 4.4.2033 500
Portugal — 2nd lengthening 29.6.2018 4.4.2033 600
Euratom Energoatom (Ukraine) — 2nd instalment 6.7.2018 6.7.2028 50 50
MFAGeorgia II — 1st instalment 11.12.2018 4.4.2033 15
515Ukraine MFA IV — 1st instalment 11.12.2018 4.4.2033 500
Total 5 065
Lending to Member States
Balance of payments
The EU medium-term financial assistance facility (the balance-of-payments facility) enables loans to be granted to one or more Member States that have not yet adopted the euro and that are experiencing, or are seriously threatened by, difficulties in their balance of payments on current accounts�
Romania repaid two loan tranches in 2018 for a total amount of EUR 1 350 million: EUR 1 200 million in April 2018 and EUR 150 million in October 2018� The outstanding amount of balance-of-payments loans thus decreased from EUR 3 050 million to EUR 1 700 million in 2018�
No new decisions to grant financial assistance were adopted in 2018�

80
EU budget 2018 — Financial report
Loan disbursements
No disbursements were made in 2018�
European Financial Stabilisation Mechanism
The European Financial Stabilisation Mechanism (EFSM) was set up during the financial crisis to provide financial support for Member States experiencing difficulties caused by exceptional circumstances beyond their control� The loans are granted as joint EU–International Monetary Fund support�
No new decisions to grant financial assistance were adopted in 2018�
Loan disbursements in 2018
In 2013 an extension of the maximum average maturity from 12�5 years to 19�5 years was decided upon for Ireland and Portugal�
Ireland
A request to lengthen the EFSM loan of EUR 3�4 billion — disbursed in March 2011 and due on 4 April 2018 — was received from Ireland on 27 November 2017� The loan was refinanced during the first quarter of 2018 in two transactions with maturities in April 2025 (EUR 2�4 billion) and April 2033 (EUR 1 billion)�
Furthermore, an additional request to lengthen the EFSM loan of EUR 0�5 billion — disbursed in October 2011 and due on 4 October 2018 — was received from Ireland in the second quarter of 2018� The loan was refinanced in June 2018 by increasing the abovementioned bond with maturity in April 2033 (EUR 0�5 billion)�
The weighted average maturity of the EFSM loans to Ireland is now 17�1 years�
Portugal
A request to lengthen the EFSM loan of EUR 600 million — disbursed in October 2011 and due on 4 October 2018 — was received from Portugal in the second quarter of 2018� The loan was refinanced in June 2018 by increasing the existing bond with maturity in April 2033 (EUR 0�6 billion)�
The weighted average maturity of the EFSM loans to Portugal is now 15�3 years�
These operations do not impact the Member State’s liabilities�
Lending to non-EU countries
Macro-financial assistance
The EU may help to restore macroeconomic equilibrium in a particular non-EU country, generally through loans and grants (MFA)� The Commission administers such support in accordance with the relevant Council decisions�

81
SECTION V — ANNEXES
Moldova
On 13 September 2017 the Parliament and the Council decided to provide further MFA to Moldova of EUR 100 million (up to EUR 60 million provided in the form of loans and up to EUR 40 million in the form of grants) (22)�
The memorandum of understanding and the loan facility agreement for Moldova were signed on 23 November 2017� The ratification by the Moldovan authorities took place on 15 December 2017 and the loan agreement entered into force on 18 January 2018� No disbursements have been made to date�
Loan disbursements
Georgia
On 18 April 2018 the Parliament and the Council decided to provide further MFA of up to EUR 45 million to Georgia (MFA II), consisting of a EUR 10 million grant element and a loan of EUR 35 million (23)�
The first loan tranche of EUR 15 million (out of the EUR 35 million decision) of Georgia’s second programme (MFA II) was disbursed in December 2018�
Ukraine
On 4 July 2018 the Parliament and the Council decided to provide further MFA of up to EUR 1 billion to Ukraine (MFA IV), consisting of two tranches of EUR 500 million each, with a view to supporting the country’s economic stabilisation and substantive reform agenda (24)�
The first tranche of EUR 500 million (out of the EUR 1 billion decision) of Ukraine’s fourth programme (MFA IV) was disbursed in December 2018�
Euratom loans
Euratom loans to EU Member States are used to finance project investment relating to the industrial production of electricity in nuclear power stations and to industrial installations in the nuclear fuel cycle�
Euratom loans for non-EU countries aim to improve the safety and efficiency of nuclear power stations and installations in the nuclear fuel cycle that are in service or under construction� They can also be used to fund the decommissioning of nuclear installations�
No new decisions were taken in 2018�
Loan disbursements
The second tranche of EUR 50 million of the EUR 300 million Euratom loan to Energoatom, Ukraine, was disbursed in June 2018�
(22) Decision (EU) 2017/1565 of the European Parliament and of the Council of 13 September 2017 on providing macro-financial assistance to the Republic of Moldova (OJ L 242, 20�9�2017, p� 14)�
(23) Decision (EU) 2018/598 of the European Parliament and of the Council of 18 April 2018 on providing macro-financial assistance to Georgia (OJ L 103, 23�4�2018, p� 8)�
(24) Decision (EU) 2018/947 of the European Parliament and of the Council of 4 July 2018 on providing macro-financial assistance to Ukraine (OJ L 171, 6�7�2018, p� 11)�

82
EU budget 2018 — Financial report
European Investment Bank loans
The EIB traditionally undertakes operations outside the EU in support of external EU policies based on Parliament and Council decisions that grant an EU guarantee to the EIB against losses for projects carried out in certain non-EU countries� The EU guarantee covers outstanding EIB loans under successive mandates�
The maximum ceiling of the current EIB mandate for 2014-2020 amounts to EUR 32 300 million� Under the EIB general mandate covering 2014-2020 a total amount of EUR 17 641 million had been agreed upon at 31 December 2018, of which only EUR 5 767 million was disbursed at that date, leaving the outstanding capital at EUR 5 412 million�
The overall and regional ceilings of the mandate are detailed in the table below�
EIB financing operations with EU guarantee at 31�12�2018 (million EUR)
Operations Authorised ceiling
Net signatures (a)
Amounts disbursed
Outstanding capital
Mandate 2014/2020: 32 300 17 641 5 767 5 412 65 % 3 517.85
Pre-accession countries 8 075 3 099 1 267 1 262
Neighbourhood and partnership countries: 19 680 11 520 3 549 3 352
Mediterranean countries 13 030 6 362 2 368 2 232
Eastern Europe, southern Caucasus and Russia 6 650 5 158 1 180 1 120
Asia and Latin America: 4 083 2 752 824 670
Latin America 2 694 1 724 611 458
Asia 1 165 846 204 203
Central Asia 224 182 9 9
South Africa 462 270 127 129
The EU budget guarantee covers 65 % of the aggregate amount of credits disbursed, minus amounts reimbursed, plus all amounts relating to the general mandate� Therefore, the EU guarantee under this mandate is restricted to EUR 3 517�85 million (65 % of EUR 5 412 million)�

83
SECTION V — ANNEXES
Annex 6
Glossary
List of abbreviations
TERM DEFINITION
COSME competitiveness of enterprises and small and medium-sized enterprises
EAGF European Agricultural Guarantee Fund
EAGGF European Agricultural Guidance and Guarantee Fund
EEA European Economic Area
EFTA European Free Trade Association
EGNOS European geostationary navigation overlay service
EIB European Investment Bank
EMFF European Maritime and Fisheries Fund
EP European Parliament
TERM DEFINITION
ERDF European Regional Development Fund
ESA European system of integrated economic accounts
ESF European Social Fund
GNI gross national income
IFAR integrated financial and accountability reporting
MFF multiannual financial framework
OBB operating budgetary balances
TOR traditional own resources
VAT value added tax

84
EU budget 2018 — Financial report
Glossary
TERM DEFINITION
1 ABAC This is the name given to the Commission’s accounting system, which since 2005 has been based on accrual accounting rules. The Commission produces accrual-based accounts which recognise revenue when earned, rather than when collected. Expenses are recognised when incurred rather than when paid. This contrasts with cash basis accounting that recognises transactions and other events only when cash is received or paid.
2 Accounting The act of recording and reporting financial transactions, including the origination of the transaction, its recognition, processing and summarisation in the financial statements.
3 Agencies EU bodies having a distinct legal personality, and to whom budget implementing powers may be delegated under strict conditions. They are subject to a distinct discharge from the discharge authority.
4 Appropriations Budget funding. The budget forecasts both commitments (legal pledges to provide finance, provided that certain conditions are fulfilled) and payments (cash or bank transfers to the beneficiaries). Appropriations for commitments and payments often differ — differentiated appropriations — because multiannual programmes and projects are usually committed in the year they are decided and are paid over the years as the implementation of the programme and project progresses. Thus, if the EU budget increases, due to enlargement for example, commitments will increase before payments do. Not all projects and programmes are concluded, and appropriations for payments are therefore lower than for commitments. Non-differentiated appropriations apply for administrative expenditure, agricultural market support and direct payments.
5 Assigned revenue Revenue assigned for a specific purpose, such as income from foundations, subsidies, gifts and bequests, including the assigned revenue specific to each institution (Article 21 of the financial regulation).
6 Budget Annual financial plan, drawn up according to budgetary principles, that provides forecasts and authorises, for each financial year, an estimate of future costs and revenue and expenditures and their detailed description and justification, the latter included in budgetary remarks. Amending budget: an instrument adopted during the budget year to amend aspects of the adopted budget of that year.
7 Carry-over Exception to the principle of annuality in so far as appropriations that could not be used in a given budget year may, under very strict conditions, be exceptionally carried over for use during the following year.
8 Ceiling Limits of expenditure or revenue fixed by law or by agreement, such as in the own-resources decision or in the multiannual financial framework. The latter defines an annual ceiling for each expenditure heading in commitment appropriations and an annual global ceiling for payment appropriations.
9 Common Customs Tariff
The external tariff applied to products imported into the Union.
10 EU-15, EU-25, EU-27, EU-28
EU-28 means the EU as constituted in 2013: Belgium (BE), Bulgaria (BG), Czech Republic (CZ), Denmark (DK), Germany (DE), Estonia (EE), Ireland (IE), Greece (EL), Spain (ES), France (FR), Croatia (HR), Italy (IT), Cyprus (CY), Latvia (LV), Lithuania (LT), Luxembourg (LU), Hungary (HU), Malta (MT), Netherlands (NL), Austria (AT), Poland (PL), Portugal (PT), Romania (RO), Slovenia (SI), Slovakia (SK), Finland (FI), Sweden (SE), United Kingdom (UK)EU-27 means the EU as constituted in 2007: BE, BG, CZ, DK, DE, EE, IE, EL, ES, FR, IT, CY, LV, LT, LU, HU, MT, NL, AT, PL, PT, RO, SI, SK, FI, SE, UK.EU-25 means the EU as constituted in 2004: BE, CZ, DK, DE, EE, IE, EL, ES, FR, IT, CY, LV, LT, LU, HU, MT, NL, AT, PL, PT, SI, SK, FI, SE, UK.EU-15 means the EU as constituted in 1995: BE, DK, DE, IE, EL, ES, FR, IT, LU, NL, AT, PT, FI, SE, UK.
12 Expenditure allocated
EU expenditure that it is possible to allocate to individual Member States. Non-allocated expenditure concerns notably expenditure paid to beneficiaries in non-EU countries. Allocation of expenditure by country is necessary in order to calculate budgetary balances.
13 Financial regulation Adopted through the ordinary legislative procedure after consulting the European Court of Auditors, this regulation lays down the rules for the establishment and implementation of the general budget of the European Union.

85
SECTION V — ANNEXES
TERM DEFINITION
14 Grants Direct financial contributions, by way of donation, from the budget in order to finance either an action intended to help achieve an objective part of an EU policy or the functioning of a body which pursues an aim of general European interest or has an objective forming part of an EU policy.
15 Gross domestic product (GDP) at
market prices
Final result of the production activity of resident producer units. It corresponds to the economy’s total output of goods and services, less intermediate consumption, plus taxes less subsidies on products.
16 Gross national income (GNI)
At market prices represents total primary income receivable by resident institutional units: compensation of employees, taxes on production and imports less subsidies, property income (receivable less payable), operating surplus and mixed income. Gross national income equals gross domestic product (GDP) (see above) minus primary income payable by resident units to non-resident units plus primary income receivable by resident units from the rest of the world. GNI has widely replaced gross national product (GNP) as an indicator of income. In the area of the EU budget this change took effect as from the year 2002. In order to maintain unchanged the cash value of the ceiling of EU revenue, referred to as the ‘own resources ceiling’, the ceiling had to be recalculated in percentage terms. It is now established at 1.20 % of GNI instead of the previous 1.23% of EU GNI.
17 Headings In the multiannual financial framework or financial perspective are groups of EU activities in broad categories of expenditure.
18 Macroeconomic equilibrium
The situation where there is no tendency for change. The economy can be in equilibrium at any level of economic activity.
19 Macro-financial assistance
Form of financial support to neighbouring regions, which is mobilised on a case-by-case basis with a view to helping the beneficiary countries in dealing with serious but generally short-term balance-of-payments or budget difficulties. It takes the form of medium-/long-term loans or grants (or an appropriate combination thereof) and generally complements financing provided in the context of an International Monetary Fund reform programme.
20 Operating balances The difference between what a country receives from and pays into the EU budget. There are many possible methods of calculating budgetary balances. In its financial report, the Commission uses a method based on the same principles as the calculation of the correction of budgetary imbalances granted to the United Kingdom (the UK correction). It is, however, important to point out that constructing estimates of budgetary balances is merely an accounting exercise covering the purely financial costs and benefits that each Member State derives from the Union and it gives no indication of the many other benefits gained from EU policies such as those relating to the internal market and economic integration, not to mention political stability and security.
21 Outturn Any of the three possible outcomes of the budget resulting from the difference between revenue and expenditure: a positive difference (surplus), a negative difference (deficit) and no difference (i.e. zero, or perfect balance between revenue and expenditure).
22 Own resources The revenue flowing automatically to the European Union budget, pursuant to the treaties and implementing legislation, without the need for any subsequent decision by national authorities.
23 Revenue Term used to describe income from all sources that finance the budget. Almost all revenue into the EU budget is in the form of own resources, of three kinds: traditional own resources — duties that are charged on imports of products originating from a non-EU state; the resource based on value added tax (VAT); and the resource based on GNI. The budget also receives other revenue, such as income from non-EU countries for participating in EU programmes, the unused balance from the previous year, taxes paid by EU staff, competition fines, interest on late payments and so on.
24 Surplus Positive difference between revenue and expenditure (see outturn) which has to be returned to the Member States.
25 UK correction At the Fontainebleau European Council in France on 25 and 26 June 1984, the then 10 Member States (Belgium, Denmark, Germany, Ireland, Greece, France, Italy, Luxembourg, the Netherlands and the UK) agreed on the rebate to be granted to the UK to reduce its contribution to the EU budget.
26 VAT (value-added tax)
An indirect tax, expressed as a percentage applied to the selling price of most goods and services. At each stage of the commercial chain, the seller charges VAT on sales but owes the administration this amount of tax minus the VAT paid on purchases made in the course of business. This process continues until the final consumer pays VAT on the whole value of what is purchased. VAT is broadly harmonised in the European Union but Member States may fix their own rates of tax, within parameters set at EU level, and also enjoy a limited option to tax or not to tax certain goods and services.


Getting in touch with the EU
In personAll over the European Union there are hundreds of Europe Direct information centres. You can fi nd the address of the centre nearest you at: https://europa.eu/european-union/contact_en
On the phone or by emailEurope Direct is a service that answers your questions about the European Union. You can contact this service:– by freephone: 00 800 6 7 8 9 10 11 (certain operators may charge for these calls),– at the following standard number: +32 22999696 or – by email via: https://europa.eu/european-union/contact_en
Finding information about the EU
OnlineInformation about the European Union in all the offi cial languages of the EU is available on the Europa website at: https://europa.eu/european-union/index_en
EU publications You can download or order free and priced EU publications at: https://publications.europa.eu/en/publications Multiple copies of free publications may be obtained by contacting Europe Direct or your local information centre (see https://europa.eu/european-union/contact_en).
EU law and related documentsFor access to legal information from the EU, including all EU law since 1952 in all the offi cial language versions, go to EUR-Lex at: http://eur-lex.europa.eu
Open data from the EUThe EU Open Data Portal (http://data.europa.eu/euodp/en) provides access to datasets from the EU. Data can be downloaded and reused for free, for both commercial and non-commercial purposes.

EU Budget 2018 - Financial Report
Print ISSN 1830-7280 ISBN 978-92-76-03078-2 doi:10.2761/081551 KV-AI-19-001-EN-C
PDF ISSN 2443-7891 ISBN 978-92-76-03079-9 doi:10.2761/027405 KV-AI-19-001-EN-N