RAFTER X-BRACING RAFTER COLUMN X-BRACING ROD BRACE CONNECTION

THIS REPORT CONTAINS ASSESSMENTS OF COMMODITY AND TRADE ISSUES MADE BY
USDA STAFF AND NOT NECESSARILY STATEMENTS OF OFFICIAL U.S. GOVERNMENT
POLICY
Date:
GAIN Report Number:
Approved By:
Prepared By:
Report Highlights:
The EU sweetener market will take a new start after the end of the 50 year old EU sugar quota
production system on October 1, 2017, and will probably face a period of increased market volatility.
The EU isoglucose industry will become a modest competitor for the EU sugar processing industry.
The forecast expansion of EU sugar production to 18.6 million MT in MY 2017/18, up from 16.5
million MT in MY 2016/17, will come at the expense of EU sugar imports and the EU refining industry.
The EU is forecast to become a net sugar exporter in MY 2017/18 after more than a decade. This
report further holds updated numbers for the last two years of the EU sugar quota system.
Yvan Polet
Marcela Rondon
EU Sugar Processors Bracing for Post-Quota with Large
Production Increase
Sugar Annual
EU-28
E17030
4/19/2017
Required Report - public distribution

Executive Summary:
Marketing Year (MY) 2017/18 is the first year that the EU sugar market will function without the
shackles of the 50 year old EU sugar production quota regime and export limits. Production and export
restrictions will be lifted as part of the Common Agricultural Policy (CAP) reform, and European sugar
groups will be able to produce and export as much as they want. The isoglucose industry will also be
liberated from the production restrictions of the EU quota system. For the EU sugar refining sector new
market opportunities may open up, although it will continue to face the restrictions to EU sugar imports
bound by high EU sugar import tariff walls, fixed import quotas, and decreasing preferential sugar
import supplies. As a consequence, the EU sweetener market enters a new era with likely increased
market volatility for the next few years until the different EU industries find new market equilibrium.
The EU sugar beet processing industry has publicly communicated its ambition to grab this new
opportunity to grow its business aggressively again and has contracted 12 percent more sugar beet for
MY 2017/18 than it did for MY 2016/17, especially in the most competitive Member States (MS)
Germany, the Benelux and France. In the southern and eastern EU periphery, sugar production will
remain more stable and further consolidation of the EU sugar processing industry is likely in the coming
years. This should offer new market perspectives for sugar refiners and isoglucose industries, which
already have a historical presence in these MS. The beet processors are aiming at lowering their cost of
production for beet sugar by optimizing beet and sugar processing capacity without significant
additional investments. They want to produce cheap sugar as a in the coming EU sweetener market
struggle, as well as regain their former sugar exporter status after the WTO sugar export ceiling is lifted
with the end of the sugar quota system. Post believes that to achieve this, EU domestic sugar prices will
decrease and closely align with world market sugar prices beginning in MY 2017/18.
Post forecasts EU sugar production for MY 2017/18 at 18.6 million MT, up from an expected 16.5
million MT Raw Sugar Equivalent (RSE) in MY 2016/17, and 14.3 million MT in MY 2015/16. This
increase in sugar production will likely result in lower sugar imports forecast at 2 million MT in MY
2017/18 from over 3 million MT in previous years. This decrease will be at the expense of the EU
sugar refining sector, as mainly raw sugar imports from CXL quotas and preferential Everything-But-
Arms (EBA) and Least Developed Countries (LDC) countries will decrease. Post forecasts EU sugar
exports in MY 2017/18 to increase to 2.2 million MT from the WTO’s ceiling bound 1.5 million MT in
previous years and turning the EU into a sugar exporter after more than 10 years since the WTO ruled
against the European Commission (EC) cross-subsidized sugar exports in the 2005 WTO sugar case
with Brazil.
Post forecasts EU domestic sugar consumption to decrease slightly as isoglucose consumption is
forecast to slowly gain market share while the total EU sweetener market is forecast to remain stable
despite an increasing, but aging population, and decreasing sugar consumption per capita due to
reformulation of products.
The above production forecast excludes beet extraction for non-sugar industrial purposes like bioethanol
and biogas production, and industrial fermentation, which is expected to decrease to below 2 million
MT RSE in MY 2017/18 and from 2.1 to 2.2 million MT in MY 2016/17 and MY 2015/16, mainly as
bioethanol production from sugar beet is decreasing at the benefit of wheat.

Ending stocks will only exist of pipeline stocks as the EU is unlikely to set up a sugar storage program
after the expiration of the sugar quota system.
While the end of the EU sugar production quota system will induce a clear break in the EU sugar
balance sheet going forward, another market shock is only two years away, in theory, as the British
Prime Minister, at the end of March 2017, started the clock for the two-year separation negotiation
period with the EU, better known as the Brexit. Since the United Kingdom (UK) is the largest importer
of EU sugar as well as overseas raw sugar, depending on the ultimate Brexit agreement, this will bring
another major market reshuffling. That is without taking into account Brexit’s impact to the Common
Agricultural Program (CAP) post 2020 budget as the UK is the CAP’s second largest contributor.
Acknowledgement.
The data in this report is based on EU sugar production information collected by FAS Agricultural
Specialists in the MS. These include:
Xavier Audran from FAS/Paris covering France,
Ornella Bettini from FAS/Rome covering Italy,
Monica Dobrescu from FAS/Bucharest covering Romania,
Dimosthenis Faniadis from FAS/Rome covering Greece,
Bob Flach from FAS/The Hague covering The Netherlands, Denmark, Finland and Sweden,
Golya Gellert from FAS/Budapest covering Hungary,
Marta Guerrero from FAS/Madrid covering Spain and Portugal,
Steve Knight from FAS/London covering the United Kingdom,
Mira Kobuszynska from FAS/Warsaw covering Poland and Lithuania,
Roswitha Krautgartner from FAS/Vienna covering Austria,
Jana Mikulasova from FAS/Prague covering the Czech and Slovak Republics,
Andreja Misir from FAS/Zagreb covering Croatia,
Yvan Polet from FAS/Brussels covering Belgium and EU issues,
Leif Rehder and Sabine Lieberz from FAS/Berlin covering Germany.
Commodities:
Sugar, Centrifugal
Production:
Explanatory Notes to the reader:
• This report is the first to make a forecast for European Union (EU) sugar markets for Marketing Year
(MY) 2017/18 after the abolishment1 of the 50 year old EU sugar production quota regime. As a result,
EU sugar market balance numbers will likely show a clear break from the past from MY 2017-18
onwards as the whole EU sugar and sweetener industry adapts to a liberalized market. This is expected
to not pass without consequences for other countries involved in sugar trade with the EU.
• All sugar is in raw sugar equivalent (RSE) unless otherwise noted.
• The Production, Supply & Demand tables (PS&D) in this report only pertain to sugar as defined by
Harmonized System (HS) code 1701; therefore, it excludes raw beet sugar production destined for
fermentation or other industrial purposes. Because EU sugar produced under the quota system was
preserved for food use only, the so-called out-of-quota sugar was used only for industrial (non-food)
use. From MY 2017/18 onwards, there will be no regulated distinction between sugar for food purposes
and sugar for non-food purposes. However, the EU Sugar GAIN report will continue to exclude thick
juice from sugar beet for bioethanol and fermentation purposes as thick juice does not meet the HS 1701
definitions.
• The conversion factors and marketing years used in this report:
MY = marketing year; for sugar October/September.
Raw cane sugar = 1.07 X Refined cane sugar
Raw beet sugar = 1.087 X White (refined) beet sugar
• Sugar imports for EU inward processing purposes are excluded from this report PS&D tables as these
sugar imports are entirely re-exported as processed products. Inward processing is the EU customs
program under which the import duties for dairy, sugar, and starch containing commodities for
processing and subsequent re-export are waived.
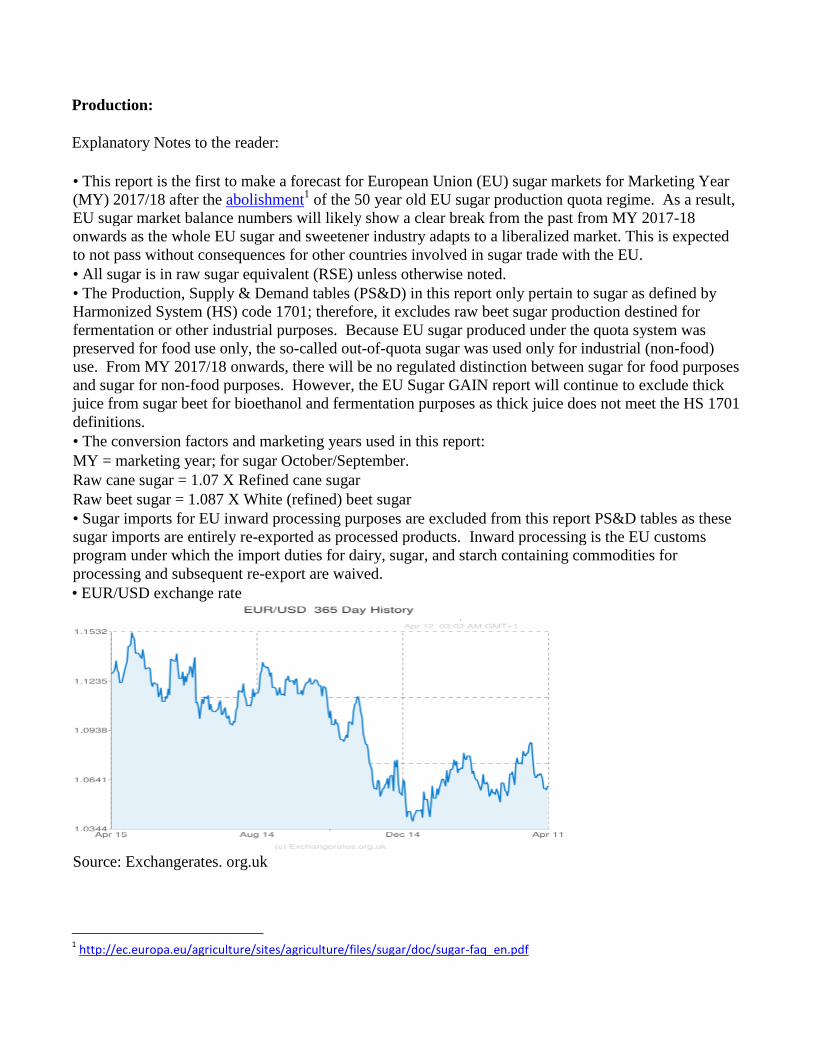
• EUR/USD exchange rate
Source: Exchangerates. org.uk
1 http://ec.europa.eu/agriculture/sites/agriculture/files/sugar/doc/sugar-faq_en.pdf

Additional Upfront Note: The EU Sugar Production Quota Regime Ends on September 30, 2017
The 2007 Sugar Reform2 regulated the EU sugar market, limiting total EU production quota for food
purposes to 13.5 million MT of white sugar equivalent which amounts to 14.7 million MT in raw sugar
equivalent (RSE). This EU sugar production quota regime expires at the end of marketing year (MY)
2016/17. Sugar production quotas were set by Member States (MS) and included a small quota for cane
sugar production in overseas territories (DOM) for France and Portugal. Additional production is
considered “out-of-quota.” Thus, EU sugar processors in MS had four options to market sugar produced
out-of-quota:
Exports: pending availability of EU export licenses limited to the EU’s World Trade Organization
(WTO) sugar export ceiling of 1.35 million MT (of refined sugar).
Disposal on the EU market for industrial purposes: for example, for fermentation by the biochemical
industry or for bio-ethanol production.
Release on the EU domestic market: This option carries a levy of €500 per MT unless the EU decides to
waive all or part of the levy through exceptional sugar market management measures. Under the new
Common Agricultural Policy (CAP) post 2013, this system largely remains the same under the system
of “temporary market management mechanism.”
Carry-over into the following production year: counts towards the quota production for that year.
All the above rules and restrictions will cease to apply at the end of the quota regime on October 1,
2017.
As isoglucose such as High Fructose Corn Syrup (HFCS) was also governed by the production quota
system, linking isoglucose for food to the sugar quota at 5 percent, it was not a competitor for sugar for
food use. This limitation on isoglucose also ends with the abolition of the sugar quota regime at the end
of MY2016/17
EU farmers are also protected against competition from non-preferential raw cane sugar by high tariffs
and import quotas. A rigid import license system governs preferential duty-free imports from Least
Developed Countries (LDCs) under the Everything-But-Arms (EBA) Agreement limiting imports to 3.5
million MT white sugar equivalents. In recent years, additional country- specific quotas have been
agreed as part of EU free trade agreements (FTAs) with Peru, Colombia, Panama and Central America
totaling some 260,000 MT. Ukraine has also been allocated a 20,000 MT quota. This system is not
affected by the end of the sugar quota regime.
EU Sugar Production
PSD - Sugar, Centrifugal MY2015/16 MY2016/17 MY2017/18
Market Begin Year October 2015 October 2016 October 2017
European Union USDA
Official New post
USDA Official
New post
USDA Official
New post
2 http://ec.europa.eu/agriculture/sugar/legislation/index_en.htm

Beginning Stocks (1000 MT) 4,151 4,151 1,131 1,374 0 774
Beet Sugar Production (1000 MT) 14,000 14,017 15,920 16,222 0 18,320
Cane Sugar Production (1000 MT) 280 266 280 278 0 280
Total Sugar Production (1000 MT) 14,280 14,283 16,200 16,500 0 18,600
Raw Imports (1000 MT) 2,200 2,345 2,500 2,100 0 1,500
Refined Imp.(Raw Val) (1000 MT) 800 840 750 1000 0 500
Total Imports (1000 MT) 3,000 3,185 3,250 3,100 0 2,000
Total Supply (1000 MT) 21,431 21,619 20,581 20,974 0 21,374
Raw Exports (1000 MT) 7 5 5 5 0 5
Refined Exp.(Raw Val) (1000 MT) 1,493 1,540 1,495 1,495 0 2,195
Total Exports (1000 MT) 1,500 1,545 1,500 1,500 0 2,200
Human Dom. Consumption (1000 MT) 18,800 18,700 18,800 18,700 0 18,650
Total Use (1000 MT) 18,800 18,700 18,800 18,700 0 18,650
Ending Stocks (1000 MT) 1,131 1,374 281 774 0 524
Total Distribution (1000 MT) 21,431 21,619 20,581 20,974 0 21,374
This report aims at making a first forecast for a liberalized EU sugar market. As a result of the
termination of the many restrictions for sugar production and use that were enshrined in the quota
regime, including the lifting of the export ceiling imposed by the WTO, the MY 2017/18 forecast offers
a clear break with previous marketing years. Because the EU post-quota-regime will have little to do
with the past, this report will discuss the forecast year 2017/18 separately from the sugar quota era years.
The many uncertainties that come into play from MY 2017/18 only allows for discussion of possible
scenarios, ramifications, and consequences.
Production forecast for MY 2017/18
While many sugar processors are invoking EU competition rules for not communicating on contracted
beet acreage for the 2017/2018 production year to MS authorities and industry associations, sugar
experts believe that total EU beet acreage may increase more than the 11.7 percent that Post is
forecasting. This conservative increase in production can easily be made by simply extending the beet
slicing campaign in the autumn without any significant investments. Last year, many processors vowed
to increase production by up to 50 percent, which would be possible with the existing processing
capacity. A critical factor limiting processing capacity is the length of the beet slicing campaign, which
in turn is limited by the winter frost period and the damage alternating frosting and defrosting does to
beet and beet juice quality after extraction. In past years, beet slicing campaigns varied from 85 to 135
days depending on the processor and the MS, with the shortest slicing campaign in Germany and the

longest one in the UK. Experts believe that most EU continental processors can increase the slicing
period to 110-120 days without too much risk while the UK could increase the slicing period to 150 days
or more as it rarely suffers from stronger than mild frost. Spain operates the longest processing period
of all as it grows beet through summer in the North and through winter in the South.
However, MY 2017/18 beet acreage is reportedly to be below processors’ ambitions as beet farmers may
not have followed those ambitions for technical or for economic reasons. The CAP puts limitations on
what percentage of beets farmers can actually grow on their fields. Furthermore, beet harvesting
machinery is expensive and processors offered beet growers much less lucrative contracts than under the
quota regime.
While the EU sugar reference price of €404/MT for white sugar remains after the abolition of the quota
regime, beet farmers have lost the guaranteed sugar beet price that was linked to this reference price and
processors have engaged in a competition for sourcing beet that will yield the lowest cost of production
for the resulting sugar. Beet growers in certain MS have long resisted at the offered beet growing
contracts, but crop options are limited, especially after farmers decreased winter seeding of cereals
because of the low grain market prices. While the latest CAP promotes the bundling of farmers’
interests in producer organizations (POs), in reality sugar beet grower associations have lost bargaining
leverage because in most areas there is only one sugar beet processor operating.
Some sugar processors have plans to increase sugar production beyond EU domestic sweetener needs
(not just sugar for human consumption and/or industrial use) and become a net exporter again. Since the
2007 Sugar Reform, the EU sugar production quota system had limited EU sugar production to 85
percent of domestic food use, with the additional 15 percent of demand being filled by imports of mainly
raw cane sugar by EU sugar refiners. In the case of above average yields, beet sugar production in MY
2017/18 could already meet the coming year’s domestic consumption. Favorable spring weather in
March has already permitted a good start for beet crops in the main beet growing areas in Northwestern
Europe.
EU sugar beet production
Area, thousands of
Hectares Sugar beet yield in MT per
Hectare Sugar content in
percentage
2015/16 2016/17 2017/18 2015/16 2016/17 2017/18 2015/16 2016/17 2017/18
Austria 45.3 43.5 46.0 62.6 80.0 75.0 17.00 17.65 17.50
Belgium 53.7 56.3 65.0 82.3 68.2 80.0 18.02 18.08 18.00
Denmark 36.0 33.1 33.0 66.6 65.0 65.0 18.00 18.00 18.00
Finland 12.5 12.5 12.0 32.7 36.8 35.0 16.50 16.50 16.50
France* 385.0 400.0 460.0 87.0 83.4 87.0 18.50 17.70 18.00
Germany 300.0 314.0 350.0 71.0 75.0 74.0 17.83 18.09 17.80
Greece 4.9 5.4 6.0 51.9 57.9 60.0 13.50 13.50 13.50
Italy 38.0 32.4 35.6 57.0 66.0 63.0 16.00 16.00 16.00
Netherlands 58.5 70.6 85.0 83.3 83.3 84.0 16.70 17.00 17.00
Portugal* 0.1 0.4 0.4 48.0 48.0 48.0 15.51 15.51 15.51
Spain 36.1 32.9 38.0 93.3 87.1 90.0 17.44 17.67 14.72

Sweden 19.5 30.7 32.0 60.8 70.0 70.0 17.50 17.50 17.50
United Kingdom 90.0 90.0 105.0 69.5 70.0 70.0 17.50 17.50 17.50
Czech Rep. 53.7 56.0 56.0 60.9 65.0 65.0 18.20 18.00 17.50
Hungary 15.5 15.7 16.2 58.8 65.0 64.2 16.50 16.00 16.00
Lithuania 12.3 14.7 16.0 68.2 60.0 60.0 17.78 17.20 17.30
Poland 171.6 203.0 220.0 54.6 66.5 65.0 17.70 17.30 17.40
Slovak Rep. 21.7 21.4 21.5 57.2 71.4 70.0 16.24 16.38 16.50
Romania 26.0 24.3 26.0 41.0 42.0 42.0 16.50 16.50 16.50
Croatia 14.0 16.0 21.0 54.5 70.0 65.0 15.50 16.50 16.00
Total EU-15 1079.
6 1121.
8 1268.
0
Total NMS 314.8 351.1 376.7
Total EU-28 1394.
4 1472.
9 1644.
7
*Portuguese sugar produced on the Acores is from cane, while France also has cane sugar produced in
its overseas territories.
EU-15: pre-2004 EU MS; NMS: 13 New Member States that acceded since 2004.
Source: FAS/USEU based on data from FAS offices in EU MS.
Additional Sugar Beet Production for Non-food Use
EU Beet Sugar Production (raw value)
in ,000 MT
2010/1
1
2011/1
2
2012/1
3
2013/1
4
2014/1
5
2015/1
6
2016/1
7
2017/1
8
EU Regulated Sugar Market* 15,699 17,833 16,655 16,020 18,449 14,283 16,500 18,600
Unregulated Over-Quota Production for Industrial
Uses** 1,300 2,727 2,266 2,284 2,313 2,126 2,225 1,970
Total EU Beet Sugar Production 16,999 20,560 18,921 18,304 20,762 16,409 18,725 20,570
* includes within-quota production and out-of-quota production released to the EU food market, plus
out-of-quota production that is exported; for MY 2017/18 this includes all sugar defined under HS1701.
**includes total out-of quota production, minus out-of-quota production released to the EU food market
and out-of-quota production that is exported; for MY 2017/18 this includes all beet juice production for
non-sugar purposes.
Source: FAS/USEU calculation
After abolition of the EU sugar production quota regime at the end of MY 2016/17, sugar beet
production and its juice can be freely used as a feedstock (carbon source) for all kind of non-food
purposes and will compete with other feedstock like starch from corn or wheat. Three industries use
sugar beet as a carbon source: 1) Industrial fermentation for yeast production, pharmaceutical production and enzyme production for
detergents and washing products. This is a rather stable production using some 900,000 RSE per year on
average.
2) Bioethanol production. Because this use competes directly with bioethanol produced from grain starch,
production from sugar beet decreased in MY 2015/16 and expectations for MY 2016/17 are unfavorable
given current high sugar prices while grain prices are low. Also, the EU lowered its requirements for MS
to incorporate biofuels from crops grown on agricultural land by 2020 to 7 percent, down from the
previous 10 percent.
3) On farm digestion for biogas production. This is a minor use in a few MS only and different crops can
easily substitute for sugar beet depending on economics.

For MY 2017/18, Post forecast industrial to further decrease to below 2 million MT RSE depending on
availability and as other sugar outlets are expected to yield higher returns, including sugar exports.
(Under the current sugar quota system, industrial use is the outlet of last resort for surplus sugar. It is
perceived as being cross-subsidized from EU sugar produced under the production quota system).
Source: European Commission
EU Sugar Consumption in MY 2017/18
Post forecasts a slight decrease in EU domestic sugar consumption for MY 2017/18. EU sugar
consumption has stabilized in recent years, with still some increase in some MS being offset by
decreases in other MS. This is because per capita consumption is slowly decreasing as a result
consumers seeking healthier life styles and food processors reformulating products as ever more MS
apply taxes on sugar containing products or are discussing their approval.
Isoglucose
The cause of the forecast decrease in sugar consumption in MY 2017/18 is a forecast increase in
isoglucose consumption. Under the sugar production quota system, isoglucose production is limited to
720,441 MT of white sugar equivalent, divided over individual country quota in nine MS. As the
production limit restriction is also ending for this sector, isoglucose producers have made
announcements of future production increases with the aim to gain additional market share in the EU
sweetener market, at the detriment of sugar use. The EU, in its latest Medium-term Outlook Report

20163, foresees an increase in EU isoglucose production to 1 million MT for MY 2017/18 and further
increasing to 2 million MT by the report’s time horizon in 2026.
However, the outlook for isoglucose comes with a number of caveats. The existing production plants
are outdated as the quota restrictions desincentivized any investments. This means that isoglucose
production can only increase in a limited way without new investments. Such investments have already
been announced in Hungary and Bulgaria, and MS like Belgium, Spain and probably France can also be
expected to increase isoglucose production over time. But such capital intensive investment decisions
will not be taken lightly. The switch from sugar to isoglucose in the food industry needs reformulation
of products and accompanying investments, soft drinks including isoglucose instead of sugar may have a
different taste and food industries in general are wary of consumer reactions vis-à-vis perceived health
issues with isoglucose. Therefore, increased use of isoglucose is expected in sugar deficit MS first and
will probably only expand slowly.
EU Isoglucose Production Quota in MT white sugar 2013/14 2014/15 2015/16 2016/17e 2017/18f
Belgium 114,580 114,580 114,580 114,580 114,580 120,000
Bulgaria 89,198 103,584 113,980 112,408 115,000 120,000
Germany 56,638 56,638 56,638 56,638 56,638 60,000
Spain 53,810 53,810 53,810 53,810 53,810 60,000
Italy 32,493 31,579 29,041 29,712 32,493 30,000
Hungary 250,266 255,661 275,720 288,059 300,000 330,000
Poland 42,861 42,961 42,861 42,861 42,861 45,000
Portugal 12,500 10,562 9,343 6,438 6,000 10,000
Slovak R. 68,095 67,336 68,095 68,095 68,095 75,000
TOTAL 720,441 736,711 764,068 772,601 789,477 850,000
e:estimate; f: forecast
Source: European Commission and FAS/USEU forecast
Trade in the Post-Quota Era
Imports in MY 2017/18
Post forecasts EU sugar imports to decrease significantly after the end of the sugar quota regime,
starting in MY 2017/18. Several elements are at cause for this, but the mix of elements that will play out
and their combined effect depend on a number of conditions at that time. The forecast decrease to 2
million MT down from over 3 million MT in previous years’ results from the following. After each
previous sugar reform, EU domestic sugar prices decreased, but were underpinned by a mandatory target
or reference price. There is every reason to believe that this time will be no different, because, for the
first time, the reference price is no longer binding on the beet price for farmers and hence the cost of
production. EU sugar processors are already engaged in a competition to maximize market share. After
the end of the system, their aim is to achieve this by increasing the output of sugar to maximum capacity
of their beet processing units without additional investments, thus minimizing fixed costs of production
and leading to the lowest cost of sugar.
3 https://ec.europa.eu/agriculture/markets-and-prices/medium-term-outlook_en

The race to minimize cost of production of sugar can be expected to result in further consolidation of the
EU sugar processing industry. If EU sugar prices decrease, this will mostly impact the higher cost
producers, to which exporters in EBA/LCP countries in the past belonged and to some extent still do.
Hence, the forecast that EU sugar imports from EBA/LCP countries will further decrease. The new
25,000MT TRQs for Ecuador and the 20,000 MT TRQ for Vietnam will probably not tilt this situation
and the compensation TRQ for Brazil for the accession of Croatia will likely become implemented in the
following year only. If the EU domestic sugar price were to decrease to world market price levels,
which would be a precedent for the past 50 years, but not impossible given the expected price
competition, EU sugar imports from CXL origin and the least competitive EBA/LCP countries could
grind to a halt. While this price scenario would give a boost to the EU food processing industry if it
could find the necessary supplies, it would come at the detriment of the EU sugar refining industry,
which depends on the availability of raw sugar imports and a EU domestic price premium over world
market prices. The refining industry has already been struggling for years to operate at a profit. At the
same time, such low sugar prices would likely discourage the isoglucose industry from planning any
risky investment.
The eventual consolidation of the EU sugar processing industry could lead to a widening of sugar prices
between MS in the core sugar processing area and in MS in EU periphery because of increasing
logistical costs. This in turn would offer new opportunities for sugar refiners who tend to be located in
those peripheral MS.
Source: European Commission
Exports in MY 2017/18
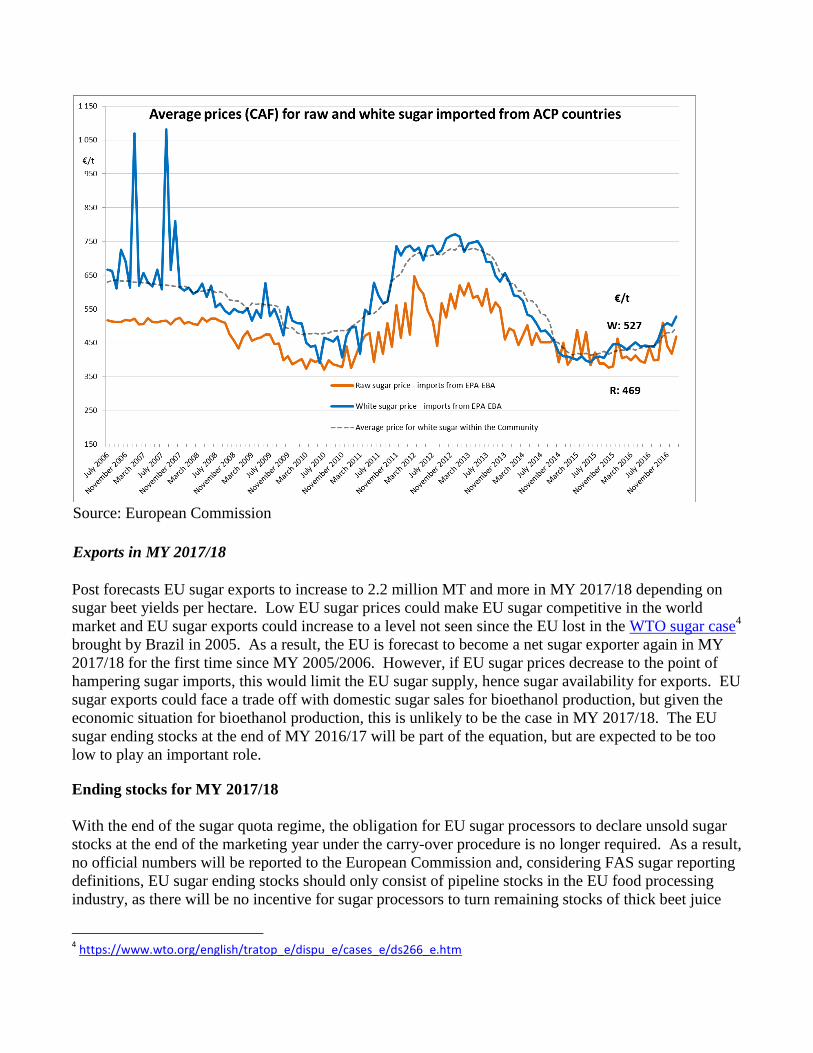
Post forecasts EU sugar exports to increase to 2.2 million MT and more in MY 2017/18 depending on
sugar beet yields per hectare. Low EU sugar prices could make EU sugar competitive in the world
market and EU sugar exports could increase to a level not seen since the EU lost in the WTO sugar case4
brought by Brazil in 2005. As a result, the EU is forecast to become a net sugar exporter again in MY
2017/18 for the first time since MY 2005/2006. However, if EU sugar prices decrease to the point of
hampering sugar imports, this would limit the EU sugar supply, hence sugar availability for exports. EU
sugar exports could face a trade off with domestic sugar sales for bioethanol production, but given the
economic situation for bioethanol production, this is unlikely to be the case in MY 2017/18. The EU
sugar ending stocks at the end of MY 2016/17 will be part of the equation, but are expected to be too
low to play an important role.
Ending stocks for MY 2017/18
With the end of the sugar quota regime, the obligation for EU sugar processors to declare unsold sugar
stocks at the end of the marketing year under the carry-over procedure is no longer required. As a result,
no official numbers will be reported to the European Commission and, considering FAS sugar reporting
definitions, EU sugar ending stocks should only consist of pipeline stocks in the EU food processing
industry, as there will be no incentive for sugar processors to turn remaining stocks of thick beet juice
4 https://www.wto.org/english/tratop_e/dispu_e/cases_e/ds266_e.htm

into sugar until the product is allocated commercially. Therefore, post only forecasts a residual stock
number at the end of MY 2017/18.
Update on MY 2016/17 and MY 2015/16, the final years under the EU sugar production quota
system
Sugar production
EU sugar production for MY 2016/17 is slightly increased to 16.5 million, an increase by 300,000 MT
from the previous forecast. The total EU production from sugar beet for food, as well as for non-sugar
industrial purposes was increased to 18.7 million MT, or an increase of 765,000 MT from the previous
forecast, as a result of highly favorable beet maturing conditions from September 2016 till the end of the
harvesting season after pessimistic yield outlooks from waterlogging in much of the EU’s main beet
growing region in Northwestern Europe. While beet yields remained well below average yields in
recent years in this region, yields were good to above average in more eastern beet growing areas from
Poland to Romania. This increase in out-of-quota sugar production changed a tight supply forecast for
industrial use into a comfortable supply situation, explaining the virtually stable EU price evolution for
industrial sugar in the above graph.
Sugar production numbers for MY2015/16 remain virtually unchanged.
Consumption
EU-28 domestic consumption of sugar was reviewed to remain stable at 18.7 million MT from MY
2015/16 onwards. The increase in demand in the new MS and for the growing immigration population
is being offset by decreasing consumption by the ageing population in the EU15 and product
reformulations by the food industry for lower sugar content, due to consumers’ demands for healthy
diets. The anticipated imposition of taxes on high sugar containing products such as soft drinks in
several MS like Belgium and the UK were not implemented.
The European bioethanol industry faced difficult market conditions from 2015 onwards as decreasing
crude oil prices made bioethanol blending economically unattractive. Bioethanol produced from sugar
also faced tough competition from decreasing grain prices. As a result, bioethanol production from
sugar beet juice has been declining.
Trade
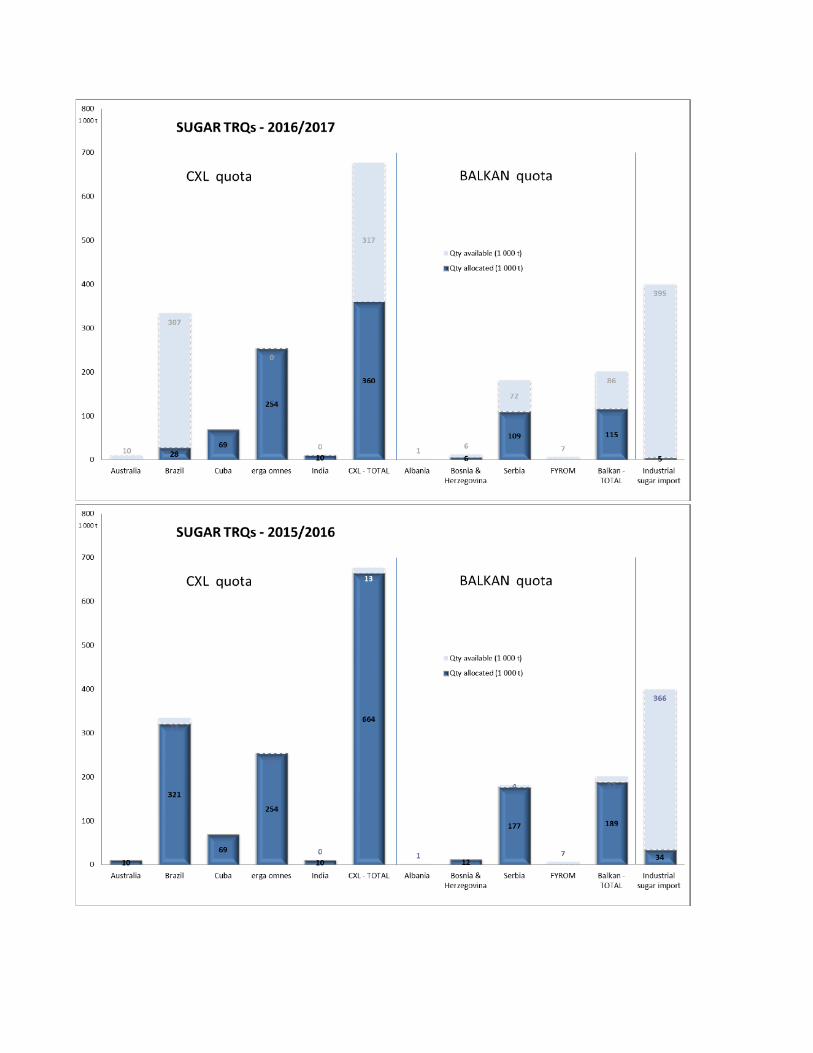
Imports
EU sugar imports have been slowing in recent years. When EU domestic sugar prices are too close to
world market prices, refiners have no margin to pay the €98/MT within-quota import duty for cane sugar
coming from Brazil and other destinations into the EU’s CXL5 quotas. Despite new imports from FTA
5 The CXL quota result from compensation agreements for the 1995 EU enlargement.

countries including Peru, Colombia6 , Panama and Central America
7, imports for MY 2016/17 are
expected to end at 3.1 million MT, further down from the 3.2 million MT of imports in MY 2015/2016.
In MY 2015/16, Brazil filled most of its CXL quota again after failing to do so in MY 2014/15, but,
unless world prices decrease further, its CXL quota may go unused again this year. The fact that the EU
is reflecting about exceptional measures to ease the expected tight supply in the last months of the year
is not an incentive to use the Brazil CXL quota if that same sugar from Brazil could be imported at a
lower duty under such measures.
6 http://ec.europa.eu/trade/policy/countries-and-regions/regions/andean-community/
7 http://ec.europa.eu/trade/policy/countries-and-regions/regions/central-america/

Source
: European Commission
Exports
For MY 2015/16 and MY 2016/17, exports are estimated to stay at 1.5 million MT, in line with the EU’s
WTO export ceiling for sugar, mostly to traditional destinations in the Middle-East and Northern Africa.
Stocks
EU sugar ending stock numbers for MY 2016/17 are estimated at 0.8 million MT as a result of the larger
than previously forecast carry-over of unsold out-of-quota sugar. Ending stocks for MY 2015/16 were
revised at 1.4 million MT. No further carry-over of unsold stocks is foreseen with the end of the EU
sugar quota system.

Source: European Commission
Policy:
The Common Agricultural Policy after 2013 and the End of the EU Sugar Quota Regime
Under the previous CAP, the EU sugar production regime was meant to end on September 30, 2015, but
in the CAP after 2013 agreement, it was extended for two years through MY 2016/17 to allow producers
and processors to prepare for the liberalization of the EU sugar market.
As part of regional policies under the CAP’s Pillar 1 and Pillar 2, 10 MS out of the 19 sugar producing
MS maintained coupled payments for sugar production. From the old EU-15 MS, Finland, Greece, Italy
and Spain maintained coupled payments for sugar production in order to secure national sugar
production after the end of the quota system. These MS feared that they could not compete with sugar
processors in Northwestern Europe. Six of the new MS that acceded the EU after 2004, Poland, Czech
Republic, Slovak Republic, Hungary, Romania and Croatia, also decided to maintain coupled payments.
The level of coupled payments for sugar production varies widely between the 10 MS with payments
amounting from around €67/ ha in Finland to over €600/ha in Romania. These coupled supports will
continue after the expiration of the sugar quota system through the end of the current CAP in 2020.
EU Sugar and Sweetener Industry Preparing for End of Production Quotas in 2017
In some MS, sugar production has already been declining, which seems the case in Finland, Sweden,
where sugar production stayed below their production quota in MY 2015/2016, while Greece and Italy
have been producing below quota for many years. Post sources in Greece reported that processors in

Greece are virtually bankrupt and it can be doubted if these processors can be viable in the post-quota
era. For other MS, like Croatia, Hungary, Italy, Romania, Slovak Republic and Spain, the viability of
sugar production is being called into question if the coupled support expires at the end of the current
CAP in 2019/2020.
The most competitive processors from Germany, Benelux and France want to expand production as
WTO limitations on EU sugar exports also end with the sugar quota system. Their goal is to produce
more sugar at marginal cost without significant investments by optimizing production capacity. Another
way of lowering the overall cost of sugar production in the EU could occur by closing uncompetitive
plants and consolidate production in the most productive areas.
With the end of the sugar quota system also ends the limitations on isoglucose production and can the
competition with sugar for the EU sweetener market start again. The European Commission, in its
Prospects for EU agricultural markets and income 2016-20268, suggests that isoglucose could eventually
gain a market share of 2 million MT, or about 10 percent of the EU sweetener market by 2025. To
achieve this, the industry will need to invest in new isoglucose production capacity, tripling the current
(and outdated) production capacity under the quota system.
The European sugar refining industry could also benefit from a consolidation in the beet processing
industry. Sugar refineries are the main source for sugar supplies in several MS in the southern and the
eastern periphery of the EU. Their geographical location gives them a logistical advantage as the local
sugar suppliers if they can source the necessary raw sugar. However, sugar refiners found it
increasingly difficult to secure raw sugar imports when the gap between EU domestic sugar prices and
world prices shrank under the new CAP. Duty-free imports from ACP and EBA countries have
decreased after the 2007 EU Sugar Reform in response to lower EU sugar prices and increased domestic
demand. Another decrease in the EU sugar price after the end of the quota system may lead to a further
decrease in imports, which will not be compensated by new duty-free imports from EU FTAs. The EU
sugar market will continue to be shielded by high tariff walls.
Nevertheless, the abolition of the EU sugar production quota system is expected to lead to increased
competition between the different sweeteners industries, which industry experts believe could result in
increased market volatility in the short term before sweetener markets find a new equilibrium.
Brexit and the Next CAP 2020
On March 29, 2017, the exit of the United Kingdom (UK) from the European Union became a political
reality when UK Prime Minister Theresa May triggered Article 50 of the EU Lisbon Treaty, starting a 2-
year break-up negotiation period. Depending on the outcome of the separation settlement, Brexit will
have a double impact on the EU and global sugar markets.
In recent years, the UK produced slightly over 1 million MT of sugar annually, roughly half of its
domestic sugar demand, while it imported the other half. About 40 percent of imports are white sugar
imported from other EU countries, with France as the main supplier while the other 60 percent is
imported as raw sugar and refined in the UK. As a result, Brexit threatens a major export destination for
8 https://ec.europa.eu/agriculture/sites/agriculture/files/markets-and-prices/medium-term-outlook/2016/2016-tables.pdf
continental EU sugar exports while at the same time becoming a major and privileged competitor for
raw sugar imports from EBA and ACP countries, many of which are former UK colonies.
The UK is the second largest net contributor to the EU budget. As such, Brexit is expected to have a
major impact on the EU budget and more particularly for the EU CAP budget. The next CAP 2020 will
be concluded in the recent aftermath of Brexit and therefore the recently started debate about the next
CAP is already taking the Brexit reality on board in the discussion.
However, at this stage it is too early to speculate on what the impact of Brexit will mean for EU sugar
production and markets.
Related reports from FAS Post in the European Union:
Country Title Date
BrusselsUSEU EU Sugar Semi-Annual 2016 9/30/2016
The GAIN Reports can be downloaded from the following FAS website:
http://gain.fas.usda.gov/Pages/Default.aspx

Production, Supply and Demand Data Statistics:
Sugar, Centrifugal 2015/2016 2016/2017 2017/2018
Market Begin Year Oct 2015 Oct 2016 Oct 2017
European Union USDA
Official
New
Post
USDA
Official
New
Post
USDA
Official
New
Post
Beginning Stocks 4151 4151 1131 1374 0 774
Beet Sugar
Production
14000 14017 15920 16222 0 18320
Cane Sugar
Production
280 266 280 278 0 280
Total Sugar
Production
14280 14283 16200 16500 0 18600
Raw Imports 2200 2345 2500 2100 0 1500
Refined Imp.(Raw
Val)
800 840 750 1000 0 500
Total Imports 3000 3185 3250 3100 0 2000
Total Supply 21431 21619 20581 20974 0 21374
Raw Exports 7 5 5 5 0 5
Refined Exp.(Raw
Val)
1493 1540 1495 1495 0 2195
Total Exports 1500 1545 1500 1500 0 2200
Human Dom.
Consumption
18800 18700 18800 18700 0 18650
Other Disappearance 0 0 0 0 0 0
Total Use 18800 18700 18800 18700 0 18650
Ending Stocks 1131 1374 281 774 0 524
Total Distribution 21431 21619 20581 20974 0 21374
(1000 MT)