ETUI-ETUC conference 2016 Panel 7 Piotr Lewandowski
10
Trends in the task composition of jobs in Central and Eastern Europe Piotr Lewandowski Based on work with Wojciech Hardy Roma Keister
-
Upload
european-trade-union-institute -
Category
Presentations & Public Speaking
-
view
165 -
download
3
Transcript of ETUI-ETUC conference 2016 Panel 7 Piotr Lewandowski

Tr e n d s i n t h e t a s k c o m p o s i t i o n o f j o b s i n C e n t r a l a n d E a s t e r n E u r o p e
P i o t r L e w a n d o w s k i
B a s e d o n w o r k w i t h
W o j c i e c h H a r d y
R o m a K e i s t e r

CEE catches up in ICT but the distance to leaders is still large
0%
5%
10%
15%
20%
25%
30%
35%
1998 1999 2000 2001 2002 2003 2004 2005 2006 2007 2008 2009 2010 2011
ICT Stock per Worker relative to the US
Bulgaria Czech Republic Hungary Poland
Romania Slovakia Slovenia
Source: own calculations on Eden & Gaggl (2015) data on ICT capital stock and Eurostat data on employment
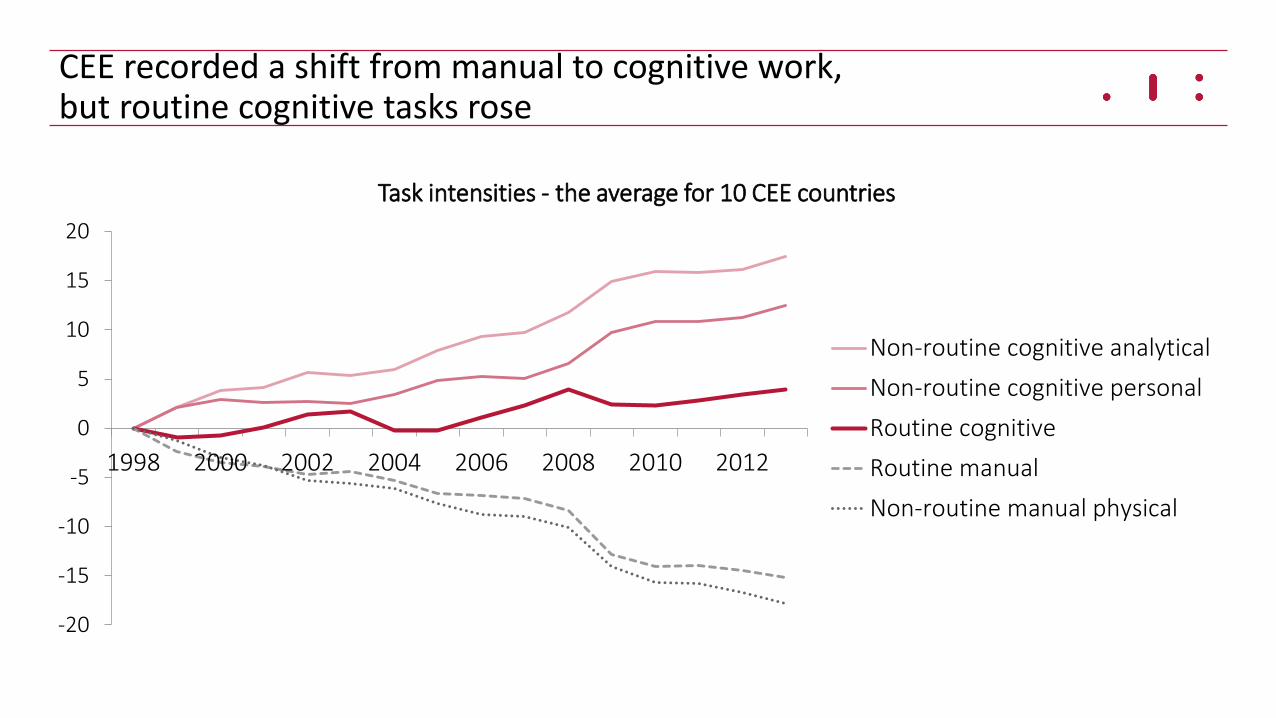
CEE recorded a shift from manual to cognitive work, but routine cognitive tasks rose
-20
-15
-10
-5
0
5
10
15
20
1998 2000 2002 2004 2006 2008 2010 2012
Task intensities - the average for 10 CEE countries
Non-routine cognitive analytical
Non-routine cognitive personal
Routine cognitive
Routine manual
Non-routine manual physical
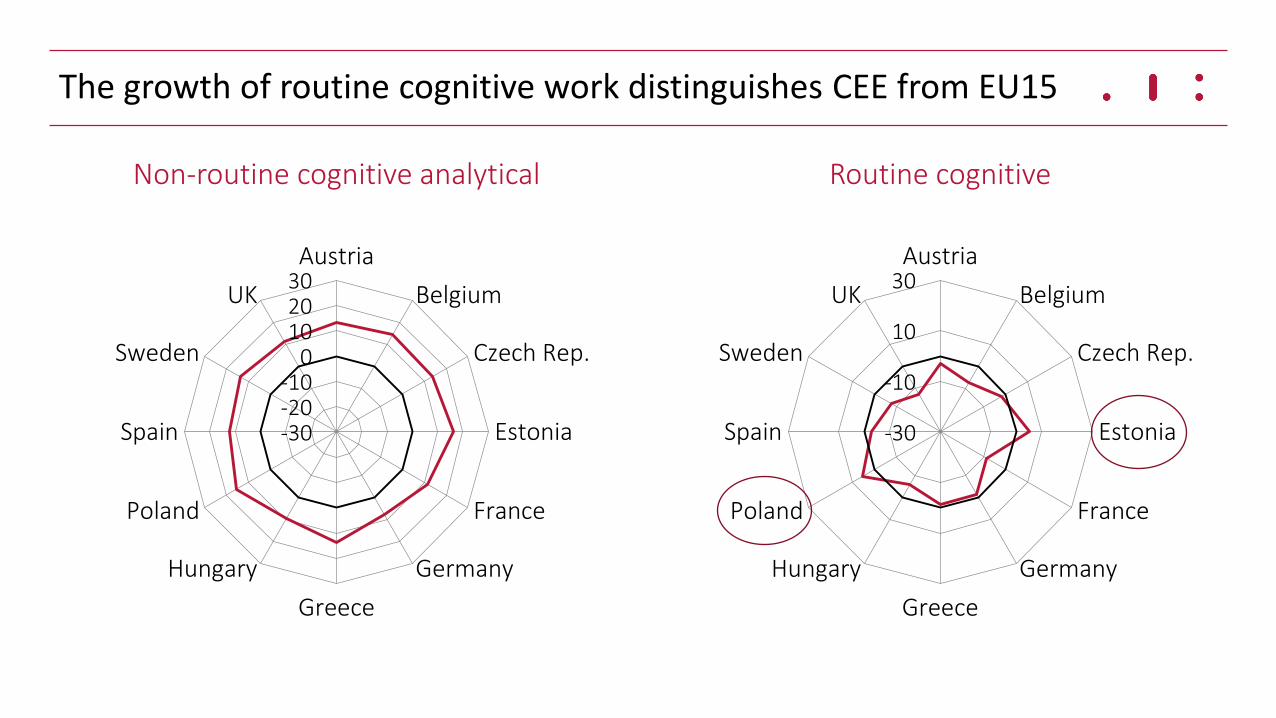
The growth of routine cognitive work distinguishes CEE from EU15
-30-20-10
0102030Austria
Belgium
Czech Rep.
Estonia
France
Germany
Greece
Hungary
Poland
Spain
Sweden
UK
Non-routine cognitive analytical Routine cognitive
-30
-10
10
30Austria
Belgium
Czech Rep.
Estonia
France
Germany
Greece
Hungary
Poland
Spain
Sweden
UK

Trends in the CEE task structure can be largely atributted to workforce upskilling and structural change
-25
-20
-15
-10
-5
0
5
10
15
20
25
Non-routinecognitive analytical
Non-routinecognitive personal
Routine cognitive Routine manual Non-routine manualphysical
Decomposition of task content changes in CEE10, 1998-2000 to 2011-2013
between-sector between-education between-occupation
within-occupation total estimated change total recorded change
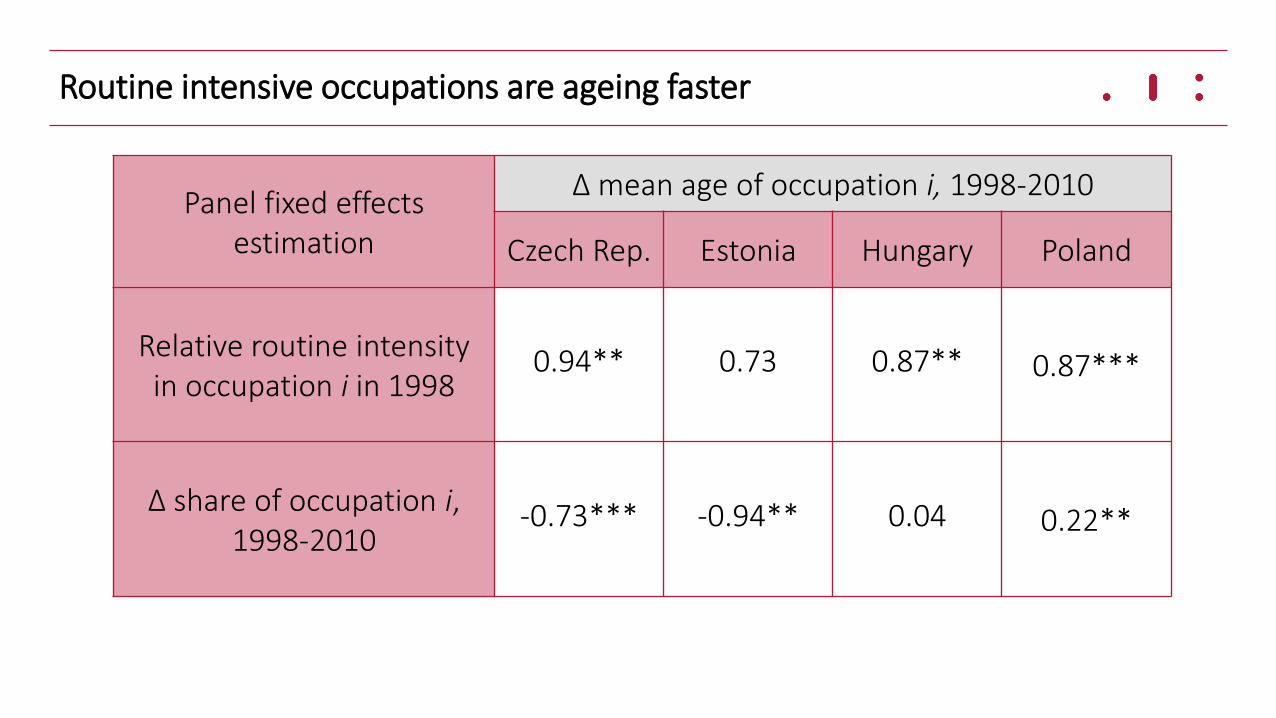
Routine intensive occupations are ageing faster
Panel fixed effects estimation
Δ mean age of occupation i, 1998-2010
Czech Rep. Estonia Hungary Poland
Relative routine intensity in occupation i in 1998
0.94** 0.73 0.87** 0.87***
Δ share of occupation i, 1998-2010
-0.73*** -0.94** 0.04 0.22**

Because the share of young (older) workers declines (rises)
Panel fixed effects estimation on :
Δ share of workers in occupation i, 1998-2010
Czech Rep. Estonia Hungary Poland
15-29 -0.039** 0.001 -0.035*** -0.023**
30-54 0.024 -0.030 0.025* 0.010
55-64 0.022*** 0.018 0.012 0.012***
Controls for Δ share of occupations included in all regressions
Impact of relative routine intensity in occupation i in 1998

Real wage growth in jobs with high relative routine cognitive intensity was high in CEE and there was no polarisation
-2.0-1.5-1.0-0.50.00.51.01.52.0
0%
1%
2%
3%
4%
5%
average annual growth rate of wages (left axis) relative routine intensity in 2002 (right axis)
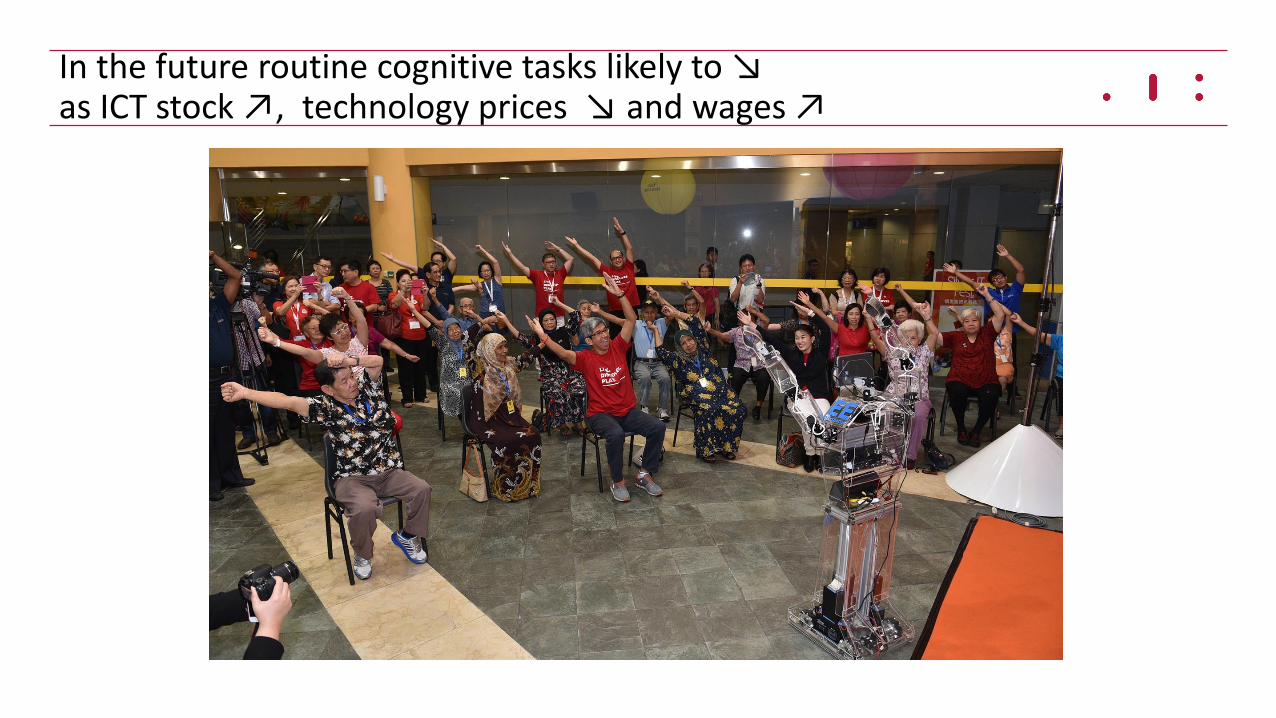
In the future routine cognitive tasks likely to ↘ as ICT stock ↗, technology prices ↘ and wages ↗