Ethnic Complementarities after the Opening of China: How ... · the opening of China in 1978 to...
55
NBER WORKING PAPER SERIES ETHNIC COMPLEMENTARITIES AFTER THE OPENING OF CHINA: HOW CHINESE GRADUATE STUDENTS AFFECTED THE PRODUCTIVITY OF THEIR ADVISORS George J. Borjas Kirk B. Doran Ying Shen Working Paper 21096 http://www.nber.org/papers/w21096 NATIONAL BUREAU OF ECONOMIC RESEARCH 1050 Massachusetts Avenue Cambridge, MA 02138 April 2015 The views expressed herein are those of the authors and do not necessarily reflect the views of the National Bureau of Economic Research. NBER working papers are circulated for discussion and comment purposes. They have not been peer- reviewed or been subject to the review by the NBER Board of Directors that accompanies official NBER publications. © 2015 by George J. Borjas, Kirk B. Doran, and Ying Shen. All rights reserved. Short sections of text, not to exceed two paragraphs, may be quoted without explicit permission provided that full credit, including © notice, is given to the source.
Transcript of Ethnic Complementarities after the Opening of China: How ... · the opening of China in 1978 to...
NBER WORKING PAPER SERIES
ETHNIC COMPLEMENTARITIES AFTER THE OPENING OF CHINA:HOW CHINESE GRADUATE STUDENTS AFFECTED THE PRODUCTIVITY OF THEIR ADVISORS
George J. BorjasKirk B. Doran
Ying Shen
Working Paper 21096http://www.nber.org/papers/w21096
NATIONAL BUREAU OF ECONOMIC RESEARCH1050 Massachusetts Avenue
Cambridge, MA 02138April 2015
The views expressed herein are those of the authors and do not necessarily reflect the views of theNational Bureau of Economic Research.
NBER working papers are circulated for discussion and comment purposes. They have not been peer-reviewed or been subject to the review by the NBER Board of Directors that accompanies officialNBER publications.
© 2015 by George J. Borjas, Kirk B. Doran, and Ying Shen. All rights reserved. Short sections oftext, not to exceed two paragraphs, may be quoted without explicit permission provided that full credit,including © notice, is given to the source.

Ethnic Complementarities after the Opening of China: How Chinese Graduate Students Affectedthe Productivity of Their AdvisorsGeorge J. Borjas, Kirk B. Doran, and Ying ShenNBER Working Paper No. 21096April 2015JEL No. D83,J24,J61,O31
ABSTRACT
The largest and most important flow of scientific talent in the world is the migration of internationalstudents to the doctoral programs offered by universities in industrialized countries. This paper usesthe opening of China in 1978 to estimate the causal effect of this flow on the productivity of their professorsin mathematics departments across the United States. Our identification strategy relies on both thesuddenness of the opening of China and on a key feature of scientific production: intra-ethnic collaboration.The new Chinese students were more likely to be mentored by American professors with Chineseheritage. The increased access that the Chinese-American advisors had to a new pool of considerabletalent led to a substantial increase in their productivity. Despite these sizable intra-ethnic knowledgespillovers, the relatively fixed size of doctoral mathematics programs (and the resulting crowdout ofAmerican students) implied that comparable non-Chinese advisors experienced a decline in the numberof students they mentored and a concurrent decline in their research productivity. In fact, the productivitygains accruing to Chinese-American advisors were almost exactly offset by the losses suffered bythe non-Chinese advisors. Finally, it is unlikely that the gains from the supply shock will be more evidentin the next generation, as the Chinese students begin to contribute to mathematical knowledge. Therate of publication and the quality of the output of the Chinese students is comparable to that of theAmerican students in their cohort.
George J. BorjasHarvard Kennedy School79 JFK StreetCambridge, MA 02138and [email protected]
Kirk B. Doran438 Flanner HallUniversity of Notre DameNotre Dame, IN [email protected]
Ying ShenDepartment of EconomicsUniversity of Notre DameNotre Dame, IN [email protected]

3
Ethnic Complementarities after the Opening of China: How Chinese Graduate Students Affected
the Productivity of Their Advisors
George J. Borjas, Kirk B. Doran, and Ying Shen*
I. Introduction
Scientific knowledge is essential for long-‐term economic growth. Because science is
a social and reciprocal endeavor (Lucas, 2009), the production of scientific knowledge
depends heavily on knowledge spillovers in which one person’s knowledge output
becomes another person’s knowledge input. Although a number of studies have found
evidence for such spillovers (e.g., Waldinger, Moser, and Voena, 2014), the overall evidence
is mixed. Moreover, even when spillovers are found, little is known about how to harness
them. Despite this uncertainty, one specific proposal surfaces repeatedly in policy
discussions: the large-‐scale immigration of high-‐skill persons opens up the opportunity for
knowledge spillovers to occur and for increasing the productivity of the native-‐born
scientific workforce.
A careful examination of the existing research reveals an interesting pattern. On the
one hand, there seem to be powerful knowledge spillovers among scientists who are
directly collaborating with each other (Waldinger, 2010; Azoulay, Zivin, and Wang, 2010).
On the other hand, diminishing returns may dominate when scientists compete for topic-‐
specific or location-‐specific resources (Borjas and Doran, 2012; and the related work of
Waldinger, 2012). A natural inference that can be drawn from these conflicting results is
that a high-‐skill supply shock is more likely to generate spillovers that outweigh the
competitive effects if: (a) collaboration with the newcomers is more likely; and/or (b) the
newcomers are less likely to compete for the scarce resources that are necessary for
knowledge production, such as faculty slots, grant resources, and journal space.
In this paper, we examine the resulting productivity effects of a large high-‐skill
supply shock that shares both of these characteristics: the “immigration” of young graduate
students in mathematics from China. These students were eager to learn from and
* Borjas: Harvard Kennedy School; Doran and Shen, Department of Economics, University of Notre Dame.

4
collaborate with professors in the United States, but, as graduate students, were not
competing for funds or job positions with their advisors. Put differently, there was no direct
competition between the Chinese graduate students and their advisors.
Our study makes use of a historic natural experiment that affected the supply of
Chinese doctoral students: Vice Premier Deng Xiaoping's "Open Up" reforms of December
1978. Before Deng Xiaoping's rapid rise to power, the Cultural Revolution both destroyed
the Chinese higher education system and engendered strict isolationism, causing China to
send virtually no students to doctoral programs abroad for over a decade. After 1978, Deng
Xiaoping's reforms both facilitated the acquiring of the secondary education that is a
prerequisite to “produce” future graduate students, and encouraged the students to acquire
their graduate training in Western universities. This policy shift resulted in a very large and
sudden increase in the number of Chinese students sent to study in doctoral programs
abroad.
The influx of Chinese graduate students in the doctoral mathematics programs of
American universities can be expected to have many productivity repercussions. One
particular consequence of this supply shock is implied by the extensive literature on
diasporas. Multiple studies have documented that people of similar ethnic background
dispersed around the world are much more likely to communicate with each other, to
spread technological knowledge within their ethnic and linguistic network, and to
collaborate on joint ventures (Rauch and Trindade, 2002; Nanda and Khana, 2010; Kerr,
2008; and Kerr and Kerr, 2014). The “ethnic magnet” hypothesis suggests that scientists
may experience the most powerful knowledge spillovers when they interact with those
most ethnically similar to them. In fact, as Freeman and Huang (2014) show, there is a very
strong propensity for ethnically similar scientists to coauthor scientific papers.
If scientists indeed experience the most powerful knowledge spillovers when they
interact with those most ethnically similar to them, the supply shock of Chinese graduate
students in mathematics should result in three distinct outcomes. First, advisors with
Chinese ancestry should mentor more of the new Chinese doctoral students than would
otherwise similar “American” advisors (i.e., mathematicians who did not have Chinese
ancestry). Second, Chinese-‐American advisors should coauthor with their new Chinese
students more frequently than would be predicted by their earlier collaboration profiles, or
5
than otherwise similar American advisors are doing with the (smaller number of) Chinese
students that they managed to attract. Third, the increased intra-‐ethnic collaboration
between Chinese-‐American advisors and Chinese graduate students should perhaps lead to
greater research output for those advisors, even apart from coauthoring with the Chinese
students, as the knowledge gained from the new interactions becomes an input in their
own knowledge production function.
In order to test these implications, we make use of two datasets introduced in Borjas
and Doran (2012). The first is the archive maintained by the American Mathematical
Society (AMS) MathSciNet database of all papers published in mathematics and related
fields worldwide. The second is a collection of advisor-‐advisee matches created and
maintained by the Mathematics Genealogy Project (MGP). Using name-‐matching techniques,
we identify which American advisors and which doctoral students in the MGP data likely
had Chinese ancestry. We then match records from the AMS and MGP files to examine the
trend in the scientific output of advisors over time.
Employing a simple difference-‐in-‐differences strategy, we find that the productivity
of American advisors with Chinese ancestry increased substantially after the opening up of
China and the influx of Chinese students began to substantially affect enrollment in
American mathematics departments. Specifically, the Chinese-‐American advisors began to
mentor more Chinese students; these mentoring relationships resulted in an increased
number of published papers, some of which were the result of collaborations with the
Chinese students; and there was some increased productivity for the Chinese-‐American
advisors even after netting out the “direct” effect of increased collaboration with Chinese
graduate students.
Although these beneficial productivity effects are the ones that are commonly
conjectured and emphasized in the literature, our data allows us to carry the exercise one
step further, a step that has not been examined by previous studies. In particular, the
supply shock could also influence the productivity of the American advisors who did not
have Chinese ancestry. After all, the increased mentoring opportunities for the Chinese-‐
American advisors may have led to a shift in departmental resources, and these resources
likely flowed away from the pre-‐existing American advisors to the pre-‐existing Chinese-‐
American advisors. This kind of redistribution would be particularly important if there are

6
significant crowdout effects from the supply shock—in other words, if American graduate
students were displaced by the increased number of Chinese students because of the
relatively fixed size of mathematics doctoral programs. In short, although there was no
direct competition between the Chinese graduate students and their advisors, the supply
shock may have introduced indirect competitive forces between the Chinese-‐American
advisors and the American advisors who did not have a Chinese heritage.
Our empirical analysis contrasts the experience of the Chinese-‐American advisors
with that of two distinct groups of American mathematicians: the advisors employed in the
departments that attracted most of the Chinese students and the advisors employed in
departments that attracted few Chinese students. It turns out that the departments that
attracted the Chinese students were departments that had a Chinese “connection,” as
measured by the presence of at least one Chinese-‐American professor actively advising
students prior to the opening of China.
Not surprisingly, the supply shock had differential effects on the various groups of
advisors. Specifically, there was a drop in the productivity of the American advisors
employed in the mathematics departments most affected by the supply shock. These
advisors experienced a decline in the number of students they mentored and in the number
of papers they published. As is typical with supply shocks, therefore, there are winners and
losers. In particular, our study documents that there are winners and losers even when
there are sizable productivity spillovers benefitting a particular segment of the scientific
workforce.
Our data allows us to add up the productivity gains accruing to the winners and the
productivity losses suffered by the losers to calculate the change in the aggregate output of
the pre-‐existing advisors. The exercise reveals an unambiguous conclusion: the aggregate
output did not change. The additional research output produced by the pre-‐existing
Chinese-‐American advisors was almost exactly offset by the smaller output produced by
the affected American advisors. Moreover, there is no evidence that the aggregate output is
somehow “better” in any qualitative sense.
Finally, our analysis examines the possibility that the efficiency gains from the
supply shock might show up in subsequent years, as the Chinese students become part of
the mathematics profession and their research output contributes to the body of
7
mathematical knowledge. There is, however, no evidence to suggest that the quantity or
quality of the output eventually produced by the Chinese students themselves is far
superior to that produced by the comparable American students from their cohort.1
In sum, substantial knowledge spillovers were indeed generated by a supply shock
of doctoral students who had strong incentives to collaborate with their ethnically similar
advisors. As is often the case, however, such supply shocks have additional ramifications,
particularly on the pre-‐existing workers who are not part of the ethnic network. These
additional ramifications can greatly attenuate the net benefits resulting from the
knowledge spillovers.
II. Historical Background
Between 1949 and 1969, the Chinese communist regime was firmly committed to
the Sino-‐Soviet alliance. As part of this alliance, the Chinese government implemented the
“leaning to one side” policy, a policy that committed the People’s Republic of China to
pursue actions that systematically favored interactions with the communist bloc. In the
higher education context, this policy instituted strict controls on the subset of countries
that Chinese students were allowed to study in, with the Soviet Union becoming the
dominant country receiving Chinese international students (He, 2008). Between 1949 and
1965, for example, 8,424 Chinese students, or about 78 percent of all international students
originating in China, enrolled in Soviet universities, and most of these students enrolled in
science and technology programs. Not surprisingly, the United States received a trivially
small number of Chinese students during the period—only around 200 Chinese students
enrolled in the universities of Western developed countries. Moreover, most of the 200
Chinese students in Western countries studied foreign languages, with only 21 of them
enrolling in programs in the natural sciences (Mathur, 2007).
The social, economic, and political upheaval that began in the spring of 1966, which
is now collectively known as the Cultural Revolution, and which lasted until October 1976,
1 In related work, Stuen, Mobarak, and Maskus (2012) find that exogenous increases in the total
number of graduate students enrolled in a given field at a given university in a given year cause an increase in the total number of publications produced (by professors and students combined), although the impact of an additional foreign or domestic graduate students seems, on average, to be the same.
8
further cemented the geographic and intellectual isolation of Chinese students. The higher
education system in China was effectively destroyed during those years so that a
remarkably high number of young people lost their opportunities to ever pursue a higher
education (Deng, 1997). Premier Mao Zedong himself laid out the parameters for how the
Cultural Revolution would be applied in the education sector by advising students to:2
Hold high the great banner of the proletarian cultural revolution, thoroughly expose the reactionary bourgeois stand of those so-‐called "academic authorities" who oppose the Party and socialism, thoroughly criticize and repudiate the reactionary bourgeois ideas in the sphere of academic work, education, journalism, literature and art and publishing, and seize the leadership in these cultural spheres. Not surprisingly, the urgent call to action had dramatic and violent consequences. As
MacFarquhar and Schoenhals (2006, p. 126) describe in their comprehensive history of the
Cultural Revolution:3
In Beijing’s western district alone, in the course of little more than two weeks, the violence left close to one hundred teachers, school officials, and educational cadres dead. The number of those injured was, according to one investigation, simply “too large to be calculated”. In every one of eighty-‐five elite colleges, middle schools, and elementary schools throughout China investigated by a Chinese scholar after the Cultural Revolution, teachers were tortured by students. At twelve of them, a teacher was beaten to death; at one school, two teachers were murdered.
As part of the ideological cleansing, China further implemented a closed-‐door policy
that led to a self-‐imposed international isolation, both from countries in the communist
alliance and from Western countries. This closed-‐door policy effectively shut down the
opportunity for any Chinese student to study abroad. Not surprisingly, the combination of
the violent persecution of educators, the political upheaval in educational institutions, and
the closed-‐door policy substantially shrank the domain of the knowledge production
2 Circular of the Central Committee of the Chinese Communist Party, May 16, 1966. See https://www.marxists.org/subject/china/documents/cpc/cc_gpcr.htm.
3 See Wang (2001) for a discussion of the impact of the Cultural Revolution on the education sector, including detailed descriptions of the consequences for specific universities and faculty. Professor Wang also maintains a website at the University of Chicago (hum.uchicago.edu/faculty/ywang/history/) that contains a great deal of information on the Cultural Revolution and provides biographies of many of the victims.
9
function, and the resulting opportunity cost for China’s economic development was
enormous. It is conservatively estimated that because of the Cultural Revolution, China
suffered a loss of 100,000 potential graduate degree holders between 1965 and 1976, along
with a loss of one million qualified undergraduates and two million specialized secondary
graduates (Song, 2009).
In December 1978, two years after Mao’s death, China entered a historical turning
point when Vice Premier Deng Xiaoping proposed a comprehensive transformation of
China’s society and economy.4 This policy shift, which went under the names of “Chinese
Economic Reform” or “Economic Reform and Open Up Policy,” effectively sparked the
transformation of China that eventually led the country to become one of the world’s
largest economies. A key component of Deng Xiaoping’s proposal, known as the Four
Modernizations, was the long-‐term goal of modernizing China’s agricultural, industrial,
scientific, and technological sectors.
Vice Premier Xiaoping’s proposed reforms had a profound impact on China’s
education system. In particular, the government began to encourage the best and brightest
Chinese students to study abroad, and particularly to enroll in universities located in
Western industrialized countries. In June 1978, for example, at a conference meeting with
professors from Tsinghua University that took place just a few months before the formal
introduction of the Chinese Economic Reform, Vice Premier Xiaoping emphasized that:5
I highly support and encourage a quick increase in the number of overseas Chinese students, since this will be one of the most essential ways to accelerate the development of our outdated technology. As part of the reforms, Deng Xiaoping made a strategic (and historic) decision to
send 3,000 Chinese students annually to study in different countries, including the United
States. Besides directly sending these government-‐sponsored and government-‐funded
students, the Vice Premier encouraged outstanding Chinese students to study abroad by
applying for teaching and research assistantships available in foreign institutions. Doctoral
4 Deng Xiaoping was the key leader in China from the late 1970s to the early 1990s. Immediately following the introduction of the reforms, Chinese-‐U.S. diplomatic relations were formally established in January 1979, opening up a new chapter in Sino-‐American relations.
5 Chen (2007), p. 30.

10
programs in the United States quickly began to receive many such applications for
admission, and these programs became among the most generous in admitting and
welcoming such students. The exogenous supply shock sparked by the Deng Xiaoping
reforms was dramatic. China had sent nearly zero students to study in American
universities between the 1950s and the late 1970s. By the late 1980s, however, China had
become the leading sender of international students to the United States.6 In the 1989-‐
1990 academic year, for example, China accounted for 33,000 (or 8.6 percent) of the
387,000 international students in the country.
This paper examines the impact of the supply shock of Chinese graduate students in
a specific field, mathematics, on a specific country, the United States, where the available
data allow us to comprehensively describe the impact of the shock on knowledge
production in the field. Figure 1 illustrates the number of Chinese doctoral students in
mathematics graduating from American institutions between 1960 and 2004. It is evident
that there was a dramatic increase in the number of Chinese doctoral recipients sometime
in the late 1980s, as the impact of the reforms initiated by Deng Xiaoping took hold. In fact,
the number of doctoral degrees awarded to Chinese students increased almost six-‐fold,
from 65 to 381, between 1980 and 1990.7
It is obviously difficult to pinpoint a specific date when the supply shock began to be
fully felt in the production pipeline for mathematics doctorates in American universities.
After all, it probably took at least a year or two for the reforms initiated by Deng Xiaoping
to “filter down” and influence student behavior in the vast country of China. It would also
take another year or two for these students to establish the credentials, work through the
application process, and be accepted by American universities. And it would take another 6
years or so for the accepted students to actually complete their course work, to write their
dissertation, and to receive their doctoral degree. Given these obvious and inevitable time
lags, it is not surprising that the (higher) number of Chinese mathematicians graduating
from American universities did not stabilize until around 1989, towards the end of the
6 Institute of International Education (2013) and Institute of International Education (2009).
7 We describe the methodology for identifying the sample of Chinese doctoral recipients in the next section. It relies on a match between the surname of the recipient and a comprehensive list of Chinese surnames.

11
decade. The data illustrated in Figure 1 strongly confirm the existence of an exogenous
supply shock (with a lag) resulting from the Deng Xiaoping-‐initiated reforms.
III. Data We employ data drawn from three distinct sources to identify the ethnic
background and track the professional careers of mathematicians in the United States. First,
we have access to a database listing all papers published in mathematics and related fields.
This exhaustive listing of mathematics publications is compiled and maintained by the
American Mathematical Society (AMS) at MathSciNet, and is available for the period
between 1939 and the present. Second, we have access to data collected by the
Mathematics Genealogy Project (MGP), a database that matches advisors and advisees in
mathematics doctoral programs since the 1300s. Finally, we use a database of ethnic names
that allows us to identify the Chinese heritage of the mathematicians in our sample.
In addition to providing comprehensive coverage of the universe of academic
papers published by mathematicians worldwide, the AMS data has one feature that makes
it particularly useful in the present context: The professional staff at the AMS assigns each
published mathematician a unique author identifier that follows a particular person
throughout his or her career. The availability of these (carefully assigned) unique
identifiers solves the problem of distinguishing the research profiles of authors who have
similar names or initials. We have access to a version of the AMS database aggregated at
the author, year of publication, and field of research level. For each author-‐year-‐field cell,
the database reports the number of papers published, as well as the number of citations
that those papers eventually earned from top journals in mathematics after the year 2000.
Our version of the AMS database covers all papers published between 1939 and the first
half of 2010, and was first used in Borjas and Doran (2012).
The MGP data reports the name of each doctoral degree holder in mathematics, the
name of the advisor, the year the degree was earned, the institution that granted the degree,
and the country where that institution is located.8 Crucially, it also contains an
8 The MGP is a worldwide database. The degree in question may then depend on the cultural or
educational context. In most cases, the degree is a Doctor of Philosophy, but it may also be a Doctor of Science,

12
administrative match between the advisors and advisees and the unique author identifiers
in the AMS database. In other words, by using the unique author identifier we have access
to the history of published output produced by the advisors and advisees identified in the
MGP data.
To determine the scope of the coverage of the MGP advisor-‐advisee matches and the
thoroughness of the match with the AMS data, we compared the degrees reported in the
MGP file to the degrees listed in the annual census of new mathematics doctoral degrees
awarded by North American universities and published annually by the American
Mathematical Society. Using the published census as the “universe” of doctoral degrees in
mathematics, we randomly chose 20 students from each of the following graduation years:
1980, 1985, 1990, 1994, 2000, 2005, and 2009. We found that the MGP file contained the
relevant (and correct) information for between 85 and 100 percent of the degrees awarded
in any given year, with an overall coverage rate of 93 percent. Furthermore, we found that
only 2 percent of mathematics doctoral recipients should have been matched to the AMS
unique author identifiers (because the author in question published a paper between 1939
and 2010), but were not. This robustness check of the underlying data, therefore, makes us
confident that our matched MGP-‐AMS data has almost complete coverage of the universe of
mathematicians either advising students and/or awarded a doctoral degree at the time of
the Chinese supply shock.
Finally, we identify the Chinese heritage of the mathematicians in our sample by
matching their surnames with a list of Chinese surnames. The source of Chinese surnames
used in this paper is compiled in the genealogy section of FamilyEducation.com, the oldest
and most visited website offering parental advice. In the context of this paper, this website
is particularly useful because it provides a comprehensive list of the most common Chinese
surnames.9 Many alternative lists of Chinese surnames, for example, only provide the top
100 surnames; the list available at Family Education is far more thorough, listing more than
a Candidate's Degree, etc. We will only be looking at degrees awarded in the United States, where the relevant degree is the Doctor of Philosophy.
9 http://genealogy.familyeducation.com/browse/origin/chinese.

13
400 Chinese surnames.10 In addition, the Family Education database not only provides a
phonetic system for transcribing the Mandarin pronunciations of Chinese surnames into
the Latin alphabet (Pinyin), but also provides the phonetic system for transcribing the
Cantonese pronunciations of Chinese surnames into the Latin alphabet (Jyutping). Because
the Cantonese make up the largest group of Chinese immigrants to the United States, the
inclusion of Cantonese Jyutping translations is particularly important to ensure that our
identification of Chinese mathematicians misses few observations.
We classify a mathematician as having “Chinese heritage” (or, more conveniently,
being “Chinese”) if the mathematician’s surname matches one of the surnames in the
Family Education list. We merge the list of Chinese surnames available in Family Education
with the MGP database to identify which advisors and advisees had Chinese ancestry.11
A potential problem with our approach to identifying the Chinese heritage of
doctoral recipients is that it also “catches” U.S.-‐born persons of Chinese ancestry as well as
foreign students born in Taiwan. There were no sudden changes in the birthrates of
Chinese-‐Americans twenty-‐two years before the shock took place, making it unlikely that
the supply increase shown in Figure 1 could be explained by a sudden rise in the number of
Chinese-‐American students seeking to become professional mathematicians. Similarly,
aggregate counts from the NSF census of doctorates indicates that around 30 to 40 doctoral
degrees in mathematics were awarded annually to students born in Taiwan both before
and after the opening of China, while the number of degrees awarded to persons born in
the People’s Republic of China rose from near zero in the early 1980s to around 200 in the
early 1990s. In short, the rapid increase in the number of degrees awarded to Chinese
students documented in Figure 1 was a direct result of the supply increase induced by the
Deng Xiaoping reforms.
Table 1 uses our merged AMS-‐MGP data to calculate summary statistics on the
number of doctoral degrees awarded in mathematics by American universities between
10 The top 100 Chinese surnames account for 85 percent of China's population, so that a list of 400 surnames is quite comprehensive (Lafraniere, 2009).
11 Although using surnames to construct the sample of mathematicians with Chinese heritage is not ideal, we randomly sampled 200 of the identified Chinese advisors and Chinese advisees and manually checked their profiles in MathSciNet. More than 95 percent of the mathematicians in this random sample were indeed Chinese (or Chinese-‐American).
14
1975 and 2004. The data clearly show a sizable increase in the rate at which these degrees
were produced between the first half and the last half of this period, with a
disproportionately greater rise in the number of degrees awarded to Chinese students. The
number of degrees awarded annually to Chinese students rose by over 300 percent
between the pre-‐ and post-‐1989 periods. However, the number of degrees awarded to
American (i.e., non-‐Chinese) students rose by only 59 percent. Equally important, the
Chinese students gravitated heavily towards Chinese advisors throughout the entire period.
A Chinese student had a 13.2 percent probability of being mentored by a Chinese-‐American
advisor, as compared to only a 3.4 percent probability for the typical American student.
Table 2 reports summary statistics for the sample of advisors that we will use in the
empirical analysis reported below. The construction of the sample requires that these
advisors mentored at least one doctoral student in the United States between 1975 and
2004.12 In addition, we restrict the analysis to the “pre-‐existing” stock of professional
mathematicians, so that the advisors in our sample must have published at least one paper
before 1986.13
The table reports statistics for two distinct groups: the advisors who have Chinese
heritage and the residual sample of advisors who did not have Chinese heritage. For
expositional convenience, we will refer to the advisors in the latter group as “American
advisors,” although it is obvious that this sample includes advisors of various ethnicities,
and some were born outside the United States.14 Note that by restricting the sample to
“pre-‐existing” advisors, we will be focusing on how the influx of Chinese graduate students
affected the productivity of mathematicians who had established professional careers prior
to the supply shock.
12 We define mentoring a student at an American institution as the union of: (a) being listed as the
Ph.D. advisor for a fully matched recipient of a Ph.D. degree (i.e. a person that was administratively matched in both the MGP and AMS data); and (b) the MGP information for that degree reports that it was granted by an institution located in the United States.
13 By using 1986 as the year that defines the pre-‐existing group of mathematicians, we avoid the possibility that the group of “Chinese-‐American” advisors could include many of the Chinese foreign-‐born students who were themselves part of the supply shock, but who chose to remain in the United States after getting their degree rather than return to the People’s Republic of China.
14 The number of foreign-‐born advisors in our sample is likely to be relatively small. The NSF census of doctorates reports that only around 20 percent of doctoral degrees in mathematics awarded prior to 1986 were granted to foreign-‐born persons.
15
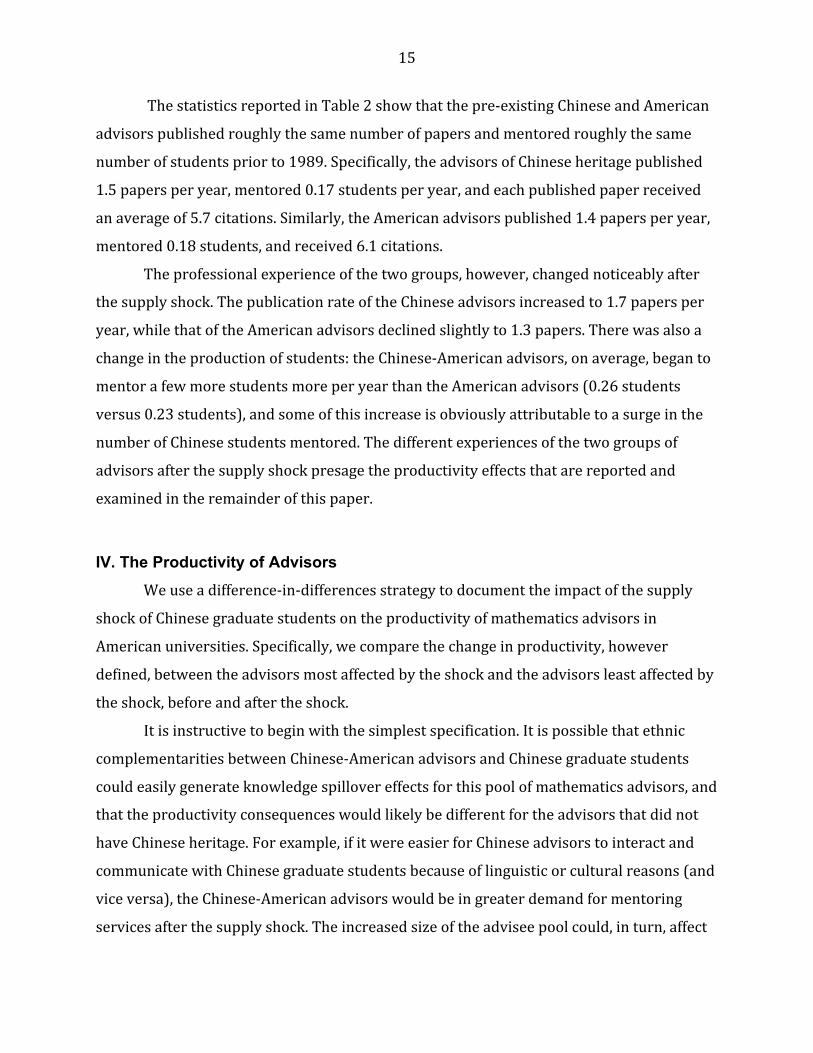
The statistics reported in Table 2 show that the pre-‐existing Chinese and American
advisors published roughly the same number of papers and mentored roughly the same
number of students prior to 1989. Specifically, the advisors of Chinese heritage published
1.5 papers per year, mentored 0.17 students per year, and each published paper received
an average of 5.7 citations. Similarly, the American advisors published 1.4 papers per year,
mentored 0.18 students, and received 6.1 citations.
The professional experience of the two groups, however, changed noticeably after
the supply shock. The publication rate of the Chinese advisors increased to 1.7 papers per
year, while that of the American advisors declined slightly to 1.3 papers. There was also a
change in the production of students: the Chinese-‐American advisors, on average, began to
mentor a few more students more per year than the American advisors (0.26 students
versus 0.23 students), and some of this increase is obviously attributable to a surge in the
number of Chinese students mentored. The different experiences of the two groups of
advisors after the supply shock presage the productivity effects that are reported and
examined in the remainder of this paper.
IV. The Productivity of Advisors We use a difference-‐in-‐differences strategy to document the impact of the supply
shock of Chinese graduate students on the productivity of mathematics advisors in
American universities. Specifically, we compare the change in productivity, however
defined, between the advisors most affected by the shock and the advisors least affected by
the shock, before and after the shock.
It is instructive to begin with the simplest specification. It is possible that ethnic
complementarities between Chinese-‐American advisors and Chinese graduate students
could easily generate knowledge spillover effects for this pool of mathematics advisors, and
that the productivity consequences would likely be different for the advisors that did not
have Chinese heritage. For example, if it were easier for Chinese advisors to interact and
communicate with Chinese graduate students because of linguistic or cultural reasons (and
vice versa), the Chinese-‐American advisors would be in greater demand for mentoring
services after the supply shock. The increased size of the advisee pool could, in turn, affect

16
both the quantity and quality of the published output of Chinese advisors, either through an
increase in the number of collaborations or through knowledge spillovers on their own
research program.
Our data consists of a panel constructed at the advisor-‐year level. The data,
therefore, tracks the productivity of a particular advisor over time, and the panel allows us
to relate the change in productivity to the supply shock of Chinese graduate students. The
data consists of the 219 Chinese-‐American advisors and 5,277 American advisors first
introduced in Table 2. Recall that all of these mathematicians published their first paper
prior to 1986, so that the sample represents the pre-‐existing stock of potential
mathematics advisors in American universities. The panel tracks the productivity of these
advisors in each year over the 1975-‐2004 period.
To assess whether the supply shock had any relative productivity effects, we first
estimate the regression model:
(1) yit = α Xit + ϕi + ϕt + γ (Ci × T) + ε,
where yit measures the productivity of advisor i at time t; φi represents a vector of advisor
fixed effects; φt represents a vector of year fixed effects; Xit is a vector of standardizing
variables; T is a dummy variable indicating if the observation is observed in the post-‐shock
period (defined as 1989 or beyond); and Ci is a dummy variable indicating if advisor i is
Chinese-‐American.15 The variables included in X control for the advisor’s years of work
experience (defined as a vector of fixed effects giving the number of years elapsed since the
advisor’s first publication in 5-‐year bands).
Note that the regression adjusts for individual-‐specific fixed effects in productivity,
as well as for any calendar year fixed effects that affect the productivity of all advisors
equally. We estimate equation (1) using various alternative measures of advisor
productivity. All standard errors are clustered at the advisor level.
15 We estimated the regression models using alternative values for the specific year of the supply
shock (e.g., 1986, 1987, or 1988). The qualitative nature of our evidence is robust to the choice of a particular date.
17
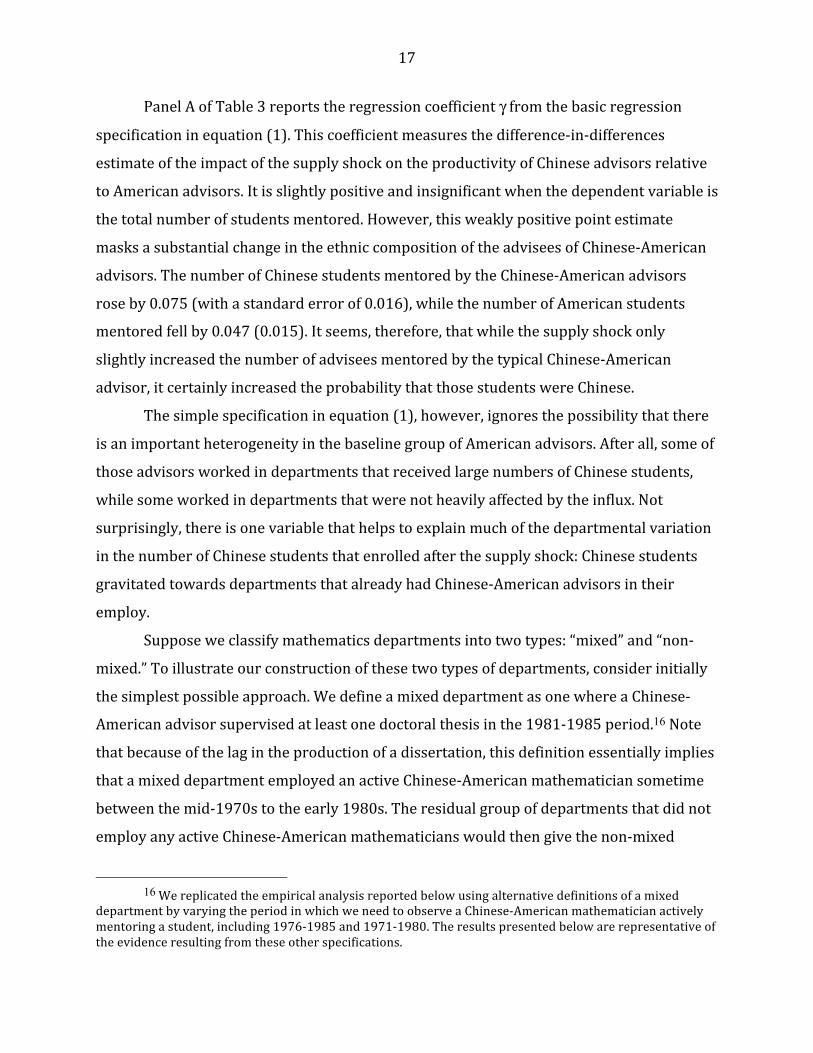
Panel A of Table 3 reports the regression coefficient γ from the basic regression
specification in equation (1). This coefficient measures the difference-‐in-‐differences
estimate of the impact of the supply shock on the productivity of Chinese advisors relative
to American advisors. It is slightly positive and insignificant when the dependent variable is
the total number of students mentored. However, this weakly positive point estimate
masks a substantial change in the ethnic composition of the advisees of Chinese-‐American
advisors. The number of Chinese students mentored by the Chinese-‐American advisors
rose by 0.075 (with a standard error of 0.016), while the number of American students
mentored fell by 0.047 (0.015). It seems, therefore, that while the supply shock only
slightly increased the number of advisees mentored by the typical Chinese-‐American
advisor, it certainly increased the probability that those students were Chinese.
The simple specification in equation (1), however, ignores the possibility that there
is an important heterogeneity in the baseline group of American advisors. After all, some of
those advisors worked in departments that received large numbers of Chinese students,
while some worked in departments that were not heavily affected by the influx. Not
surprisingly, there is one variable that helps to explain much of the departmental variation
in the number of Chinese students that enrolled after the supply shock: Chinese students
gravitated towards departments that already had Chinese-‐American advisors in their
employ.
Suppose we classify mathematics departments into two types: “mixed” and “non-‐
mixed.” To illustrate our construction of these two types of departments, consider initially
the simplest possible approach. We define a mixed department as one where a Chinese-‐
American advisor supervised at least one doctoral thesis in the 1981-‐1985 period.16 Note
that because of the lag in the production of a dissertation, this definition essentially implies
that a mixed department employed an active Chinese-‐American mathematician sometime
between the mid-‐1970s to the early 1980s. The residual group of departments that did not
employ any active Chinese-‐American mathematicians would then give the non-‐mixed
16 We replicated the empirical analysis reported below using alternative definitions of a mixed
department by varying the period in which we need to observe a Chinese-‐American mathematician actively mentoring a student, including 1976-‐1985 and 1971-‐1980. The results presented below are representative of the evidence resulting from these other specifications.
18
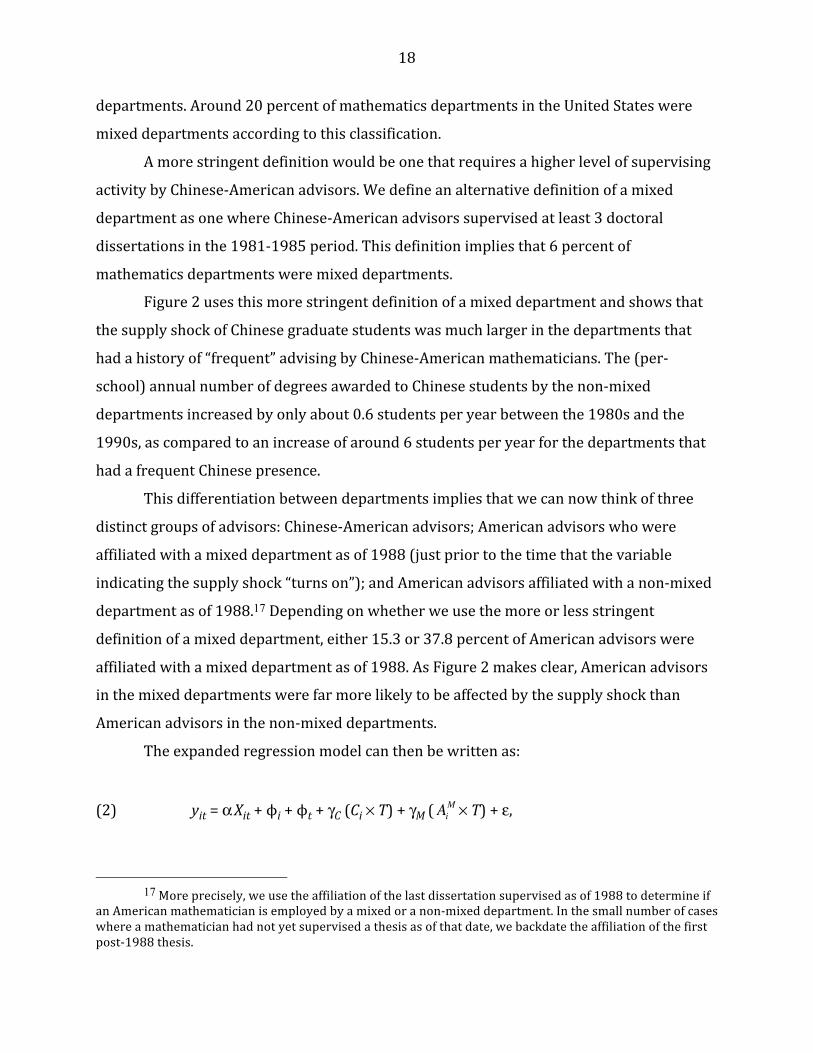
departments. Around 20 percent of mathematics departments in the United States were
mixed departments according to this classification.
A more stringent definition would be one that requires a higher level of supervising
activity by Chinese-‐American advisors. We define an alternative definition of a mixed
department as one where Chinese-‐American advisors supervised at least 3 doctoral
dissertations in the 1981-‐1985 period. This definition implies that 6 percent of
mathematics departments were mixed departments.
Figure 2 uses this more stringent definition of a mixed department and shows that
the supply shock of Chinese graduate students was much larger in the departments that
had a history of “frequent” advising by Chinese-‐American mathematicians. The (per-‐
school) annual number of degrees awarded to Chinese students by the non-‐mixed
departments increased by only about 0.6 students per year between the 1980s and the
1990s, as compared to an increase of around 6 students per year for the departments that
had a frequent Chinese presence.
This differentiation between departments implies that we can now think of three
distinct groups of advisors: Chinese-‐American advisors; American advisors who were
affiliated with a mixed department as of 1988 (just prior to the time that the variable
indicating the supply shock “turns on”); and American advisors affiliated with a non-‐mixed
department as of 1988.17 Depending on whether we use the more or less stringent
definition of a mixed department, either 15.3 or 37.8 percent of American advisors were
affiliated with a mixed department as of 1988. As Figure 2 makes clear, American advisors
in the mixed departments were far more likely to be affected by the supply shock than
American advisors in the non-‐mixed departments.
The expanded regression model can then be written as:
(2) yit = α Xit + ϕi + ϕt + γC (Ci × T) + γM (AiM × T) + ε,
17 More precisely, we use the affiliation of the last dissertation supervised as of 1988 to determine if
an American mathematician is employed by a mixed or a non-‐mixed department. In the small number of cases where a mathematician had not yet supervised a thesis as of that date, we backdate the affiliation of the first post-‐1988 thesis.

19
where AiM is a dummy variable indicating if advisor i is an American advisor employed in a
mixed department in 1988.18 The omitted group in equation (2), of course, is the group of
American advisors employed in non-‐mixed departments. The coefficient γC in equation (2)
now gives the difference-‐in-‐differences estimate of the impact of the supply shock on the
productivity of Chinese advisors (relative to American advisors in non-‐mixed departments),
while the coefficient γM measures the corresponding impact on the productivity of
American advisors in mixed departments.
As with the simpler specification in equation (1), we would expect ethnic
complementarities in knowledge production to increase the productivity of Chinese
advisors, so that γC would be positive. However, the potential impact on the productivity of
the American advisors employed by the mixed departments is less clear-‐cut. These
advisors could perhaps benefit from the presence of additional Chinese students, although
it seems reasonable to suspect that the spillovers would be weaker than those affecting the
Chinese advisors in those same departments. Such a differential spillover effect could arise,
for example, if Chinese advisees are more likely to coauthor with Chinese advisors than
with American advisors. The influx of Chinese students could also affect the size of the
potential advisee pool for American advisors in an indirect way. For example, if the
admission of Chinese graduate students crowds out American graduate students, the
supply shock might shrink the number of students that American advisors could mentor
and collaborate with.
Finally, there is little reason for the supply shock to have much of an impact on the
productivity of American advisors working in the non-‐mixed departments, which serves as
the control group in the regression model. As Figure 2 indicates, this group of advisors was
not particularly affected by the supply shock because the non-‐mixed departments attracted
relatively few Chinese graduate students after the opening up of China. The impact on the
productivity of American advisors employed by such departments would most likely be
18 Note that the variable Ai
M is not indexed by t, so that the regression captures the reduced-‐form effect of being initially employed in a non-‐mixed department, regardless of whether the mathematician remained in that department or moved elsewhere at some point after the supply shock.

20
composed of second-‐order effects, resulting from feedback mechanisms in the academic
marketplace.
Panels B and C of Table 3 report the estimates of the coefficients γC and γM using the
two alternative definitions of a mixed department. To simplify the exposition, we will
mainly discuss the coefficients summarized in Panel C, which uses the more stringent
definition. The qualitative nature of the evidence, however, is robust to the definition used.
Consider initially the regression where the dependent variable is the total number
of students produced by an advisor in a particular year. As with the simpler specification
discussed earlier, the supply shock of Chinese graduate students did not lead to a sizable
increase in the number of students that the Chinese advisors produced. The coefficient γC is
again positive and insignificant, with a value of 0.026 (0.022). However, the impact of the
supply shock on the number of students produced by American advisors in the mixed
departments is slightly negative (but insignificant). In other words, although the supply
shock seemed to slightly increase the total number of students produced by Chinese
advisors, it also seemed to slightly reduce the number produced by the American advisors
in the mixed departments.
The next two columns of Table 3 illustrate the underlying mechanism behind these
results. Specifically, they report the impact of the supply shock on the number of Chinese
and American students mentored, respectively. It is evident that the supply shock
increased the relative number of Chinese students produced by Chinese advisors; the
coefficient is 0.077 (0.016). At the same time, however, the supply shock reduced the
relative number of American students mentored by these advisors; the coefficient is -‐0.050
(0.015). The magnitude of the regression coefficients implies that the increased number of
Chinese students mentored by the Chinese-‐American advisors was almost offset by a
reduction in the number of American students mentored. In other words, the supply shock
led to a substantial ethnic redistribution of mentoring activities by the Chinese-‐American
advisors—away from American students and towards Chinese students.
At the same time, the American advisors in mixed departments saw both an increase
in the number of Chinese students mentored (relative to the control group), and a
somewhat larger decline in the number of American students mentored. The net decline in

21
the production of advisees by American advisors in the mixed departments, therefore, is
entirely due to the fact that the supply shock of Chinese graduate students seems to have
reduced the number of American students that they could mentor.
It is instructive to illustrate the raw data that underlies these results on the
production of students. Figures 3 and 4 illustrate the trend in the “unexpected” number of
students mentored after the supply shock. In particular, we calculate for each advisor the
average annual number of Chinese advisees (in Figure 3) or American advisees (in Figure
4) before 1989. We then calculate a residual giving the difference between the actual
number of students that the advisor supervised each year and the number that would be
expected from their pre-‐1989 activities. The figures dramatically show the unexpected
increase in the number of Chinese students mentored by Chinese advisors in the post-‐
shock period, as well as the relative decline in the production of American students by
American advisors employed in the mixed departments.
The last two columns of Table 3 continue our analysis by estimating the regression
model using two additional measures of output: the number of papers produced in a given
year and the number of citations per paper published that year. Consider initially the
results on the quantity of published output. The regression coefficients clearly indicates an
increase in the relative number of papers published by Chinese advisors in the post-‐shock
period; the coefficient in Panel C is 0.167 (0.089). Put differently, the supply shock
increased the number of papers published by the typical Chinese advisor by around 1.7
papers over a 10-‐year period (relative to the output of American advisors in the control
group). At the same time, the supply shock led to a relative decline in the number of papers
published by the American advisors in the mixed departments—a decline of more than a
half-‐a-‐paper over the decade. In sum, relative to the control group that was presumably
least affected by the influx of Chinese students, the Chinese-‐American advisors began to
publish more and their American colleagues in the mixed departments began to publish
less.
Figure 5 illustrates the raw data that underlies these regression results. Specifically,
the figure again shows the trend in the “residual” that results from differencing an advisor’s
annual number of papers from the average number of papers he or she published prior to
1989. The figure clearly documents the rise in the publication rate of Chinese-‐American

22
advisors and the absolute and relative decline in the publication rate of American advisors
employed in the mixed departments.
It is important to note, however, that the productivity effects of the supply shock
seem to be restricted to the quantity of published output, rather than the quality of the
output. The regression analysis reported in the last column of Table 3 does not provide any
evidence to indicate that the supply shock had an impact on the number of citations
received by the papers written by the typical advisor in any of the groups, regardless of
whether the advisor is Chinese or American, or whether the advisor works in a mixed or
non-‐mixed department.
To summarize, the supply shock of Chinese graduate students sparked by the
opening of China led to: (a) an increase in the number of Chinese students mentored and an
increase in the number of papers published by the pre-‐existing group of Chinese-‐American
advisors employed in American universities; and (b) a decrease in the number of students,
specifically American students, and a decrease in the number of papers published by the
pre-‐existing group of American advisors in the departments that were most likely to attract
the Chinese graduate students. The remainder of this paper shows that these reduced-‐form
results are consistent with the hypothesis that there exist strong ethnic complementarities
in knowledge production in an institutional setting where the size of departments is
roughly fixed so that the influx of Chinese graduate students led to a crowdout of American
graduate students.
V. Ethnic complementarities in production
The evidence suggests that the supply shock of Chinese graduate students affected
both the number of students mentored by an advisor and the advisor’s publication
productivity, and that these effects differed between the pre-‐existing advisors who had
Chinese heritage and those who did not. It is easy to imagine how this differential effect in
publication productivity might arise. The exogenous shift in the size and composition of the
pool of advisees induced by the opening of China changed the sphere of the advisor’s
network of potential collaborations. It is not unusual in many sciences for advisors to
coauthor at least one paper with their students. Further, Freeman and Huang (2014)
23
document that academic collaboration tends to follow ethnic lines. It would not then be
surprising to find that as the pool of Chinese graduate students in the United States
increased, the Chinese-‐American advisors would produce more papers because of an
increased probability of coauthoring with their ethnically similar students. Even in the
absence of any additional collaboration opportunities, the increased size of the Chinese
advisee pool could influence the advisor’s research activity in less direct ways. The
Chinese-‐American advisor may suddenly see paths to research questions that were clouded
prior to his interaction with the students.
It is easy to imagine why advisors and advisees might be complements in the
production of a particular advisor’s research output. The advisor’s experience and know-‐
how clearly increases the productivity of the student. Similarly, the process of mentoring
and teaching, as well as the new perspectives introduced by the advisee, cannot help but
influence the advisor’s research activities. The key question in the context of this paper,
however, is whether such complementarities are stronger when the advisors and the
advisee share an ethnic background.
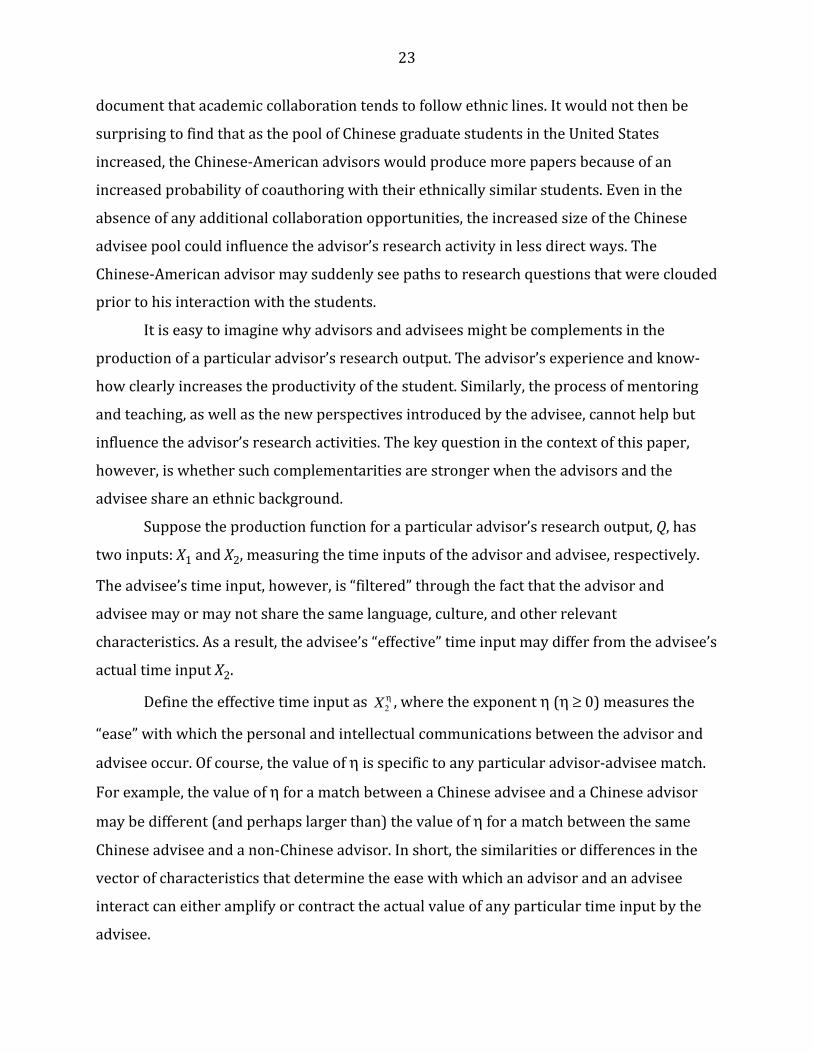
Suppose the production function for a particular advisor’s research output, Q, has
two inputs: X1 and X2, measuring the time inputs of the advisor and advisee, respectively.
The advisee’s time input, however, is “filtered” through the fact that the advisor and
advisee may or may not share the same language, culture, and other relevant
characteristics. As a result, the advisee’s “effective” time input may differ from the advisee’s
actual time input X2.
Define the effective time input as X2η , where the exponent η (η ≥ 0) measures the
“ease” with which the personal and intellectual communications between the advisor and
advisee occur. Of course, the value of η is specific to any particular advisor-‐advisee match.
For example, the value of η for a match between a Chinese advisee and a Chinese advisor
may be different (and perhaps larger than) the value of η for a match between the same
Chinese advisee and a non-‐Chinese advisor. In short, the similarities or differences in the
vector of characteristics that determine the ease with which an advisor and an advisee
interact can either amplify or contract the actual value of any particular time input by the
advisee.
24
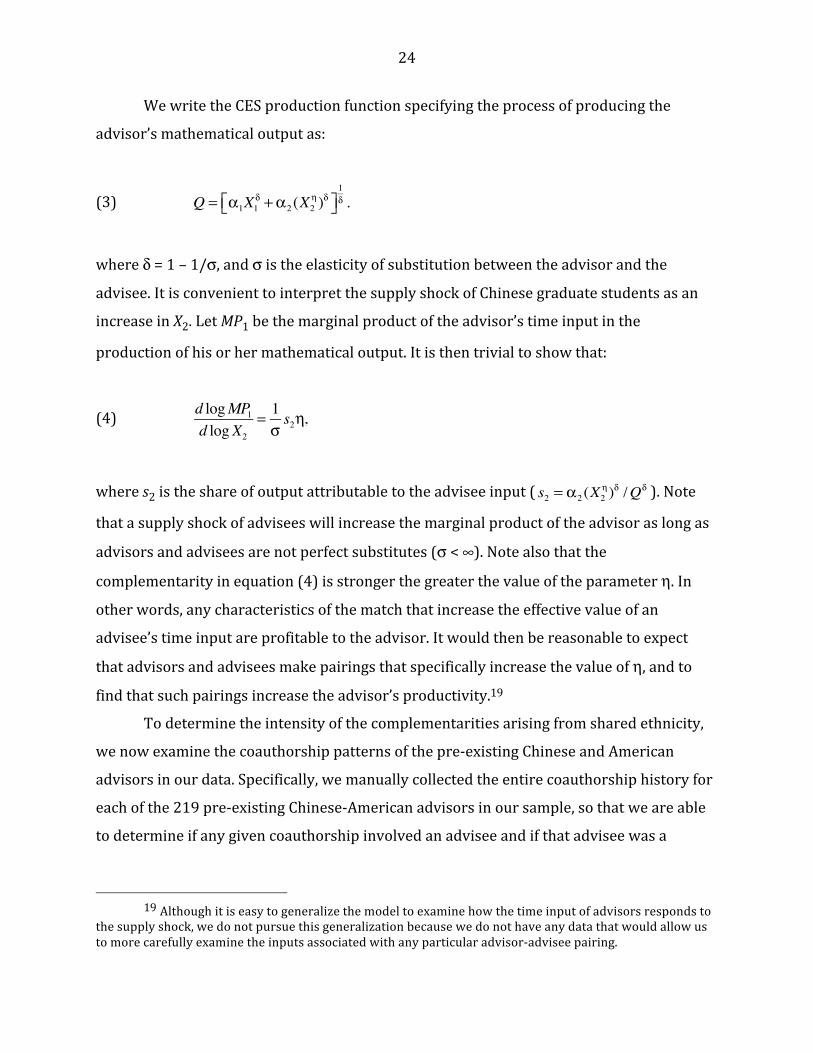
We write the CES production function specifying the process of producing the
advisor’s mathematical output as:
(3) Q = α1X1δ +α2 (X2
η)δ⎡⎣ ⎤⎦1δ .
where δ = 1 – 1/σ, and σ is the elasticity of substitution between the advisor and the
advisee. It is convenient to interpret the supply shock of Chinese graduate students as an
increase in X2. Let MP1 be the marginal product of the advisor’s time input in the
production of his or her mathematical output. It is then trivial to show that:
(4) d logMP1d logX2
= 1σs2η,
where s2 is the share of output attributable to the advisee input ( s2 = α2 (X2η)δ /Qδ ). Note
that a supply shock of advisees will increase the marginal product of the advisor as long as
advisors and advisees are not perfect substitutes (σ < ∞). Note also that the
complementarity in equation (4) is stronger the greater the value of the parameter η. In
other words, any characteristics of the match that increase the effective value of an
advisee’s time input are profitable to the advisor. It would then be reasonable to expect
that advisors and advisees make pairings that specifically increase the value of η, and to
find that such pairings increase the advisor’s productivity.19
To determine the intensity of the complementarities arising from shared ethnicity,
we now examine the coauthorship patterns of the pre-‐existing Chinese and American
advisors in our data. Specifically, we manually collected the entire coauthorship history for
each of the 219 pre-‐existing Chinese-‐American advisors in our sample, so that we are able
to determine if any given coauthorship involved an advisee and if that advisee was a
19 Although it is easy to generalize the model to examine how the time input of advisors responds to
the supply shock, we do not pursue this generalization because we do not have any data that would allow us to more carefully examine the inputs associated with any particular advisor-‐advisee pairing.
25
Chinese student. We also manually collected comparable data for a random sample of 213
American advisors.20
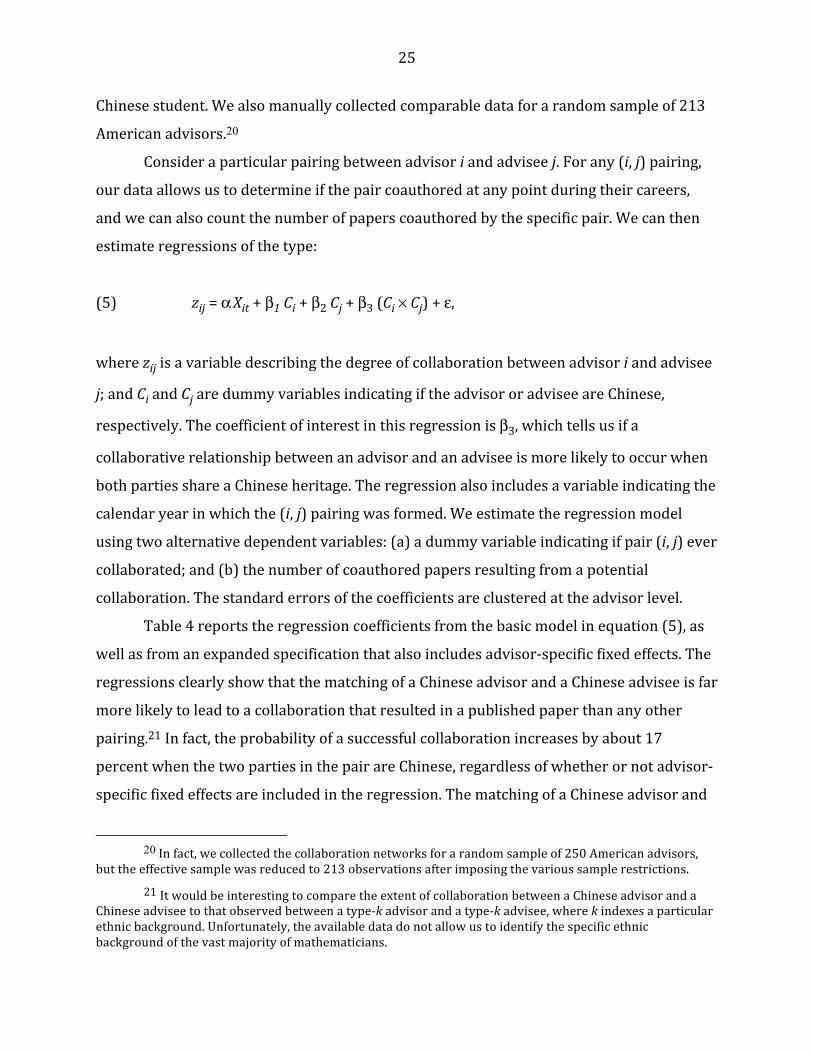
Consider a particular pairing between advisor i and advisee j. For any (i, j) pairing,
our data allows us to determine if the pair coauthored at any point during their careers,
and we can also count the number of papers coauthored by the specific pair. We can then
estimate regressions of the type:
(5) zij = α Xit + β1 Ci + β2 Cj + β3 (Ci × Cj) + ε,
where zij is a variable describing the degree of collaboration between advisor i and advisee
j; and Ci and Cj are dummy variables indicating if the advisor or advisee are Chinese,
respectively. The coefficient of interest in this regression is β3, which tells us if a
collaborative relationship between an advisor and an advisee is more likely to occur when
both parties share a Chinese heritage. The regression also includes a variable indicating the
calendar year in which the (i, j) pairing was formed. We estimate the regression model
using two alternative dependent variables: (a) a dummy variable indicating if pair (i, j) ever
collaborated; and (b) the number of coauthored papers resulting from a potential
collaboration. The standard errors of the coefficients are clustered at the advisor level.
Table 4 reports the regression coefficients from the basic model in equation (5), as
well as from an expanded specification that also includes advisor-‐specific fixed effects. The
regressions clearly show that the matching of a Chinese advisor and a Chinese advisee is far
more likely to lead to a collaboration that resulted in a published paper than any other
pairing.21 In fact, the probability of a successful collaboration increases by about 17
percent when the two parties in the pair are Chinese, regardless of whether or not advisor-‐
specific fixed effects are included in the regression. The matching of a Chinese advisor and
20 In fact, we collected the collaboration networks for a random sample of 250 American advisors,
but the effective sample was reduced to 213 observations after imposing the various sample restrictions.
21 It would be interesting to compare the extent of collaboration between a Chinese advisor and a Chinese advisee to that observed between a type-‐k advisor and a type-‐k advisee, where k indexes a particular ethnic background. Unfortunately, the available data do not allow us to identify the specific ethnic background of the vast majority of mathematicians.

26
a Chinese advisee generates about one additional paper for the pair relative to the number
of coauthored papers published by any other ethnic coupling between advisor and advisee.
Given the importance of intra-‐ethnic coauthorship, it is instructive to determine
how much of the effect of the supply shock on the rate of publication documented in Table
3 can be attributed to increased (or decreased) collaboration with advisees, and how much
of it may be due to other types of research activity. To address this question, we use the
information we collected on the authorship of every single paper published by the 219
Chinese-‐American advisors in our sample, as well as the 213 randomly chosen American
advisors.
Because of the relatively small number of observations, we aggregated the data into
two periods—before and after 1989. We then calculated the average number of papers
published annually in each of the two periods for each of the three groups of advisors (i.e.,
Chinese advisors, American advisors in mixed departments, and American advisors in non-‐
mixed departments). We also calculated the average number of papers resulting from
alternative collaboration arrangements. We then estimated a simpler version of the
regression model in equation (2) to measure the pre-‐post difference in the rate of output
for each type of arrangement. Table 5 summarizes the results of this regression-‐based
decomposition by reporting the coefficient of the interaction variable between the post-‐
1989 indicator and the type of advisor.22
As first noted in the previous section, the number of papers published by Chinese-‐
American advisors rose rapidly between the pre-‐ and post-‐shock periods. The average
Chinese advisor published almost 0.3 more papers per year after 1989 than before 1989.
The change in the publication rate for American advisors in the non-‐mixed departments
(the group of advisors that presumably forms the control group) was somewhat smaller, a
rise of only 0.2 papers per year. In contrast, the publication rate of American advisors
affiliated with mixed departments rose by only 0.1 papers per year.
22 Because we are looking at variation in the rate of publication across a diverse group of advisors
over long periods (1975-‐1988 and 1989-‐200), we use an experience-‐adjusted measure of output as the dependent variable in order to adjust for the advisor’s age. The experience-‐adjusted measure is given by the residuals from a first-‐stage regression where the left-‐hand-‐side is the average number of papers published by an advisor during each period and the regressors are fixed effects measuring the advisor’s years of work experience (in 5-‐year bands).
27
These net changes for the three groups disguise a lot of variation in the way that the
productivity shifts occurred. Among Chinese advisors, for example, the data indicate that
part of the increase in the rate of output results from increased coauthoring with Chinese
advisees and with other Chinese mathematicians. The additional Chinese-‐Chinese
collaborations increased the average number of papers published annually by around 0.15.
Of course, neither group of American advisors was able to improve their productivity due
to Chinese coauthorship by anything resembling this rate: Increased coauthoring with
Chinese mathematicians increased the number of papers by 0.02 for Americans employed
in mixed departments and by 0.04 for Americans employed in the non-‐mixed departments.
American advisors in mixed departments, however, were able to increase the number of
papers they published with their American advisees despite having fewer such advisees.
The data also illustrate the continuing trend towards less solo-‐authored work and
more coauthored work among mathematicians. Interestingly, all three groups experienced
a decrease in the amount of solo-‐authored work by between -‐0.06 and -‐0.13 papers per
year during the period. Note, however, that Chinese advisors were able to more than offset
the decline in solo-‐authored work with a sizable increase in “other” coauthoring. The
American advisors employed in mixed departments seemed particularly unable to take
advantage of opportunities for increased coauthoring with other mathematicians. This
effect may be due to specialization of roles within a department: faculty who have a harder
time finding advisees to mentor may be asked to perform more service and administrative
tasks. In the long run, this reallocation of administrative responsibilities could easily result
in less research output for the affected professors.
The strong role played by intra-‐ethnic collaborations and the exogeneity of the
supply shock of Chinese graduate students suggest that we can revisit the reduced form
evidence reported in the previous section and attempt to estimate the causal effect of
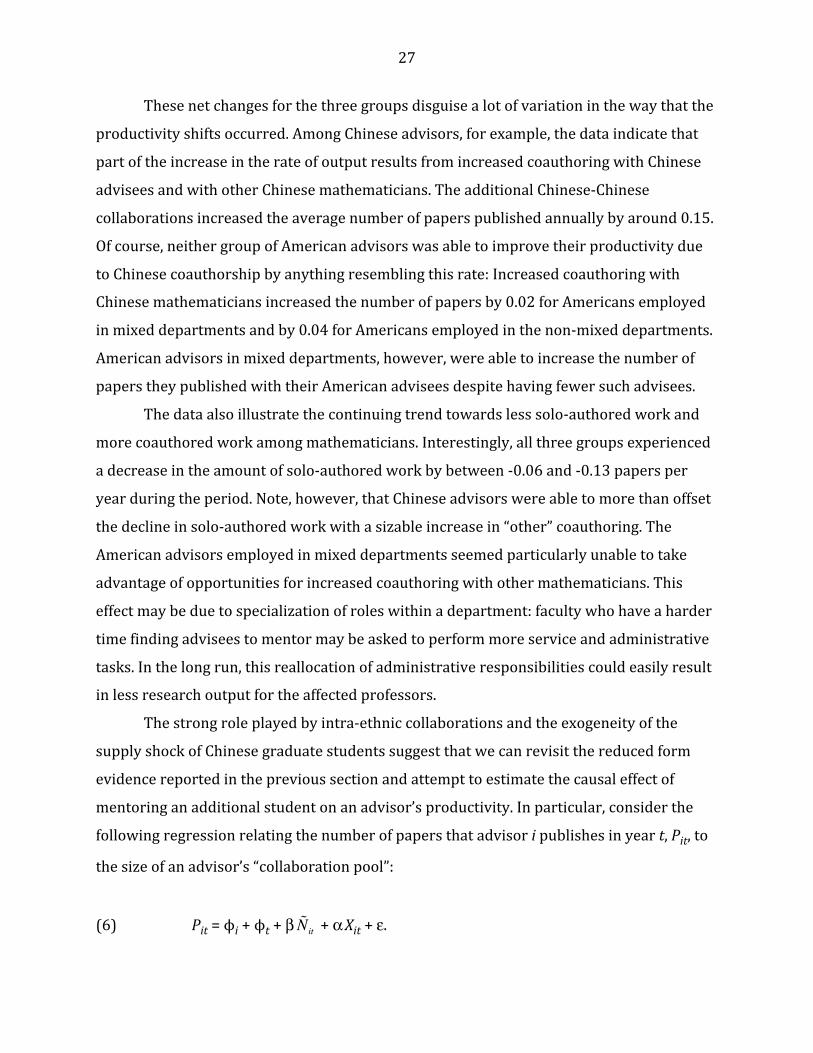
mentoring an additional student on an advisor’s productivity. In particular, consider the
following regression relating the number of papers that advisor i publishes in year t, Pit, to
the size of an advisor’s “collaboration pool”:
(6) Pit = ϕi + ϕt + β !Nit + α Xit + ε.

28
We define the collaboration pool !Nit as the total number of students that the advisor has
supervised in the five-‐year span between years t-‐3 and t+1.23 We estimate equation (6) by
using instrumental variables, where the instruments are the interaction terms (Ci × T) and
( AiM × T) employed in the reduced-‐form regressions reported in Table 3 (i.e., the
interactions between the post-‐1989 indicator, T, and dummy variables indicating if the
advisor is either Chinese-‐American or an American affiliated with a mixed department).
Table 6 reports the coefficients from alternative specifications of the regression
model (using the entire sample of 5,496 mathematics advisors). Panel A of the table uses
the definition of a mixed department that requires the supervision of at least one thesis by
a Chinese-‐American advisor, while the bottom panel uses the more stringent definition that
requires the supervision of at least three dissertations by Chinese-‐American advisors. The
regressions reported in the first column define the collaboration pool !Nit in terms of the
total number of students supervised (in the five-‐year period), regardless of ethnicity. The
second column explicitly accounts for the ethnic-‐based spillovers and defines the
collaboration pool as the total number of ethnically similar students supervised (i.e., the
number of Chinese students supervised by the Chinese advisors, or the number of
American students supervised by the American advisors).
Regardless of the instrument used, it is obvious that the first-‐stage regression model
that specifically accounts for the intra-‐ethnic spillovers does a far better job of predicting
the size of the advisor’s collaboration pool (i.e., the Angrist-‐Pischke multivariate F test of
excluded instruments is significant, with p-‐values of 0.0001). The estimate of the second-‐
stage coefficient β in equation (6) hovers around 0.5, indicating that the exogenous and
sudden appearance of an additional student in an advisor’s collaboration pool increases the
advisor’s rate of publication by about half a paper. In short, the evidence unambiguously
shows that supply shocks which expand the potential for intra-‐ethnic collaborations will
raise the productivity of the pre-‐existing advisors in the affected ethnic group substantially.
23 Our results are very robust to alternative definitions of the pool (such as a 3-‐year or 7-‐year
aggregate). We use a one-‐year lead in the aggregation to allow for the possibility that the advisor is collaborating with current students who will soon graduate.

29
VI. Crowdout Effects The decision by an American mathematics department to admit Chinese doctoral
students obviously depends on many factors, including the relative quality of the applicants,
the possibility that Chinese students pay for a higher fraction of their education, the
widespread acceptance of the axiom that “diversity” is beneficial in a university setting, and
the relative marginal products of the American and Chinese students as university
employees (because many graduate students typically work as research or teaching
assistants). Some of these factors might imply that admission officers might prefer to admit
a Chinese student over an American applicant, even if the two applicants had the same
observable qualifications.
The offer of admission to Chinese graduate students alters the educational
opportunities available to similarly qualified Americans in two distinct ways. First, the
number of slots available in a particular doctoral program may be relatively fixed, at least
in the short run. The enrollment of an additional Chinese student would then suggest that
one fewer American student could be admitted. This is the simplest and clearest case of a
crowdout effect. Even if the university were expanding and admitting more Chinese and
more American students, there may still be a crowdout effect in the sense that American
enrollment would have increased at an even faster rate if the university had not increased
its supply of Chinese students.
The entry of large numbers of Chinese graduate students into American
mathematics programs can also influence the enrollment decisions made by American
students in a less direct way. It may alter the incentives for natives to pursue specific
educational programs.
Suppose, for instance, that many of the Chinese students enrolled in mathematics
doctoral programs remain in the United States after graduation.24 If there were little
crowdout in the university admissions process, one might then expect that the (eventual)
larger supply of newly minted mathematicians would lower entry wages and the
24 The evidence, in fact, suggests that Chinese graduate students in both mathematics and other fields are consistently more likely to stay than the average foreign student in those fields; see National Science Board (2014), Appendix Table 3-‐22.

30
occupation would become relatively less attractive to Americans.25 The Chinese students
might still prefer to enter those low-‐paying jobs because their career decisions are mainly
guided by the comparison of employment opportunities available in the United States and
China. In contrast, American students might have many other career choices (e.g., a quant
career in Wall Street), and would shy away from applying to programs in educational
disciplines where foreign students cluster and subsequent wages are low. In the long run,
this behavioral response would again imply that an exogenous increase in the enrollment
of Chinese students in a particular program would reduce the number of Americans who
would want to enroll in that program.
Note that the first of these two crowdout effects is specific to a particular
university—and indicates how native enrollment in that institution changes as the number
of foreign students enrolled in that institution increases. The second crowdout effect
results from an economy-‐wide supply response that discourages natives from pursuing
particular educational programs in all universities. The empirical analysis presented in this
section nets out these economy-‐wide fluctuations and examines the shifts that occur in the
enrollment of American students within a particular mathematics department as the size of
the Chinese student population in that department grows.
To estimate the crowdout effect, we supplement our data with aggregate counts of
doctoral degrees drawn from the public use version of the Survey of Earned Doctorates
(SED). The SED contains a population census of all doctorates granted by a U.S. institution,
and reports information on the field and year of degree, as well as on the degree recipient’s
ethnicity and citizenship status. We use these data to compute the number of degrees
awarded in mathematics each year between 1975 and 2000, as well the number of degrees
awarded to American citizens, to foreign students, and to foreign students of Asian
heritage.26
25 See Borjas (2009) for evidence that supply shocks of foreign students affect the earnings of newly
minted doctorates in specific disciplines, and Borjas and Doran (2012) for related evidence on the competitive effects resulting from the influx of Soviet mathematicians. Freeman et al (2001) describe how shifts in the bioscience job market, shifts that are partly due to the influx of foreign students, affect career incentives in that sector.
26 The public use data are available at https://ncsesdata.nsf.gov/webcaspar/. The number of degrees awarded to American citizens closely approximation the number of degrees awarded to U.S.-‐born persons

31
Let Ast denote the number of U.S.-‐born students awarded a degree in mathematics
by university s at time t, and let Cst denote the respective number of Chinese students. The
generic regression model used to capture the crowdout effect is given by:
(7) Ast = ϕs + φt + θ Cst + ε,
where φs represents a vector of department fixed effects and φt represents a vector of year
fixed effects.27 We estimate the regression model using all the available data between 1975
and 2000 for the subset of schools that produced at least one mathematics doctoral degree
during the period. The standard errors are clustered at the department level to adjust for
possible serial correlation in the error term within a particular institution.
The first row of Table 7 reports the estimate of θ from OLS regressions using
alternative specifications of the model in equation (7). In particular, each of the columns in
the table employs a different measure of “foreign students” as the regressor, including the
total number of foreign-‐born doctoral recipients, the total number of foreign students of
Asian ancestry, and the total number of Chinese foreign students.28 Regardless of the
definition of the independent variable, the point estimates of θ are negative. The
descriptive evidence provided by the OLS regressions, while imprecise, seems consistent
with the presence of a crowdout effect.
because of the very long time lag required for a foreign student to achieve permanent residence status (a “green card”) and then wait the prerequisite five years before filing a naturalization application.
27 The period fixed effects help to capture the potential crowdout that arises as natives respond to the changed labor market opportunities caused by an increase in the number of foreign students. Any adverse wage effects would presumably reduce the incentives of natives to enroll in a graduate program at any university.
28 The counts of foreign-‐born and foreign-‐born Asian students are drawn from the SED. The number of Chinese students is drawn from the matched AMS-‐MGP data files, and gives the number of students with a Chinese surname. The SED also collects restricted use data on the number of foreign students per institution per year who were specifically born in the People’s Republic of China; we are currently seeking access to this data. Some of the regressions reported below use an IV strategy to identify the crowdout effect. As long as our instrument has a valid exclusion restriction and a strong first stage, the measurement error resulting from using either the SED count of foreign-‐born students of Asian ancestry or the number of students with a Chinese surname (instead of the number of students who were specifically born in the People’s Republic of China) should not affect the coefficients of interest.

32
One problem with interpreting the coefficient θ as an unbiased estimate of a
crowdout effect is that the inclusion of the school-‐specific fixed effects in the regression
model fails to account for a key factor: A few large and/or growing departments likely
admit large numbers of American and Chinese students simultaneously. In fact, many of the
Chinese graduate students who came to the United States after the opening up of China
tended to gravitate to these large and growing departments. Put differently, there are
school-‐year interaction fixed effects ϕst that are positively correlated with both Ast and Cst
in equation (7). The exclusion of these interactions from the regression model introduces a
positive and spurious correlation between the number of foreign students in the right-‐
hand-‐side and the error term. As a result, the negative estimate of the crowdout effect
reported in the first row of Table 7 likely underestimates the true impact of the supply
shock on the enrollment of American students.
To net out the spurious correlation, we would need to specify the regression model
in a way that lets us account for the idiosyncratic school-‐year “demand shocks.” Obviously,
the direct inclusion of school-‐year interaction fixed effects makes it impossible to identify
the parameter θ in (7). One very simple way of bypassing the problem would be to find a
regressor to proxy for the demand shocks. We used the SED to count the total number of
degrees awarded outside mathematics by a university each year, and added this measure of
the school-‐specific enrollment trends to the regression model. As the second row of Table 7
shows, adjusting for demand shocks in this rough fashion increases the magnitude of the
crowdout effect: the point estimate in the last column is now -‐0.233 (0.074), so that
approximately one American student “loses” his or her spot in a mathematics graduate
program for every four Chinese students admitted.
Alternatively, we can find an instrument that induces changes in the number of
foreign students admitted by a particular university that are independent from the school-‐
specific demand shocks. Because the consequences of the Chinese supply shock were most
evident in a subset of universities at a particular period of time, we can use the joint
exogeneity of the definition of a mixed department and the timing of the supply shock to
create such an instrument. In particular, we define the instrument as the product of the
post-‐1989 indicator variable and the dummy variables indicating if the department was

33
mixed (either the department had at least one active Chinese advisor prior to the supply
shock between 1985 and 1985, or the department had at least three active Chinese
advisors prior to the supply shock).
Panels B and C of Table 7 report the key coefficients from the two-‐stage IV models.
Regardless of how we define the number of foreign students on the right-‐hand-‐side of
equation (7) or which of the two instruments we use, the instrument has a very significant
positive effect on the number of foreign students awarded degrees. In the last column, for
instance, the coefficient is 1.848 (0.400) when we use the less stringent definition of a
mixed department.
The table also reports the IV estimates of the crowdout effect. It is evident that the
crowdout coefficient θ is always negative, often statistically significant, and numerically
sizable. In fact, we typically cannot reject the hypothesis that the crowdout coefficient is
equal to -‐1 in any of the specifications. Put differently, the IV regressions provide strong
evidence that one American student was “displaced” for every Chinese graduate student
admitted after the opening of China.
The strong crowdout effects reported in Table 7 allow us to provide a consistent
explanation of the productivity results discussed in earlier sections. The influx of Chinese
graduate students led to a corresponding reduction in the number of American students in
mathematics departments. Because of ethnic complementarities, the Chinese graduate
students were attracted to and matched with the pre-‐existing Chinese-‐American advisors,
and the relatively fixed size of the pool of graduate students at the department level
implied that fewer American students were available to the American advisors (perhaps
accompanied with a drop in other resources). As we have shown, this redistribution helped
generate important productivity effects in terms of published output, with the productivity
of Chinese advisors increasing and that of American advisors employed in the mixed
departments declining.
VII. Aggregate Effects Because the influx of Chinese graduate students created both winners and losers in
the pre-‐existing pool of mathematics advisors, a crucial question arises: Did the gains to the

34
winners outweigh the losses to the losers? This section reports the results from an
empirical exercise that attempts to measure the size of the “surplus” resulting from the
supply shock. It turns out that the aggregate decrease in productivity observed among
American advisors was almost exactly offset by the aggregate increase in productivity
observed among Chinese advisors.
To calculate the size of the surplus, we adopt a methodology introduced in Borjas
and Doran (2012). Specifically, we compare the actual aggregate product produced with
what would have been predicted from the pre-‐shock productivity profiles of each
individual advisor. Suppose we again divide the pre-‐existing group of advisors into three
categories: Chinese advisors, American advisors employed in mixed departments, and
American advisors employed in non-‐mixed departments.
We estimated separate regression models that trace out the mathematician’s age-‐
product profile for each of these groups. Specifically, we estimated a regression of the
number of papers published by a particular mathematician in a particular calendar year on
years of experience (introduced as a fourth-‐order polynomial) and on a vector of individual
fixed effects. We only use data from 1980 through 1988 to estimate the regression model,
so that the path of the age-‐product profile is estimated using publication data prior to the
supply shock. We then used these regressions to predict the post-‐1989 output of each
mathematician. To ensure that we do not extrapolate into the far-‐off future, we conduct a
“short-‐run” prediction exercise for the five-‐year period between 1989 and 1993. We then
added the total number of predicted publications across years and across all
mathematicians in each group. Table 8 reports the predicted total number of papers (per
year) and contrasts these predictions with the actual output of the pre-‐existing advisors
using the two alternative definitions of a mixed department.
Not surprisingly, the exercise reveals dramatic differences in how well the pre-‐1989
productivity history predicts the post-‐1989 output among the three groups. Consider, for
instance, the group of American mathematicians employed in non-‐mixed departments.
These mathematicians were the least likely to be influenced by the supply shock of Chinese
graduate students. In fact, their pre-‐1989 productivity history predicts that they would
publish 6,538 papers annually in the subsequent 5 years (using the more stringent
definition of a mixed department). In fact, they published 6,545 papers, a difference of only
35
7 papers. Put differently, the pre-‐1989 productivity history does an extremely good job of
predicting future productivity for the least-‐affected group of American advisors.
Consider instead the group of Chinese-‐American mathematicians. Their pre-‐1989
productivity history would predict that they would publish 314 papers annually in the
subsequent period. In fact, they published 380 papers, or 65 papers over the prediction. In
contrast, the American advisors employed by mixed departments are predicted to publish
1156 papers, but published only 1092 papers, a “loss” of 64 papers. Given the evidence
presented earlier in this paper, it is not surprising that the pre-‐shock productivity history
tends to under-‐predict the actual productivity of Chinese advisors and over-‐predict the
actual productivity of American advisors in mixed departments.
Notably, the aggregate effect again suggests the existence of a fixed-‐sized pie. In the
simulation that uses the more stringent definition of a mixed department, for example, the
prediction exercise predicts a total output of 8,007 papers annually, while the actual output
was equal to 8,016 papers, an insignificant difference of only 9 papers.
The crucial lesson from these prediction exercises is that the total product of the
pre-‐existing stock of mathematics advisors in the United States did not change as a result of
the supply shock of Chinese students. The increase in productivity arising from ethnic
collaboration and benefitting the pre-‐existing Chinese advisors was met with an equally-‐
sized decrease in productivity among the American advisors employed in those
departments that attracted (and enrolled) most of the Chinese graduate students. In short,
there is no evidence that the influx of Chinese graduate students greatly increased the
aggregate output or that it improved the “quality” of the published work. The evidence
instead seems consistent with the conjecture that the additional papers that were written
by Chinese-‐American advisors are papers that would have been written by Americans in
the mixed departments, but never were.
It is crucial to emphasize that although the total number of graduate student slots
available to the pre-‐existing advisors can be thought of as being relatively fixed for
institutional reasons, there is no mechanical constraint on the amount of research output
that the sample of pre-‐existing American and Chinese-‐American advisors could have
produced. If it were the case that the affected advisors comprised all of the mathematics
professors publishing in English-‐language journals, and if English-‐language journals had
36
exogenous space limitations, then our results showing a fixed-‐sized “mathematics pie”
could be a numerical artifact of such restrictions. However, the research output that the
affected advisors were producing comprised only a small fraction of the total English-‐
language mathematical output before the shock, and an even smaller fraction of the output
after the shock simply because many new mathematicians would continue to enter the
profession after 1989. As a result, if the supply shock had indeed produced larger benefits
for the Chinese-‐American advisors than the corresponding losses for their American
colleagues, then the portion of the worldwide English-‐language "mathematics pie" that this
group comprised could have potentially increased.
VIII. The Productivity of the Students
Up to this point, our analysis has focused on documenting the consequences of the
supply shock for the productivity of the advisors. We have shown that there was a
redistributional impact, but little evidence of an “efficiency” effect in the sense that the
aggregate output of the pre-‐existing advisors remained fixed after the supply shock of
Chinese graduate students. It is entirely possible, however, that the beneficial efficiency
consequences of the supply shock might show up much later, after the Chinese doctoral
students become professional mathematicians themselves. Their research efforts would, in
turn, contribute to “the greater good” of mathematical knowledge. This section examines
whether these long-‐run effects exist and are numerically important.
Specifically, we track the research output produced by the students of the sample of
the 5,496 pre-‐existing Chinese-‐American and American advisors constructed in the
previous sections. We again make use of the merged AMS-‐MGP data to create a new file
containing the publication records of the 27,885 students mentored by these advisors
between 1975 and 2004. We then estimated regression models that relate the student’s
productivity (defined in various ways) to a variable indicating if the student was Chinese.
The basic regression specification is:
(8) Ykt = ϕt + γ Ck + ε.,

37
where Ykt measures the research productivity of student k who graduated in year t; Ck is a
dummy variable indicating if student k is Chinese; and ϕt gives a vector of fixed effects
indicating the year in which the doctoral degree was awarded.
We constructed several alternative measures of the student’s productivity Ykt. Table
9 summarizes the regression results. The first column reports the coefficient γ from the
basic specification in equation (8), while the other columns report the coefficient after the
regression includes either school-‐specific fixed effects or advisor-‐specific fixed effects.
Consider the regression coefficients reported in the second row, where the dependent
variable indicates the average number of papers published annually by a student during his
career (through 2010). The coefficient is positive, although numerically very small and
insignificant. After controlling for school-‐specific fixed effects, for example, the regression
suggests that Chinese students publish only 0.02 papers more per year than the American
students, or less than a third of a paper more per decade. The third row of the table uses
the total number of citations received annually by a student during his career, which can be
interpreted as a quality-‐weighted measure of publications. Regardless of the specification,
the coefficient γ in this regression is uniformly negative, though again insignificant.
We interpret the results in Table 9 as providing little support for the conjecture that
the efficiency gains from the Chinese supply shock are likely to become more evident over
time, as the Chinese students enter the profession and begin to influence the amount and
quality of mathematical research. There is simply no evidence to suggest that the Chinese
students who made up the supply shock ended up having more productive or more
consequential professional careers than their American counterparts.
IX. Summary This paper examines the consequences of perhaps the largest annual migration of
budding scientists around the world: the annual flow of Chinese graduate students into
Western universities, and particularly the United States. Our analysis exploits the natural
experiment ignited by the end of the Cultural Revolution and the enactment of Vice Premier
Deng Xiaoping’s “Open Up” policy. The Cultural Revolution destroyed the Chinese higher
education system, and only a handful of Chinese students were able to study abroad during

38
those turbulent years. Deng Xiaoping’s reforms not only tore down the self-‐imposed
barriers to a Western education, but also encouraged Chinese students to acquire their
graduate training in Western universities in order to accelerate the modernization of China.
We use administrative data created and maintained by the American Mathematical
Society and the Mathematics Genealogy Project. These data provide the history of
mathematical publications for all mathematicians, as well as match advisors and advisees.
We merge these data and identify persons of Chinese ancestry to examine the productivity
of mathematics advisors employed in American universities before and after the supply
shock of Chinese graduate students.
The empirical analysis uses a simple difference-‐in-‐differences strategy. The data
reveal that pre-‐existing advisors employed in American universities who had Chinese
ancestry mentored a disproportionately large share of the new Chinese graduate students.
This increase in mentoring opportunities led to a large increase in the scientific output of
those advisors, resulting not only from increased collaboration with ethnically similar
students, but also from an expansion in their other non-‐collaborative work. The evidence,
therefore, strongly confirms the existence of knowledge spillovers among ethnically similar
scientists.
At the same time, however, the data indicate that some of the American advisors
who did not have Chinese ancestry lost out. In particular, advisors who did not have
Chinese ancestry and who were employed in the departments that attracted most of the
Chinese graduate students were unable to “compete” in the mentoring marketplace for the
new students. Because of the relatively fixed size of the graduate student pool in
mathematics departments, these advisors experienced a substantial decline in their
productivity.
Our data allows us to aggregate the gains experienced by the Chinese-‐American
advisors and the losses suffered by the non-‐Chinese advisors to estimate the size of the
surplus in aggregate output resulting from the supply shock. It turns out that the aggregate
output of the pre-‐existing stock of advisors remained unchanged. The additional research
productivity of the Chinese-‐American advisors was almost exactly offset by the lower
productivity of the American advisors who lost out.
39
It is clear that ethnic complementarities can be very important in knowledge production:
The ability of a supply shock to influence the rate of knowledge accumulation depends crucially
on how the newcomers interact with the pre-existing workforce, and ethnic complementarities
lower the barriers to such interactions. However, it is also clear that the flow of aggregate
knowledge depends on both the supply of knowledge producers and on the demand for
knowledge output. If the demand for knowledge output does not shift out in those areas where a
supply shock has created additional opportunities for productive interactions, the benefits of such
interactions may be greatly attenuated by accompanying losses.
Scientific knowledge is a public good. If a receiving country is to fully benefit from
supply shocks of scientific personnel, it would seem that many institutions—including
universities, non-profits, and governments—may need to proactively reallocate resources to take
advantage of the opportunities created by those supply shocks.
40
References Azoulay, Pierre, Joshua S. Graff Zivin, and Jialan Wang, “Superstar Extinction,” Quarterly Journal of Economics 125 (2010): 549-‐589.
Borjas, George J. “Immigration in High-‐Skill Labor Markets: The Impact of Foreign Students on the Earnings of Doctorates.” In: Richard B. Freeman and Daniel L. Goroff, eds., Science and Engineering Careers in the United States: An Analysis of Markets and Employment, 131-‐161. Chicago: University of Chicago Press, 2009. Borjas, George J., and Kirk B. Doran, “The Collapse of the Soviet Union and the Productivity of American Mathematicians,” Quarterly Journal of Economics 127 (2012): 1143-‐1203.
Chen, Changgui, “Evolution and Future of Chinese Overseas Student Policy, 1978-‐2006,” Exploration of Higher Education 5 (2007).
Deng, Treiman, “The Impact of the Cultural Revolution on Trends in Educational Attainment in the People's Republic of China,” American Journal of Sociology 103 (1997): 391-‐428.
Foley, C. Fritz, and William R. Kerr. “Ethnic Innovation and U.S. Multinational Activity,” Management Science 59 (July 2013): 1529-‐1544.
Freeman, Richard B., and Wei Huang, "Collaborating with People Like Me: Ethnic Co-‐authorship within the US," Journal of Labor Economics, forthcoming 2015.
Freeman, Richard B., Eric Weinstein, Elizabeth Marincola, Janet Rosenbaum, and Frank Solomon. “Competition and Careers in Bioscience,” Science, December 14, 2001, pp. 2293-‐2294.
Institute of International Education. "All Places of Origin of International Students, Selected Years: 1949/50-‐1999/00." Open Doors Report on International Educational Exchange, 2009.
Lucas, Robert E., “Ideas and Growth,” Economica 76 (February 2009): 1-‐19.
Kerr, William R. "Ethnic Scientific Communities and International Technology
Diffusion.” Review of Economics and Statistics 90 (2008): 518-‐537.
Kerr, Sari Pekkala, and William R. Kerr. "Global Collaborative Patents." (2014).
Lafraniere, Sharon. “Name Not on Our List? Change It, China Says.” The New York Times, April 21, 2009.
41
MacFarquhar, Roderick and Michael Schoenhals. Mao’s Last Revolution. Cambridge, MA: Belknap Press, 2008.
Mathur, Nalini. Education Reform in Post-‐Mao China. New Delhi: APH Publishing
Corporation, 2007. Nanda, Ramana, and Tarun Khanna, “Diasporas and Domestic Entrepreneurs:
Evidence from the Indian Software Industry,” Journal of Economics and Management Strategy 19 (2010): 991-‐1012.
National Science Board. Science and Engineering Indicators 2014. Arlington VA:
National Science Foundation (NSB 14-‐01), 2014. Song, Bocheng. “The Impact of the Cultural Revolution,” Working Paper, (2011). Stuen, Eric T., Ahmed Mushfiq Mobarak, and Keith E. Maskus. "Skilled Immigration
and Innovation: Evidence from Enrolment Fluctuations in US Doctoral Programmes," Economic Journal 122 (2012): 1143-‐1176.
Rauch, James and Vitor Trindade. “Ethnic Chinese Networks in International Trade,"
Review of Economics and Statistics 84 (February 2002): 116-‐130.
Waldinger, Fabian, “Quality Matters: The Expulsion of Professors and the Consequences for Ph.D. Student Outcomes in Nazi Germany,” Journal of Political Economy 118 (2010): 787-‐831.
Waldinger, Fabian. “Peer Effects in Science: Evidence from the Dismissal of
Scientists in Nazi Germany,” Review of Economic Studies (April 2012) 79: 838-‐861. Waldinger, Fabian, Petra Moser, and Alessandra Voena. “German Jewish Emigres
and U.S. Invention,” American Economic Review 104 (October 2014): 3222-‐3255. Wang, You-‐Qin. "Student Attacks against Teachers: The Revolution of 1966." Issues &
Studies 37.2: 29-‐79, (2001) Zedong, Mao. "On the People's Democratic Dictatorship," 30 June 1949, Mao Zedong
xuanji (Selected Works on Mao Zedong), Beijing: The People's Press, IV, 1477, (1965). Zweig, David and Stanley Rosen, “How China Trained a New Generation Abroad,” Sci
Dev Net (May 22, 2003).
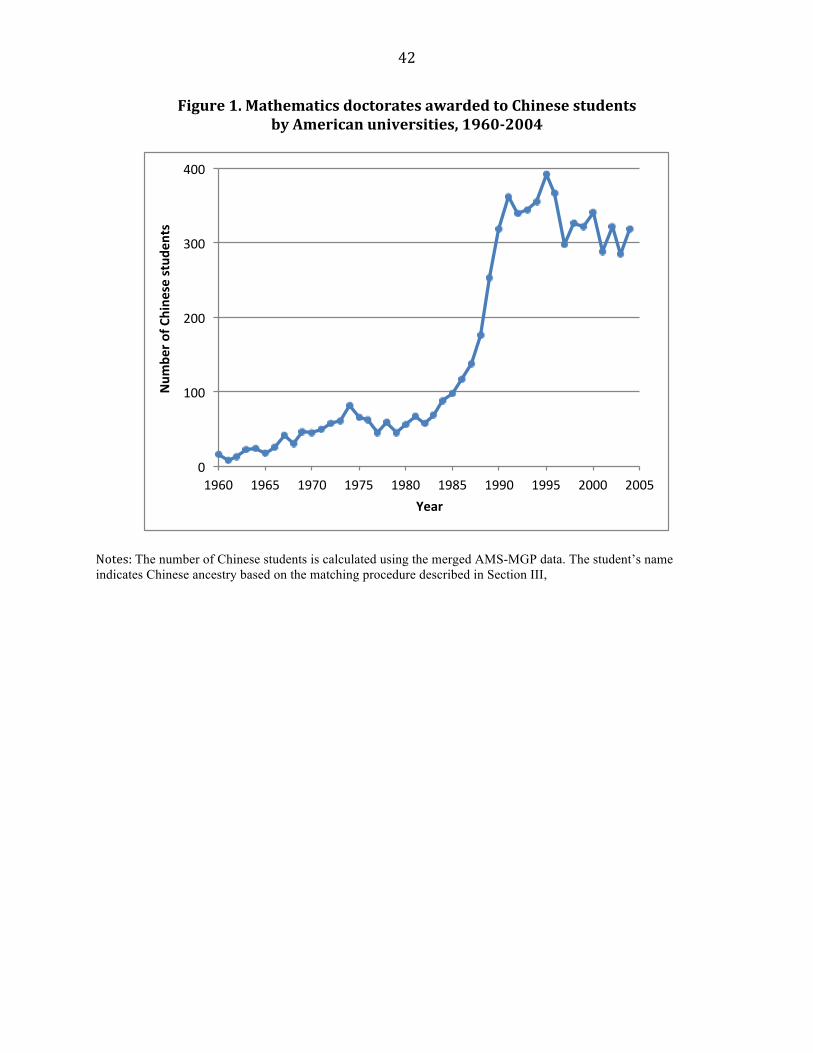
42
Figure 1. Mathematics doctorates awarded to Chinese students by American universities, 1960-‐2004
Notes: The number of Chinese students is calculated using the merged AMS-MGP data. The student’s name indicates Chinese ancestry based on the matching procedure described in Section III,
0"
100"
200"
300"
400"
1960" 1965" 1970" 1975" 1980" 1985" 1990" 1995" 2000" 2005"
Num
ber'o
f'Chine
se'stud
ents''
Year'
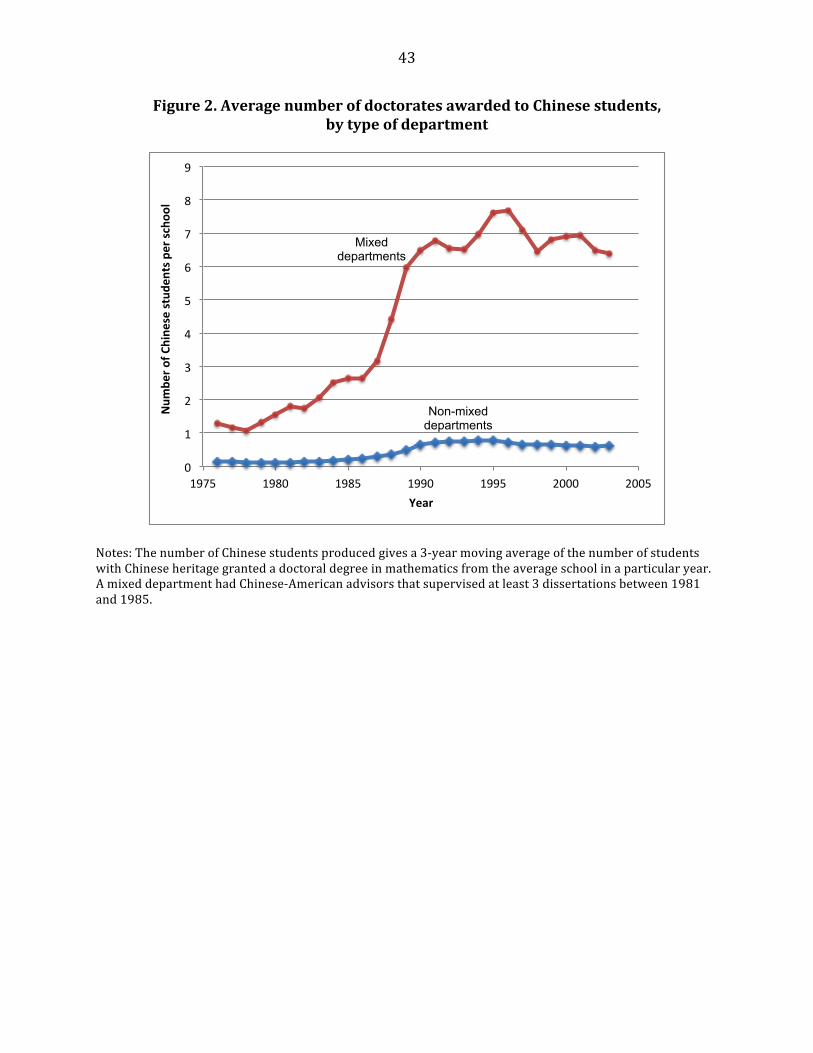
43
Figure 2. Average number of doctorates awarded to Chinese students, by type of department
Notes: The number of Chinese students produced gives a 3-‐year moving average of the number of students with Chinese heritage granted a doctoral degree in mathematics from the average school in a particular year. A mixed department had Chinese-‐American advisors that supervised at least 3 dissertations between 1981 and 1985.
0"
1"
2"
3"
4"
5"
6"
7"
8"
9"
1975" 1980" 1985" 1990" 1995" 2000" 2005"
Num
ber'o
f'Chine
se'stud
ents'per'sc
hool'
Year'
Mixed departments
Non-mixed departments
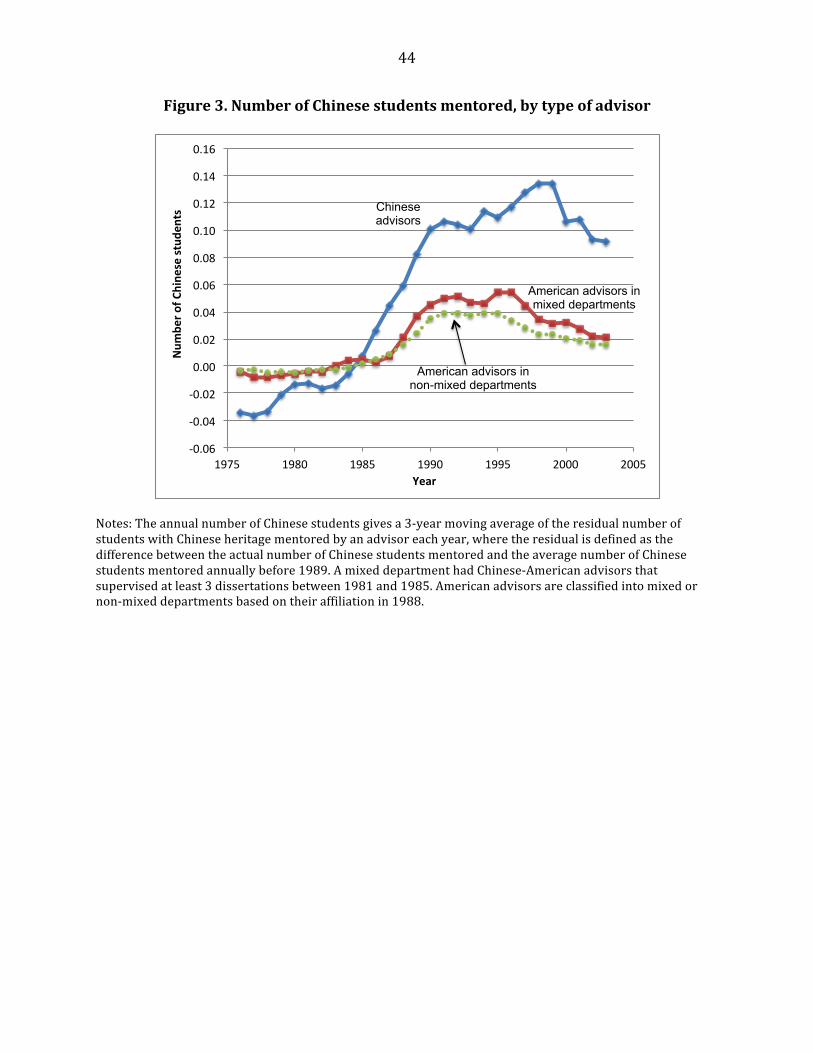
44
Figure 3. Number of Chinese students mentored, by type of advisor
Notes: The annual number of Chinese students gives a 3-‐year moving average of the residual number of students with Chinese heritage mentored by an advisor each year, where the residual is defined as the difference between the actual number of Chinese students mentored and the average number of Chinese students mentored annually before 1989. A mixed department had Chinese-‐American advisors that supervised at least 3 dissertations between 1981 and 1985. American advisors are classified into mixed or non-‐mixed departments based on their affiliation in 1988.
!0.06%
!0.04%
!0.02%
0.00%
0.02%
0.04%
0.06%
0.08%
0.10%
0.12%
0.14%
0.16%
1975% 1980% 1985% 1990% 1995% 2000% 2005%
Num
ber'o
f'Chine
se'stud
ents'
Year'
Chinese advisors
American advisors in mixed departments
American advisors in non-mixed departments
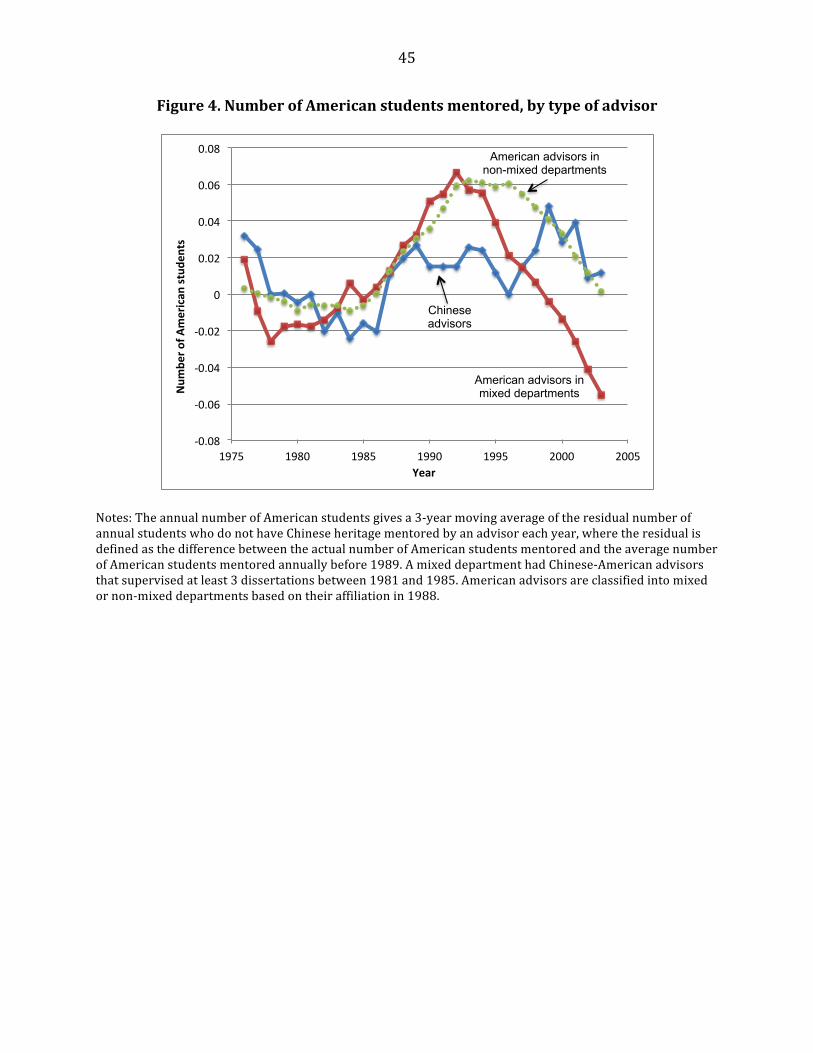
45
Figure 4. Number of American students mentored, by type of advisor
Notes: The annual number of American students gives a 3-‐year moving average of the residual number of annual students who do not have Chinese heritage mentored by an advisor each year, where the residual is defined as the difference between the actual number of American students mentored and the average number of American students mentored annually before 1989. A mixed department had Chinese-‐American advisors that supervised at least 3 dissertations between 1981 and 1985. American advisors are classified into mixed or non-‐mixed departments based on their affiliation in 1988.
!0.08%
!0.06%
!0.04%
!0.02%
0%
0.02%
0.04%
0.06%
0.08%
1975% 1980% 1985% 1990% 1995% 2000% 2005%
Num
ber'o
f'American
'stud
ents'
Year'
Chinese advisors
American advisors in mixed departments
American advisors in non-mixed departments
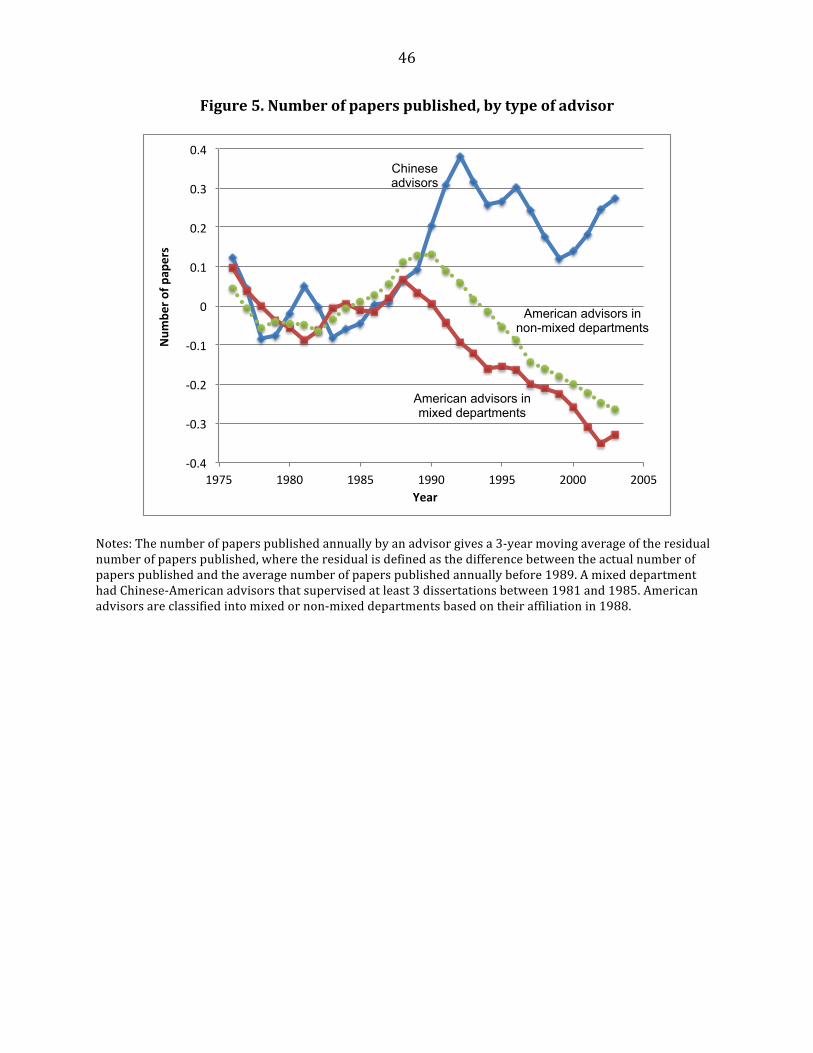
46
Figure 5. Number of papers published, by type of advisor
Notes: The number of papers published annually by an advisor gives a 3-‐year moving average of the residual number of papers published, where the residual is defined as the difference between the actual number of papers published and the average number of papers published annually before 1989. A mixed department had Chinese-‐American advisors that supervised at least 3 dissertations between 1981 and 1985. American advisors are classified into mixed or non-‐mixed departments based on their affiliation in 1988.
!0.4%
!0.3%
!0.2%
!0.1%
0%
0.1%
0.2%
0.3%
0.4%
1975% 1980% 1985% 1990% 1995% 2000% 2005%
Num
ber'o
f'pap
ers'
Year'
Chinese advisors
American advisors in mixed departments
American advisors in non-mixed departments
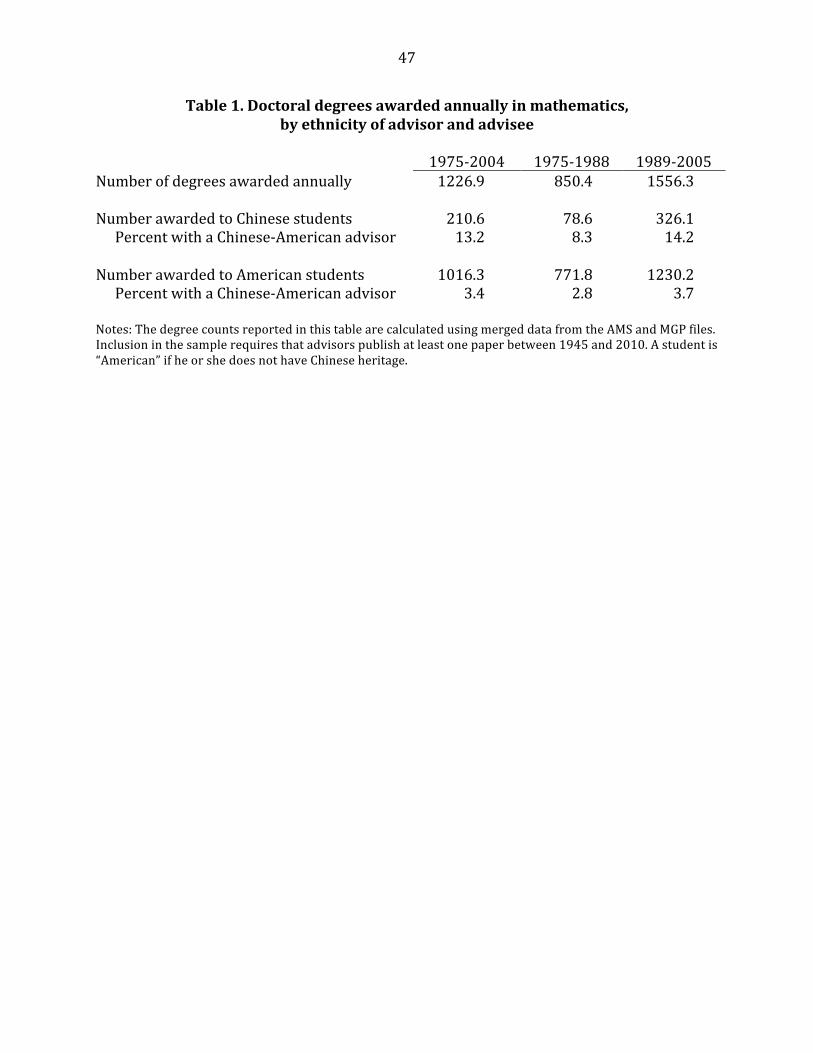
47
Table 1. Doctoral degrees awarded annually in mathematics, by ethnicity of advisor and advisee
1975-‐2004 1975-‐1988 1989-‐2005 Number of degrees awarded annually 1226.9 850.4 1556.3 Number awarded to Chinese students 210.6 78.6 326.1 Percent with a Chinese-‐American advisor 13.2 8.3 14.2
Number awarded to American students 1016.3 771.8 1230.2 Percent with a Chinese-‐American advisor 3.4 2.8 3.7
Notes: The degree counts reported in this table are calculated using merged data from the AMS and MGP files. Inclusion in the sample requires that advisors publish at least one paper between 1945 and 2010. A student is “American” if he or she does not have Chinese heritage.

48
Table 2. Summary statistics for advisors
1975-‐1988 1989-‐2004 Chinese-‐American advisors Papers published per year 1.532
1.696 Citations received per paper 5.667 7.077 Advisees per year 0.168
0.258 Chinese advisees per year 0.039
0.137
Year of first publication 1972 -‐-‐-‐ Number of advisors 219 -‐-‐-‐
American advisors Papers published per year 1.387
1.272 Citations received per paper 6.100
7.353 Advisees per year 0.177
0.228 Chinese advisees per year 0.015
0.045 Year of first publication 1969 -‐-‐-‐
Number of advisors 5277 -‐-‐-‐ Notes: The sample consists of mathematicians affiliated with an American institution who published their first paper between 1945 and 1986, and who supervised at least one student between 1975 and 2004.

49
Table 3. The supply shock and the productivity of pre-‐existing advisors Dependent variable
Number of students
Number of Chinese students
Number of American students
Number of papers published
Citations per paper published
A. Basic specification Chinese advisor 0.027 0.075 -‐0.047 0.177 -‐0.784 (0.022) (0.016) (0.015) (0.089) (0.757) B. Mixed department had some Chinese presence Chinese advisor 0.026 0.077 -‐0.051 0.144 -‐0.889 (0.022) (0.016) (0.015) (0.090) (0.764) American advisor in -‐0.005 0.005 -‐0.010 -‐0.088 -‐0.295 mixed department (0.008) (0.003) (0.007) (0.029) (0.411) C. Mixed department had frequent Chinese presence Chinese advisor 0.027 0.077 -‐0.050 0.167 -‐0.935 (0.022) (0.016) (0.015) (0.089) (0.759) American advisor in -‐0.004 0.012 -‐0.016 -‐0.069 -‐1.027 mixed department (0.012) (0.004) (0.010) (0.038) (0.629) Notes: Standard errors are reported in parentheses and are clustered at the advisor level. All regressions include a vector of year fixed effects, a vector of advisor fixed effects, and a vector of experience fixed effects (measuring the advisor’s years of work experience in 5-‐year bands). A mixed department in Panel B had Chinese-‐American advisors who supervised at least 1 dissertation between 1981 and 1985; a mixed department in Panel C had Chinese-‐American advisors who supervised at least 3 dissertations between 1981 and 1985. American advisors are classified into mixed or non-‐mixed departments based on their affiliation as of 1988. The excluded group in Panels B and C are the American advisors affiliated with non-‐mixed departments. The regressions in the first four columns have 155,065 observations; the regressions in the last column have 84,748 observations.

50
Table 4. Ethnicity and collaboration in advisor-‐advisee pairings Independent variable:
Probability of coauthoring
Number of papers coauthored
Chinese advisor -‐0.057 -‐-‐-‐ -‐0.320 -‐-‐-‐ (0.068) (0.288) Chinese advisee -‐0.002 -‐0.000 0.107 0.174 (0.056) (0.072) (0.326) (0.412) Chinese advisor × Chinese advisee 0.174 0.178 1.439 1.120 (0.070) (0.090) (0.415) (0.488) Includes advisor fixed effects No Yes No Yes Notes: Standard errors are reported in parentheses, and are clustered at the advisor level. The unit of observation is a particular pairing between an advisor and an advisee. The regressions have 1,787 observations that include all possible pairings between advisors and advisees between 1975 and 2004, and are weighted by the total number of students mentored by the advisor during the period. The “probability of coauthoring” is a dummy variable set to unity if the particular pairing between the advisor and the advisee ever resulted in a published paper. The dependent variable giving the “number of papers coauthored” gives the total number of papers coauthored by the advisor-‐advisee pairing during the entire period. All regressions also include a variable indicating the year in which the pairing was formed.
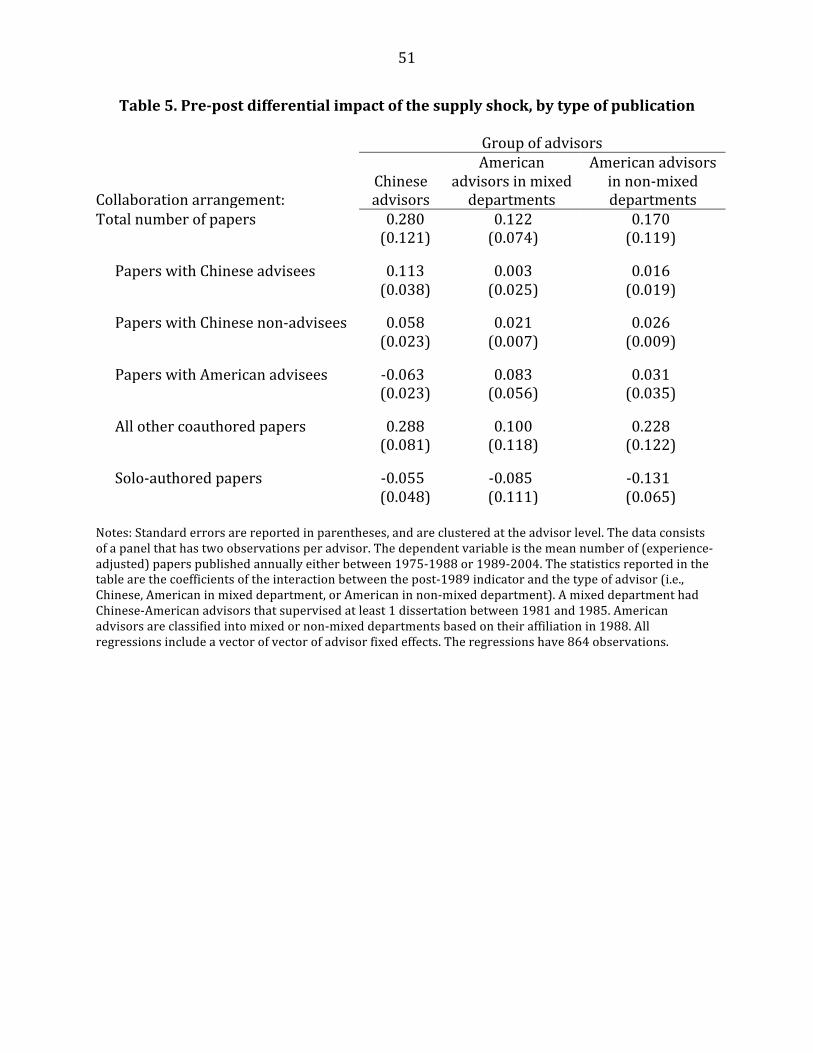
51
Table 5. Pre-‐post differential impact of the supply shock, by type of publication
Group of advisors Collaboration arrangement:
Chinese advisors
American advisors in mixed departments
American advisors in non-‐mixed departments
Total number of papers 0.280 0.122 0.170 (0.121) (0.074) (0.119) Papers with Chinese advisees 0.113 0.003 0.016 (0.038) (0.025) (0.019) Papers with Chinese non-‐advisees 0.058 0.021 0.026 (0.023) (0.007) (0.009) Papers with American advisees -‐0.063 0.083 0.031 (0.023) (0.056) (0.035) All other coauthored papers 0.288 0.100 0.228 (0.081) (0.118) (0.122) Solo-‐authored papers -‐0.055 -‐0.085 -‐0.131 (0.048) (0.111) (0.065)
Notes: Standard errors are reported in parentheses, and are clustered at the advisor level. The data consists of a panel that has two observations per advisor. The dependent variable is the mean number of (experience-‐adjusted) papers published annually either between 1975-‐1988 or 1989-‐2004. The statistics reported in the table are the coefficients of the interaction between the post-‐1989 indicator and the type of advisor (i.e., Chinese, American in mixed department, or American in non-‐mixed department). A mixed department had Chinese-‐American advisors that supervised at least 1 dissertation between 1981 and 1985. American advisors are classified into mixed or non-‐mixed departments based on their affiliation in 1988. All regressions include a vector of vector of advisor fixed effects. The regressions have 864 observations.

52
Table 6. The productivity effect of mentoring students, IV estimates Size of collaboration pool is a
5-‐year aggregate of: Number of
students Number of ethnically similar students
A. Mixed department had some Chinese presence First stage: Chinese advisor × Post-‐1989 indicator 0.211 0.319 (0.106) (0.080) Mixed American advisor × Post-‐1989 indicator -‐0.028 -‐0.045 (0.039) (0.034) Angrist-‐Pischke multivariate F statistic 2.46 9.61
Second stage: 0.961 0.639 (0.432) (0.225) B. Mixed department had frequent Chinese presence First stage: Chinese advisor × Post-‐1989 indicator 0.221 0.327 (0.105) (0.079) Mixed American advisor × Post-‐1989 indicator -‐0.002 -‐0.052
(0.057) (0.050) Angrist-‐Pischke multivariate F statistic 2.22 9.35
Second stage: 0.696 0.527 (0.377) (0.222) Notes: Standard errors are reported in parentheses and are clustered at the advisor level. The dependent variable in the second stage gives the number of papers published by an advisor in a particular year. The right-‐hand-‐side variable gives the size of an advisor’s collaboration pool, defined as a 5-‐year aggregate of either the total number of students supervised or the number of ethnically similar students supervised. All regressions include a vector of year fixed effects, a vector of advisor fixed effects, and a vector of experience fixed effects (measuring the advisor’s years of work experience in 5-‐year bands). A mixed department in Panel A had Chinese-‐American advisors who supervised at least 1 dissertation between 1981 and 1985; a mixed department in Panel B had Chinese-‐American advisors who supervised at least 3 dissertations between 1981 and 1985. American advisors are classified into mixed or non-‐mixed departments based on their affiliation as of 1988. The regressions have 133,081 observations.
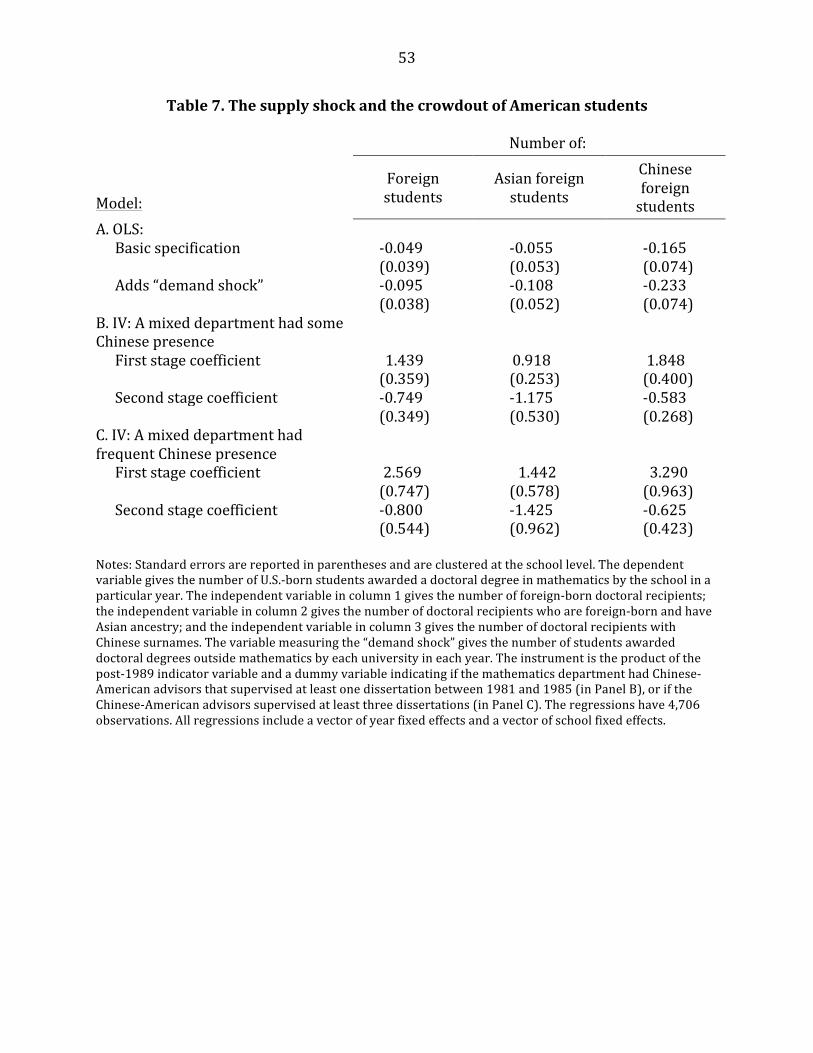
53
Table 7. The supply shock and the crowdout of American students Number of: Model:
Foreign students
Asian foreign students
Chinese foreign students
A. OLS: Basic specification -‐0.049 -‐0.055 -‐0.165
(0.039) (0.053) (0.074) Adds “demand shock” -‐0.095 -‐0.108 -‐0.233 (0.038) (0.052) (0.074)
B. IV: A mixed department had some Chinese presence
First stage coefficient 1.439 0.918 1.848 (0.359) (0.253) (0.400)
Second stage coefficient -‐0.749 -‐1.175 -‐0.583 (0.349) (0.530) (0.268)
C. IV: A mixed department had frequent Chinese presence
First stage coefficient 2.569 1.442 3.290 (0.747) (0.578) (0.963)
Second stage coefficient -‐0.800 -‐1.425 -‐0.625 (0.544) (0.962) (0.423)
Notes: Standard errors are reported in parentheses and are clustered at the school level. The dependent variable gives the number of U.S.-‐born students awarded a doctoral degree in mathematics by the school in a particular year. The independent variable in column 1 gives the number of foreign-‐born doctoral recipients; the independent variable in column 2 gives the number of doctoral recipients who are foreign-‐born and have Asian ancestry; and the independent variable in column 3 gives the number of doctoral recipients with Chinese surnames. The variable measuring the “demand shock” gives the number of students awarded doctoral degrees outside mathematics by each university in each year. The instrument is the product of the post-‐1989 indicator variable and a dummy variable indicating if the mathematics department had Chinese-‐American advisors that supervised at least one dissertation between 1981 and 1985 (in Panel B), or if the Chinese-‐American advisors supervised at least three dissertations (in Panel C). The regressions have 4,706 observations. All regressions include a vector of year fixed effects and a vector of school fixed effects.
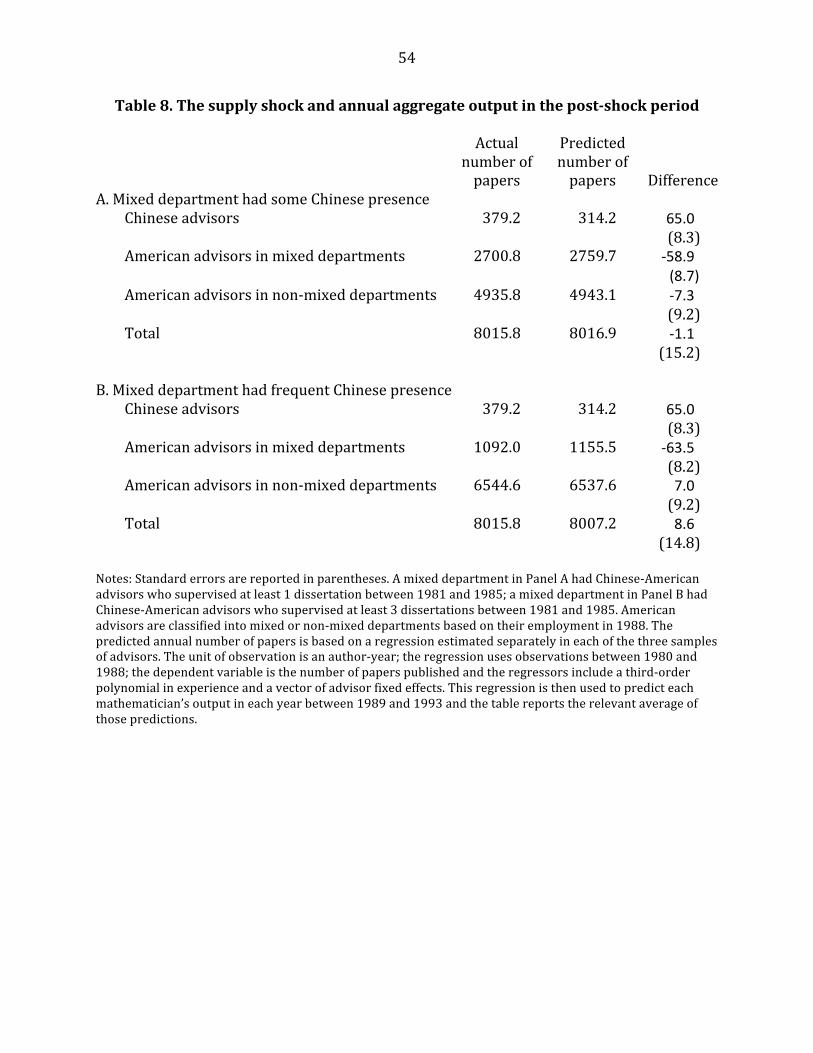
54
Table 8. The supply shock and annual aggregate output in the post-‐shock period Actual
number of papers
Predicted number of papers
Difference A. Mixed department had some Chinese presence
Chinese advisors 379.2 314.2 65.0 (8.3) American advisors in mixed departments 2700.8 2759.7 -‐58.9 (8.7) American advisors in non-‐mixed departments 4935.8 4943.1 -‐7.3 (9.2) Total 8015.8 8016.9 -‐1.1
(15.2) B. Mixed department had frequent Chinese presence
Chinese advisors 379.2 314.2 65.0 (8.3) American advisors in mixed departments 1092.0 1155.5 -‐63.5 (8.2) American advisors in non-‐mixed departments 6544.6 6537.6 7.0 (9.2) Total 8015.8 8007.2 8.6
(14.8) Notes: Standard errors are reported in parentheses. A mixed department in Panel A had Chinese-‐American advisors who supervised at least 1 dissertation between 1981 and 1985; a mixed department in Panel B had Chinese-‐American advisors who supervised at least 3 dissertations between 1981 and 1985. American advisors are classified into mixed or non-‐mixed departments based on their employment in 1988. The predicted annual number of papers is based on a regression estimated separately in each of the three samples of advisors. The unit of observation is an author-‐year; the regression uses observations between 1980 and 1988; the dependent variable is the number of papers published and the regressors include a third-‐order polynomial in experience and a vector of advisor fixed effects. This regression is then used to predict each mathematician’s output in each year between 1989 and 1993 and the table reports the relevant average of those predictions.

55
Table 9. The eventual productivity of the Chinese doctoral students Specification Dependent variable: (1) (2) (3) 1. Student ever published -‐0.023 -‐0.027 -‐0.010 (0.009) (0.009) (0.009) 2. Number of papers published 0.021 0.019 0.027 (0.017) (0.016) (0.018) 3. Number of citations -‐0.062 -‐0.032 -‐0.110 (0.134) (0.131) (0.156) Includes fixed effects for school awarding degree No Yes No Includes fixed effects for advisor No No Yes Notes: Standard errors are reported in parentheses; all standard errors are clustered at the advisor level. The dependent variable in row 1 is a dummy variable indicating if the student published at least 1 paper at any time before 2010; the dependent variable in row 2 gives the average number of papers published per year between the time the degree was awarded and 2010; the dependent variable in row 3 gives the average number of citations received per year. All regressions include a vector of fixed effects denoting the year in which the doctoral degree was awarded. The regressions have 27,885 observations.