ETHIOPIAN FOREST RESOURCES - The REDD Desk | a...
55
ETHIOPIAN FOREST RESOURCES: CURRENT STATUS AND FUTURE MANAGEMENT OPTIONS IN VIEW OF ACCESS TO CARBON FINANCES LITERATURE REVIEW PREPARED FOR THE ETHIOPIAN CLIMATE RESEARCH AND NETWORKING AND THE UNITED NATIONS DEVELOPMENT PROGRAMME (UNDP) Addis Ababa, October 2010 Yitebitu Moges 1 , Zewdu Eshetu 1 and Sisay Nune 2 1 Forestry Research Center, Ethiopian Institute of Agricultural Research, Addis Ababa, Ethiopia 2 Nature and Biodiversity Conservation Union, Project Office in Ethiopia, Addis Ababa, Ethiopia
Transcript of ETHIOPIAN FOREST RESOURCES - The REDD Desk | a...

ETHIOPIAN FOREST RESOURCES:
CURRENT STATUS AND FUTURE MANAGEMENT OPTIONS
IN VIEW OF ACCESS TO CARBON FINANCES
LITERATURE REVIEW
PREPARED FOR THE
ETHIOPIAN CLIMATE RESEARCH AND NETWORKING
AND
THE UNITED NATIONS DEVELOPMENT PROGRAMME (UNDP)
Addis Ababa, October 2010
Yitebitu Moges1, Zewdu Eshetu1 and Sisay Nune2 1Forestry Research Center, Ethiopian Institute of Agricultural Research, Addis Ababa, Ethiopia 2Nature and Biodiversity Conservation Union, Project Office in Ethiopia, Addis Ababa, Ethiopia

1
List of Tables ............................................................................................................................. 2 List of Figures ............................................................................................................................ 2 ACRONYMS ................................................................................................................................ 3 EXECUTIVE SUMMARY ............................................................................................................. 4 1 INTRODUCTION ................................................................................................................ 7 2 THE POSITION OF FORESTS IN THE GLOBAL CARBON CYCLE .................................... 8 3 FORESTS AND FOREST GROWTH ................................................................................... 9 3.1 Extent of world’s forest resources ............................................................................ 9
3.2 Forests and other land cover types in Ethiopia ..................................................... 10
3.3 Forest growth stocks and annual increments in Ethiopia .................................... 12
3.4 Carbon stocks of forests in Ethiopia ....................................................................... 13
3.5 Carbon stocks in agroforestry systems (Trees outside forests) .......................... 14
3.6 Carbon emissions and sequestration in forestry sector in Ethiopia .................... 15
4 PLANTATION FORESTS IN ETHIOPIA .......................................................................... 16 4.1 Background ............................................................................................................... 16
4.2 Productivity of plantation forests: Growth stocks and increments ..................... 17
5 CARBON FINANCE PROSPECTS FOR ETHIOPIA .......................................................... 22 6 FUTURE FOREST MANAGEMENT OPTIONS : MULTIPLE OBJECTIVES MANAGEMENT........................................................................................................................ 24 6.1 Forest management scenarios ................................................................................ 24
6.1.1 Scenario 1: Status quo (Business as usual) .................................................... 24 6.1.2 Scenario 2 : Managed forest ............................................................................. 26
6.2 Challenges and recommended actions for implementing best future forest
management scenario ........................................................................................................ 30
7 CONCULSIONS AND RECOMMENDATIONS .................................................................. 32 7.1 Conclusions ............................................................................................................... 32
7.2 Recommendations ................................................................................................... 34
8 REEFERENCES ................................................................................................................ 36 9 ANNEXES ......................................................................................................................... 40 9.1 ANNEX 1: GLOBAL FOREST SECTOR AND CLIMATE CHANGE ............................ 40
9.2 ANNEX 2: VALUES OF FOREST CARBON IN THE INTERNATIONAL MARKET
AND COSTS OF CARBON FORESTRY ................................................................................ 48
9.3 ANNEX 3: CDM AND REDD ACTIVITIES IN ETHIOPIA .......................................... 49
9.4 ANNEX 4: GLOSSARY ............................................................................................... 50
9.5 ANNEX 5: Net Present Values (NPVs) FOR EUCALYPTUS AND CUPRESSUS
STANDS ................................................................................................................................ 53

2
List of Tables Table 1 Global forest resources ................................................................................................ 10
Table 2 The land-cover types of Ethiopia (WBISPP, 2005) .................................................... 11
Table 3 Mean growth stock and annual increments of forest categories of Ethiopia (m3 ha-1) 12
Table 4 Mean growth stock and annual increments of forest categories of Ethiopia (m3 ha-1) 13
Table 5 GHG emissions from and C sequestration in forest resources of Ethiopia (‘000 tons)
.................................................................................................................................................. 15
Table 6 Productivity of major introduced tree species in Ethiopia at various site conditions . 20
Table 7 Potential land area eligible for CDM in Ethiopia ........................................................ 22
Table 8 Annual deforestation rate estimates in Ethiopia .......................................................... 24
Table 9 Supply- consumption pattern of fuel wood in Ethiopia .............................................. 25
Table 10 Prices of wood products in Ethiopia ......................................................................... 29
List of Figures Figure 1 Growth curves predicting growth of Eucalyptus. globulus stands of different origins
in central highlands of Ethiopia: (a) total volume production for stands originating from
seedlings, (b) total volume production for stands originating from coppice, (c) biomass
production for stands originating from seedlings, and (d) biomass production for stands
originating from coppice. ......................................................................................................... 19
Figure 2 Growth curves predicting growth of Cupressus lucitanica stands at different sites
(Site index 19-26) in Gambo-Shashemene, Ethiopia: (a) total volume, and (b) biomass. ....... 20
Figure 3 Total volume of wood produced in 30 years under unmanaged (red-current
management) and managed by maximum volume production rotation (green-future
management) Eucalyptus globulus stands in central highlands of Ethiopia. ........................... 28

3
ACRONYMS
AGBC Above Ground Biomass Carbon A/R Afforestation/Reforestation BEF Biomass Expansion Factor CAI Current Annual Increment CBO Community Based Organization CDM Clean Development Mechanism EFAP Ethiopian Forestry Action Program FAO Food and Agriculture Organization FCPF Forest Carbon Partnership Facility FINIDA Finish International Development Agency FRA Forest Resources Assessment GHG Greenhouse Gas IPCC Intergovernmental on Climate Change JICA Japanese International Cooperation Agency MAI Mean Annual Increment NGO Non‐governmental Organization NPV Net Present Value NTFP Non‐Timber Forest Product PDD Project Design Document PFM Participatory Forest Management REDD Reducing Emissions from Deforestation and Forest Degradation R‐PP Readiness Preparation Proposal SNNPR Southern Nations, Nationalities and Peoples Region UNDP United Nations Development Programme UNFCCC United Nations Framework Convention on Climate Change UNSO United Nations Sudano‐Sahelian Office WBISPP Woody Biomass Inventory and Strategic Planning Project

4
EXECUTIVE SUMMARY
The main purpose of this review paper is to appraise current knowledge on forest
resource base, forest resources management status, and to explore options for
promoting multiple objectives forest management through the intermarriage of
innovative forest management approaches and emerging carbon finances. The need for
management of forest growth stocks for enhanced carbon sequestration will form the
core of the review with emphasis on the need for paradigm shift from classical forest
management focused on wood production to a new forest management approach for
multiple objectives that includes carbon stock and carbon trading scenarios.
The key findings and recommendations are presented as follows:
The forests resources of Ethiopia store 2.76 billion tons of carbon (about 10 billion tons
of CO2) in the aboveground biomass, which will be released to the atmosphere in 50
years if the deforestation continues at the present rate of about 2%. The local
consequences are shortage of wood products, substantial loss of foreign currency for
importing wood, changes in local and regional climates, depletion of biological
resources, further degradation of remaining vegetation and widespread land
degradation. The current scenario of little investment in the forest management will
result in substantial ecological (including carbon emissions from forest sector), social
and economic costs for the country. Professional forest management intervention could
have a significant impact on the socio‐economic contribution of the forestry sector. For
example, a Eucalyptus stand of one hectare could generate an additional value of 65,000
Ethiopian Birr in 30 years, if the stand were harvested following the criterion of
maximum volume production rotation period of 19 years in typical Ethiopian condition,
rather than waiting until the 30th year. This is an instance highlighting the need for
change in attitude and appreciation to the contribution of professional management in
the forestry sector.
At national and local level, the function of managed forest resources for creating a stable
environment within which sustainable socio‐economic development can be achieved is
being recognized by policy and decision makers at various levels, including knock‐on
effects on the other sectors. For example, the rugged and sloppy terrain in the highlands,
especially those without terraces, should command priority as the expected intense

5
rainfall associated with climate change on such exposed surfaces will result in increased
sediment transport to reservoirs and dams. Financial instruments such as REDD+ and
CDM could be utilized as a catalyst for promoting such programs. Cognizant of
productive and protective functions of forests, Ethiopia has taken significant steps in the
legal or policy arena for development, management and use of forest resources. The
Ethiopian Government appreciates the fact that forest resources cannot be managed
centrally by overstretched government staff. Following the federal structure, the
Ethiopian constitution allows the devolution of power to Regional States for the
management and use of natural resources including forests. Additionally, the forest
policy and the environmental policy acknowledge participation of local communities in
natural resource management. Such conditions as decentralization of power and
participation of local communities are assumed to be effective in natural resource
management, and are required to obtain climate related finances. In the context of
drawing resources from the international community, Ethiopia has also developed and
submitted Readiness Preparation Proposal (R‐PP) for REDD negotiation. With such
positive developments, there is a great prospect for Ethiopia to mitigate the ever
declining and degrading forest resources.
By maximizing of access to such financial resources, the scene of Ethiopian forestry will
gradually change. Ethiopia is endowed particularly with woodlands and shrublands
which store more than five times higher carbon than that which exists in the natural
high forests, and it is strongly suggested that the country brings these resources forward
in REDD negotiations. In light of carbon finance prospects through CDM, most forest
areas were deforested before the 1989 in Ethiopia, with large areas of land eligible for
CDM projects through Afforestation/Reforestation (A/R).
Forest management is evolving from classical management targeting timber production
to attaining objectives of environmental services and social demands. Carbon as a
component is a new addition, with a potential to alter the economics of forest
management, which has often constrained the capacity of the country for managing its
forest resources. Future forest management should thus aim at diversifying outputs
from forests by the principle of multiple objectives forest management. The major
challenge Ethiopia faces in optimizing natural forest management for multiple
objectives, including carbon forestry, is the high dependence of the country on biomass

6
fuels for its energy. Over 90% of the energy consumed in the country is biomass fuel.
Thus, alternative sources of energy, increased afforestation and efficient use of fuelwood
should continue to receive attention.
The current forest development pilot activities including area enclosures, participatory
forest management, biosphere reserves, pioneering forest carbon projects should be
scaled‐up to cover important natural forests and woodlands in the country. This should
be possible with the potential technical and financial investments at least partly
provided by the international community. Besides developing management plans for the
remaining forests and woodlands, creating new forests should receive particular
attention. To increase afforestation and reforestation, the relevant government
institutions should support opening seed centers (and capacity building for managing
the centers), provide technical and financial support to seed orchard development, and
develop management tools (growth models for important tree species by research
institutions) and guidelines for enhanced wood and carbon production, and for
optimizing other ecological services.
There is a great hope that improved management of forest resources under the inter‐
marriage of innovative forest management approaches (PFM, community based area
enclosures, soil and water conservation, etc.) and carbon finances will change the
landscape of the forestry sector. This will enable the country to contribute more to
climate change mitigation, while tackling national problems such as poverty and land
degradation. However, despite progress in policies related to natural resources
including forests, the weak implementation capacity, lack of a strong forest institution,
and discrepancy among sectoral policies (investment/settlement vis‐à‐vis forestry)
remain a challenge. Establishing a strong forestry institution and identifying conflicts in
policy statements and taking measures should thus receive priority by the government.

7
1 INTRODUCTION
Managing forest resources has become one of the most important agenda in climate
negotiations, which has resulted in proliferation of financial mechanisms such as CDM
and REDD. The CDM was proposed by the Kyoto protocol as an instrument to reduce
emissions with particular purpose of enhancing cooperation between developed and
developing countries in mitigating climate change. The CDM assists developed countries
implementing their emission reduction at low cost; and developing countries receive
capital for environmentally acceptable and economically viable forest investments that
contribute to sustainable development. Similarly, REDD opens an opportunity for the
development of sustainable forest management and utilization in developing countries
which have historically experienced high rates of deforestation and forest degradation
due to financial and technical constraints. To access such financial resources and
economic incentives, developing countries are expected, among others, to:
‐ Reduce deforestation and degradation of existing forests,
‐ Expanding the size of existing forest carbon stocks,
In this respect, the country’s institutional capacity to generate and report accurate and
consistent data that meet international standards and also to create favourable policy
environment are most valid requirements to derive benefits from climate funds. More
importantly various issues regarding carbon cycle in forests, periodic monitoring of
changes in forest and carbon stocks and verifying the results and establishing empirical
relationships are likely to be the subject of research and development undertakings.
In view of this, the UNDP‐CDM Capacity Development Office has a long‐term objective of
supporting institutional capacity building for better economic returns, environmental
management, and societal adaptive capacity to climate anomalies through promoting
carbon projects in Eastern and Southern Africa. The Ethiopian Climate Change Research
and Networking is established with a broad objective of providing scientific information
on climate change related issues to development actors and policy makers in a useful
and timely manner. In view of assisting the national efforts, the UNDP‐CDM Office and
the Ethiopian Climate Change Research and Networking held a series of discussions and
agreed to conduct a review on current knowledge on the status of Ethiopian forest
resources, their management and carbon stocks potentials and explore options for
promoting multiple objectives forest management in light of climate change mitigation

8
and adaptation. With this objective, UNDP‐CDM Capacity Development Office has
commissioned this review.
The review article consists of seven chapters. Chapter 1 provides background and
purpose of the work and the contents of the review article. Chapter 2 broadly describes
the extent of global forests resources and their special role in carbon cycle and climate.
In Chaper3 and 4, the focus turns to forest resources in Ethiopia, and presents data on
forest types, growth stocks, productivity and their carbon stocks. Chapter 5 provides an
overview of the carbon finance prospects for Ethiopia, and reflects on the conditions
required for realizing the potential. Chapter 6 discusses about the multiple objectives
forest management. This Chapter presents forest management scenarios with
illustrations, proposes better future forest management options, and identifies the
challenges/conditions for implementing the multiple objectives forest management.
Overall conclusions and recommendations are presented in chapter 7. Finally, for
interested readers, five annexes are attached at the end of the document.
2 THE POSITION OF FORESTS IN THE GLOBAL CARBON CYCLE
Human beings have become a component in the earth’s system, driving and accelerating
global warming through the rapid release of greenhouse gases (GHGs) into the
atmosphere. Human beings alter the composition of the atmosphere through increasing
the concentration of greenhouse gases (GHGs) in the atmosphere by fossil fuel burning
which represents about two‐third of the global emissions and by deforestation and
land use changes representing about one‐third. These are anthropogenic causes of
climate change. There is no doubt that our climate is changing. This will pose huge
challenges to nations, organizations, enterprises, cities, communities and individuals.
Developing countries will suffer most from adverse consequences of climate change, and
the highly vulnerable regions and people are already being affected.
Forests play an important role in the global carbon balance. As both carbon sources and
sinks, they have the potential to form an important component in efforts to combat
global climate change. FRA (2010) estimated that the world’s forests store 289 Gt of
carbon in their biomass alone (www. fao.org/forestry/fra/fra2010/en/). As sources of
GHGs, deforestation accounts for approximately 20% of anthropogenic emissions (FAO

9
2006; Stern, 2006). Although deforestation is reported to represent about 20% of the
global GHGs emissions, regionally the figure varies. About 70% GHGs emissions is
caused by deforestation in Africa (Gibbs et al., 2007). For the world as a whole, carbon
stocks in forest biomass decreased by an estimated 0.5 Gt annually during the period
2005–2010, mainly because of a reduction in the global forest area. On the other hand,
the recent IPCC report estimated that the global forestry sector represents over 50% of
global greenhouse mitigation potential (IPCC, 2007). Consequently, forestry became the
focus of global climate change policy and is given a key position in international climate
treaties. While sustainable management, planting and rehabilitation of forests can
conserve or increase forest carbon stocks, deforestation, degradation and poor forest
management reduce them.
When forests are transformed into agriculture, the subsequent land use systems
implemented determine the amount of potential carbon restocking that takes place.
Annual crop systems will on average contain only 3 tons C ha‐1, intensive tree crop
plantations 30‐60 tons carbon ha‐1, which is 1 and 10‐25% of the forest biomass and
carbon stock. The annual C sequestration rate (increment of standing stock) may be the
same for these three of vegetation types (annual crop, tree plantation and forest) about
3 tons C ha‐1 yr‐1, but the mean residence time differs from 1, 10 to 83 years. Changes in
carbon stocks between vegetation and land use types relate primarily to this ‘mean
residence time’ of the carbon in the biomass.
3 FORESTS AND FOREST GROWTH
3.1 Extent of world’s forest resources
The definition of forest is still ambiguous. According to FAO (2006) forest is a minimum
land area of 0.05‐1 ha with tree crown cover more than 10‐30% and tree height of 2‐5m
at maturity. FAO (2001) defined a forest as “land with a tree crown cover (or equivalent
stocking level) of more than 10% and an area of more than 0.5 hectare; the trees should
be able to reach a minimum height of 5 meter at maturity in situ”.
A recent Forest Resources Assessment (FAO, 2010) estimated the global forest cover at
just over 4 billion hectares, which is 31% of total land area of the world (see also www.
fao.org/forestry/fra/fra2010/en/; Table 1), which corresponds to an average of 0.6 ha

10
per capita. The five most forest‐rich countries (the Russian Federation, Brazil, Canada,
the United States of America and China) account for more than half of the total forest
area. Ten countries or areas have no forest at all and an additional 54 have forest on less
than 10 percent of their total land area. Concerning deforestation, mainly the conversion
of tropical forests to agricultural land, the same report indicated signs of decreasing in
several countries but continues at a high rate in others. Around 13 million hectares of
forest were converted to other uses or lost through natural causes each year in the last
decade compared to 16 million hectares per year in the 1990s. Both Brazil and
Indonesia, which had the highest net loss of forest in the 1990s, have significantly
reduced their rate of loss.
Table 1 Global forest resources COUNTRY TOTAL FOREST AREA (MILLION HA) Russia 809.0Brazil 520.0Canada 310.0USA 3040China 207.0DRC 154.0Australia 149.0Indonesia 94.0Sudan 70.0India 68.0Others 1,347.6World 4,033.6Source: FAO, 2010
3.2 Forests and other land cover types in Ethiopia
Ethiopia’s forest resources supply most of the wood products used within the country,
as well as a large volume of diverse non‐timber forest products (NTFPs), besides their
ecological functions. Several authors and national or sub‐national inventory projects
have carried out assessments and documented the extent of forest resources and other
land uses of Ethiopia. Among these, the following are worth mentioning: Chaffey (1982),
ENEC‐CESEN (1986), LUPRD‐MOA/FAO (1985), and the World Bank‐funded Woody
Biomass Inventory and Strategic Planning Project (WBISPP) has reviewed these various
reports.

11
A key source of information on forests and other land uses in Ethiopia is WBISPP.
WPISPP (2005) classified the land cover types in Ethiopia into 9 major types (Table 2).
In the recent forest proclamation (No. 542/2007), high forests, woodlands, bamboo
forests are recognized as forests.
Based on WBISPP, the land use/land cover statistics in Ethiopia indicates that woody
vegetations including high forests cover over 50% of the land (WBISPP, 2005). The
definition of forest is ambiguous in the IPCC Good practices Guideline. Following the
definition of FAO (2001) the vegetations of Ethiopia that may qualify as ‘forests’ are
natural high forests, woodlands, plantations and bamboo forests, with an estimated area
of 35.13 million ha. If the shrublands are added to this (considering the definition of
IPCC for forest), the estimated cover is over 50% (61.62 million ha). The next largest
land use type is cultivated land with 18.6% cover.
Table 2 The land‐cover types of Ethiopia and their magnitude/proportion (WBISPP, 2005) LAND COVER TYPE AREA IN HECTARE PERCENTAGE
Cultivated land 21,298,529 18.6
High forests 4,073,213 3.56
Plantations 501,522 0.4
Woodlands 29,549,016 25.8
Shrublands 26,403,048 23.1
Grasslands 14,620,707 12.8
Afro‐alpine 245,326 0.21
Highland bamboo 31,003 0.027
Lowland bamboo 1,070,1981 0.97
Swamp 810,213 0.70
Water 828,277 0.72
Bare rock, soil, etc 15,359,409 13.4
Source: WBISPP, 2005 (p. 18)
On the other hand, the recent data on forest resources of Ethiopia reported in FAO
(2010) puts Ethiopia among countries with forest cover of 10‐30%. According to this
1 LUSO‐Consult, 1997

12
report Ethiopia’s forest cover (FAO definition) is 12.2 million ha (11%), clearly
underestimated compared to the IPCC definition. It further indicated that the forest
cover shows a decline from 15.11million ha in 1990 to 12.2 million ha in 2010, during
which 2.65% of the forest cover was deforested. The cover belonging to other wooded
land remained constant in the same period. The FAO (2010) FRA data is based on a
reclassification, calibration and linear extrapolation of data from WBISPP 2004.
3.3 Forest growth stocks and annual increments in Ethiopia
The growth of forest and other woody vegetations in Ethiopia is primarily determined
by the amount of rainfall, modified by local topography and drainage properties. Chaffey
(1982), EFAP (1994) and WBISPP (2005) presented estimates of forest growth stocks
for Ethiopia. The estimates for forest growth stocks and annual increments presented in
Table 3 are derived from data of WBISPP (2005).
Table 3 Mean growth stock and annual increments of forest categories of Ethiopia (m3 ha‐1)
FOREST CATEGORY GROWTH STOCK/FREE
BOLE VOLUME/ (M3 HA1)
MAI (M3 HA1 YR1)
High forest 131.5 5.65
Woodland 21.0 0.79
Plantation 178.8 12.5
Lowland bamboo 26.0 1.3
Highland bamboo 83.0 3.9
Shrubland 14.9 0.5
Source: WBISPP (2005) and Sisay et al. (2009). Growth stock and MAI calculated based on weighted averages of sub‐categories of a main forest category. The estimates presented here are very rough and probably also underestimated. For
example, JICA calculated stand volumes for Belete Gera high forest at three strata,
namely, closed, slightly disturbed and disturbed forests. The calculated merchantable
stand volumes were 410.8, 282.8 and 174.8 m3 ha‐1, respectively. The discrepancy calls
for the need for carrying out forest growth stock assessments at least at ecosystem scale.

13
3.4 Carbon stocks of forests in Ethiopia
At a national level, forest inventories, woody biomass assessments, agricultural surveys,
land registry information and scientific research can prove useful data for acquisition of
forest carbon accounting. In this context WBISPP data is relevant source of information
for Ethiopian forest carbon accounting. Thus, the national carbon stock presented in
Table 4 was estimated based on WBISPP data.
From Table 4, it is clear that the largest store of carbon in the country is found in the
woodlands (45.7%) and the shrublands (34.4%). However, despite their great potential
in influencing carbon balance, these vegetation types are largely neglected in forest
related discussions, including carbon negotiations.
Table 4 Mean aboveground carbon density and total carbon stocks in major forest categories of Ethiopia FOREST
CATEGORY2
FREE‐BOLE
BIOMASS
(TONS HA‐1)
(A)
BEF
(TONS HA‐1)
(B)
AGB C
(TONS HA‐1)
(A*B*0.5*)
AREA
(MILLION
HA)
TOTAL C
STOCK
(MILLION
TONS)
High forest 131.5 2.74 106.68 4.07 434.19
Woodland 21.0 6.9 42.75 29.55 1,263.13
Plantation 178.8 2.33 123.0 0.50 61.52
Lowland
bamboo
26.0 6.19 47.5 1.07 50.80
Highland
bamboo
83.0 3.44 84.23 0.03 2.53
Shrubland 14.9 8.20 36.04 26.40 951.54
Total C 2,763.70
*Assuming the carbon content of green wood is approximately 50% of the biomass (WBISPP, 2005). C is calculated based on the formula developed by Brown, 1997. AGB = Aboveground biomass. BEF = Biomass expansion factor.
The national carbon stocks shown here largely agree with 2.5 billion tons in 2005
reported by Sisay et al. (2009). On the other hand, the carbon stocks estimates for 2 All woody vegetations (referred to as forest category) are included in the estimation of the national carbon stocks.

14
Ethiopia based on biome‐averaged values of 153 million tons by Houghton (1999) and
867 million tons by Gibbs and Brown, (2007a) are very low. See
http://cdiac.ornl.gov/epubs/ndp/ndp0555/ndp05b.html.
Brown (1997) reported a carbon density of 101 tons ha‐1 for high forests in Ethiopia,
and agrees well with the estimate presented here. However, some case studies show
even higher carbon density values of close 200 tons ha‐1 than the estimates based on
WBISPP for high forests in Bale Mountains (Temam, 2010; Tsegaye Tadesse, 2010). The
discrepancy is due to the different methods and tools applied, regional variability in soil,
topography, and forest type and the uncertainties associated with the methods used.
The WBISPP data has provided a broad base for estimating forest and carbon stocks at
national level. However, for higher accuracy and increased utility at management level, it
may be appropriate to use a finer scale of vegetation classification and make estimates at
this scale. For instance, nine vegetation types are distinguished in Ethiopia: Afro‐alpine
and Sub‐Afro‐alpine, Dry Evergreen Montane Forest, Moist Evergreen Montane Forest,
AcaciaCommiphora (Small Leaved) Woodland, CombretumTerminalia (Broad Leaved)
Woodland, Lowland Dry Forests, Wetland (swamps, lakes, rivers and riparian)
Vegetation,, Evergreen Scrub Vegetation, and Lowland Semi‐Desert and Desert
Vegetation (Sebsebe, 1996; CSE, 1997; Zerihun, 2000; IBC, 2005). Data on growth stocks
and increments and corresponding carbon stocks could be generated at least following
this classification or even at finer resolutions (e.g., strata within a vegetation type based
on level of degradation) for increasing its utility in management planning and REDD
negotiations in the future. Therefore, research institutions and other relevant
organizations should draw their attention to addressing this gap.
3.5 Carbon stocks in agroforestry systems (Trees outside forests)
Despite the fact that trees outside forests have a great potential for carbon storage, they
are often not recognized by researchers and development organizations and the
government, while discussing about carbon and climate change at large. Although
assessing the extent of tree resources outside forests remains challenging, it is essential
that these are not overlooked in carbon accounting.

15
Coffee agroforestry: Among the four coffee production systems in Ethiopia namely,
forest coffee, semi‐forest coffee, garden coffee, and plantation coffee (Woldetsadik and
Kebede, 2000), the focus of this part is on garden coffee, to avoid double counting.
Although the potential for carbon storage is high, the carbon stocks in garden coffee
system have not been systematically documented. The Gedeo traditional coffee‐enset
agroforests, for example store 70 tons of carbon ha‐1 (Yitebitu Moges, unpublished data).
Dossa et al. (2008) reported a more or less similar value for carbon stock of 81 tons ha‐1
in the shaded coffee system (Coffea canephora) in Togo.
Cultivated land: Open cereal fields lightly stocked with trees contain about 1.78, while
moderately stocked fields have 2.47 tons of carbon ha ‐1. The carbon stock value for
irrigated fields is about 1.6 tons of carbon ha‐1 (WBISPP, 2005).
3.6 Carbon emissions and sequestration in forestry sector in Ethiopia
Identification of the potential sources and sinks of GHGs is a major step in making
emissions accounting at various levels for directing policy. In Ethiopia, the major
sources of GHGs emission from Land Use Change and Forestry are use of biomass energy
(charcoal, firewood, dung, residues, etc., and conversion of forests to agriculture. On the
other hand, the forest and woody vegetations of Ethiopia play an important
environmental role in sequestering carbon. Table 5 presents the emissions of GHGs
from burning of biomass fuels and conversion of forests to agricultural lands and
sequestration by the woody vegetation in Ethiopia.
The results presented indicate that the forest resources of Ethiopia sequester 44 times
the amount of CO2 that is being released by burning the woody biomass stocks as fuels
and 478 times the CO2 released from clearing forests for agriculture.
Table 5 GHG emissions from and C sequestration in forest resources of Ethiopia (‘000 tons) GHGS EMISSION BY
FOREST
CLEARING FOR
AGRICULTURE
EMISSION FROM
BURNING OF
BIOMASS
FUELS(WOOD,
DUNG, CROP
RESIDUE)
SEQUESTRATION
IN WOODY
BIOMASS STOCK
BALANCE

16
C 1,203.1 12,416.8 74,496.4 ‐60867.5
CO2 4,415.4 47,490.3 2,108401.6 ‐2056495.9
CO 0.144 1.7 68.9 ‐67.1
CH4 0.029 943.8 13.8 +930.0
N2O 0.017 0.2 8.0 ‐7.8
NOx 0.291 2.8 139.0 ‐135.9
Source: WBISPP (2005)
The large net carbon sequestered in woody biomass suggests that woody vegetations in
Ethiopia are in a state of fast biomass accumulation. However, previous national
inventories (e.g., see Table 9 for the negative balance between wood yield and
consumption at national level) and the level of increasing degradation indicates just the
opposite. Therefore, either the yield increment estimates reported by WBISPP is too
high and/or the wood consumption at national level for fuel and construction is
underestimated. Hence, the emission and sequestration balance made by WBISPP needs
to be re‐evaluated.
4 PLANTATION FORESTS IN ETHIOPIA
4.1 Background
Forest resources in Ethiopia have experienced so much pressure due to increasing need
for wood products and conversion to agriculture. The trend in Ethiopia today is to
protect the remaining natural forests for their various social, economic and
environmental values. On the other hand, there is increasing demand for wood and
wood products (see Table 9 in section 6.1.1). To strike the balance between the two
interests, afforestation/reforestation (here after referred to as plantations) is very
important. Plantations are even‐aged forest stands deliberately established by humans
on formerly non‐forested lands or deforested lands. The purpose can be wood
production or protection under the ownerships of the private sector, individual farmers,
the community, or the state.
The size of plantations ranges from less than a hectare (e.g., Eucalyptus woodlots) to
several hundred thousands of hectares of land (large scale plantations). Size of large
scale state or community plantations depends on whether the plantation is integrated

17
with a processing industry (and thus with its annual intake of wood), availability of
market or the wood requirements of communities.
Ethiopia has a long history of tree planting activities. According to historical records,
afforestation started in the early 1400s by the order of King Zera‐Yakob (1434‐1468).
Modern tree planting using introduced tree species (mainly Australian Eucalyptus)
started in 1895 when Emperor Menelik II (1888‐1892) looked into solutions for
alleviating shortage of firewood and construction wood in the capital, Addis Ababa.
However, the historic rapid expansion of large scale and community plantations
occurred during the Dergue regime, which resulted in the establishment of large scale
plantations. Several fuelwood projects funded by UNSO, UNDP and FINNIDA spread over
the country with marked concentrations around big cities such as Bahir Dar, Dessie,
Gondar, Nazareth, Addis Ababa and Debre‐Berhan (Breitenbach, 1962). These
plantations have often been established for supplying the huge demand for wood
products in Ethiopia.
Today, tree plantations cover approximately 500, 000 ha (WBISPP, 2005), out of which
133,041 ha were established as community plantations between 1978 and 1989.
Eucalyptus species (58%) and Cupressus (29%) are the dominant plantation species.
Other species include Juniperus procera (4%), Pinus species (2%) and the rest (7%).
4.2 Productivity of plantation forests: Growth stocks and increments
Productivity of plantations depends on site productivity (quality), seed sources (genetic
potential), and management. Site productivity is primarily determined by rainfall,
modified locally by topography and drainage pattern influencing water availability and
length of growing season. However, moisture limitation in drier areas can be overcome
by irrigation, which greatly increases productivity because of high level of radiation and
good soils.
For productive plantations, selection of mother trees with superior quality is essential.
Seed collection, processing and storage are also key considerations. Currently about 59
% of the demand for tree seeds are covered primarily by a government supplier at the
Forestry Research Center (Abayneh Derero, 2004). Besides site quality and the genetic

18
potential, management of plantations including nursery establishment, seedling
production, silvicultural operations (timely weeding, thinning, and pruning), protection
(diseases, pests, fire) and timely harvesting affect the productivity of plantations in a
given area. However, most of the plantations are suffering from lack of proper
management. The condition of plantations established by the state and communities
across the country does not receive timely thinning, pruning or harvesting. This has a
negative implication on the economic benefits that could be accrued from plantations
(see Section 6.1.2 below).
Knowledge of forest growth, mean annual increment and rotation period are important
for forest managers in order to indicate the amount of total harvest in a given year by a
specific species. The mean annual increment (MAI) indicates the amount of wood that
the plantation will produce annually. The rotation period is the period in which the
forest plantation is allowed to grow. The rotation period informs the manager as to
when the plantation has to be harvested depending on the intended purpose of
management.
Growth stocks prediction Growth models (graphs, tables and equations) are used for predicting growth and yields
of plantations across a variety of sites. Without these tools, there are no means to
evaluate which rotation length or thinning schedule would give the most favourable
yield of various timber assortments. Proper management of plantations in Ethiopia has
been neglected partly due to lack of suitable growth models and yield tables. The
exceptions are yield tables were developed for Eucalyptus globulus (Pukkala and
Pohjonen 1989) and Cupressus lucitanica (Pukkala and Pohjonen, 1993; Negash Mamo
2007), the major plantation species in Ethiopia (Figures 1 and 2). Figure 1 a‐d predicts
the volume and biomass growth E. globulus in central highlands of Ethiopia for four site
classes. For example, in Figure 1 a, at 20 years of age, E. globulus plantations of seedling
origin produce total volumes (or attain a dominant heights) of 873 (46.5 m), 580
(38.7m), 370 (31.0 m), and 178 m3 ha‐1 (23.2m) at Site Class I (good site), II, III and IV
(poor site), respectively.

19
Seedling stand
Stand age (years)
0 5 10 15 20 25 30 35
Vo
lum
e (
m3 h
a-1
)
0
200
400
600
800
1000
1200
Volume in site class I: V1 Volume in site class II: V2 Volume in site class III:V3Volume in site class IV:V4
Stand age (years)
0 5 10 15 20 25 30 35
Bio
ma
ss (
ton
s h
a-1
)
0
100
200
300
400
500
600
700
Biomass in site class IBiomass in site class IIBiomass in site class IIIBiomass in site class IV
Seedling stand
a
c
Coppice stand
Stand age (years)
0 5 10 15 20 25 30 35
Vo
lum
e (
m3 h
a-1
)
0
200
400
600
800
1000
1200
1400
Volume in site class I: V1Volume in site calss II:V2Volume in site class III:V3Volume in site class IV:V4
Stand age (years)
0 5 10 15 20 25 30 35
Bio
ma
ss (
ton
s h
a-1
)
0
200
400
600
800
Biomass in site class IBiomass in site class IIBiomass in site class IIIBiomass in site class IV
Coppice stand
b
d
Figure 1 Growth curves predicting growth of Eucalyptus. globulus stands of different origins in central highlands of Ethiopia: (a) total volume production for stands originating from seedlings, (b) total volume production for stands originating from coppice, (c) biomass production for stands originating from seedlings, and (d) biomass production for stands originating from coppice. Data source: Pukkala and Pohjonen, 1989. Similarly, based on the yield tables developed by Negash Mamo (2007), the growth
curves (volume and biomass) for C. lucitanica from 8 site indices are presented in
Figures 2a and b.
The major limitation of site class/site index based productivity indicators developed by
Pukkala and Pohjonen (1989), Pukkala and Pohjonen (1993) and Negash (2007) is that
the biophysical setting (e.g., rainfall, temperature, soil fertility, soil depth, and soil type
within which such classes exist is not defined. However, noting the fact that the major
success factors (site, seed source and management) determining plantation
productivity, there is a need for assessment of dominant heights versus age to assign site
classes for the existing plantations (of the important species) in Ethiopia by research
institutions for guiding the future investment in plantations. Generally, constructing a
set of yield tables for different Ethiopian plantation growing sites for important species

20
will provide forest managers with a more flexible tool for examining management
options.
Stand age (years)
6 8 10 12 14 16 18 20 22 24 26
To
tal v
olu
me
(m
3 h
a-1
)
0
200
400
600
800
1000
SI19SI20SI21SI22SI23SI24SI25SI26
a
Stand age (years)
6 8 10 12 14 16 18 20 22 24 26
Bio
ma
ss (
ton
s h
a-1
)
0
50
100
150
200
250
300
350
SI19 SI20 SI21 SI22 SI23 SI24 SI25 SI26
b
Figure 2 Growth curves predicting growth of Cupressus lucitanica stands at different sites (Site index 19‐26) in Gambo‐Shashemene, Ethiopia: (a) total volume, and (b) biomass. Data source: Negash Mamo, 2007. Mean annual increment Pukkala and Pohjonen found a five‐fold difference in mean annual increments (MAI) of
E. globulus plantations (Table 6) at different locations in central highlands of Ethiopia.
For Eucalyptus globulus in central highlands of Ethiopia the MAI ranges between 44 m3
ha‐1 at the Site Class I (most productive site) through 29.2 m3 ha‐1 at Site Class II, 17.5 m3
ha‐1 at Site Class III to 9 m3 ha‐1 in Site Class IV (the poorest site). However, most
Eucalyptus fuelwood plantations in the 1980s were established on poorer sites, which
produced 10 to 20 m3 of wood ha‐1yr‐1 (Pohjonen and Pukkala, 1990). Negash Mamo
(2007) has also found for Cupressus lucitanica plantations in Munessa area (within one
traditional agro‐ecology) at reference age 15 years maximum mean annual increments
between 22 m3 ha‐1 yr‐1at site index 19 and 38 m3 ha‐1 yr‐1 at site index 26. The results
suggest that use of traditional agro‐ecological zones for classification of forest
productivity is too broad because highly variable site conditions are often encountered
in a particular traditional agro‐ecological zone.
Table 6 Productivity of major introduced tree species in Ethiopia at various site conditions
SPECIES SITE INDEX/SITE CLASS
ROTATION LENGTH (YR)
MAI (M3 HA1 YR1)(STEM WOOD VOLUME)
BIOMASS (TONS HA1)
Cupressus lusitanica
M19 19 22.23 13.91
M21 19 23.23 14.50 M22 19 24.22 15.65 M23 19 26.13 16.21 M24 19 27.06 17.88

21
M25 19 29.86 19.65 M26 19 32.82 13.31E. globulus (seedling stand)
Site class 1 19 43.90 26.29
Site class 2 19 29.20 17.49 Site class 3 19 17.50 10.48 Site class 4 19 9.00 5.39E. globulus (coppice stand)
Site class 1 14/15 46.20 27.67
Site class 2 15 33.30 19.94 Site class 3 14/15 22.30 13.35 Site class 4 14 13.40 8.03E. saligna 10 38.00 22.76P. patula 12/13 25.00 14.97Data source: Negash Mamo (2007) for Cupressus lusitanica; Pukkala and Pohjonen, 1989 for Eucalyptus globulus, and Orlander, 1986 for Eucalyptus saligna, and Pinus patula.
Information on growth stocks and yields of other important plantation species across
sites remains still a gap, and should be addressed by research institutions.
Rotation period: Physical, financial, technical, maximum volume production Four types of rotation period are distinguished. The rotation of maximum volume
production uses the criterion of maximum MAI; and the plantation is harvested when
the current annual increment (CAI) and MAI are equal. Technical rotation period uses
the end use of the forest products (pole, timber, veneer) as a guide for harvesting.
Financial rotation maximizes the positive cash flow from plantation. Physical rotation is
determined by the ecological characteristics of the site (drier areas shorter rotation).
Similar to annual increments, lack of data on optimal rotation period for various
plantation species hampers proper forest management in Ethiopia. Only few species in
specific localities have been studied so far. For example, Pukkala and Pohjonen (1989)
provided recommendation on rotation period for E. globulus. Based on maximum
volume production, the rotation period for E. globulus plantations of 1500‐2000 tees ha‐
1 which originated from seedlings is about 19 years (Table 6). For Eucalyptus woodlots
planted at higher densities of 10,000 to 40,000 trees ha‐1 and managed for pole
production, the technical rotation period may be applied, which is 3‐6 years (Evans,
1992).

22
The rotation period of maximum volume production for C. lucitanica is 19 years (Table
6; Negash, 2007). However, since the softwood plantations in Ethiopia are often
managed for timber production (trees should be large enough for lumber) and thus
require longer rotation period than 19 years as Cupressus trees will be still small for
timber at 19 years of age. Therefore, longer rotation period is required for maximizing
economic benefits. Either financial or technical rotations can be appropriate. Research
should focus its attention on developing forest growth and yields models for important
plantation species.
5 CARBON FINANCE PROSPECTS FOR ETHIOPIA
Climate change funding mechanisms available for financing forestry sector are CDM and
REDD. Ethiopia has so far registered only one CDM project (Humbo, SNNPR, UNFCCC
registration Dec. 2009, area of 2,728 ha). Concerning REDD, Ethiopia has prepared
Readiness Preparation Proposal (R‐PP) to the World Bank’s Forest Carbon Partnership
Facility (FCPF).
The prospect for access to carbon finances for Ethiopia is very great considering the
following facts. Studies such as Ethiopian Forestry Action program (EFAP, 1994)
indicate that about 35% of Ethiopia’s land area or nearly 40 million ha might once have
been covered by high forests. By the early 1950s the forest area cover declined to 16%
of the total land area. In 1989, the land area covered by forests declined to 2.7% of the
total land area. This shows that about 36 million ha of land in Ethiopia is eligible for
CDM A/R (Table 7).
Table 7 Potential land area eligible for CDM in Ethiopia YEAR Total Land Area
(ha) Forest Cover (ha)
Land Potentially Eligible for A/R
Remarks
Pre‐ 1950 112,800,000 39,480,000 1950 112,800,000 18,048,000 21,432,000 Afforestation1989 112,800,000 3,045,6000 15,002,400 ReforestationTotal land that may be dedicated for CDM through A/R
36,434,400
Source: Estimated by Sisay Nune in EPA (2010) based on data from EFAP (1994).

23
Actual areas under CDM are emerging on project basis. For example there are now three
projects, in the Abote, Ada Berga, and Sodo areas, that are mentioned as potential CDM
projects. An additional CDM project, covering an area 20,000 ha earmarked for
afforestation/ reforestation in the Amhara National Regional State is under discussion.
With respect to REDD, the large amount of carbon stored in the different forest
categories (Table 4) may continue to release CO2 to the atmosphere through
deforestation and forest degradation. If Ethiopia decides to protect these forest
resources through carbon finances, it is possible to mitigate the release of 2.76 billion
tons of carbon3 into the atmosphere.
Similar to the CDM, REDD+ pilots are in preparatory stages in Ethiopia by various non‐
governmental organizations, such as FARM Africa/SOS Sahel in the Bale eco‐region
(500,000 ha) (which is expected to generate several millions of USD during the contract
period of 21 years). The government of Ethiopia has started to take lessons from the
experiences of the NGOs working in the area of CDM and REDD for example in the
preparation of R‐PP for REDD. On the basis of such experiences the government may
refine some of the policy and other requirements that are expected under its domain.
Clearly, the aforementioned prospects should provide sufficient incentives for the
Government of Ethiopia to create enabling policy environment and over all readiness
and the international community to provide required financial resources.
In order to fully utilize such financial opportunities while addressing global climate
change, capacity building of the government institutions and the private sector dealing
with forestry (for example in the preparation of PDD) should receive high priority.
Despite the existence of good policies, there is still a gap in some areas that might hinder
the implementation of carbon related projects such as absence of benefit sharing
mechanism (e.g., how much for community and how much for the project developer, and
how much for the government, etc) and absence participatory forest management in the
forest policy of the country. Another limitation for carbon project development is the
upfront cost. Therefore, to take advantage of the available opportunities:
3 1 ton carbon is equivalent to 3.6667 tons of CO2.

24
Identifying or re‐organizing the right institution (s) to guide the process and
implementation of carbon projects
Building capacity of institutions and the private sector including communities
Creating conducive policy environment for carbon and carbon related projects
Facilitating access to bank loan for carbon and carbon related projects (e.g.,
upfront costs).
6 FUTURE FOREST MANAGEMENT OPTIONS : MULTIPLE OBJECTIVES
MANAGEMENT
Forests have multiple functions in today’s society, and the principles of multiple
objectives management of different forest categories is expected to achieve such
expectations. Addressing the problems of deforestation and forest degradation will
enhance ecosystem services that have knock‐on effect on other sectors such as energy,
and agriculture. Additionally, the demand for wood and non‐wood forest and tree
products could be satisfied. Through appropriate management, the various objectives
could be optimally achieved, including enhanced carbon sequestration in forest
resources.
6.1 Forest management scenarios
6.1.1 Scenario 1: Status quo (Business as usual)
Forest resources have not so far been managed properly, with few exceptions by profit
making enterprises (e.g., Oromyia Forest and Wildlife Enterprise) and forest managed
temporarily by NGOs in PFM. Consequently, deforestation and forest degradation
continued unabated (Table 8) at an annual rate of about 2%. At 2% deforestation, about
700,000 ha of ‘forests’ will be destroyed every year, releasing nearly 110 million CO2 to
the atmosphere. If this scenario is maintained, another important consequence is wood
crisis (Table 9). Further, the country will be forced to import more wood, with a
significant implication on foreign currency reserve.
Table 8 Annual deforestation rate estimates in Ethiopia SOURCE ANNUAL
DEFORESTATION RATE
REMARKS
FAO, 2010 0.96 Forest decline between 1990‐
2010
25
WBISPP, 2005 2.08Difference between forest cover
estimates by CESEN in 1977 and
WBISPP, 1991
WBISPP, 2005 1.66For the three forested Regional
States (Oromyia, SNNP,
Gambella)
Reusing, 1998 5 For southwest high forests
The table presented above shows different figures on the rate of deforestation. The
authors probably used different definitions of forest, different tools and methods. These
figures are confusing for users including decision makers. Therefore, there must be one
agreed rate of deforestation for Ethiopia that can be used by all stakeholders and
forestry experts. Nevertheless, the WBISPP (2005, p.20) indicated the actual
deforestation rate may be close to the oft‐quoted rate of 2%.
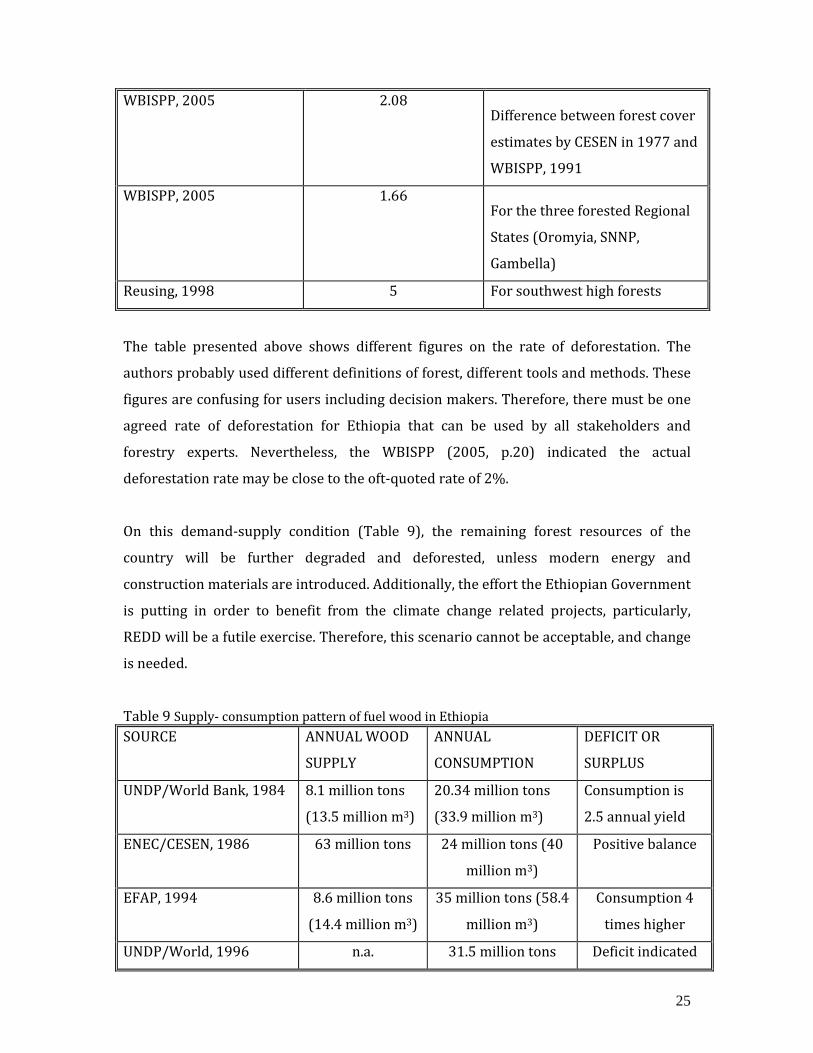
On this demand‐supply condition (Table 9), the remaining forest resources of the
country will be further degraded and deforested, unless modern energy and
construction materials are introduced. Additionally, the effort the Ethiopian Government
is putting in order to benefit from the climate change related projects, particularly,
REDD will be a futile exercise. Therefore, this scenario cannot be acceptable, and change
is needed.
Table 9 Supply‐ consumption pattern of fuel wood in Ethiopia SOURCE ANNUAL WOOD
SUPPLY
ANNUAL
CONSUMPTION
DEFICIT OR
SURPLUS
UNDP/World Bank, 1984 8.1 million tons
(13.5 million m3)
20.34 million tons
(33.9 million m3)
Consumption is
2.5 annual yield
ENEC/CESEN, 1986 63 million tons 24 million tons (40
million m3)
Positive balance
EFAP, 1994 8.6 million tons
(14.4 million m3)
35 million tons (58.4
million m3)
Consumption 4
times higher
UNDP/World, 1996 n.a. 31.5 million tons Deficit indicated

26
(52. million m3)
WBISPP, 2005 50.1 million tons
(84.9 million m3)
53.6 million tons
(89.4 million m3)
Deficit of 3.5
million tons
EFAP 1994 projection for
2020
‐ ‐ Deficit 87‐121
million m3
n.a. = data not available.
6.1.2 Scenario 2 : Managed forest
The experience in other countries shows that management intervention on natural
forests increases wood production, carbon sequestration, besides its benefits in terms of
biodiversity conservation and watershed protection. For example, the average
accumulation rate of carbon dioxide in managed forests is around 5.5 tons ha‐1 yr‐1 in
woodlands, and 21 in tropical rainforests, subtropical forests and lowland forests
(www.communitycarbonforestry.org), while unmanaged tropical rainforests grow at a
rate of about 0.5 tons ha‐1 yr‐1 (Lewis et al., 2009): about 40‐fold increase in annual
yields. Additionally, unmanaged forest is subject to further degradation.
Ethiopia has taken significant legal steps towards improved management of forests and
may change the forest management regime in the country. The new forests policy and
forest proclamation (542/2007) is one such step. In this proclamation, besides the
definition of forest ownerships (primate and state) and purpose (protection and
production), decentralized forest administration is recognized. Ethiopia has also
gathered experiences on innovative forest management approaches including
Participatory Forest Management and area enclosures (e.g., Tigray’s experience) over
the last two decades. Woodlots, agroforestry and public afforestation and reforestation
are also increasing. Additionally, NGOs are pioneering special forest management
strategies such as Biosphere Reserves, CDM and REDD carbon projects. The government
has also introduced a national tree planting campaign every year all over the country in
which every person is encouraged to plant trees, with significant influence on the
attitude of the population on trees.
Given such developments, it can be expected that the gloomy situation in forest
management will not continue. Up‐scaling such strategic forest management approaches

27
backed with proper forest management principles (which is not the case in most
instances now) should be able to change the current forest management regime.
It is important to note that key aspects of proper forest management include the
following, among others:
Proper institutions for managing forest resources (skilled manpower, sufficient
financial and material resources)
Applying scientific forest management principles (e.g., sustainable yield principle
where annual harvest equals annual yield)
Adequate investment on required silvicultural operations and forest
administration, and
Proper utilization and marketing.
In this context, the Oromyia Forest and Wildlife Enterprise is pioneering implementation
of these requirements.
Conventional forest management Emphasis on wood production from plantations
The benefit of forest management guided by management plans is illustrated by Figure
3. In the past E. globulus plantations did not have management plans, except in a few
cases, with respect to, among other things, when to harvest resulting in significant
economic losses. In the Figure it can be shown that by applying a harvesting schedule
recommended based on maximum wood production (optimal rotation period), about
160 m3 ha‐1 of additional wood can be produced in 30 years (indicated by green
parenthesis). This is equivalent to at least a loss of 64,000 Ethiopian Birr at the current
Eucalyptus wood prices (Table 10).

28
Stand age (years)
0 5 10 15 20 25 30 35
To
tal v
olu
me
(m
3 h
a-1
)
0
100
200
300
400
500
600
700
Volume growth for uncut stand Volume growth for cut stand
Figure 3 Total volume of wood produced in 30 years under unmanaged (red‐current management) and managed by maximum volume production rotation (green‐future management) Eucalyptus globulus stands in central highlands of Ethiopia. Data source: Pukkala and Pohjonen, 1989. However, the classical forest management for wood production may not be the best
option in light of emerging demands on the forest resources in climate change mitigation
and biodiversity conservation. Therefore, the principle of multiple objectives forest
management including carbon as a non‐wood product is a realistic and appropriate
option for future forest management.

29
Table 10 Prices of wood products in Ethiopia PRODUCT TYPE MARKET
PLACE DIAMETER (CM)
HEIGHT (M) PRICE/UNIT PRODUCT (BIRR)
PRICE/M3(BIRR)
A. Eucalyptus wood
Addis Ababa
1. Chefeka4 3.6 3.78 6 1002. Small poles (Mager5)
5.2 3.96 9 99
3. Medium size poles (Quami6)
7.3 3.93 12 95
4. Large pole (Woraji7)
9.4 8.3 15 102
5. Particle board wood
400
6. Split wood8 4007. BLT9 B. Timber (log) C. lucitanica Goba about 30 cm 611C. lucitanica Shambo “ 652Pinus patula Nekemt “ 710P. patula Illubabor “ 713C. Charcoal Addis Ababa 245*
Source: Oromiya Forest Enterprise and markets in Addis Ababa , September 2010. *To produce 100 kg of charcoal, about 1 m3 of wood is needed.
Multiple objectives management: Wood production and carbon forestry
In light of the national and global diverse interests on forest resources (wood products,
climate change mitigation, watershed protection, biodiversity conservation etc.), future
forest management in Ethiopia needs to adopt the principle of multiple objectives
management. The aim of this section is to show the implications of multiple objectives
forest management as applied on forest plantations on economic returns. We compared
Net Present Value (NPV) of E. globulus and C. lucitanica stands managed only for wood,
only for carbon and both for wood and carbon. We used the stem volume data from in
Pukkala and Pohjonen (1989) for E. globulus stand site class I. For C. lucitanica, we drew
the data from Negash Mamo (2007). In order to calculate the carbon from stem volume
4 Chefeka: Branches and attached leaves that are stripped from the trunks of Eucalyptus trees so that they are suitable as construction poles. 5 Mager : A pole with about 4 m long and 4‐4.5 cm (small) to 5‐7 cm (large) diameter. 6 Quami : A pole with about 3.5‐4.0 m long and 5‐8 cm (small) to 8‐11 cm (large) diameter. 7 Woraji: A pole about 8.0‐8.5 m long and 4‐6 cm (small) 9‐‐11 cm (large diameter) diameter. 8 Split wood: Poles, large branches and round wood that are split into size in length of about 0.5 m and thickness of 5‐10 cm so that they are suitable directly as fuelwood. 9 BLT: Small dead branches, leaves and twigs that fall to the ground as litter.

30
data, we applied the formula of Brown (1997). The current prices of firewood and saw
logs were taken from Table 10. Forest management costs were also included in the
analysis (SIDA, 1990). Using a discount rate of 10% and a conservative price of 4 USD/
ton of CO2, the NPVs of Eucalyptus and Cupressus stands were calculated for wood,
carbon and both wood and carbon scenarios. Accordingly, the NPVs for a hectare of
Eucalyptus globulus stand managed at 21 years of rotation were 40,802 from wood only,
23,172 from carbon only and 77,177 Birr from wood and carbon. [It should be noted
here that a Eucalyptus stand from the best site has been considered; and on poorer sites,
lower NPVs are to be expected]. Similarly, from Cupressus lucitanica stand grown for 25
years (Site Index 23), the corresponding NPVs were 88,318, 10,348, and 106, 991 Birr
per ha, respectively (for details see Annex 5). With same discount rate, the NPV for C.
lucitanica calculated for wood only case closely agrees with the estimate of Pukkala and
Pohjonen (1993).
NPV analyses show that the income from carbon trading for C. lucitanica and E. globulus
has increased by 9% and 30%, respectively. These indicative analyses suggest that
incorporating carbon as a component of multiple objectives management alters the
economics of forest enterprises. Therefore, carbon payments should be considered as a
catalyst and combined with sustainable utilization of wood and non‐wood products to
create sufficient economic incentive for forest plantation development. Considering the
payments for other environmental services, such as reduced soil erosion and nutrient
cycling, the benefits could be even higher.
6.2 Challenges and recommended actions for implementing best future forest management scenario
One challenge Ethiopia faces in light of managing forest resources for multiple purposes
including carbon is that the national energy balance is dominated by fuelwood, which is
the main source of energy to both urban and rural areas, accounting for over 90% of the
primary total energy supply. The gap between demand and supply for fuelwood is
increasing with time (Table 9). If Ethiopia is to bring significant change in forest
resources degradation, alternative sources of energy should be a top priority at least in
the medium term. Additionally, expansion of energy plantations which are eligible under
CDM could also be taken as a strategy.

31
Additionally, despite significant progress in the policy arena, the main challenge is still
weak implementation of the policies concerning land use planning, creating capacitated
institutions at various levels, land use conflicts, illegal cutting of trees, benefit sharing
mechanisms in participatory forest management, etc. Under the current forest
administration and governance, the Natural Resources Directorate of Ministry of
Agriculture and Rural Development are responsible for forestry development,
conservation and utilization. The technical and financial capacity is very limited, and is
understaffed. In the forestry research, the situation is not much different. Facilitating
successful implementation of forest development strategies requires having adequate
national institutional capacity, at federal and regional levels. In the REDD negotiations,
the lack of a strong forestry institution in the country is raised as one of the challenges
affecting the readiness of the country to access such emerging opportunities. The
research institutions can handle the activities of carbon assessment and certification
processes with adequate capacity building.
Policy discrepancies among sectors of the economy remain also a challenge. The
implementation of investment and settlement policies without undertaking
Environmental Impact Assessment and implementing the Social and Environmental
Management Plan for resettlement program will be in conflict with forest conservation
and development efforts.
Forest management plans are essential components of sustainable forest management,
but the lack of up‐to‐date data on forest resources will constrain the development of
such plans. Therefore, besides the use of available recent data, inventory efforts for
carbon assessment and monitoring should also aim at generating data that can be used
in developing forest management plans. The need to have an updated inventory data
also underlines the necessity for an institution that conducts such inventory on a
regular basis.
The role of CBOs and public institutions such as universities, hospitals and military
barracks in forest development should not be overlooked. Indeed, some of these
organizations consume considerable amount of wood, and thus could be encouraged to
own their forests managed sustainably.

32
At the international level, active carbon finance available for forestry sector is CDM
though A/R. However, as the experience show few forestry carbon projects have been
approved so far, as creditors mainly support other carbon projects (e.g., energy efficient
machines or apparatus). This challenge could be overcome by establishing a ‘Forest‐
Credits’ under CDM.
7 CONCULSIONS AND RECOMMENDATIONS
7.1 Conclusions
1. Global forests resources of just over 4 billion hectares now as a carbon pool hold
about 40% of the carbon in the atmosphere. If the forests are converted to other
land uses, the carbon in the atmosphere will increase from the current level of
760 Gt to 1,049 Gt, which in turn could result in unprecedented global warming.
This means that the international community cannot keep the threshold of 2°C
acceptable warming without taking adequate action on global forest resources
with such a significant carbon pool. These forest resources are in a state of
decline.
2. Following the FAO (2006) definition of a forest which includes woodlands,
plantations, bamboo forests and scrublands, Ethiopia has a total forest cover of
61.62 million ha (53.8%). Nevertheless, there is ambiguity on the definition of
forests which is reflected on forest statistics by various sources. Forests not only
refer to high forests, which is the case in most communications, but they also
include the aforementioned vegetation types. National experts, research
institutions and development actors should have a common understanding of this
definition. The Ethiopian Forestry professionals should come up with
standardized definition on forests considering the current developments such as
carbon forestry, rather than timber ptroduction.
3. The forest resources of Ethiopia store an estimated 2.76 billion tons of carbon,
playing a significant role in the global carbon balance. The largest store of carbon
in the country is found in the woodlands (46%) and the shrub lands (34%), while
the high forests store about 16%. REDD negotiations and other carbon related
policies and projects should not neglect the woodland and shrub land resources.
Likewise, trees outside forests are often overlooked.

33
4. There is discrepancy among deforestation estimates made by several studies
owing to differences in the methods and tools applied, forest definition used,
period of assessment and the forest types considered. A comprehensive
assessment on forest resources in the country is so far made by WBISPP, which
estimated an approximate annual rate of 2%. However, information on the
degree of degradation in forest resources is still a gap.
5. Data on forest growth stocks and increments in Ethiopia (except plantations) is
aggregated without due considerations for the variations within the broad
vegetation types (e.g., the nine vegetation types) mostly leading to
underestimated values.
6. The plantation forests in the country, except a few cases, are not properly
managed (no timely silvicultural operation and harvesting) with a significant
negative consequence on economic returns. In order to fill the gap between
demand and supply of wood, and reducing pressure on the remaining natural
forest resources, expansion of plantation forests should be taken as an important
strategy. The expansion can not only be shouldered by the government, but the
private sector and public institutions such as education institutions and military
barracks should also be encouraged to develop their own forests.
7. However, in order to support plantation expansion, responsible bodies at the
federal and regional levels need to identify suitable land. Additionally, although
some forest management tools (yield tables, growth models, etc) and plantation
technologies (e.g., seed) have been developed on certain sites and plantation
species, knowledge gaps on most species still remains a challenge, and research
institutions need to address these gaps.
8. The prospect for Ethiopia in regard to access to carbon finances is high given the
large area potentially eligible for CDM and the large forest resources of the
country. However, limitations in institutional capacity, policy gaps, competing
interests and weak implementation of polices, and absence of defined benefit
sharing mechanisms may hinder the implementation of carbon projects.
9. The status quo forest management (little investment in applying proper
management, limited plantation development, deforestation and degradation of
existing forest resources) will cost the country economically, ecologically and
socially. Alternative management scenario is necessary. In light of the national
and global diverse interests on forest resources (wood products, climate change

34
mitigation, watershed protection, biodiversity conservation etc), future forest
management in Ethiopia need to adopt the principle of multiple objectives
management. Incorporating carbon as a component of multiple objectives
management alters the economics of forest enterprises (up to 30% increase in
revenue), and thus acts as a catalyst to create an economic incentive for forest
plantation development.
10. To overcome some of the abovementioned discrepancies forest resource
assessment statistics in general and in forest carbon accounting in particular,
there is a need for developing standard manual‐protocol for Ethiopia.
7.2 Recommendations
1. Cognizant of the importance of global forest resources in climate change
mitigation and also in some cases their role in adaptation, there must be
international commitment to take adequate action on protection of the remaining
forest resources.
2. Ethiopia needs to have a mandated forestry institution that, among other things,:
Clarifies on the definition of forests and forest classification in the
country in agreement with relevant experts.
Verifies forest statistics and reports in local, national and international
communications.
Caries out periodic inventory of forest resources
Identifies suitable technologies and land for plantation development,
and supports private and public sectors
3. Development and research agents need to give due attention to woodlands and
shrub lands in the same status as high forests of the country. Additionally, REDD
negotiations and other carbon related policies and projects should consider these
resources as well as trees outside forests.
4. The country should have responsible, accountable and strong institutions at all
levels equipped with sufficient skilled manpower, budget and physical resources
for realizing optimal access to climate finances and implementing multiple
objectives forest management. Historical instability of the Forestry Sector in
Ethiopia and its consequences, justifications for upgrading the status of the
Forestry Sector in Ethiopia in light of the emerging issues, experiences in other

35
countries and proposed management structure has been detailed in a separate
document prepared by the Forestry Research Center at the Ethiopian Institute of
Agricultural Research. This document provides a framework for further
discussions which eventually lead to the establishment of the envisaged national
forestry institution.
5. The country should have a standard forest resources and carbon assessment
manual or protocol and reporting formats that is officially adopted and strictly
followed by users.
6. An up‐to‐date inventory on forest growth and carbon monitoring should be
conducted periodically based on systematically located geo‐referenced sample
plots located in the nine vegetation types and other land cover types.

36
8 REEFERENCES
Abayneh Derero (2004) Prospects of forest genetic resources conservation and tree seed
provision in Ethiopia. In: Girma Balcha, Kumlachew Yeshitila, and Taye Bekele (eds)
Proceedings of a National Conference on Forest Resources: Status, challenges and
opportunities, 27‐29 November 2002, Addis Ababa.
Brown S (1997) Estimating Biomass and Biomass Change of Tropical Forests: A Primer. FAO
Forestry Paper 134. FAO, Rome.
Chaffey DR (1982) Southwest Ethiopia: A reconnaissance inventory of forest in Southwest
Ethiopia. Land Resources Center, Tolworth Tower, Surbiton Surrey, England, KT67DY.
CSE (1997) (Conservation Strategy of Ethiopia). The Conservation Strategy of Ethiopia, The
Resources Base: Its Utilisation and Planning for Sustainability. Addis Ababa, Ethiopia.
Desalegn G, K Gemechu, W Fekadu, Y Tadesse (2005) Some physical properties of Juniperus
procera and Eucalyptus deglupta sawn timbers. Ethiopian Journal of Natural Resources
7(2): 219‐237.
Dossa EL, ECM Fernandes, WS Reid and K Ezui (2008) Above‐ and belowground biomass,
nutrient and carbon stocks contrasting an open‐grown and a shaded coffee plantation.
Agroforestry Systems 72:103–115
EFAP (1994) Ethiopian Forestry Action Program: The challenge for development. Final Report,
Volume II, Ministry of Natural Resources Development and Environmental Projection,
Addis Ababa.
ENEC/CESEN (1986) Main Report (plus 13 technical reports and 26 supplementary reports).
Evans J (1992) Tropical forestry in the tropics. Second edition, Claredon Press, Oxford, pp. 403.
FAO (2010) Global Forest Resources Assessment 2010 ‐ Country Report Ethiopia. Food and
Agriculture Organisation (FAO), Rome, Italy (www. fao.org/forestry/ fra/fra2010/en/,
accessed date September 15, 2010).
FAO (2006) Global Forest Resource Assessment 2005: Progress towards Sustainable Forest
Management. Food and Agriculture Organization of the United Nations (FAO), Rome.
FAO (2006) Choosing a forest definition for the Clean Development Mechanism: Forest and
Climate Change Working Paper 4, Rome, Italy (http//: www. fao.org/forestry/11280‐1‐
0.pdf, accessed date October 7 2010).
FAO (2001) Trees outside forests: Towards rural and urban integrated resources management.
Rome, Italy (Internet: ftp://ftp.fao.org/ docrep/fao/005/y1785e00.pdf).
37
F. von Breitenbach (1962) National forestry development planning: a feasibility and priority
study on the example of Ethiopia. Forestry Review 3(4): 41‐68.
Gibbs HK, S Brown, JO Niles and JA Foley (2007) Monitoring and estimating forest carbon
stocks: Making REDD a reality. Environmental Resource Letters 2: 1‐13.
Gibbs H K and Brown S (2007a) Geographical distribution of woody biomass carbon stocks in
tropical Africa: an updated database for 2000. Available at
Houghton R A (1999) The annual net flux of carbon to the atmosphere from changes in land use
1850–1990 Tellus B 51 298–13
IBC (2005) National Biodiversity strategy and action plan. Institute of Biodiversity
Conservation, Addis Ababa.
IPCC (2007) Climate Change 2007: The Physical Science Basis. Contribution of Working Group I
to the Fourth Assessment Report of the Intergovernmental Panel on Climate Change
[Solomon S, D Qin, Manning, Z Chen, M Marquis, KBM Tignor and HL Miller (eds.)].
Cambridge University Press, Cambridge, United Kingdom and New York, NY, USA,
996pp.
IPCC (2006) Guidelines for national greenhouse gas inventories. Institute for Global JICA (1998) The forest resources management study in the south‐western part of Ethiopia,
Volume 1, Main Report: Japan Forest Civil Engineering consultants foundation, Kokusai
Kogyo Co. Ltd.
Lundgren B (1978) Soil conditions and nutrient cycling under natural forest and plantation
forests in Tanzanian highlands. Reports in Forest Ecology and Forest Soils No. 31,
Department of Forest Soils, Swedish University of Agricultural Science, Uppsala
LUPRD‐MOA/FAO (1985) Assistance to land use planning project. Phase I, Addis Ababa.
LUSO‐Consult. (1997) Study on Sustainable Bamboo Management. 2nd Interim Report,
Hamburg.
Negash Mamo (2007) Growth and yield estimation of stand of Cupressus lucitanica. Technical
Manual 17, FRC/EIAR, Addis Ababa.
Negash Mamo and H Sterba (2006) Site index functions of Cupressus lucitanica in Munesa
Shashemene, Ethiopia. Forest Ecology and Management 237:429‐435.
Pohjonen V and T Pukkala (1990) Eucalyptus globulus in Ethiopian forestry. Forest Ecology and
Management 36: 19‐31.
Pukkala T and V Pohjonen (1993) Yield of Cupressus lucitanica in Ethiopia. East African
Agriculture an Forestry Journal 59(1): 57‐73.

38
Pukkala T and V Pohjonen (1989) Forest inventory and management planning on fuelwood
plantations of Ethiopia. Silva Cultura No. 13: 1‐120.
Sebsebe Demisew (1996). Ethiopia’s Natural Resource Base, pp. 36–53. In: Solomon Tilahun,
SueEdwards and Tewolde Berhan Gebre Egziabher (eds) Important Bird Areas of
Ethiopia. Ethiopian Wildlife and Natural History Society, Semayata Press, Addis Ababa,
Ethiopia.
SIDA (1990) Forest products pricing and marketing study. The State Forest Conservation and
Development Department and the Orgut‐Swedforest Consortium, Technical Report, Vol.
I & II.
Sisay Nune (2010) Land Use, Land Use Change and Forestry (LULUCF): Afforestation and
Reforestation. In: Clean Development Mechanisms: Investors' Guide, DNA Office of the
Environmental Protection Authority, EPA (Draft
Sisay Nune, Menale Kassie and Eric Mungatana (2009) Forestry Resource Accounting: The
Experience of Ethiopia. In: Proceedings of the National Workshop on Sustainable Land
Management and Poverty Alleviation. May 18‐19, 2009, Addis Ababa, Ethiopia.
Stern N (2006) The Economics of Climate Change: The Stern Review. Cambridge University
Press, Cambridge, UK.
Temam A (2010) Impact of disturbance on carbon stocks in Harana Bulluk natural forests,
Balöe Zone, southest Ethiopia. MSc thesis, Hawassa University, Wondo Genet College of
Forestry and Natural Resources, Wondo Genet.
Tesfaye Teshome and JA Petty (2000) Site index equations for Cupressus lucitanica stands in
Munessa forest. Forest Ecology and Management 126:339‐347.
TGoE (1994) Ethiopian Forestry Action Plan: Final Report, EFAP Secretariat, Addis Ababa.
Tsegaye Tadesse (2010) Bale Eco‐region Sustainable Management Programme.
http://www.pfmpfarmsos.org/Publication.html.
UNDP/World Bank (1996) Ethiopia: Energy Assessment, Report No. 179/96. Washington DC.
WBISPP (2005) A national strategy plan for the biomass sector. Addis Ababa, Ethiopia.
WBISPP (2004) Forest Resources of Ethiopia. Addis Ababa, Ethiopia.
Woldetsadik W, Kebede K (2000) Coffee production systems in Ethiopia. In: Proceedings of the
workshop on control of coffee berry disease (CBD) in Ethiopia held in Addis Ababa, 13–
15 August 1999. Ethiopian Agricultural Research Organization, Addis Ababa, pp 99‐106.
Zerihun Woldu (2000) Forests in the vegetation types of Ethiopia and their status in the geographical context, pp. 1–48. In: Sue Edwards, Abebe Demissie, Taye Bekele &
Gunther Haase (eds) Forest genetic resources conservation: principles, strategies and

39
actions. Proceedings of the National Forest Genetic Resources Conservation Strategy
Development Workshop, June 21‐22, 1999. Addis Ababa, Ethiopia.

40
9 ANNEXES
9.1 ANNEX 1: GLOBAL FOREST SECTOR AND CLIMATE CHANGE
Climate change: causes, consequences, definitions of terms and concepts
Climate change is a change in the statistical distribution of weather over periods of
time. There is no doubt that our climate is changing. This will pose huge challenges to
nations, organizations, enterprises, cities, communities and individuals. Developing
countries will suffer most from adverse consequences of climate change, and the highly
vulnerable regions and people are already being affected.
Today, human beings have become a component in the earth’s system, driving and
accelerating global warming through the rapid release of greenhouse gases (GHGs) into
the atmosphere. Human beings alter the composition of the atmosphere through
increasing the concentration of greenhouse gases (GHGs) in the atmosphere by fossil
fuel burning which represents about two‐third of the global emissions and by
deforestation and land use changes representing about one‐third. These are
anthropogenic causes of climate change.
Other forcing factors also exist that are beyond human kind’s influence such as
variations in solar radiation and volcanic activities, and fluctuations in the earth’s axis
and its orbit around the sun (natural causes). These are exogenous factors, partly
responsible for the changes which have occurred between ice ages and the interglacial
periods. They take place over a larger time frame (tens of thousands of years), and must
be clearly differentiated from climate change that is induced by human beings. The latter
can be prevented by taking adequate action. At the international level, knowledge of the
consequences of human kind’s behaviour on our climate system‐ presented for example
in the latest IPCC assessment reports, is well founded and is adequate for policy makers.
Greenhouse effect: the earth’s climate system is determined by many factors, processes
and interactions at a global scale. One important phenomenon in the earth’s atmosphere
is the well known greenhouse effect. The greenhouse effect is a natural phenomenon
that warms the planet to a temperature that allows the existence of all living beings. This
natural effect is responsible for the comfortable living conditions on earth with a mean

41
global temperature of 15 °C. Without an atmosphere, the mean temperature would be
approximately 30 °C lower. However, that warming effect is increasing rapidly today –
putting life at risk. Human activities such as the burning of fossil fuels result in the
emissions of several GHGs, principally carbon dioxide (CO2), methane (CH4), and nitrous
oxide (N2O).
The table below presents the type of GHGs, and their warming power. The contribution
of each of these gases to global warming in the next century based on the estimates of
emissions of each is 63% by CO2, 24% by CH4, 10% by N2O, and 3% by other GHGs
(Hadley Centre, 2005). The principal gas, CO2, will be responsible for almost two‐thirds
of the expected future global warming. For the scientific community and policy makers
there are two main alternatives to try to improve this situation: (1) reduce the
emissions of greenhouse gases into the atmosphere; and (2) remove these gases from
the atmosphere once they are in place. The term ‘carbon sequestration’ is the most
commonly used term to talk about the removal of greenhouse gases from the
atmosphere.
Greenhouse gases (GHGs) and their warming power
PARAMETERS CO2 CH4 N20 O3 CFCS
Concentration
(1993)
362 μl l ‐1 1,75 μl l ‐1 313 nl l‐1 20 nl l‐1 0.6 nl l‐1
Concentration
(1765)
280 μl l ‐1 0.8 μl l ‐1 288 nl l‐1 15 nl l‐1 ‐‐‐‐‐‐‐
Current % yearly
increase
0.45 0.95 0.25 0.5 5
Life time (years) 100 10 150 0.1 100
Warming
potential per
molecule
1x 21x 310x 2000x 15 500x
Current
contribution to
global warming
63 24 10 ‐ ‐

42
The two strategies necessary to reduce the risks of climate change are adaptation and
mitigation.
Adaptation: the latest IPCC assessment report gives the following definition:
‘Adjustment in natural or human systems in response to actual or expected climatic
stimuli o their effects, which moderates harm or exploits beneficial opportunities’ (IPCC
2007b, WG II, p. 869).
Mitigation: The definition of mitigation is simple: ‘It is just the reduction of greenhouse
gases’. In mitigation, the primary purpose is to avoid the unmanageable – the causes of
climate change are removed by reducing GHG emissions. Whereas in adaptation, the
effects of climate change are dealt with by coping with their negative impacts: it is about
managing the unavoidable. The two strategies are interlinked: the more successful the
mitigation is, the less adaptation is required.
Political leaders around the world negotiate on the level of GHG emissions that can be
allowed without affecting the integrity of the earth. There is increasing agreement that if
temperatures rise by no more than 2 °C the earth’s integrity can be preserved and many
of the potentially grave consequences of climate change could be avoided. This threshold
is associated with per capita emissions of approximately 2 tons of CO2 equivalents each
year. Developed countries, which currently have per capita emissions of about 16 tons
per year, need to sharply reduce their missions (Kropp and Scholze, 2009).
Most important climate change related stimuli are:
Increased temperature (including seasonal changes), more intensive and frequent
storms, sea level rise, more heat waves, more cold spells, more droughts, more flooding
and more extreme floods, more extreme rain (including seasonal changes, change in
annual and seasonal water availability, accelerated melting of glaciers, and melting of
permafrost.
Global carbon cycle

43
The big picture
During geological history, the emergence of plants on earth has led to the conversion of
carbon‐dioxide (CO2) that was in the atmosphere and oceans, into innumerable
inorganic and organic compounds on land and in the sea. Natural exchange of carbon (C)
compounds between the atmosphere, the oceans and terrestrial ecosystems is now
being modified by human activities that release CO2 from fossilized organic compounds
(‘fossil fuel’) and through land use changes. The earth is returned to a less vegetated
stage of its history, with more CO2 in its atmosphere and a stronger greenhouse gas
effect trapping solar energy.
The figure below shows the global C cycle between C‐stocks and flows in the reservoirs
and in the atmosphere. By far the greatest proportion of the planet’s C is in the oceans;
they contain 39000 Gt out of the 48000 Gt of C shown (1 Giga ton (Gt) = 109 t = 1015 g).
The next largest stock, fossil C, accounts for only 6000 Gt. Furthermore, the terrestrial C
stocks in all the forests, trees and soils of the world amount to only 2500 Gt, whilst the
atmosphere contains only 800 Gt.
The use of fossil fuels (and cement) releases 6.3 Gt C yr‐1, of which 2.3 Gt C yr‐1 is
absorbed by the oceans, 0.7 Gt C yr‐1 by terrestrial ecosystems, and the remaining 3.3 Gt
C yr‐1 is added to the atmospheric pool. Fossil organic C is being used up much faster
than it is being formed, as only 0.2 Gt C yr‐1 of organic C sediments into seas and oceans,
as step towards fossilization. The net uptake by the oceans is small relative to the annual
exchange between atmosphere and oceans: oceans at low latitudes (in the tropics)
generally release CO2 into the atmosphere, while at high latitudes (temperate zone and
around polar circles) absorption is higher than release. Similarly, the net uptake by
terrestrial ecosystems of 0.7 Gt C yr‐1 is small relative to the flux: about 60 Gt C yr‐1 is
taken up by vegetation, but almost the same amount is released by respiration and fire.

44
The global C‐cycle showing C‐stocks in reservoirs (in Gt = 109 ton) and C‐flows in Gt yr‐1)
relevant to anthropogenic disturbance, as annual averages over the decade from 1989‐
1998 (Shimel et al., 1996)
Special roles of forest in global carbon cycle
Forests play an important role in the global carbon balance. As both carbon sources and
sinks, they have the potential to form an important component in efforts to combat
global climate change. FAO (2010) estimated that the world’s forests store 289 Gt of
carbon in their biomass alone (http://www.fao.org/forestry/fra/en/). While
sustainable management, planting and rehabilitation of forests can conserve or increase
forest carbon stocks, deforestation, degradation and poor forest management reduce
them. For the world as a whole, carbon stocks in forest biomass decreased by an
estimated 0.5 Gt annually during the period 2005–2010, mainly because of a reduction
in the global forest area.
The vegetation of tropical forest is a large and globally significant storage of C, because
tropical forest contains more C per unit area than any other land cover. About two‐third
of the global terrestrial C, exclusive of that sequestered in rocks and sediments, is

45
sequestered in forest ecosystems (Sedjo, 2006). The main carbon pools in tropical forest
ecosystems are the living biomass of trees and understorey vegetation and the dead
mass of litter, woody debris and soil organic matter. About 50% of plant biomass
consists of C. The carbon stored in the aboveground living biomass of trees is typically
the largest pool and the most directly impacted by deforestation and degradation.
The recent IPCC report estimated that the global forestry sector represents over 50% of
global greenhouse mitigation potential. On the other hand, the forest sector can also be a
source of greenhouse gases. Consequently, global climate change policy focuses on the
forest sector, and holds a key position in international climate treaties.
Deforestation and forest degradation represents about 17% of the global GHG emissions.
Cutting down trees in the forest releases carbon to the atmosphere. Although selective
logging may only remove a few big trees per ha (and damage surrounding ones), it can
lead to a substantial decrease in total biomass and carbon stock. When forests (250 tons
carbon ha‐1) are transformed into agriculture, the subsequent land use systems
implemented determine the amount of potential carbon restocking that takes place.
Annual crop systems will on average contain only 3 tons C ha‐1, intensive tree crop
plantations 30‐60 tons carbon ha‐1, which is 1 and 10‐25% of the forest biomass and
carbon stock. The annual C sequestration rate (increment of standing stock) may be the
same for these three of vegetation types (annual crop, tree plantation and forest) about
3 tons carbon ha‐1 yr‐1, but the mean residence time differs from 1, 10 to 83 years.
Changes in carbon stock between vegetation and land use types relate primarily to this
‘mean residence time’.
International climate agreements and climate finances
UNFCCC, Kyoto Protocol
A total of 192 countries of the world have joined an international treaty ‐ the United
Nations Framework Convention on Climate Change (UNFCCC) ‐ to begin to consider
what can be done to reduce global warming and to cope with whatever temperature
increases are inevitable. Most, but not all, nations have also approved an addition to the
treaty: the Kyoto Protocol, which entered into force on 16 February 2005 and which has
more powerful (and legally binding) measures, focused on the ‘first commitment period’
of 2008‐2012.

46
The Convention places the heaviest burden for fighting climate change on industrialized
nations, since they are the source of most past and current greenhouse gas emissions.
For the most part, these developed nations, called "Annex I" countries (because they are
listed in the first annex to the treaty) belong to the Organization for Economic
Cooperation and Development (OECD). These advanced nations, as well as 12
"economies in transition" (countries in Central and Eastern Europe, including some
states formerly belonging to the Soviet Union) were expected by the year 2000 to reduce
emissions to 1990 levels.
Industrialized nations agreed under the Convention to support climate‐change activities
in developing countries by providing financial support above and beyond any financial
assistance they already provide to these countries. Because economic development is
vital for the world's poorer countries ‐ and because such progress is difficult to achieve
even without the complications added by climate change ‐ the Convention accepts that
the share of greenhouse gas emissions produced by developing nations will grow in the
coming years. It nonetheless seeks to help such countries limit emissions in ways that
will not hinder their economic progress. The Convention acknowledges the vulnerability
of developing countries to climate change and calls for special efforts to ease the
consequences. Developing countries have an obligation to report their emissions and C
stocks to assist in the global book keeping of emissions and drivers of climate change.
Developing countries that want to participate in other mechanisms of the Convention
will need to provide such data, as part of global transparency.
To achieve required carbon reduction, carbon emissions are commoditized under a
number of flexible mechanisms. The Kyoto protocol introduces three market‐based
mechanisms to allow Annex I countries to reduce emissions beyond their national
boundaries yet include reductions in their national level target. The three mechanisms
are: The International Emissions Trading, The Joint Implementation and the Clean
Development Mechanism (CDM). International Emissions Trading (Article 17) allows
Annex I countries to trade part of their assigned cap. Joint Implementation (Article 6)
functions at sub‐national level so that project activities can be sponsored and
implemented in Annex I Party to meet reduction requirements in a second Party. The

47
Clean Development Mechanism (Article 12) allows the sponsorship and implementation
of project activities in non‐Annex I Parties.
The forest C sinks were included in the Kyoto Protocol as a mechanism to mitigate global
climate change. According to the Protocol, the net sink of C arising from land use
changes and forestry over the period of 2008‐2012 can be credited and may substitute
the reduction of GHG emissions and to fulfil the reporting requirements of international
agreements of Annex I countries. Consequently, there has been a proliferation of
climate‐related financial mechanisms in the last few years.
Within the existing instruments of climate (and carbon) finance, the Clean Development
Mechanism (CDM) and the Reduced Emissions from Deforestation in Developing
Countries (REDD) are usually linked with efforts to mitigate the impacts of climate
change. By creating a market for emission reductions, in effect paying people and
business to reduce greenhouse gas emissions, they argue that the carbon market
provides a financial incentive to invest in clean energy projects, in energy efficiency, in
fuel‐switching, in waste management and in forestry. The carbon market is estimated to
be worth about $64 billion according to the World Bank.
The CDM was introduced for industrialized countries to achieve their emission
reduction targets in a cost effective manner while contributing to sustainable
development in developing countries (UNEP, 2002). However, CDM investments have
been rather skewed with hardly any investments in the least developed countries
(LCDs), particularly in Africa (Capoor and Ambrosi, 2006). The World Bank has
attempted to improve the distribution of carbon investments in Africa through its
Community Development Carbon Fund and BioCarbon Fund. However, all these
investments in Africa still comprise less than 10% of the US$629 million worth of global
carbon portfolio managed by the World Bank’s carbon finance unit. There is thus a need
for other multilateral donors to push for more carbon investments in African countries.
An encouraging start in this regard is the creation of international funds that focus on
carbon projects in poor countries. Examples include the International Union for
Conservation of Nature (IUCN) Climate Fund and the Finnish CDM Program that are
mandated to support carbon projects in Africa (UNEP and IETA, 2005). The UNDP’s

48
Millennium Development Goals Carbon initiative also seeks to redress this imbalance.
Ethiopia will benefit from such initiatives.
The Bali RoadmapRE(D)i+j
At the 13th Conference of Parties in Bali in December 2007 a “Bali Road Map’ was agreed
upon which includes efforts to include a new mechanism for Reducing Emissions from
Deforestation and (forest) Degradation (REDD) in the agreements that are to define the
successor of the Kyoto protocol, culminating in the 15th COP in Copenhagen, December
2009.
Earning carbon credits through avoided deforestation (REDD) could be particularly
relevant for Africa, where many countries have very high deforestation rates. These high
deforestation rates are often accompanied by rapid loss of species, reduction in land
productivity and other adverse environmental impacts. Many African countries,
however, lack adequate financial or technical means to conserve their forests. Carbon
investments for emission reduction through avoided deforestation could therefore
provide direct economic incentives for these countries to take up conservation. FAO
(2007) estimates that the total carbon mitigation from avoided deforestation in Africa
from 2003–2012 could be 615.8 million tons CO2. A sale of even a small proportion of
these carbon offsets to international investors will provide significant economic returns
to local communities and to host governments in Africa to invest in forest conservation.
9.2 ANNEX 2: VALUES OF FOREST CARBON IN THE INTERNATIONAL MARKET AND COSTS OF CARBON FORESTRY
On the world market, carbon is currently valued at between $10 and $20 per ton. The
forest management costs (that is, overheads incurred by the Forest Department) vary
according to management activity but range from $1 per ha to $100, so at the lower end
of the scale the management activities could in fact be financed entirely out of the
carbon income. This does not however take into account the transaction costs (which
include development of a CDM project proposal, creating the baseline, making the
necessary carbon measurements of changes in vegetation on a periodic basis, reporting
on these, etc). If such activities are carried out by experts there is likely to be little
margin of gain to the communities themselves. As Landell‐ Mills and Porras (1999) have
pointed out, it is the transaction costs that are likely to be the key factor in determining
whether or not such forest management is financially feasible.

49
Unfortunately transaction costs for small projects which involve community groups
under community based forest management (CBFM) are thought to be relatively higher
than for industrial plantations which are more uniform in nature and under one owner,
as well as having the advantage of economies of scale (Smith and Scherr, 2002). Chomitz
concludes that the cost per ton of measuring carbon stored in biomass will be
approximately inversely proportional to the size of the carbon sink (this follows from
standard statistical theory). The cost for small, heterogeneous forest management
projects could be exorbitant if done by fieldwork, especially if high levels of accuracy
(e.g. 5% rather than 10% as in the case described above) are demanded. He suggests
therefore that such projects might have to rely on standardized, benchmarked (so‐called
‘default’) values (Chomitz, 2002).
9.3 ANNEX 3: CDM AND REDD ACTIVITIES IN ETHIOPIA
CDM supported reforestation projects in Ethiopia There is one project registered under the Clean Development Mechanism (CDM) located
in the Humbo area (UNFCCC registration Dec 2009, area of 2 728 ha); and there are
three further projects, in the Abote, Ada Berga, and Sodo areas, that are mentioned as
potential CDM projects (currently not registered at UNFCCC). An additional CDM project,
covering an area 20,000 ha earmarked for afforestation/ reforestation in the Amhara
National Regional State is under discussion.
These CDM projects are a key source of information when developing and implementing
other CDM and REDD+ pilots. Experiences from the CDM projects on developing and
innovating mechanisms for payment of environmental services, including benefit
sharing mechanisms for community groups and MRV systems, contain valuable lessons.
There is often criticism regarding the CDM projects. It included questions about the cost
effectiveness of the projects, about challenges in cash flow systems, and about the
complexity of the MRV systems. However, according to World Bank REDD+ consultants,
these are the first projects in a new area of work, and so high initial costs are to be
expected.
REDD+ Pilot Projects in Ethiopia REDD+ pilots are in preparatory stages in Ethiopia, and they exist in the Bale ecoregion
(500,000 ha) (which is expected to generate over 320 million USD during the contract

50
period of 21 years), in the The Yayu and Gedo forests (190,000 ha), and in the Baro‐
Akobo area (7,610,300 ha), as well as in the south west of the country (Tsegaye Tadesse,
2010). These pilots are generally designed to feed into both PFM programmes and
protected area programs that are developing PFM buffer zones. They are pioneering the
development of REDD+ implementation in the country (developing carbon accounting,
benefit sharing mechanisms), and will be essential sources of information for up‐scaling
of REDD+ projects in the country.
9.4 ANNEX 4: GLOSSARY Aboveground biomass The AGB carbon pool consists of all living vegetation above the soil, inclusive of stems, stumps, branches, bark, seeds and foliage. Basal area Basal are of a tree is the cross‐sectional area of a tree at breast height. Belowground biomass The BGB carbon pool consists of the biomass contained within live roots. In some text books, the below‐ground biomass comprises living and dead roots, soil fauna, and the microbial community. Biomass Biomass is a quantity of living matter in a given ecosystem expressed in terms of its mass. Alternative definition: The total mass of living organisms including plants and animals for a given area usually expressed as dry weight in g m‐2 or kg ha‐1. Broadly, forest biomass is organic matter expressed as oven‐dry tons per unit area: it can be referred to as biomass density when expressed as mass per unit area. Approximately 50% of dry forest biomass is carbon. Carbon dioxide equivalent A measure used to compare different greenhouse gases based on their contribution to radiative forcing. The UNFCCC currently (2005) uses global warming potentials (GWPs) as factors to calculate carbon dioxide equivalent. Carbon pool Carbon pools are major components of an ecosystem that can either accumulate or release carbon. Carbon stocks Total carbon stored (absolute quantity) in terrestrial ecosystems at specific time, as living or dead plant biomass (above and below‐ground) and in the soil, along with usually negligible quantities as animal biomass. The unit is Mg ha‐1. The value expressed in terms of unit area is known as carbon density, which is used to compare the potential of different land uses for carbon storage. Aboveground plant biomass comprises all

51
woody stems, branches, and leaves of living trees, creepers, climbers, and epiphytes as well as understorey plants and herbaceous growth.
Carbon stock accounting Stock accounting assesses the magnitude of carbon stored in forest ecosystems at a single point in time. Breast height diameter (DBH) It is the thickness of the stem at 1.3 m above the ground level. Emissions The release of greenhouse gases and/or their precursors into the atmosphere over a specified area and period of time. Emission reductions accounting Emission reductions accounting assesses the decrease in emissions from project or policy activities, often so that they can be traded. Emissions accounting Emissions accounting assesses the net greenhouse gas emissions to the atmosphere resulting from forests. Forest According to the IPCC forest is a minimum land area of 0.05‐1 hectare with tree crown cover more than 10‐30% and tree height of 2‐5m at maturity. Global Warming Potential (GWP) Used to enable the comparison of the six common GHG, it is the cumulative radiative forcing effects of a unit mass of gas over a specified time horizon relative to CO2. It is expressed in terms of carbon dioxide equivalents (CO2e). Of relevance to forest carbon accounting: GWPCO2 = 1, GWPCH4 = 21, GWPN2O = 310. Greenhouse Gas (GHG) There are six recognised major greenhouse gases; CO2 (carbon dioxide), CH4 (methane), HFCs (hydrofluorocarbons), PFCs (perfluorocarbons), N20 (nitrous oxide) and SF6 (sulphur hexafluoride). Carbon accounting often refers to the accounting of all major GHGs using a carbon dioxide equivalent (CO2e) that standardises these gases based on their global warming potential. Sequestration The process of increasing the content of a carbon pool other than the atmosphere. Shrubland Land supporting a stand of trees, usually not exceeding 6 m in height , with a canopy cover greater than 20 per cent. The ground cover is often poor as fire is very frequent, and there may exist scattered and rare trees. Sink

52
Any process, activity or mechanism which removes a greenhouse gas, an aerosol, or a precursor of a greenhouse gas from the atmosphere. Or a carbon sink is a carbon pool from which more carbon flows in than out: forests can act as sink through the process of tree growth and resultant biological carbon sequestration Notation in the final stages of reporting is the negative (‐) sign. Site index Site index is a site quality indicator that uses dominant height of a stand at a certain age. Source Any process or activity which releases a greenhouse gas, an aerosol or a precursor of a greenhouse gas into the atmosphere. Or a carbon source is a carbon pool from which more carbon flows out than flows in: forests can often represent a net source of carbon due to the processes of decay, combustion and respiration Notation in the final stages of reporting is the positive (+) sign. Stocking A qualitative expression of the adequacy of woody plant cover on an area in terms of crown closure, number of woody plants, basal area or volume in relation to a pre‐established norm. Stock table A summary table showing the volume of woody plants per unit area by species and diameter classes, for a stand, a forest type or land cover type. Volume equation It is a statistically derived expression of the relationship between volume and other woody plant or stand variables. It is used to estimate volume from easily measured variables such as diameter at breast height, woody plant or stand height and crown closure. Weight (Biomass) table A summary table showing the weight of woody plants per unit area by species and diameter classes, for a stand, a forest type ort land cover type. Woodland Lands dominated by trees, which are heavily branched and have a height of up to 20 m. The flat crowns do not form a closed canopy, but cover more than 20 per cent of the ground and are leafless during some parts of the year. The ground is covered with grasses, herbs and shrubs. Yield table A summary table showing characteristics at different ages or development stages for stands or land cover types of one or more species on sites of differing qualities. It shows the development of the most important stand characteristics, such as dominant height, average diameter, stocking, volume or weight (mass) per ha, and removal. It is the simplest tool for predicting the future development of a stand. Because site, tree species, rotation (seedling or coppice), thinnings, fertilization and other treatments affect growth and stand characteristics, there should be a separate yield table for each site class, species, rotation and for each treatment regime.
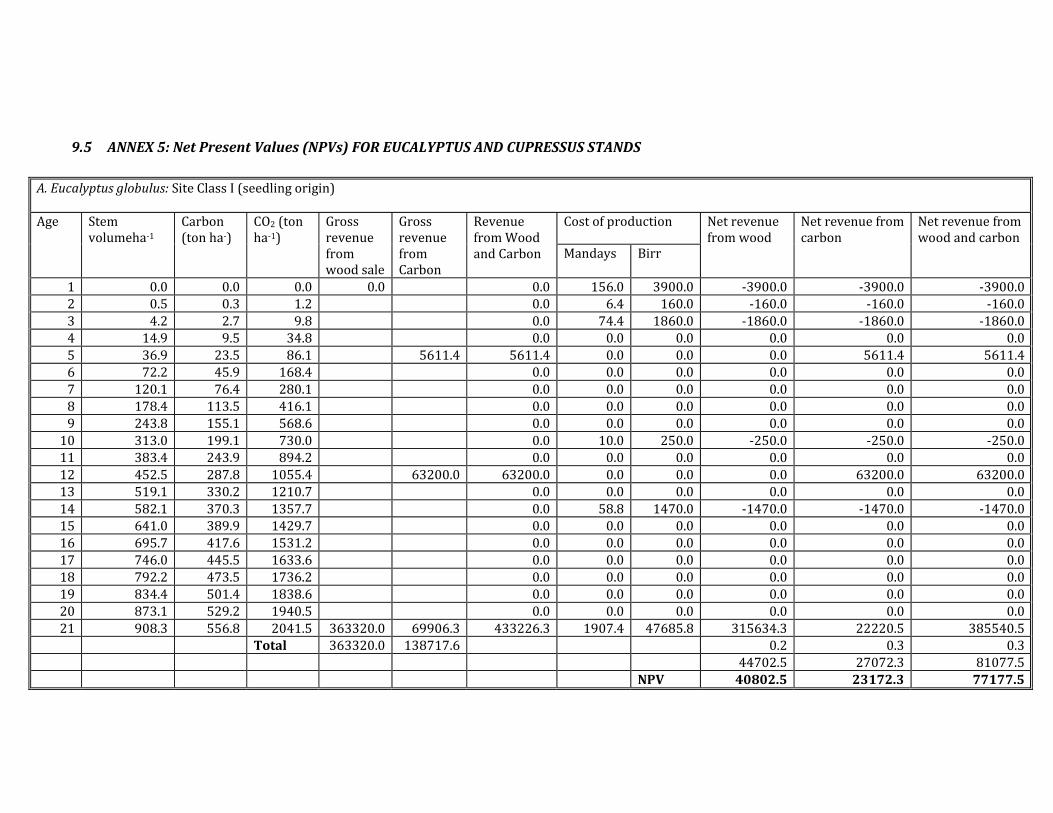
9.5 ANNEX 5: Net Present Values (NPVs) FOR EUCALYPTUS AND CUPRESSUS STANDS
A. Eucalyptus globulus: Site Class I (seedling origin) Age Stem
volumeha‐1 Carbon (ton ha‐)
CO2 (ton ha‐1)
Gross revenue from wood sale
Gross revenue from Carbon
Revenue from Wood and Carbon
Cost of production Net revenue from wood
Net revenue from carbon
Net revenue from wood and carbon
Mandays Birr
1 0.0 0.0 0.0 0.0 0.0 156.0 3900.0 ‐3900.0 ‐3900.0 ‐3900.0 2 0.5 0.3 1.2 0.0 6.4 160.0 ‐160.0 ‐160.0 ‐160.0 3 4.2 2.7 9.8 0.0 74.4 1860.0 ‐1860.0 ‐1860.0 ‐1860.0 4 14.9 9.5 34.8 0.0 0.0 0.0 0.0 0.0 0.0 5 36.9 23.5 86.1 5611.4 5611.4 0.0 0.0 0.0 5611.4 5611.4 6 72.2 45.9 168.4 0.0 0.0 0.0 0.0 0.0 0.0 7 120.1 76.4 280.1 0.0 0.0 0.0 0.0 0.0 0.0 8 178.4 113.5 416.1 0.0 0.0 0.0 0.0 0.0 0.0 9 243.8 155.1 568.6 0.0 0.0 0.0 0.0 0.0 0.0 10 313.0 199.1 730.0 0.0 10.0 250.0 ‐250.0 ‐250.0 ‐250.0 11 383.4 243.9 894.2 0.0 0.0 0.0 0.0 0.0 0.0 12 452.5 287.8 1055.4 63200.0 63200.0 0.0 0.0 0.0 63200.0 63200.0 13 519.1 330.2 1210.7 0.0 0.0 0.0 0.0 0.0 0.0 14 582.1 370.3 1357.7 0.0 58.8 1470.0 ‐1470.0 ‐1470.0 ‐1470.0 15 641.0 389.9 1429.7 0.0 0.0 0.0 0.0 0.0 0.0 16 695.7 417.6 1531.2 0.0 0.0 0.0 0.0 0.0 0.0 17 746.0 445.5 1633.6 0.0 0.0 0.0 0.0 0.0 0.0 18 792.2 473.5 1736.2 0.0 0.0 0.0 0.0 0.0 0.0 19 834.4 501.4 1838.6 0.0 0.0 0.0 0.0 0.0 0.0 20 873.1 529.2 1940.5 0.0 0.0 0.0 0.0 0.0 0.0 21 908.3 556.8 2041.5 363320.0 69906.3 433226.3 1907.4 47685.8 315634.3 22220.5 385540.5
Total 363320.0 138717.6 0.2 0.3 0.3 44702.5 27072.3 81077.5 NPV 40802.5 23172.3 77177.5

54
B. Cupressus lucitanica Site Index 23 Age Stem
volume (m3 ha‐1)
C (t) Thinning removal (m3 ha‐1)
CO2 ton( ha‐1)
Gross revenue from wood (Birr)
Gross revenue from carbon (Birr)
Forest operation costs
Net revenue from wood (Birr)
Net revenue from carbon (Birr)
Net revenue from wood and carbon (Birr)
Mandays Birr
7 132.1 58.2 213.3 333 8325 ‐8325 ‐8325 ‐8325.08 162.5 71.5 262.3 0 0 0 09 193.9 85.4 313.1 0 0 0 010 225.9 99.5 364.8 0 0 0 011 193.7 85.3 145.2 312.7 58097.3 20388.0 260 6500 51597.3 13888 65485.312 217.8 95.9 351.7 0 0 0 013 241.7 106.5 390.3 0 0 0 014 265.2 116.8 428.2 0 0 0 015 288.1 126.9 465.3 0 0 0 016 310.4 136.7 501.2 0 0 0 017 331.9 146.2 535.9 0 0 0 018 352.6 155.3 569.3 0 0 0 019 372.4 164.0 601.3 0 0 0 020 391.3 172.3 631.9 0 0 0 021 272.9 120.2 136.5 440.7 96884.8 28732.1 250 6250 90634.8 22482.1 113117.022 284.3 125.2 459.1 0 0 0 023 295.2 130.0 476.6 0 0 0 024 305.4 134.5 493.1 0 0 0 025 315.1 138.7 508.7 223689.1 33168.6 600 15000 208689 18168.6 226858.0
96643.2 18673.7 115317.0 NPV 88318.2 10348.7 106992.0