Ethiopia-Kenya - Electricity Highway - Appraisal Report · PDF fileOPGW : Optical ground wire...
36
Language: English Original: English AFRICAN DEVELOPMENT FUND PROJECT: ETHIOPIA-KENYA ELECTRICITY HIGHWAY COUNTRY: REGIONAL (ETHIOPIA AND KENYA) PROJECT APPRAISAL REPORT September 2012 Appraisal Team Team Leader T. BAH, Senior Power Engineer ONEC.2 3184 Team Members S. ASFAW, Principal Power Engineer ONEC.2 1538 F. KANONDA, Chief Energy Investment Officer ONEC.2 6948 D. LEKOETJE, Public Utilities Economist ONEC.2 2651 N. KULEMEKA, Chief Socioeconomist ONEC.3 2336 K. NTOAMPE, Principal Environmentalist ONEC.3 2707 D. MUTUKU, Principal Fin. Management Officer ORPF.2 6252 F. MVULA, Regional Procurement Coordinator ORPF.1 6249 B. ALUOCH, Principal Legal Counsel GECL.1 2404 S. ONEN, Principal Legal Counsel EARC 8239 Sector Manager E. NEGASH ONEC.2 3931 Sector Director H. CHEIKHROUHOU ONEC 2140 Regional Directors G. NEGATU K. MLAMBO EARC OREB 8232 2706 Peer Reviewers A. ALI, Principal Transport Engineer OITC.2 2625 M. KINANE, Senior Environmentalist ONEC.3 2933 N. PEDERSEN, Senior Energy and Trade Specialist ONRI.1 3882 N. NDOUNDO, Senior Power Engineer ONEC.1 2725 O. FALL, Senior Investment Officer OPSM.2 3820
Transcript of Ethiopia-Kenya - Electricity Highway - Appraisal Report · PDF fileOPGW : Optical ground wire...

Language: English Original: English
AFRICAN DEVELOPMENT FUND
PROJECT: ETHIOPIA-KENYA ELECTRICITY HIGHWAY
COUNTRY: REGIONAL (ETHIOPIA AND KENYA)
PROJECT APPRAISAL REPORT
September 2012
Appraisal
Team
Team Leader T. BAH, Senior Power Engineer ONEC.2 3184
Team Members
S. ASFAW, Principal Power Engineer ONEC.2 1538
F. KANONDA, Chief Energy Investment Officer ONEC.2 6948
D. LEKOETJE, Public Utilities Economist ONEC.2 2651
N. KULEMEKA, Chief Socioeconomist ONEC.3 2336
K. NTOAMPE, Principal Environmentalist ONEC.3 2707
D. MUTUKU, Principal Fin. Management Officer ORPF.2 6252
F. MVULA, Regional Procurement Coordinator ORPF.1 6249
B. ALUOCH, Principal Legal Counsel GECL.1 2404
S. ONEN, Principal Legal Counsel EARC 8239
Sector Manager E. NEGASH ONEC.2 3931
Sector Director H. CHEIKHROUHOU ONEC 2140
Regional
Directors
G. NEGATU
K. MLAMBO
EARC
OREB
8232
2706
Peer
Reviewers
A. ALI, Principal Transport Engineer OITC.2 2625
M. KINANE, Senior Environmentalist ONEC.3 2933
N. PEDERSEN, Senior Energy and Trade Specialist ONRI.1 3882
N. NDOUNDO, Senior Power Engineer ONEC.1 2725
O. FALL, Senior Investment Officer OPSM.2 3820

TABLE OF CONTENTS
1 STRATEGIC THRUST AND RATIONALE .................................................................... 1
1.1 Project Linkages with Country Strategy and Objectives ............................................ 1
1.2 Rationale for Bank Involvement ................................................................................. 1
1.3 Aid Coordination ......................................................................................................... 2
2 PROJECT DESCRIPTION ................................................................................................ 3
2.1 Project Components .................................................................................................... 3
2.2 Technical Solutions Adopted and Alternatives Considered ........................................ 3
2.3 Project Type ................................................................................................................ 4
2.4 Project Cost and Financing Arrangements .................................................................. 4
2.5 Project Target Area and Beneficiaries ........................................................................ 6
2.6 Participatory Approach ............................................................................................... 7
2.7 Bank Group Experience and Lessons Reflected in Project Design ............................ 7
2.8 Key Performance Indicators ........................................................................................ 8
3 PROJECT FEASIBILITY .................................................................................................. 8
3.1 Financial and Economic Performance......................................................................... 8
3.2 Environmental and Social Impact ............................................................................... 8
4 PROJECT IMPLEMENTATION..................................................................................... 12
4.1 Implementation Arrangements .................................................................................. 12
4.2 Project Monitoring and Evaluation ........................................................................... 14
4.3 Governance................................................................................................................ 15
4.4 Sustainability ............................................................................................................. 15
4.5 Risk Management ...................................................................................................... 16
4.6 Knowledge Building ................................................................................................. 17
5 LEGAL FRAMEWORK .................................................................................................. 17
5.1 Legal Instrument ....................................................................................................... 17
5.2 Conditions for Bank Intervention .............................................................................. 17
5.3 Compliance with Bank Policies ................................................................................ 17
6 RECOMMENDATION .................................................................................................... 18
Appendix I: Country’s Comparative Socio-Economic Indicators ..........................................I
Appendix II: ADB Portfolio in Kenya ................................................................................. III
Appendix III: Similar Projects in Kenya ............................................................................. V
Appendix IV : Map of Project Area .................................................................................. VIII

i
CURRENCY EQUIVALENTS
UA 1 USD 1.5
UA 1 EUR 1.2
Fiscal Year
1 January–31 December (Kenya)
8 July–7 July (Ethiopia)
Weights and Measures
m metre KOE kilogram of oil equivalent
cm centimetre = 0.01 metre kV kilovolt = 1,000 volts
mm millimetre = 0.001 metre KVa kilovolt ampere (1,000 Va)
km kilometre = 1,000 metres KW kilowatt = 1,000 Watts
m² square meter GW gigawatt (1,000,000 kW or 1,000 MW)
cm² square centimetre MW megawatt (1,000,000 W or 1,000 kW
km² square kilometre = 1,000,000 m² KWh kilowatt hour (1,000 Wh)
ha hectare = 10,000 m² MWh megawatt hour (1,000 KWh)
t (t) metric tonne (1,000 kg) GWh gigawatt hour (1,000,000 KWh)
Acronyms and Abbreviations
AC : Alternating current
AC : Alternating current
ADB : African Development Bank
ADF : African Development Fund
AFD : Agence Française de Développement
BD : Bidding documents
CDM : Clean Development Mechanism
CSP : Country Strategy Paper
DAG : Development Assistance Group
DC : Direct current
E&S : Environmental and social
EAPP : East African Power Pool
EIB : European Investment Bank
EHS : Environment, health, and safety
EEPCO : Ethiopia Electricity Power Corporation
EPC : Engineering, procurement, and construction
ESIA : Environmental and Social Impact Assessment
ESMP : Environmental and Social Management Plan
GDP : Gross domestic product
GoE : Government of Ethiopia
GoK : Government of Kenya
GTP : Growth and Transformation Plan
HVDC : High voltage direct current
IPP : Independent power producer
IRR : Internal rate of return
JPC : Joint Project Coordinator
JPCU : Joint Project Coordination Unit
JSC : Joint Steering Committee
KETRACO : Kenya Transmission Company
KFS : Kenya Forestry Services

ii
KPLC : Kenya Power Lighting Company
KWS : Kenya Wildlife Services
LCPDP : Least Cost Power Development Plan
MTP : Medium-Term Plan
NBI : Nile Basin Initiative
NEMA : National Environment Management Company
NGO : Nongovernmental organisation
NPV : Net present value
O&M : Operation and maintenance
OPGW : Optical ground wire
PAP : Project-affected people
PIM : Project Implementation Manual
PMT : Project Management Teams
PPA : Power Purchase Agreement
PPE : Personal Protective equipment
PPP : Public-private partnership
PRSP : Poverty Reduction Strategy Paper
RFP : Request for proposal
RAP : Resettlement Action Plan
SREP : Scale-up Renewable Energy Program

iii
PROJECT INFORMATION SHEET
Client Information
Borrower Federal Democratic Republic of Ethiopia
Republic of Kenya
Executing Agencies Ethiopia Electric Power Corporation (EEPCO)
Ministry of Energy in Kenya
Implementing Agencies Ethiopia Electric Power Corporation (EEPCO)
Kenya Electricity Transmission Company Limited
(KETRACO)
FINANCING PLAN
Sources Amount
(UA million) Instrument
African Development Fund 225 Loan
World Bank 456 Loan
Agence Française de Développement (AFD) 79 Loan
Government of Ethiopia 21 Equity
Government of Kenya 59 Equity
Total Financing 840
KEY ADB FINANCIAL INFORMATION
ADF Loan to Ethiopia ADF Loan to Kenya
Loan Currency Unit of Account (UA) Unit of Account (UA)
Interest Type N/A N/A
Interest Rate Margin N/A N/A
Service Charge 0.75% yearly on the disbursed and
outstanding.
0.75% yearly on the disbursed and
outstanding.
Commitment Fee
0.50% yearly on the undisbursed
portion of the loan starting 120 days
after the signing of the Loan
Agreements.
0.50% yearly on the undisbursed
portion of the loan starting 120
days after the signing of the Loan
Agreements.
Tenor 50 years 50 years
Grace Period 10 years 10 years
KEY FINANCIAL & ECONOMIC OUTCOMES
IRR NPV
EEPCo (Ethiopia)—Financial 21.9% USD 555 million
KETRACO—Financial 10.0% Break even
Kenya—Financial N/A USD 133 million
Economic (Regional) 23.3% USD 942 million
TIMEFRAME – MAIN MILESTONES
Concept Note Approval 05 October 2011
Project Approval 19 September 2012
Effectiveness March 2013
Completion November 2017
Last Disbursement June 2018
Last Repayment June 2068

iv
PROJECT SUMMARY
Project Overview: The project involves the construction of an electricity highway between
Ethiopia and Kenya, consisting of about 1,068 km of high voltage direct current (HVDC) 500
kV transmission line and associated AC/DC converter stations at Wolayta-Sodo (Ethiopia)
and Suswa (Kenya) substations, with a power transfer capacity of up to 2,000 MW. The
project is expected to cost UA 840 million and to be commissioned in November 2017. The
project will ultimately promote power trade and regional integration, contribute to the Eastern
Africa Power Pool (EAPP) countries’ social and economic development, and reduce poverty
in those countries.
Needs Assessment: The demand for electricity in the East African region has steadily risen
relative to supply, leading to occasional severe power shortages. To alleviate this situation,
East African countries must resort to exorbitantly expensive power from emergency
generators. However, the region is blessed with a great variety of natural resources, in
particular hydropower, mainly concentrated in Ethiopia. The integration of the power systems
of the EAPP will enable the development of Ethiopia’s large hydropower resources to enable
export and address power shortages throughout the region. The project will position Ethiopia
as the main powerhouse and Kenya as the main hub for power trade in the East African
region. It will promote power and economic trading as well as regional integration, and will
complement some ongoing Bank-financed projects, such as the regional Interconnection of
Electric Grids of the Nile Equatorial Lakes Countries, which aims to connect five East
African countries: Kenya, Uganda, Rwanda, Burundi, and the Democratic Republic of
Congo.
The electricity highway will also contribute to the EAPP countries’ social and economic
development and poverty reduction efforts. In Kenya alone, the additional power injected into
the national grid will enable the supply of electricity to an additional 870,000 households by
2018, and a cumulative total of 1,400,000 additional households by 2022 (of which 18% will
be located in rural areas). Businesses and industries will also benefit, with around 3,100 GWh
of additional energy by 2018, increasing to around 5,100 GWh by 2022.
Bank’s Added Value: The Bank has been playing a leading role in the preparation of the
project, financing some of the feasibility studies required to appraise the project and make it
bankable, which has positioned the Bank as a strategic partner of the East African countries
in the power sector. The Bank’s involvement has mobilized funds from other development
partners in a timely and efficient manner. The project is also perfectly aligned with the
climate change mitigation and adaptation strategy of the Bank, as it has the potential to
replace some fossil-fuelled thermal generation in the East African region.
Knowledge Management: The project will include a capacity-building component to ensure
knowledge transfer, especially in management of similar technologies which are likely to be
used for other projects in the near future, such as for the interconnections between Kenya and
Tanzania, Ethiopia, and Sudan.

v
RESULTS-BASED LOGICAL FRAMEWORK
Country and project name: Ethiopia-Kenya Electricity Highway Project
Purpose of the project: The project will improve the supply of electricity in Kenya and other Eastern African Power Pool (EAPP) countries in the long run.
RESULTS CHAIN
PERFORMANCE INDICATORS
MEANS OF VERIFICATION RISKS/MITIGATION MEASURES Indicator (including Core Sector
Indicator) Baseline Target
IMP
AC
T
Contribute to sustainable
economic growth and
poverty reduction
- Gross domestic product (GDP) growth
- Revenues for supplier (EEPCO — Ethiopia)
- Savings for offtaker (KETRACO — Kenya)
- 2010 figures: 11% in Ethiopia and 5.6% in Kenya
- n/a
- n/a
- GDP growth to accelerate to 7% by 2015 in Kenya and remain above 10% in Ethiopia
- USD 400 million by 2020
- USD 500 million by 2020
- Human Development Report
- National economic and sector statistics
- Ministry of Finance and Economic Development reports
- Central bank annual report - EEPCO and KETRACO annual
operation report
Risk arising from political fallout in one of the two governments and the ongoing instability / conflict in Somalia, which may negatively affect government operations and/or result in disputes between the two countries, will be mitigated by: - The commitment of Ethiopia and Kenya to
the implementation of their respective development plans and to regional integration
- Effective dialogue at the bilateral level as well as within EAPP
- The economic and financial benefits for both countries and sustained diplomatic relations between them will mitigate the risk of disputes
- The involvement of the multilateral and bilateral institutions in the project will provide reassurance that the two utilities will meet their contractual obligations without political interference.
vi
1 United Nations Statistics Division: http://unstats.un.org/unsd/environment/air_co2_emissions.htm
2 CO2 emission savings are calculated assuming a grid emission factor of approximately 0.6 tons of CO2/MWh
OU
TC
OM
ES
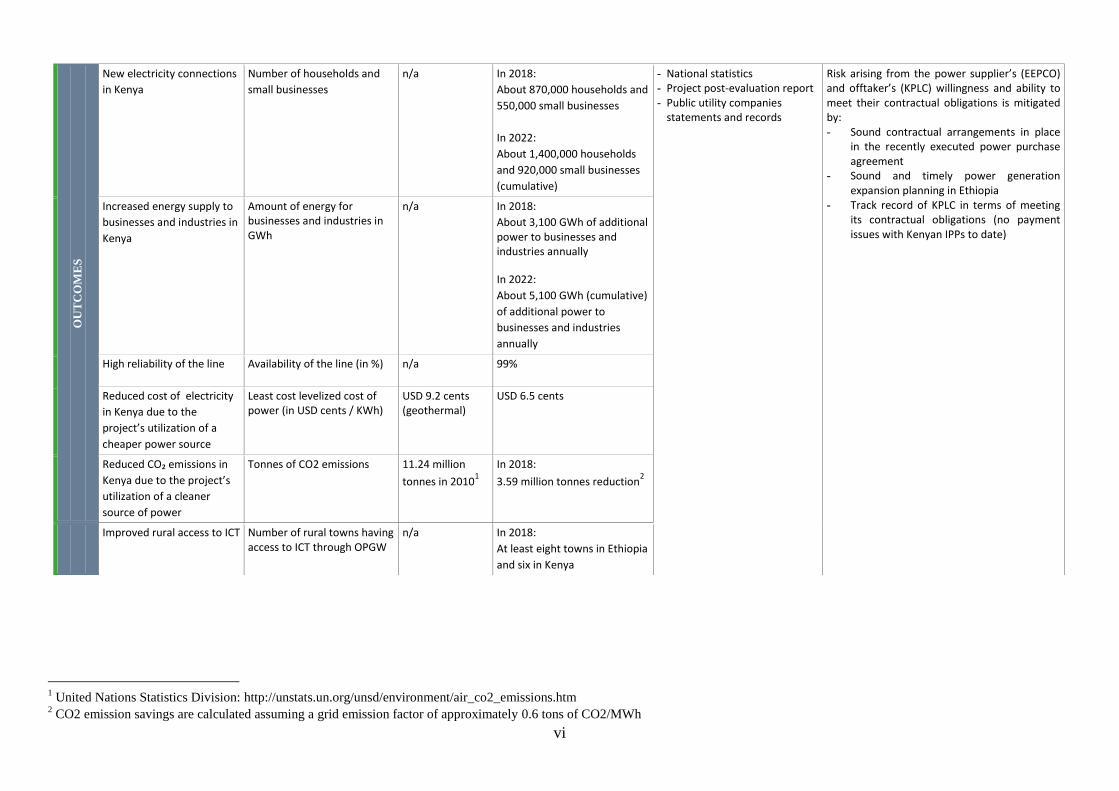
New electricity connections
in Kenya
Number of households and
small businesses
n/a In 2018:
About 870,000 households and
550,000 small businesses
In 2022:
About 1,400,000 households
and 920,000 small businesses
(cumulative)
- National statistics - Project post-evaluation report - Public utility companies
statements and records
Risk arising from the power supplier’s (EEPCO) and offtaker’s (KPLC) willingness and ability to meet their contractual obligations is mitigated by: - Sound contractual arrangements in place
in the recently executed power purchase agreement
- Sound and timely power generation expansion planning in Ethiopia
- Track record of KPLC in terms of meeting its contractual obligations (no payment issues with Kenyan IPPs to date)
Increased energy supply to
businesses and industries in
Kenya
Amount of energy for businesses and industries in GWh
n/a In 2018:
About 3,100 GWh of additional power to businesses and industries annually
In 2022:
About 5,100 GWh (cumulative)
of additional power to
businesses and industries
annually
High reliability of the line Availability of the line (in %) n/a 99%
Reduced cost of electricity
in Kenya due to the
project’s utilization of a
cheaper power source
Least cost levelized cost of power (in USD cents / KWh)
USD 9.2 cents (geothermal)
USD 6.5 cents
Reduced CO₂ emissions in
Kenya due to the project’s
utilization of a cleaner
source of power
Tonnes of CO2 emissions 11.24 million
tonnes in 20101
In 2018:
3.59 million tonnes reduction2
Improved rural access to ICT Number of rural towns having access to ICT through OPGW
n/a In 2018:
At least eight towns in Ethiopia
and six in Kenya

vii
OU
TP
UT
S
HVDC transmission line
interconnecting Ethiopia
and Kenya
- Length (in km) of HVDC transmission line constructed
- Number and capacity of AC/DC converter stations
n/a In 2018:
1,068 km of transmission line
constructed (437 km in
Ethiopia and 631 km in Kenya)
In 2018:
Four converter stations with a
total capacity of 2,000 MW
installed
- Progress reports from the implementing agency and from the supervision and management consultant
- Supervision mission reports from the Bank
- Disbursement and financial reports from the implementing agency
- Project completion report
Risk of escalation in project cost and/or implementation delay will be mitigated by: - Adequate design as well as contingency
funding for the project - Engineering, procurement, and
construction (EPC) contract should ensure minimum variance in cost
- Effective project management and supervision should ensure timely implementation
Risks related to the project operation and maintenance will be mitigated by:
- Sound operation and maintenance agreement will create an incentive for EEPCO and KETRACO to properly operate and maintain the project
- Capacity building support to be provided under the project
Improved capacity of the
implementing agencies and
EAPP
- Number of staff trained - Number of implementation,
operating and maintenance procedures and agreements negotiated and finalized
n/a - 50 each from EEPCO and KETRACO staff trained by end of 2016
- PPA, construction, operation and maintenance arrangements finalized by March 2012
- Operating procedures and manual finalized by March 2012
Increased employment
opportunities
- Number of jobs created during implementation and operation.
n/a - At least 1,600 temporary jobs created in Ethiopia and 2,400 in Kenya; 55 permanent jobs created in Ethiopia and 70 in Kenya, 33% of permanent jobs will be reserved for women
COMPONENTS INPUTS
KE
Y A
CT
IVIT
IES
A. Construction of 1,068 km of 500 KV HVDC bipolar transmission lines and AC/DC converter stations at Wolayta-Sodo (Ethiopia) and Suswa (Kenya) substations
B. Reinforcement of the Kenyan power system C. Capacity building and institutional support D. Project management and supervision E. Environmental and social management
A. UA 718 million
B. UA 67 million
C. UA 7 million
D. UA 28 million
E. UA 20 million
Total = UA 840 million
viii
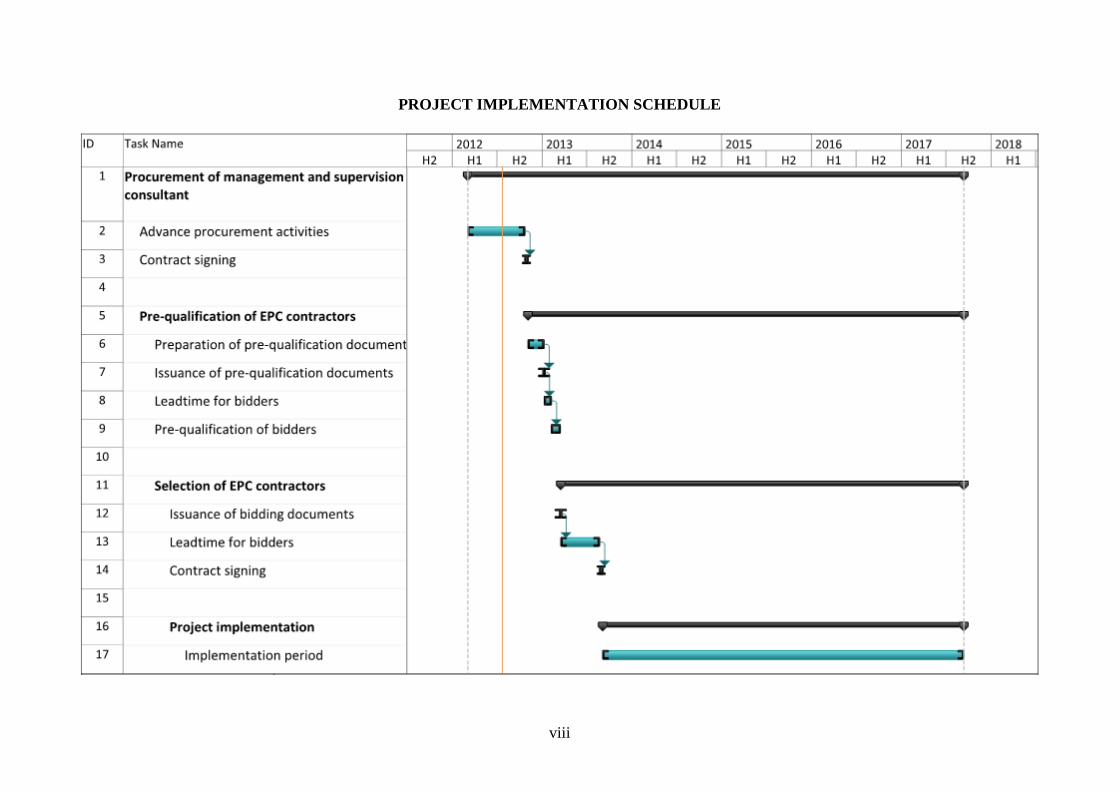
PROJECT IMPLEMENTATION SCHEDULE
1
REPORT AND RECOMMENDATION OF MANAGEMENT TO THE BOARD OF DIRECTORS
ON A PROPOSED LOAN TO ETHIOPIA AND KENYA
FOR THE ETHIOPIA-KENYA ELECTRICITY HIGHWAY PROJECT
Management submits the following Report and Recommendations on a proposed ADF loan of UA
150 million to Ethiopia and UA 75 million to Kenya for the Ethiopia-Kenya Electricity Highway
Project.
1 STRATEGIC THRUST AND RATIONALE
1.1 Project Linkages with Country Strategy and Objectives
1.1.1 The Bank’s Country Strategy Paper (CSP) for Kenya (2008–2013) seeks to support two
strategic pillars: infrastructure development for enhanced growth and the creation of employment
opportunities to reduce poverty. Under the first pillar, the country will aim to address problems related
to its erratic supply of electricity, inadequate road network, and insufficient water and sewerage
services. The CSP is in line with the country’s long-term development strategy, Vision 2030, and its
five-year Medium-Term Plan (2008–2013), in which the expansion of electricity infrastructure is a top
priority. Kenya is also committed to regional operations: the on-going Interconnection of Electric
Grids of the Nile Equatorial Lakes Countries, a Bank-financed regional project, will help improve the
power supply in the Eastern African Power Pool (EAPP).
1.1.2 A new five-year development plan, the Growth and Transformation Plan (GTP), 2011–2015,
was launched by the Government of Ethiopia at the beginning of 2011 as the key means to achieving
the country’s vision of extricating itself from poverty and becoming a middle income country by
2025. One of the pillars the GTP hinges on is the enhancement and expansion of quality infrastructure
development, in particular power generation. In fact, the plan aims at expanding the power generation
infrastructure and developing renewable energy sources by installing 8,700 MW of additional power
generation capacity by the end of 2016. Ethiopia’s hydropower potential is believed to be about
45,000 MW, and only about 2,000 MW of that is currently being tapped. Therefore, Ethiopia has the
potential to become the powerhouse of the EAPP. Given the relatively high energy generation cost of
other EAPP member countries, Ethiopia could realize the benefit of its hydropower potential if it
strategically implements its GTP. The Bank has recently developed a new CSP for Ethiopia covering
the period 2011–2015, which coincides with that of the GTP to which it is aligned. The CSP seeks to
support two strategic pillars: enhanced access to infrastructure and enhanced accountability and
quality of basic services delivery. Under the first pillar, the country will aim to expand its existing
infrastructure network and improve the quality of infrastructure services, including for electricity
generation and distribution.
1.1.3 The project is also consistent with the goal of regional infrastructure and capacity building,
which is the main pillar of the Bank’s Regional Integration Strategy Paper (RISP) for Eastern Africa,
covering 2011–2015. The project is included in the Eastern Africa RISP.
1.2 Rationale for Bank Involvement
1.2.1 The demand for electricity in Africa has steadily risen relative to supply, thus leading to severe
power shortages. This situation has been exacerbated by insufficient reforms in the policy, legal, and
regulatory environments in the energy sector; underinvestment; and climate change and its effects on
hydro-based energy resources, such as the drought ravaging the East African region3 in particular.
3 For the purpose of this project, the East African region is defined as the group of countries that comprises Kenya,
Tanzania, Uganda, Rwanda, and Burundi, all members of the East African Community (EAC), as well as Ethiopia and
Sudan. With the exception of Uganda, these countries are members of the EAPP.

2
Countries such as Kenya, Tanzania, and Uganda do not have regular electricity supplies and have
scheduled load-shedding programmes that in some countries stretch over four hours per day. Shorter-
term measures to alleviate the situation include recourse to exorbitantly expensive supplies from
emergency power generators, which can cost up to USD 20 cents per kWh (or USD 600 million per
year for 300 MW of emergency generation capacity). This is jeopardizing the finances of the power
sector in East African countries.
1.2.2 On the other hand, the East African region is blessed with a great variety of natural resources
concentrated in a few countries. In particular, more than 60% of sub-Saharan Africa’s hydropower
potential is concentrated in Ethiopia (believed to be about 45,000 MW) and the DRC. The integration
of the power systems of the EAPP will facilitate large-scale development of the region’s cost-effective
and clean energy sources, in particular Ethiopia’s large hydropower resources, as a means to address
power shortages. Ethiopia currently has an installed capacity of 2,179 MW, which is expected to grow
to approximately 11,000 MW by the end of 2016. The development of Ethiopia’s hydropower
potential and the interconnection of the Ethiopian and Kenyan power systems are key investments for
the development of a vibrant power pool in the East African region.
1.2.3 In light of the above, the Bank received an official request from the governments of Kenya and
Ethiopia to consider financing this important regional project. The rationale for the Bank’s
involvement is fourfold: (i) the Bank has been playing a leading role during the preparation of the
project, with the financing of feasibility studies required to make the project bankable, and would
therefore position itself as a strategic partner of the East African countries in the power sector; (ii) the
Bank’s involvement in the financing has mobilized funds from other development partners in a timely
and efficient manner; (iii) the project will complement the ongoing Interconnection of Electric Grids
of the Nile Equatorial Lakes Countries, a Bank-funded regional project that aims at connecting Kenya,
Uganda, Rwanda, Burundi and DRC; and (iv) the project is perfectly aligned with the climate change
mitigation and adaptation strategy of the Bank, as it will eventually replace fossil-fueled thermal
generation and improve the climate resilience of countries adversely affected by weather changes.
1.3 Aid Coordination
1.3.1 In Kenya, the Bank collaborates with other development partners through the Development
Partners Group (DPG), the Harmonization, Alignment and Coordination Group (HAC), and sector
donor groups. The most active development partners in the energy sector in Kenya are the AfDB,
World Bank, European Investment Bank (EIB), Agence Française de Développement (AFD), Japan
International Cooperation Agency (JICA), and Germany’s Kreditanstalt für Wiederaufbau (KfW). To
mobilize and coordinate the enormous resources required for the energy sector, the Kenyan Ministry
of Energy has established an energy sector working group. This group, which is currently chaired by
the AFD and includes all the donors active in the energy sector, aims to increase the programmatic
flow of donor funds for the energy sector, consistent with the 2005 Paris Declaration on Aid
Effectiveness.
1.3.2 In Ethiopia, the Ministry of Finance and Economic Development (MoFED) is responsible for
coordinating donor financing within the energy sector. This is done through regular consultations
between the government of Ethiopia and the donors through the Development Assistance Group
(DAG). The DAG also serves as a forum for donors to harmonize their strategies for intervention in
all sectors and share their respective experience. The Bank’s field office in Ethiopia (ETFO) is playing
a leading role in the DAG and is a member of the DAG Executive Committee. The most active
development partners in the energy sector in Ethiopia include the AfDB, World Bank, EIB, AFD,
Arab Bank for African Economic Development (BADEA), and Kuwait Fund.
.

3
2 PROJECT DESCRIPTION
The project’s development objective is to promote power trade and regional integration, contribute to
the East African countries’ social and economic development, and reduce poverty in those countries.
The project aims at improving the supply of electricity in Kenya and other EAPP countries in the long
run by exporting power from Ethiopia. This will result in improved supply of electricity in Kenya and
other East African countries in the long run.
2.1 Project Components
2.1.1 The project involves the construction of an electricity highway between Ethiopia and Kenya
consisting of about 1,068 km of transmission line (about 437 km will be in Ethiopia and about 631 km
in Kenya) and associated AC/DC converter stations at Wolayta-Sodo (Ethiopia) and Suswa (Kenya)
substations with a transfer capacity of up to 2,000 MW in either direction. The project components
and associated cost estimates are listed in Table 2.1.
Table 2.1
Project Cost Estimates by Components (Amounts in UA million equivalent)
N° Component Name Estimated
Cost Component Description
A) HVDC interconnector 718 Construction of 1,068 km of 500 KV HVDC bipolar transmission line
and AC/DC converter stations
B) Kenya system reinforcement 67 Reinforcement of the Kenyan power system
C) Capacity building and
institutional support 7
Training for Joint Project Coordination Unit and Project Management
Teams
D) Project management and
supervision 28 Consultancy services for project management and supervision
E) Environmental and social
management 20
Implementation of environmental management plan and resettlement and
compensation of project-affected persons
Total Project Cost 840
2.2 Technical Solutions Adopted and Alternatives Considered
2.2.1 The solution retained is the construction of a 500 kV HVDC transmission line with a capacity
of 2,000 MW along a route starting at Wolayta/Sodo substation, passing through Arba Minch, Konso,
Brindar, Yabello, Mega, crossing the border straight south and passing through west of Marsabit,
Samburu, Isolo, Laikipia, Nyandarua, Nakuru, west of Seradupi, Wamba, Rumurutuli, Gilgil, east of
Naivasha and ending at Suswa substation.
2.2.2 The option of not interconnecting the two countries (the “no project” alternative) and instead
relying on independent national generation and transmission development was considered and
rejected. Independent national development would have jeopardized the opportunity to exploit
synergies between the two systems, which will generate revenues for Ethiopia through the sale of
excess cheap hydropower and yield cost savings and reduced tariff for Kenya. Furthermore, without
the interconnector, Kenya would continue using fossil fuels to generate energy, contributing
negatively to climate change. One of the effects of climate change in Kenya is the recent extreme
droughts in the region, which means that the country can no longer rely on its hydropower generation
capacity. The best alternative sources for base load generation in Kenya are geothermal and coal.
Geothermal is relatively risky and requires significant financial resources because of the high upfront
investments involved. Coal, on the other hand, has significant negative environmental and social
impacts.
4
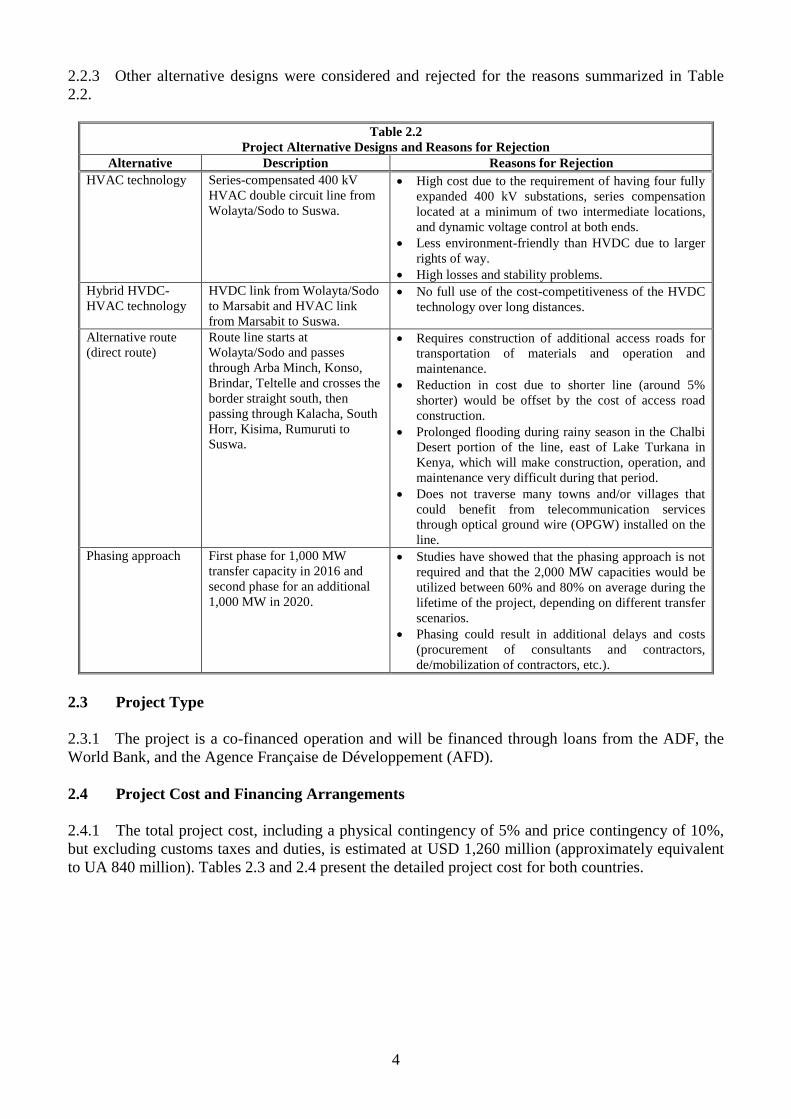
2.2.3 Other alternative designs were considered and rejected for the reasons summarized in Table
2.2.
Table 2.2
Project Alternative Designs and Reasons for Rejection
Alternative Description Reasons for Rejection
HVAC technology Series-compensated 400 kV
HVAC double circuit line from
Wolayta/Sodo to Suswa.
High cost due to the requirement of having four fully
expanded 400 kV substations, series compensation
located at a minimum of two intermediate locations,
and dynamic voltage control at both ends.
Less environment-friendly than HVDC due to larger
rights of way.
High losses and stability problems.
Hybrid HVDC-
HVAC technology
HVDC link from Wolayta/Sodo
to Marsabit and HVAC link
from Marsabit to Suswa.
No full use of the cost-competitiveness of the HVDC
technology over long distances.
Alternative route
(direct route)
Route line starts at
Wolayta/Sodo and passes
through Arba Minch, Konso,
Brindar, Teltelle and crosses the
border straight south, then
passing through Kalacha, South
Horr, Kisima, Rumuruti to
Suswa.
Requires construction of additional access roads for
transportation of materials and operation and
maintenance.
Reduction in cost due to shorter line (around 5%
shorter) would be offset by the cost of access road
construction.
Prolonged flooding during rainy season in the Chalbi
Desert portion of the line, east of Lake Turkana in
Kenya, which will make construction, operation, and
maintenance very difficult during that period.
Does not traverse many towns and/or villages that
could benefit from telecommunication services
through optical ground wire (OPGW) installed on the
line.
Phasing approach First phase for 1,000 MW
transfer capacity in 2016 and
second phase for an additional
1,000 MW in 2020.
Studies have showed that the phasing approach is not
required and that the 2,000 MW capacities would be
utilized between 60% and 80% on average during the
lifetime of the project, depending on different transfer
scenarios.
Phasing could result in additional delays and costs
(procurement of consultants and contractors,
de/mobilization of contractors, etc.).
2.3 Project Type
2.3.1 The project is a co-financed operation and will be financed through loans from the ADF, the
World Bank, and the Agence Française de Développement (AFD).
2.4 Project Cost and Financing Arrangements
2.4.1 The total project cost, including a physical contingency of 5% and price contingency of 10%,
but excluding customs taxes and duties, is estimated at USD 1,260 million (approximately equivalent
to UA 840 million). Tables 2.3 and 2.4 present the detailed project cost for both countries.

5
Table 2.3 - Project Cost by Component for Ethiopia and Kenya
Table 2.4 – Project Cost by Category of Expenditure in Foreign and Local Currency
2.4.2 The cost estimate is based on a 2009 feasibility study and a 2012 inception report for the
detailed design of the project, both prepared by an independent consultant.
2.4.3 The project will be financed by the ADF, World Bank, AFD, and the governments of Ethiopia
and Kenya. Ethiopia’s country contribution is 6.3% which is less than the required 10% of the project
cost threshold according to the Policy on Eligible Expenditures. A justification of the low counterpart
funding for Ethiopia is provided in Annex C. The sources of financing of the project are illustrated in
Table 2.5. Table 2.5 - Sources of Financing
Financier Financing in million USD Equivalent in million UA
Ethiopia Kenya Total Ethiopia Kenya Total %
Amount Amount
African Development Fund 225 113 338 150 75 225 27%
World Bank 243 441 684 162 294 456 54%
French Development Agency - 118 118 - 79 79 9%
Government of Ethiopia 32 - 32 21 - 21 3%
Government of Kenya - 88 88 - 59 59 7%
Total Financing 500 760 1,260 333 507 840 100%
Component USD million UA million
Ethiopia Kenya Total Ethiopia Kenya Total
A. HVDC interconnector
A.1 Transmission line 145 209 354 97 139 236
A.2 Converter substations 321 402 723 214 268 482
A. Subtotal HVDC interconnector 466 611 1,077 311 407 718
B. Kenya system reinforcement - 100 100 - 67 67
C. Capacity building and institutional support 3 7 10 2 5 7
D. Project management and supervision
D.1 Management and supervision of HVDC interconnector 15 23 38 10 15 25
D.2 Management and supervision of Kenya reinforcement - 5 5 - 3 3
D. Subtotal project management and supervision 15 28 43 10 18 28
E. Environmental and social management 16 14 30 11 9 20
Physical contingencies (5%)
Price contingencies (10%)
TOTAL 500 760 1,260 333 507 840
Category USD million UA million
FC LC Total FC LC Total
Goods (Supply and Installation)
A. HVDC interconnector
A.1 Transmission line 306 48 354 204 32 236
A.2 Converter substations 643 80 723 429 53 482
B. Kenya system reinforcement 89 11 100 59 7 67
Subtotal Goods (Supply and Installation) 1,039 138 1,177 692 92 785
Services
C. Capacity building and institutional support 10 - 10 7 - 7
D. Project management and supervision
D.1 Management and supervision of HVDC interconnector 38 - 38 25 - 25
D.2 Management and supervision of Kenya reinforcement 5 - 5 3 - 3
Subtotal Services 53 - 53 35 - 35
Others
E. Environmental and social management - 30 30 - 20 20
TOTAL 1,092 168 1,260 728 112 840
6
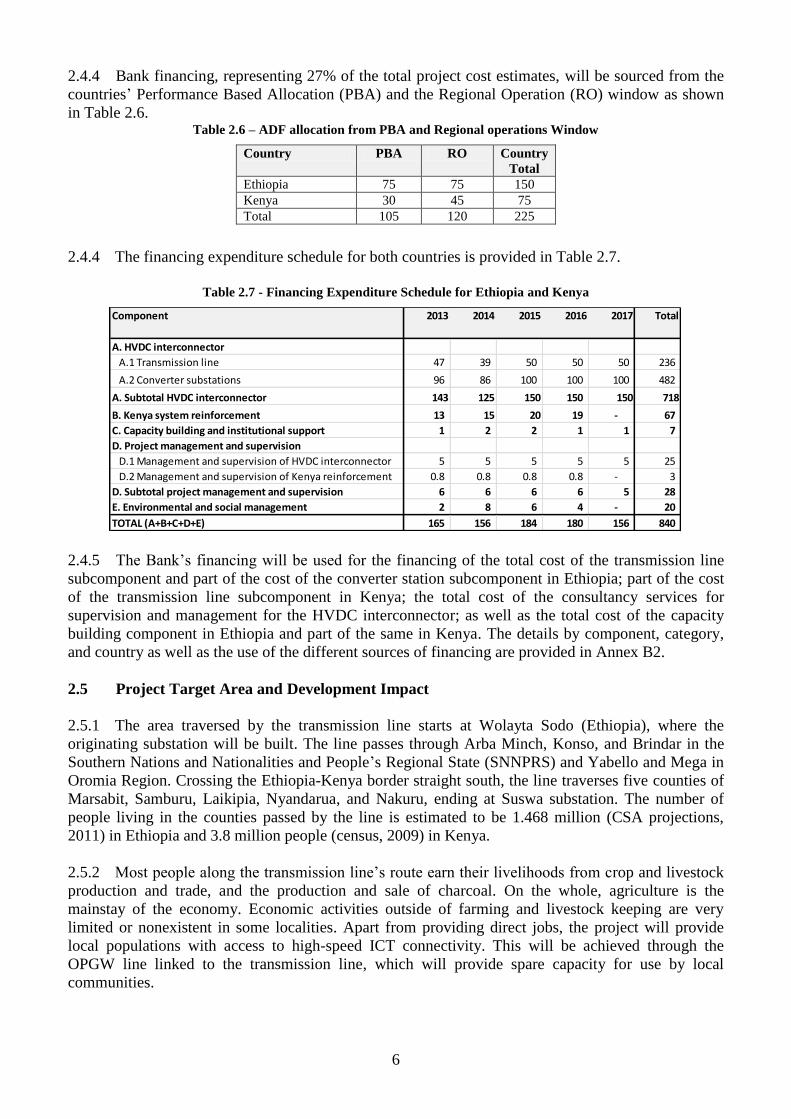
2.4.4 Bank financing, representing 27% of the total project cost estimates, will be sourced from the
countries’ Performance Based Allocation (PBA) and the Regional Operation (RO) window as shown
in Table 2.6. Table 2.6 – ADF allocation from PBA and Regional operations Window
Country PBA RO Country
Total
Ethiopia 75 75 150
Kenya 30 45 75
Total 105 120 225
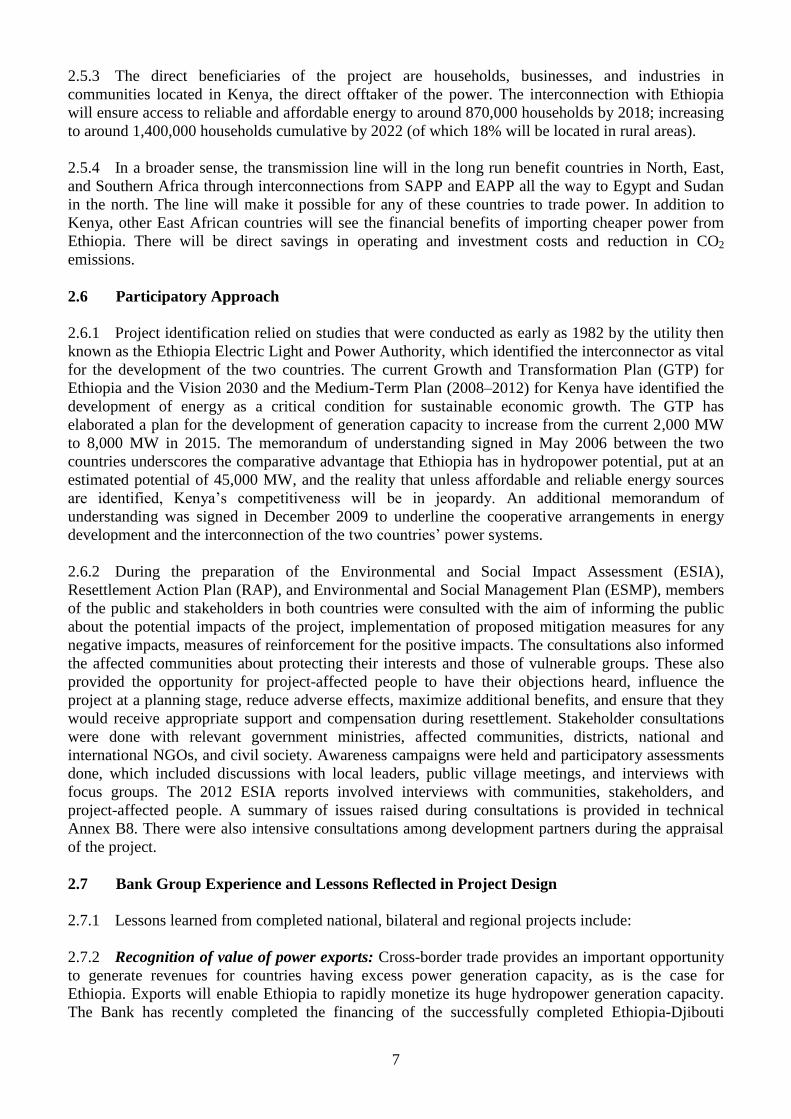
2.4.4 The financing expenditure schedule for both countries is provided in Table 2.7.
Table 2.7 - Financing Expenditure Schedule for Ethiopia and Kenya
2.4.5 The Bank’s financing will be used for the financing of the total cost of the transmission line
subcomponent and part of the cost of the converter station subcomponent in Ethiopia; part of the cost
of the transmission line subcomponent in Kenya; the total cost of the consultancy services for
supervision and management for the HVDC interconnector; as well as the total cost of the capacity
building component in Ethiopia and part of the same in Kenya. The details by component, category,
and country as well as the use of the different sources of financing are provided in Annex B2.
2.5 Project Target Area and Development Impact
2.5.1 The area traversed by the transmission line starts at Wolayta Sodo (Ethiopia), where the
originating substation will be built. The line passes through Arba Minch, Konso, and Brindar in the
Southern Nations and Nationalities and People’s Regional State (SNNPRS) and Yabello and Mega in
Oromia Region. Crossing the Ethiopia-Kenya border straight south, the line traverses five counties of
Marsabit, Samburu, Laikipia, Nyandarua, and Nakuru, ending at Suswa substation. The number of
people living in the counties passed by the line is estimated to be 1.468 million (CSA projections,
2011) in Ethiopia and 3.8 million people (census, 2009) in Kenya.
2.5.2 Most people along the transmission line’s route earn their livelihoods from crop and livestock
production and trade, and the production and sale of charcoal. On the whole, agriculture is the
mainstay of the economy. Economic activities outside of farming and livestock keeping are very
limited or nonexistent in some localities. Apart from providing direct jobs, the project will provide
local populations with access to high-speed ICT connectivity. This will be achieved through the
OPGW line linked to the transmission line, which will provide spare capacity for use by local
communities.
Component 2013 2014 2015 2016 2017 Total
A. HVDC interconnector
A.1 Transmission line 47 39 50 50 50 236
A.2 Converter substations 96 86 100 100 100 482
A. Subtotal HVDC interconnector 143 125 150 150 150 718
B. Kenya system reinforcement 13 15 20 19 - 67
C. Capacity building and institutional support 1 2 2 1 1 7
D. Project management and supervision
D.1 Management and supervision of HVDC interconnector 5 5 5 5 5 25
D.2 Management and supervision of Kenya reinforcement 0.8 0.8 0.8 0.8 - 3
D. Subtotal project management and supervision 6 6 6 6 5 28
E. Environmental and social management 2 8 6 4 - 20
TOTAL (A+B+C+D+E) 165 156 184 180 156 840
7
2.5.3 The direct beneficiaries of the project are households, businesses, and industries in
communities located in Kenya, the direct offtaker of the power. The interconnection with Ethiopia
will ensure access to reliable and affordable energy to around 870,000 households by 2018; increasing
to around 1,400,000 households cumulative by 2022 (of which 18% will be located in rural areas).
2.5.4 In a broader sense, the transmission line will in the long run benefit countries in North, East,
and Southern Africa through interconnections from SAPP and EAPP all the way to Egypt and Sudan
in the north. The line will make it possible for any of these countries to trade power. In addition to
Kenya, other East African countries will see the financial benefits of importing cheaper power from
Ethiopia. There will be direct savings in operating and investment costs and reduction in CO2
emissions.
2.6 Participatory Approach
2.6.1 Project identification relied on studies that were conducted as early as 1982 by the utility then
known as the Ethiopia Electric Light and Power Authority, which identified the interconnector as vital
for the development of the two countries. The current Growth and Transformation Plan (GTP) for
Ethiopia and the Vision 2030 and the Medium-Term Plan (2008–2012) for Kenya have identified the
development of energy as a critical condition for sustainable economic growth. The GTP has
elaborated a plan for the development of generation capacity to increase from the current 2,000 MW
to 8,000 MW in 2015. The memorandum of understanding signed in May 2006 between the two
countries underscores the comparative advantage that Ethiopia has in hydropower potential, put at an
estimated potential of 45,000 MW, and the reality that unless affordable and reliable energy sources
are identified, Kenya’s competitiveness will be in jeopardy. An additional memorandum of
understanding was signed in December 2009 to underline the cooperative arrangements in energy
development and the interconnection of the two countries’ power systems.
2.6.2 During the preparation of the Environmental and Social Impact Assessment (ESIA),
Resettlement Action Plan (RAP), and Environmental and Social Management Plan (ESMP), members
of the public and stakeholders in both countries were consulted with the aim of informing the public
about the potential impacts of the project, implementation of proposed mitigation measures for any
negative impacts, measures of reinforcement for the positive impacts. The consultations also informed
the affected communities about protecting their interests and those of vulnerable groups. These also
provided the opportunity for project-affected people to have their objections heard, influence the
project at a planning stage, reduce adverse effects, maximize additional benefits, and ensure that they
would receive appropriate support and compensation during resettlement. Stakeholder consultations
were done with relevant government ministries, affected communities, districts, national and
international NGOs, and civil society. Awareness campaigns were held and participatory assessments
done, which included discussions with local leaders, public village meetings, and interviews with
focus groups. The 2012 ESIA reports involved interviews with communities, stakeholders, and
project-affected people. A summary of issues raised during consultations is provided in technical
Annex B8. There were also intensive consultations among development partners during the appraisal
of the project.
2.7 Bank Group Experience and Lessons Reflected in Project Design
2.7.1 Lessons learned from completed national, bilateral and regional projects include:
2.7.2 Recognition of value of power exports: Cross-border trade provides an important opportunity
to generate revenues for countries having excess power generation capacity, as is the case for
Ethiopia. Exports will enable Ethiopia to rapidly monetize its huge hydropower generation capacity.
The Bank has recently completed the financing of the successfully completed Ethiopia-Djibouti

8
interconnector project. In the absence of interconnectors such as the Ethiopia-Djibouti and Ethiopia-
Kenya, Ethiopia’s hydropower potential would remain idle for some time.
2.7.3 Importance of an appropriate framework of commercial and operating agreements: A
framework that includes a Power Purchase Agreement (PPA), wheeling agreements, and a
Construction, Operation and Maintenance Agreement (CO&MA)—negotiated between the exporting
and importing entities and specifying and allocating in a sound manner rights, responsibilities,
obligations, risks, and benefits—promotes the sustainability of the underlying commercial
arrangement and cooperation between the two entities. In March 2012, Ethiopia and Kenya signed a
25-year bilateral PPA for 400 MW of power trade. According to the PPA, the contracting parties will
purchase and sell the designated amount of power (at 85% availability factor) at a price of USD 0.07
cents per kWh for the duration of the agreement. The wheeling agreement between KPLC, the
offtaker in Kenya, and KETRACO, the transmission company there, is currently being finalized.
2.7.4 Benefits of an overarching regional policy and institutional framework: Experience with
bilateral and regional projects demonstrates the benefits of ensuring that the project benefits from a
well-defined policy and institutional framework, enjoys the full backing of the governments involved,
and moves at a pace tailored to each country’s situation. The two governments have expressed
repeatedly their strong support for this project and its strategic importance for the two countries. The
Ethiopia-Kenya interconnector is the anchor for the development of the EAPP and will form the
backbone of the East African regional transmission network.
2.7.5 Importance of a joint approach: Experience in similar projects has shown the importance of
ensuring a coordinated approach to project development to avoid startup and implementation delays
(such as in project effectiveness, preparation of procurement plans, bidding documents, evaluation
reports, and contracts). For this project, a Joint Steering Committee (JSC) will be constituted as an
overseer of project implementation. A Joint Project Coordinator will be appointed by both utilities to
coordinate the common tasks to be performed by the two national Project Management Teams (in
charge of implementing the national components).
2.8 Key Performance Indicators
2.8.1 The key outcome indicators will be the increased power trade between Ethiopia and Kenya (in
GWh), the high reliability of the interconnector (in percentage points), the reduced cost of power (in
USD cents per KWh), and the avoided CO2 emissions (in tonnes). The output indicators will be the
length (in km) of the HVDC transmission line constructed, the number and capacity of AC/DC
converter stations implemented, the number of staff trained, and the number of project agreements
negotiated and finalized.
2.8.2 The source of data to confirm these indicators will be statistical reports produced by EEPCO,
KETRACO, KPLC, and their respective line ministries. The progress during implementation will be
monitored by the timely commencement of the works, regular disbursements, consultations with the
Project Management Teams, and timely submission of quarterly progress, environmental monitoring,
and annual audit reports.
3 PROJECT FEASIBILITY
3.1 Financial and Economic Performance
3.1.1 The financial and economic analysis is based on a model initially developed for the project by
an independent consultant in 2009 as part of the feasibility study of the project. The model has been
updated by the project team to incorporate the revised cost estimates and implementation schedule as
depicted by the consultant’s detailed design inception report, as well as the latest projections of

9
volumes of energy trade. Whilst the interconnection will be available for energy transfer to regional
countries, the focus of this analysis is on the bilateral exchange between Ethiopia and Kenya. A 25-
year PPA as described earlier has been concluded between EEPCO and KPLC, with KETRACO as
the transmission intermediary. KPLC’s payment obligations under the PPA shall be secured against
potential default by a letter of credit guaranteed by the International Development Association (IDA).
3.1.2 For this financial and economic analysis, total energy exchange (firm plus non-firm) is based
on the import volumes consistent with Kenya's 2011–2031 Least Cost Power Development Plan
(LCPDP). The LCPDP projects 600 MW of firm imports in 2016, 1,000 MW by 2020, and up to
2,000 MW by 2026. However, a more conservative estimate has been used in the financial and
economic analysis, which assumes that in addition to the 400 MW of firm imports under the PPA,
Kenya will import up to 75% of the difference between the import volume indicated in the LCPDP
and the 400 MW of firm imports starting in 2018, when the line is commissioned.
3.1.3 A regional viewpoint has been taken in assessing the economic viability of the project.
Ethiopia’s EEPCO is a vertically integrated utility, but Kenya has unbundled its energy sector, leaving
KETRACO in charge of the transmission segment while KPLC is in charge of distribution. For
Kenya, the financial analysis therefore considers the financial impact on KETRACO and KPLC
separately.
3.1.4 The project is financially feasible for EEPCO, with a financial internal rate of return (FIRR) of
21.9% and a financial net present value (FNPV) of USD 555 million. In Kenya, KETRACO will
break even (net present value of costs equal to net present value of benefits) with a FIRR of 10%,
equal to the discount rate that allows the company to recover the investment costs of implementing the
interconnector on the Kenyan side, a profit margin (reflected in the discount rate), and the O&M costs,
averaged over the lifetime of the project. The financial impact of the project on KPLC is analyzed by
considering the savings that the utility will realize by purchasing power from Ethiopia via the
interconnector instead of producing it locally. The FNPV for KPLC is estimated at USD 133 million.
3.1.5 The key economic benefits considered for this project, from a regional perspective, are: (1)
savings in operating costs of the regional interconnected power systems; (2) savings in investment
costs for those systems; and (3) emission reductions in the Kenyan system (only one country was
considered to simplify the analysis), as well as the earnings realized by Ethiopia from the energy
exports. While considering those economic benefits, the Project has an economic internal rate of
return (EIRR) of 23.3%, economic net present value (ENPV) of USD 942 million and an economic
benefit/cost ratio of 1.44 at a discount rate of 12%. It should be noted that while the economic analysis
was limited to the above mentioned benefits for simplicity, there are other important benefits which
are difficult to quantify at this stage, such as the reduction in power supply outages and the increased
security and reliability of electric service in Kenya and East Africa more broadly, which will result in
economic and social development.
3.1.6 The key financial and economic performance indicators are summarized in Table 3.1 below
and a detailed analysis, including sensitivity tests, is provided in Annex B.7.
Table 3.1
Key Financial and Economic Performance Indicators
IRR NPV
EEPCo (Ethiopia)- Financial 21.9% USD 555 million
KETRACO – Financial 10.0% Breakeven
KPLC – Financial N/A USD 133 million
Economic (Regional) 23.3% USD 942 million

10
3.2 Environmental and Social Impact
3.2.1 Many of the potential impacts associated with the project can be negated or minimized through
proper management. Notably, the project does not have a significant impact on socially and
ecologically sensitive environments. However, due to the size and scale of the project and the chance
of significant impact if not properly mitigated, the project was classified as category 1 in line with the
Bank’s ESIA procedures. The ESIA summary update was posted on the Bank’s website on 10 April
2012. Further information is provided in Annex B8 and details are given in the disclosed summaries.
3.2.2 Environment: The impacts associated with the project include loss of land due to erosion;
damage or clearance of vegetation cover (resulting in increased erosion); increased risk of soil and
water contamination by spillages or inadequate handling of hazardous substances; air pollution from
dust and vehicle and machinery emissions; noise and vibration disturbance to fauna and people;
biodiversity challenges due to the fact that about 188,000 trees will be cleared to build the project
(mainly in the highlands on the Ethiopian side); and clearing and levelling of sites using heavy
machinery, which may interfere with ecological niches for the few resident species in the area, leading
to habitat loss. Disturbance of the biota may induce changes in species composition for plants, as
exotic species might take over during regrowth. Clearance of vegetation will expose the soil to
erosion. Cordoning off of sites during construction may also affect animal migration corridors,
especially those of elephants; aerial monitoring by Kenya Wildlife Services (KWS) shows that there is
an elephant corridor between the Losai and Marsabit areas. Migratory birds and camels (due to their
poor sight) will also be affected once the structures are in place, and tourism will be affected because
there are flight routes in the area.
3.2.3 Mitigation: Erosion stabilization at the tower and substation sites, including replanting of
trees, will be a part of the tender specification, and revegetation will be done as sections are
completed. Soil and water contamination will be reduced by properly maintaining vehicles and
construction machines and assigning designated refueling areas. Air pollution will be minimized
through watering areas during construction and use of services equipment. Removal of trees will be
monitored to ensure that protected species are not affected, and the project has an afforestation
program as part of the ESMP. Training and awareness of the workers will prevent poaching and
ensure workers’ safety from animals. Visual impacts will be lessened by the fact that for the most part,
the line passes sparsely populated areas. However, for camels and migratory birds the line in such
areas will need to have warning devices. In densely populated areas, on the other hand, the line will
have neutral, non-reflective colors. Employees will constantly be sensitized through awareness and
training to ensure protection of flora and fauna. Where impacts could not be mitigated, the line route
was modified.
3.2.4 Climate Change: The project is a clean energy project and is perfectly aligned with the
climate change mitigation and adaptation strategy of the Bank. It will replace fossil-fueled thermal
generation and improve the climate resilience of Kenya and other East African countries, which are
adversely affected by weather changes, by exporting energy from hydropower generation sources. The
project will therefore result in reductions in air and water pollution, partial displacement of biomass
(which is often associated with deforestation), and contributions to sustainable development resulting
from more efficient use of energy. One negative effect relating to climate change will be the removal
of trees, but this will be limited to trees of particular height and will not significantly affecting
vegetation cover; in addition, mitigation via re-vegetation is planned as mentioned above. The effect
of climate change on the project will be through natural disasters such as storms and floods, and the
design will take these weather risks into consideration.
3.2.5 Gender: Overall, the project is not expected to negatively affect either gender
disproportionately. Land issues and property ownership associated with RAP implementation will
have to be monitored closely. Traditions and practices in the project area tend to prohibit women from

11
owning property or land unless they inherit it from a husband who dies, even though the law
nominally allows women to be landowners. Efforts are underway in the two countries to reverse these
trends. In Kenya, such efforts center around the National Gender and Development Policy and the
New Constitution (2010). Similarly, the Constitution of the Democratic Republic of Ethiopia (1994)
promotes gender equality and the rights of women, as do local laws that encourage the principles of
equality and participation of all. The Ethiopia Growth and Transformation Plan (GTP) is also
promoting female and youth empowerment and equitable distribution of benefits.
3.2.6 Two issues that could potentially affect women disproportionately are involuntary resettlement
and the spread of HIV/AIDS. Women tend to suffer more during resettlement, both in terms of
payment of compensation and control over resources, especially among vulnerable women and
female-headed households. Prevailing statistics in both countries show that the prevalence of
HIV/AIDS is higher among young women than men. This situation could be made worse during
project implementation, as men working on the project tend to come for work without their families
and have financial advantages over local young girls; wives left back home are the passive victims.
The project has built into its design, as part of implementing the ESMP, HIV/AIDS awareness
programs that will focus on women and young girls. Resettlement and compensation committees will
have women representatives, and special attention will be paid to vulnerable households.
3.2.7 Among the benefits that may accrue from the project is the opportunity for employment for
women as well as men. The Kenyan Constitution stipulates that organizations should implement
affirmative action to reach a goal of women making up at least one-third of the workforce. The
situation in Ethiopia is such that many women are willing and able to work on construction sites
alongside their male counterparts. The project will conduct sensitization to ensure that contractors
recruit at least 33% women for both unskilled and semi-skilled jobs.
3.2.8 Social: The project is expected to alleviate poverty through the creation of direct and indirect
jobs. Local populations will accrue benefits through short-term jobs supplying goods and services to
the project and its workers. It is estimated that at least 4,000 jobs will be created (approximately 1,600
in Ethiopia and 2,400 in Kenya), both skilled and unskilled, during the entire period of
implementation. An additional 125 jobs (55 in Ethiopian and 70 in Kenya) will be created to operate
the transmission line once it is built. The study of the project area shows an abundant pool of skilled
and semi-skilled artisans who will benefit from these job opportunities, learn additional skills that will
benefit their villages after project completion, and be available for maintenance work. It should also
be noted that trade will positively influence the distribution of income by creating new employment
and business opportunities.
3.2.9 Additional benefits to communities will come through the corporate social responsibility
(CSR) programs of KETRACO and EEPCO. Applying the experience from KPLC, KETRACO will
provide solar power to schools and health centers within the project line’s zone of influence. On the
Ethiopian side, the project will provide some social benefits to the school and health center at Wolayta
Sodo substation in the form of supplementary teaching and learning materials, health supplies, and
recreation/sporting facilities. The project has also included in its design the use of optical ground wire
(OPGW), which will offer an opportunity for expanding ITC along the line route. OPGW can be used
for high-speed transmission of data for the power utility's purposes of protection and control of the
transmission line, for the utility's own voice and data communication, or for lease or sale to third
parties to serve as a high-speed fiber interconnection between cities. Telecommunication companies
and agencies such as Ethio-Telecom will be able to use the spare capacity to provide communications,
ICT and data transfer services, including automated banking. The technology allows for a junction
box fixed at every 5–6 km of the OPGW, therefore providing an opportunity for connecting to the
wire at minimum cost to operators and users all along the line route.

12
3.2.10 HIV/AIDS (as mentioned) and other STI are among the communicable diseases that have the
potential to spread into areas where the project will be implemented. The spread of disease may be
exacerbated by the influx of construction workers to rural and isolated areas. As detailed above, the
project will include HIV/AIDS awareness and prevention programs, and requirements for hiring
service providers dedicated to such programs will be adopted by both KETRACO and EEPCO.
3.2.11 Involuntary resettlement: The project will traverse a long stretch of land with considerable
socioeconomic effects, especially during the construction phase. Most notable on the Kenyan side are
433 households with approximately 2,072 people who will be affected. These include 79 primary and
199 secondary structures. Of the 79 primary structures, 9 will have to be totally relocated while 70
will be partially affected. Of the 166 secondary structures, 16 will have to be totally relocated and 150
will be partially affected. An amount of KES 1,195,732,635 (approximately equivalent to USD
14,067,442) has been allocated for the implementation of the RAP. On the Ethiopian side,
approximately 1,165 households, representing about 5,743 persons and 18 public and community
institutions, will be affected by the project. Among these will be 256 structures, 341 hectares of
farmland, and 169,751 planted trees. The estimated cost for implementing the RAP in Ethiopia is ETB
239,333,769 (approximately equivalent to USD 13,699,701). RAPs have been prepared for the
transmission line’s route on both sides of the border to guide the implementation of the resettlement
and compensation. The two utilities will take responsibility for the smooth and timely completion of
the compensation program before construction starts. Financial resources to meet the costs are
available, and the project has included a loan condition to that effect.
4 PROJECT IMPLEMENTATION
4.1 Implementation Arrangements
4.1.1 The Federal Democratic Republic of Ethiopia through its Ministry of Finance and Economic
Development shall be the Borrower of the loan, while for the Government of Kenya; the Ministry of
Finance shall be the Borrower. EEPCo will be the Executing and Implementing Agency of the
proposed project on the Ethiopian side. EEPCo has the technical and managerial ability to implement
the project as demonstrated by the successful implementation of similar high-voltage transmission
lines in the country and the Ethiopia Djibouti Power Interconnector Project, financed by the Bank. On
the Kenyan side, the Ministry of Energy will be the Executing Agency and KETRACO will be the
Implementing Agency, with assistance from KPLC. KETRACO is beginning to acquire the necessary
technical and managerial ability to implement such complex projects, as demonstrated by the ongoing
implementation of the Mombasa-Nairobi Transmission Line and the Power Transmission System
Improvement Project, partly financed by the Bank. The involvement of a reputable supervision and
management consultant will reinforce the capabilities of both entities. The transmission line and
converter stations are expected to be built over a period of 48 months after contract signing, and the
project is expected to be completed by November 2017.
4.1.2 Considering the experience and lessons learned from the Bank-financed and recently
commissioned Ethiopia-Djibouti Power Interconnector Project and to ensure effective coordination of
planning of activities, a Joint Steering Committee (JSC) will be constituted as an overseer of project
implementation. The JSC will periodically update and brief the existing Joint Ministerial Commission
established by the two countries. EEPCO and KETRACO have established a Joint Project
Coordination Unit (JPCU). Located in Addis Ababa, the JPCU is composed of a Joint Project
Coordinator (JPC) and two project procurement specialists (one from each country) reporting to the
coordinator. EEPCO and KETRACO will jointly appoint the JPC. A Joint Tender Evaluation
Committee, composed of sufficient senior technical staff designated by each of the project owners,
will participate in tender evaluations. While also serving as secretary to the JSC, the JPCU’s primary
responsibility will be the coordination of common tasks to be performed by the two national Project
Management Teams (PMT).

13
4.1.3 The PMT will be established from staff of EEPCO and KETRACO to closely supervise the
implementation of the project. Each utility will assign to the national PMT one project manager, one
substation engineer, one transmission engineer, one protection engineer, one communications
engineer, one civil engineer, one project accountant, one environmental specialist, one safety and
health expert, one procurement specialist and one monitoring and evaluation (M&E) specialist. The
national project managers from EEPCO and KETRACO will be part of the JPCU, alongside other
experts EEPCO and KETRACO will assign to it on an as-needed basis.
4.1.4 The JPCU will also be assisted by the consultant in charge of bid evaluation and project
supervision and management, who will review the tender documents, assist during the bid evaluation,
review the contractor’s detailed engineering design, and supervise and monitor the project
implementation, including the implementation of the ESMP. A project manager will be based in Addis
Ababa to coordinate common tasks to both countries as a team leader. The project manager will be
assisted by two deputy project managers, located in Addis Ababa and Nairobi, for follow-up of
implementation of the project in each country. The implementation arrangements are detailed in
Annex B3.
4.1.5 Project Implementation Manual: The Project Implementation Manual (PIM) will be designed
to help EEPCO and KETRACO to carry out the objectives of the project in accordance to the project
lenders’ requirements. The PIM will present the detailed arrangements and procedures for the
implementation of the project, including: (i) institutional arrangements and day-to-day execution of
the project; (ii) environmental and social safeguard procedures; (iii) handling of procurement activities
with a focus on planning, control, and reporting while clarifying the roles and responsibilities of those
involved in the procurement processes; (iv) budgeting, disbursement, and financial management
arrangements; and (v) monitoring, reporting and evaluation of the project.
4.1.6 Procurement: The procurement of goods, works and acquisition of consulting services
financed by the Bank will be in accordance with the Bank’s rules and procedures—Rules and
Procedures for Procurement of Goods and Works, dated May 2008, and Rules and Procedures for the
Use of Consultants, dated May 2008—using the relevant Bank standard bidding documents, and the
provisions stipulated in the Financing Agreement. However, the Bank will be jointly financing one
contract for the converter stations with the World Bank. The Board of Directors is therefore asked to
approve a waiver, in line with Clause 1.17 of the Bank’s procurement rules, to use the World Bank’s
Guidelines: Procurement of Goods, Works and Non-Consulting Services under IBRD Loans and IDA
Credits and Grants by World Bank Borrowers, dated January 2011, under the jointly financed
contract.
4.1.7 The Joint Project Coordination Unit (JPCU), technically supported by and composed of
procurement experts from KETRACO and EEPCO, will be responsible for the procurement of goods,
works, and services. EEPCo and KETRACO will each assign an experienced project procurement
specialist (PPS) to be part of the JPCU. Each PPS must be familiar with the procurement procedures
of the relevant project owner and possess qualifications and experience satisfactory to the lenders. The
consultant in charge of project supervision and management will assist the JPCU in handling the
acquisition processes. A Joint Tender Evaluation Committee (JTEC), composed of appropriate
technical staff designated by each of the project owners, will participate in tender evaluations. EEPCO
and KETRACO would separately use their own arrangements to approve all procurement and contract
award decisions before the decisions are communicated by the JPC to the lenders for no-objection.
Finally, the JPC will be responsible for obtaining those necessary clearances on all procurement
matters.

14
4.1.8 A procurement plan has been prepared by the JPCU that takes into account the processing
timelines of the other financiers. The procurement plan will be updated at least annually or as required
to reflect project implementation needs and improvement in institutional capacity. The procurement
arrangements are detailed in Annex B.5.
4.1.9 Financial Management: Both implementing agencies, KETRACO and EEPCO, have proper
structures in place as well as adequate and qualified staff to carry out the financial management
responsibilities of the project. The project will substantially make use of the countries’ public
financial management (PFM) systems. Both entities have robust budgeting arrangements, internal
control systems with functioning accounting systems, and good flow of funds arrangements. For
Kenya, the annual financial statements will be audited by the Auditor General or an appointed firm
following the Bank’s Audit Terms of Reference. For Ethiopia, the financial statements will be audited
by an independent external auditor who will be appointed by the Federal Auditor General office. The
annual audit report, complete with a management letter, will be submitted to the Bank no later than six
months after the end of the fiscal year. The internal audit of the executing agencies will complement
the oversight of the management. The proposed value-for-money audit will further help in providing
assurance that funds will be used only for intended purposes, with due regard to economy and
efficiency. Governance and anti-corruption guidelines and measures for both entities and countries
will be applicable. A supervision mission will be conducted at least twice every year based on the risk
assessment of the project. The mission’s objectives will include that of ensuring that strong financial
management systems are maintained for the project throughout its life. Reviews will be carried out
regularly to ensure that expenditures incurred by the project remain eligible for ADF funding.
4.1.10 Disbursements: The implementing agencies will utilize the Bank’s four disbursement methods
explained in the Disbursement Handbook, while direct payment will be the preferred method for
payments to contractors or service providers upon recommendations of their satisfactory performance
by the project-authorized consultant and officials. Both executing entities will open a special account.
A detailed assessment of the financial management and disbursement arrangements is provided in
Annex B.4.
4.2 Project Monitoring and Evaluation
4.2.1 The monitoring and evaluation of the performance of the project will be realized at three
levels. The first is the monitoring of the project‘s output and outcome by tracking progress in the
implementation of the project‘s components and the achievement of key outcome indicators. The
second level is the monitoring of the financial performance of EEPCO, KETRACO, and KPLC (as
power offtaker). The third level concerns the environmental and social indicators. Some activities
have already started in September 2011 with the preparation of preliminary designs and tender
documents. The consultant for project supervision and management, to be financed under the project,
will review the tender document in order to verify that the bidding documents are prepared as per the
standard bidding documents of the financing agencies.
4.2.2 The project will be launched in the first quarter of 2013. The Ethiopia field offices (ETFO) in
Addis Ababa and the Regional Resource Centre in Nairobi, with the support of the headquarter if need
be, will carry out field supervisions twice a year or on an as-needed basis. The coordination of the
missions will be done by the Ministries of Finance and Energy in the respective countries in
collaboration with EEPCO and KETRACO. The JPC, in liaison with the project supervision and
management consultant, will prepare and submit to the Bank and other financers involved in the
project quarterly progress reports. In addition, an audit report will be prepared and submitted to the
Bank and other financers six months after the end of every financial year. During implementation,
monitoring of ESMP and RAP will be done by the environmental and social experts in each PMT. The
Ministry of Water and Energy (Ethiopia) and, where necessary, the environmental authorities in the
two countries—EPA (Environmental Protection Authority) in Ethiopia and NEMA in Kenya—will

15
play a role in monitoring the ESMP. With the assistance of the consultant, annual environmental
reports will be prepared by each PMT and submitted to the Bank through the JPC.
4.3 Governance
4.3.1 The project is carried out within the PFM systems in Kenya and the corporation financial
management (CFM) systems in Ethiopia. Hence, it will adopt all the governance and anticorruption
policies and guidelines of the respective countries. Details of reporting and punishing corruption are
well laid out. The internal audit of the authorities and that of the ministries will complement the
oversight of the management. The proposed value-for-money audit will further help in providing
assurance that funds will be used for intended purposes only with due regard to economy and
efficiency.
4.4 Sustainability
4.4.1 The project is technically, economically, and financially sustainable. The technical sustainability is
ensured by the use of standard state of the art technology. Economic and financial sustainability will be
ensured by the application of tariffs that fall within a range that keeps KPLC interested in buying power
as an alternative to more costly domestic fossil-fueled thermal generation, while also generating
sufficient returns for EEPCO. Some other external factors can influence the sustainability of the project.
4.4.2 Countries commitment, cooperation and stability: Continued commitment, cooperation and
stability for both Ethiopia and Kenya represent a key underlying factor for the sustainability of this
project. In this regard, the existing Ethiopia-Kenya Joint Ministerial Commission ensures that the
benefits of cooperation and integration are evident and shared equitably between the two countries.
4.4.3 Expansion of the power generation capacity in Ethiopia: The availability of power for export
from Ethiopia will depend in part on the sound and timely commissioning of the hydropower projects
currently under construction before commissioning of the interconnector as these plants provide
EEPCO with the capacity to export hydropower to Kenya. It is expected that by the time the
interconnecor is commissioned in 2018, there will be an additional 8,700 MW installed capacity
commissioned in Ethiopia. The list of hydropower development projects in Ethiopia is provided in
Table A1.3 in Annex A1.
4.4.4 Reinforcement of the national networks: On both sides, the AC transmission networks are
being reinforced to accommodate the additional power that would be traded with the new transmission
line. On the Ethiopian side, the Wolayta/Sodo substation, to which the line will connect, is already
being built. On the Kenyan side, the Suswa substation is currently being built for initial operation at
220 KV. The substation will need to be upgraded to 400 KV and reinforced to connect to the HVDC
line. This will cost approximately USD 100 million and will be financed by the World Bank.
4.4.5 Capacity to operate and maintain the interconnector: Ethiopia has recently commissioned an
interconnector with Djibouti, and a project to interconnect the country with Sudan is at the final stages
of implementation. An interconnector creates a potential for reduction of the total generation costs if
the combined system is operated in an efficient manner. To assure sustainable gains, operators on both
sides need to develop technical capacity to sustain the energy flows (efficient trading). To achieve this
goal, protocols, rules, and systems need to be developed. EAPP is currently developing a grid code for
the East African region. The operational staff will be trained in both countries for operation and
maintenance of DC lines and converter stations. In addition, training will be provided to the
commercial staff of both utilities to handle power trade transactions.
4.4.6 Regional dimension: The project has wide regional scope since under different scenarios; the
power transmitted is used not only by Kenya and Ethiopia, but also by other countries in the EAPP. It

16
is anticipated that power will flow in both directions (from Ethiopia to East African countries all the
way to the Southern African Power Pool, and/or from the Eastern and Southern Power Pools to Egypt
and Sudan in the north), depending on the development scenarios that materialize. Thus, the project
will be an anchor link in establishing the backbone of the EAPP with the aim to develop a regional
electricity market that effectively exploits regional primary energy sources to provide the people of
East African with access to affordable, reliable, and sustainable electricity, thereby promoting overall
economic growth.
4.5 Risk Management
4.5.1 The project involves some degree of risks. The major risks and mitigation measures are
discussed in Table 4.1 below. Overall, the project risk is rated as moderate.
Table 4.1 – Project Risks and Mitigation Measures
Risk
Description Rating Mitigation
Political risk Risk arising from: (i)
political fallout in one of the
two governments; and (ii)
the instability in Somalia
that may negatively affect
governments’ operations
and/or result in disputes.
M Commitment of Ethiopia and Kenya to the
implementation of their respective development
plans
Effective dialogue at the bilateral level as well as
within EAPP
Economic and financial benefits for both
countries and sustained diplomatic relations
between them (will mitigate the risk of disputes)
Involvement of the multilateral and bilateral
institutions in the project will reassure
stakeholders that the two utilities will meet their
contractual obligations without political
interference
Power supply Willingness and ability of
the power supplier (EEPCO)
to meet its contractual
obligations
L Ongoing expansion program in Ethiopia expected
to increase the country’s generation capacity
Sound contractual arrangements in place in the
recently executed power purchase agreement
(will create an incentive for EEPCO to trade)
Sound and timely power generation expansion
planning in Ethiopia
Power offtake Willingness and ability of
the power offtaker (KPLC)
to meet its contractual
obligations
L Shortage of electricity supply and expected
increase in demand in Kenya
Sound contractual arrangements in place in the
recently executed power purchase agreement
(will create an incentive for KPLC to take and
pay for the power)
Track record of KPLC in terms of meeting its
contractual obligations: No payment issues with
the Kenyan IPPs to date
Cost overrun /
implementation delay
Risk of escalation in project
cost and/or implementation
delay
M Adequate design as well as contingency funding
for the project
Engineering, procurement, and construction
(EPC) contract should ensure minimum variance
in cost
Effective project management and supervision
should ensure timely implementation
Weak operational and
maintenance capacity
Risks related to the lack of
experience of both countries
in operation and
maintenance of HVDC
cross-border transmission
lines
M Sound operation & maintenance agreement will
create an incentive for EEPCO and KETRACO to
properly operate and maintain the project
Capacity building support to be provided under
the project
L: Low M: Moderate H: High

17
4.6 Knowledge Building
4.6.1 The contract with the contractors and consultant will include specific provisions to ensure the
training of EEPCO and KETRACO engineers. This is a standard feature of contracts previously
entered into by EEPCO and KETRACO. This knowledge transfer component, especially in project
management, is particularly important. Similar technologies are likely to be used for other projects in
the near future, such as for the interconnections between Kenya and Tanzania and Ethiopia and Sudan.
5 LEGAL FRAMEWORK
5.1 Legal Instrument
5.1.1 The legal instruments for the ADF-financed part of the project are:
ADF loan agreement to the Federal Democratic Republic of Ethiopia; and
ADF loan agreement to the Republic of Kenya.
5.2 Conditions for Bank Intervention
A) Conditions Precedent to Entry into Force
5.2.1 The entry into force of the ADF loan agreements shall be subject to the fulfilment by the
Government of the Federal Democratic Republic of Ethiopia and the Government of Kenya (the
“Borrowers”) of the provisions of Section 12.01 of the General Conditions applicable to the African
Development Fund Loan Agreements and Guarantee Agreements.
B) Conditions Precedent to Disbursements and Other Conditions
5.2.2 First Disbursements in Respect of Consultancy Services: The first disbursements of the ADF
loans (the “First Disbursements”) shall be:
(i) made by the Fund, and the Borrowers shall apply such First Disbursements, solely for the
purpose of the payment of consultancy services in connection with the project design and the
bidding process for procurement of construction services for the project (the “Consultancy
Services”); and
(ii) in an aggregate amount not to exceed a specific threshold to be set in the ADF loan
agreements.
5.2.3 Conditions Precedent to First Disbursements: The obligation of the Fund to make any of the
First Disbursements of the ADF loans shall be conditional upon entry into force of the respective loan
agreements in accordance with section 5.2.1 above and the provision by the Borrowers of evidence, in
form and substance satisfactory to the Fund, of the fulfillment of the following conditions:
i) the co-financiers have approved their financing of the project and the Borrowers have made
appropriate arrangements to cover any financing gap resulting from the failure to obtain the
commitment of the co-financier;
ii) the establishment of a national Project Management Team whose composition, qualifications
and experience are acceptable to the Fund;
iii) the appointment of a Joint Project Coordinator, whose qualifications and experience are
acceptable to the Fund;
iv) the establishment of a Joint Steering Committee for the project;
v) development and delivery to the Fund of a Resettlement Action Plan (“RAP”) together with a
Works and Compensation Schedule (the “Works and Compensation Schedule”) detailing (A)
each section of civil works under the Project and (B) the time frame for compensation and
resettlement of all project-affected persons (as defined in the RAP) in respect of each section;

18
vi) for any year in which the Borrower prepares an annual budget (a “Budget Year”), if any of the
First Disbursements occurs during such Budget Year and civil works are scheduled to take
place during such Budget Year according to the Works and Compensation Schedule, the
Borrower shall have provided evidence satisfactory to the Fund that the Borrower has made
budgetary allocations for all costs associated with the resettlement and compensation of
Project Affected Persons for such civil works in accordance with the RAP;
vii) a Power Purchase Agreement (PPA) having been fully executed by each party thereto; and
viii) the opening of a foreign currency special account at a bank acceptable to the Fund for receipt
of the proceeds of the loan.
5.2.4 Conditions Precedent to Further Disbursement: The obligation of the Fund to make any
further disbursement following the First Disbursements shall be conditional upon the Borrower having
provided evidence, in form and substance satisfactory to the Fund, that, prior to commencement of
civil works on any section of the project, all project-affected Persons in respect of such section of civil
works have been compensated and/or resettled in accordance with the RAP and the Works and
Compensation Schedule (as such RAP and Works and Compensation Schedule may be revised, in
form and substance acceptable to the Fund, to reflect changes to the design of the project arising from
the Consultancy Services).
5.3 Compliance with Bank Policies
5.3.1 This project complies with all applicable Bank policies.
6 RECOMMENDATION
Management recommends that the Board of Directors approves:
i) the proposed ADF loan of UA 150 million (approximately equivalent to USD 235 million) to
the Government of Ethiopia;
ii) the proposed ADF loan of UA 75 million (approximately equivalent to USD 118 million) to
the Government of Kenya; and
iii) the proposed waiver, in line with Clause 1.17 of the procurement rules, to use World Bank
procurement rules and procedures for the acquisition of the converter stations which are
subject to joint financing.

I
Appendix I: Countries Comparative Socio-Economic Indicators
Ethiopia
1990 2011 *
Area ( '000 Km²) 30,323 98,461
Total Population (millions) 48.3 84.7 1,044.3 5,733.7
Population growth (annual %) 3.3 2.1 2.3 1.3
Life expectancy at birth, total (years) 47.1 59.3 57.7 77.7
Mortality rate, infant (per 1,000 live births) 120.8 65.2 76.0 44.7
Physicians per 100,000 People ... 2.2 57.8 112.0
Births attended by skilled health staff (% of total) ... 5.7 53.7 65.3
Immunization, measles (% of children ages 12-23 months) 38.0 81.0 78.5 84.3
School enrollment, primary (% gross) 36.6 101.6 101.4 107.8
Ratio of girls to boys in primary education (%) 65.2 91.2 88.6 ...
Literacy rate, adult total (% of people ages 15 and above) ... 39.0 67.0 80.3
Access to Safe Water (% of Population) 14.0 44.0 65.7 86.3
Access to Sanitation (% of Population) 3.0 21.0 39.8 56.1
Human Develop. (HDI) (0 to 1) 0.3 0.4 0.5 ...
Human Poverty Index (% of Population) ... 50.9 33.9 ...
Economy 2000 2009 2010 2011
GNI per capita, Atlas method (current US$) 130 350 390 ...
GDP (current Million US$) 7,970 28,477 26,575 34,613
GDP growth (annual %) 5.9 8.8 11.4 10.7
Per capita GDP growth (annual %) 3.2 6.5 9.1 8.4
Gross Domestic Investment (% of GDP) 19.2 22.7 24.7 25.5
Inflation (annual %) 6.2 2.9 17.5 26.7
Budget surplus/deficit (% of GDP) -9.3 -0.9 -1.7 -1.6
Trade, External Debt & Financial Flows 2000 2009 2010 2011
Export Growth, volume (%) 20.5 9.1 -6.3 3.7
Import Growth, volume (%) -17.9 -7.1 -1.3 8.3
Terms of Trade (% change from previous year) -33.9 -25.7 35.4 19.1
Trade Balance ( mn US$) -1,125 -6,278 -6,321 -7,786
Trade balance (% of GDP) -14.1 -22.0 -23.8 -22.5
Current Account ( mn US$) -335 -1,620 -1,293 -2,165
Current Account (% of GDP) -4.2 -5.7 -4.9 -6.3
Debt Service (% of Exports) 53.0 2.4 3.3 5.2
External Debt (% of GDP) 68.4 15.3 20.2 17.0
Net Total Inflows ( mn US$) 681 4,048 3,796 ...
Net Total Official Development Assistance (mn US$) 687 3,819 3,524 ...
Foreign Direct Investment Inflows (mn US$) 135 221 184 ...
External reserves (in month of imports) 1.5 1.5 ... ...
Private Sector Development & Infrastructure 2000 2009 2010 2011
Time required to start a business (days) ... 9 9 9
Investor Protection Index (0-10) ... 4.3 4.3 4.3
Main Telephone Lines (per 1000 people) 3.5 11.3 11.0 ...
Mobile Cellular Subscribers (per 1000 people) 0.3 49.9 82.6 ...
Internet users (000) 0.2 5.5 7.7 ...
Roads, paved (% of total roads) 12.0 ... ... ...
Railways, goods transported (million ton-km) ... ... ... ...
* Most recent year Last Update: May 2012
Ethiopia - Development Indicators
Developing
countries
Source: ADB Statistics Department, based on various national and international sources
EthiopiaAfricaSocial Indicators
1,104
Ethiopia

II
Kenya
1990 2011 *
Area ( '000 Km²) 30,323 98,461
Total Population (millions) 23.4 41.6 1,044.3 5,733.7
Population growth (annual %) 3.4 2.7 2.3 1.3
Life expectancy at birth, total (years) 59.3 57.1 57.7 77.7
Mortality rate, infant (per 1,000 live births) 66.1 60.2 76.0 44.7
Physicians per 100,000 People 4.5 13.9 57.8 112.0
Births attended by skilled health staff (% of total) ... 43.8 53.7 65.3
Immunization, measles (% of children ages 12-23 months) 78.0 86.0 78.5 84.3
School enrollment, primary (% gross) 100.4 113.3 101.4 107.8
Ratio of girls to boys in primary education (%) 96.6 97.7 88.6 ...
Literacy rate, adult total (% of people ages 15 and above) ... 87.4 67.0 80.3
Access to Safe Water (% of Population) 44.0 59.0 65.7 86.3
Access to Sanitation (% of Population) 25.0 32.0 39.8 56.1
Human Develop. (HDI) (0 to 1) 0.5 0.5 0.5 ...
Human Poverty Index (% of Population) ... 29.5 33.9 ...
Economy 2000 2009 2010 2011
GNI per capita, Atlas method (current US$) 420 770 790 ...
GDP (current Million US$) 12,604 29,394 32,007 37,059
GDP growth (annual %) 0.5 2.6 5.6 4.5
Per capita GDP growth (annual %) -2.0 0.0 2.9 1.8
Gross Domestic Investment (% of GDP) 17.6 19.4 19.3 19.3
Inflation (annual %) 10.0 10.5 4.1 14.0
Budget surplus/deficit (% of GDP) 0.8 -4.5 -7.0 -6.9
Trade, External Debt & Financial Flows 2000 2009 2010 2011
Export Growth, volume (%) -4.9 -4.7 4.0 -7.1
Import Growth, volume (%) 6.8 18.6 4.8 2.3
Terms of Trade (% change from previous year) 0.2 15.6 1.2 -0.6
Trade Balance ( mn US$) -1,259 -5,729 -6,245 -9,383
Trade balance (% of GDP) -10.0 -19.5 -19.5 -25.3
Current Account ( mn US$) -284 -1,558 -2,170 -4,536
Current Account (% of GDP) -2.3 -5.3 -6.8 -12.2
Debt Service (% of Exports) 27.2 4.6 4.5 4.1
External Debt (% of GDP) 40.0 26.3 27.4 29.1
Net Total Inflows ( mn US$) 862 2,460 1,687 ...
Net Total Official Development Assistance (mn US$) 513 1,776 1,629 ...
Foreign Direct Investment Inflows (mn US$) 111 141 133 ...
External reserves (in month of imports) 2.2 2.6 ... ...
Private Sector Development & Infrastructure 2000 2009 2010 2011
Time required to start a business (days) ... 34 33 33
Investor Protection Index (0-10) ... 5 5 5
Main Telephone Lines (per 1000 people) 9.3 16.8 9.4 ...
Mobile Cellular Subscribers (per 1000 people) 4.1 490.7 616.3 ...
Internet users (000) 3.2 101.3 211.6 ...
Roads, paved (% of total roads) 12.1 14.3 ... ...
Railways, goods transported (million ton-km) 1,492 ... ... ...
* Most recent year Last Update: May 2012
Kenya - Development Indicators
Developing
countries
Source: ADB Statistics Department, based on various national and international sources
KenyaAfricaSocial Indicators
580
Kenya
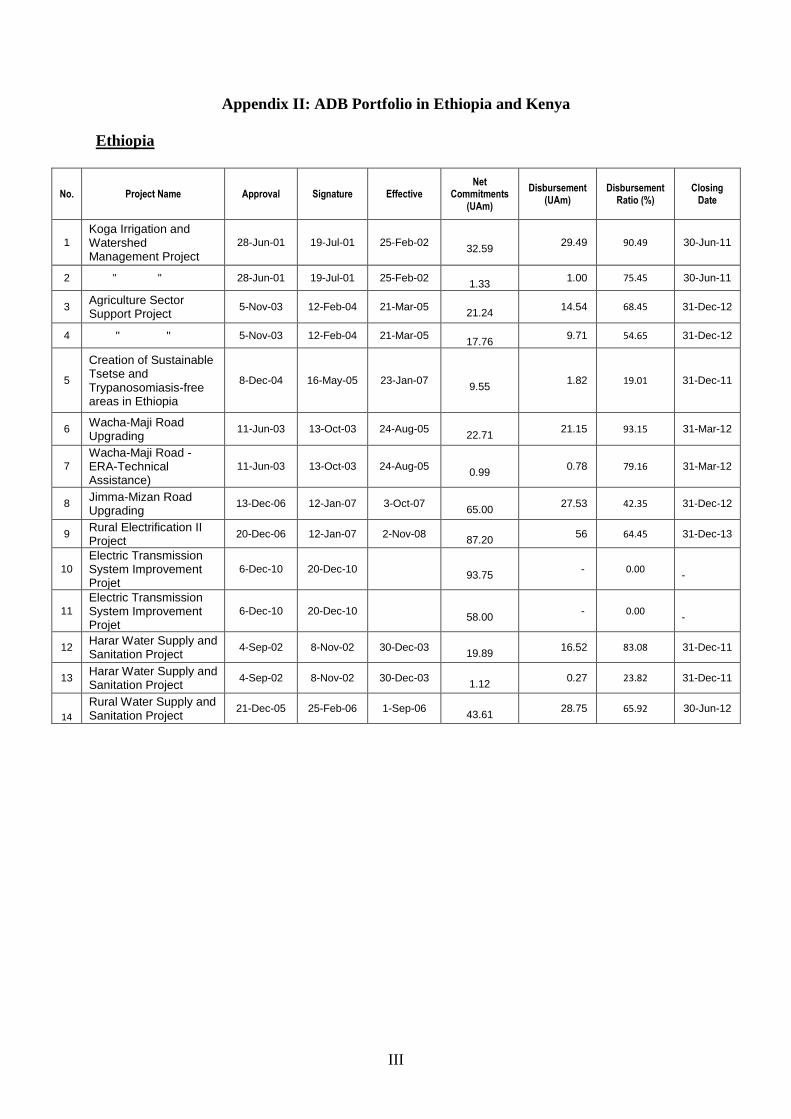
III
Appendix II: ADB Portfolio in Ethiopia and Kenya
Ethiopia
No. Project Name Approval Signature Effective Net
Commitments (UAm)
Disbursement (UAm)
Disbursement Ratio (%)
Closing Date
1
Koga Irrigation and Watershed Management Project
28-Jun-01 19-Jul-01 25-Feb-02
32.59 29.49 90.49 30-Jun-11
2 " " 28-Jun-01 19-Jul-01 25-Feb-02
1.33 1.00 75.45 30-Jun-11
3 Agriculture Sector Support Project
5-Nov-03 12-Feb-04 21-Mar-05
21.24 14.54 68.45 31-Dec-12
4 " " 5-Nov-03 12-Feb-04 21-Mar-05
17.76 9.71 54.65 31-Dec-12
5
Creation of Sustainable Tsetse and Trypanosomiasis-free areas in Ethiopia
8-Dec-04 16-May-05 23-Jan-07
9.55 1.82 19.01 31-Dec-11
6 Wacha-Maji Road Upgrading
11-Jun-03 13-Oct-03 24-Aug-05
22.71 21.15 93.15 31-Mar-12
7
Wacha-Maji Road -ERA-Technical Assistance)
11-Jun-03 13-Oct-03 24-Aug-05
0.99 0.78 79.16 31-Mar-12
8 Jimma-Mizan Road Upgrading
13-Dec-06 12-Jan-07 3-Oct-07
65.00 27.53 42.35 31-Dec-12
9 Rural Electrification II Project
20-Dec-06 12-Jan-07 2-Nov-08
87.20 56 64.45 31-Dec-13
10
Electric Transmission System Improvement Projet
6-Dec-10 20-Dec-10
93.75 - 0.00
-
11
Electric Transmission System Improvement Projet
6-Dec-10 20-Dec-10
58.00 - 0.00
-
12 Harar Water Supply and Sanitation Project
4-Sep-02 8-Nov-02 30-Dec-03
19.89 16.52 83.08 31-Dec-11
13 Harar Water Supply and Sanitation Project
4-Sep-02 8-Nov-02 30-Dec-03
1.12 0.27 23.82 31-Dec-11
14
Rural Water Supply and Sanitation Project
21-Dec-05 25-Feb-06 1-Sep-06
43.61 28.75 65.92 30-Jun-12
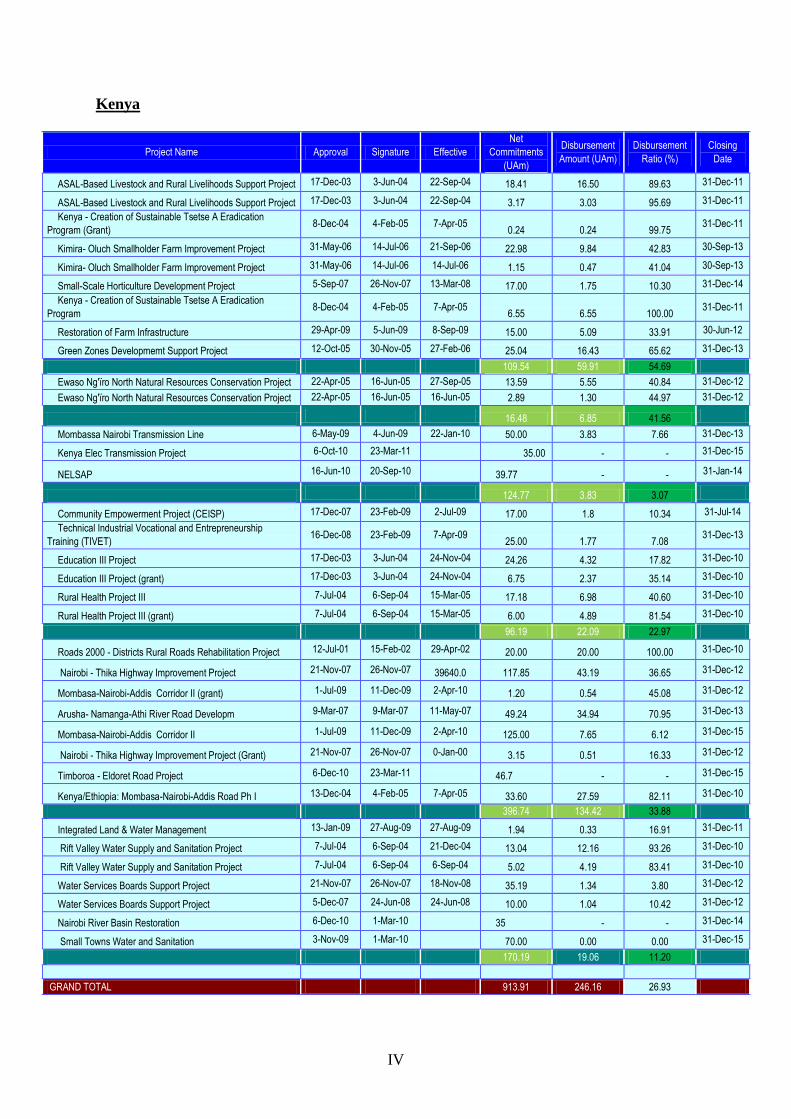
IV
Kenya
Project Name Approval Signature Effective
Net
Commitments
(UAm)
Disbursement
Amount (UAm)
Disbursement
Ratio (%)
Closing
Date
ASAL-Based Livestock and Rural Livelihoods Support Project 17-Dec-03 3-Jun-04 22-Sep-04 18.41 16.50 89.63 31-Dec-11
ASAL-Based Livestock and Rural Livelihoods Support Project 17-Dec-03 3-Jun-04 22-Sep-04 3.17 3.03 95.69 31-Dec-11
Kenya - Creation of Sustainable Tsetse A Eradication
Program (Grant) 8-Dec-04 4-Feb-05 7-Apr-05
0.24 0.24 99.75 31-Dec-11
Kimira- Oluch Smallholder Farm Improvement Project 31-May-06 14-Jul-06 21-Sep-06 22.98 9.84 42.83 30-Sep-13
Kimira- Oluch Smallholder Farm Improvement Project 31-May-06 14-Jul-06 14-Jul-06 1.15 0.47 41.04 30-Sep-13
Small-Scale Horticulture Development Project 5-Sep-07 26-Nov-07 13-Mar-08 17.00 1.75 10.30 31-Dec-14
Kenya - Creation of Sustainable Tsetse A Eradication
Program 8-Dec-04 4-Feb-05 7-Apr-05
6.55 6.55 100.00 31-Dec-11
Restoration of Farm Infrastructure 29-Apr-09 5-Jun-09 8-Sep-09 15.00 5.09 33.91 30-Jun-12
Green Zones Developmemt Support Project 12-Oct-05 30-Nov-05 27-Feb-06 25.04 16.43 65.62 31-Dec-13
109.54 59.91 54.69
Ewaso Ng'ïro North Natural Resources Conservation Project 22-Apr-05 16-Jun-05 27-Sep-05 13.59 5.55 40.84 31-Dec-12
Ewaso Ng'ïro North Natural Resources Conservation Project 22-Apr-05 16-Jun-05 16-Jun-05 2.89 1.30 44.97 31-Dec-12
16.48 6.85 41.56
Mombassa Nairobi Transmission Line 6-May-09 4-Jun-09 22-Jan-10 50.00 3.83 7.66 31-Dec-13
Kenya Elec Transmission Project 6-Oct-10 23-Mar-11 35.00 - - 31-Dec-15
NELSAP 16-Jun-10 20-Sep-10 39.77 - - 31-Jan-14
124.77 3.83 3.07
Community Empowerment Project (CEISP) 17-Dec-07 23-Feb-09 2-Jul-09 17.00 1.8 10.34 31-Jul-14
Technical Industrial Vocational and Entrepreneurship
Training (TIVET) 16-Dec-08 23-Feb-09 7-Apr-09
25.00 1.77 7.08 31-Dec-13
Education III Project 17-Dec-03 3-Jun-04 24-Nov-04 24.26 4.32 17.82 31-Dec-10
Education III Project (grant) 17-Dec-03 3-Jun-04 24-Nov-04 6.75 2.37 35.14 31-Dec-10
Rural Health Project III 7-Jul-04 6-Sep-04 15-Mar-05 17.18 6.98 40.60 31-Dec-10
Rural Health Project III (grant) 7-Jul-04 6-Sep-04 15-Mar-05 6.00 4.89 81.54 31-Dec-10
96.19 22.09 22.97
Roads 2000 - Districts Rural Roads Rehabilitation Project 12-Jul-01 15-Feb-02 29-Apr-02 20.00 20.00 100.00 31-Dec-10
Nairobi - Thika Highway Improvement Project 21-Nov-07 26-Nov-07 39640.0 117.85 43.19 36.65 31-Dec-12
Mombasa-Nairobi-Addis Corridor II (grant) 1-Jul-09 11-Dec-09 2-Apr-10 1.20 0.54 45.08 31-Dec-12
Arusha- Namanga-Athi River Road Developm 9-Mar-07 9-Mar-07 11-May-07 49.24 34.94 70.95 31-Dec-13
Mombasa-Nairobi-Addis Corridor II 1-Jul-09 11-Dec-09 2-Apr-10 125.00 7.65 6.12 31-Dec-15
Nairobi - Thika Highway Improvement Project (Grant) 21-Nov-07 26-Nov-07 0-Jan-00 3.15 0.51 16.33 31-Dec-12
Timboroa - Eldoret Road Project 6-Dec-10 23-Mar-11 46.7 - - 31-Dec-15
Kenya/Ethiopia: Mombasa-Nairobi-Addis Road Ph I 13-Dec-04 4-Feb-05 7-Apr-05 33.60 27.59 82.11 31-Dec-10
396.74 134.42 33.88
Integrated Land & Water Management 13-Jan-09 27-Aug-09 27-Aug-09 1.94 0.33 16.91 31-Dec-11
Rift Valley Water Supply and Sanitation Project 7-Jul-04 6-Sep-04 21-Dec-04 13.04 12.16 93.26 31-Dec-10
Rift Valley Water Supply and Sanitation Project 7-Jul-04 6-Sep-04 6-Sep-04 5.02 4.19 83.41 31-Dec-10
Water Services Boards Support Project 21-Nov-07 26-Nov-07 18-Nov-08 35.19 1.34 3.80 31-Dec-12
Water Services Boards Support Project 5-Dec-07 24-Jun-08 24-Jun-08 10.00 1.04 10.42 31-Dec-12
Nairobi River Basin Restoration 6-Dec-10 1-Mar-10 35 - - 31-Dec-14
Small Towns Water and Sanitation 3-Nov-09 1-Mar-10 70.00 0.00 0.00 31-Dec-15
170.19 19.06 11.20
GRAND TOTAL 913.91 246.16 26.93
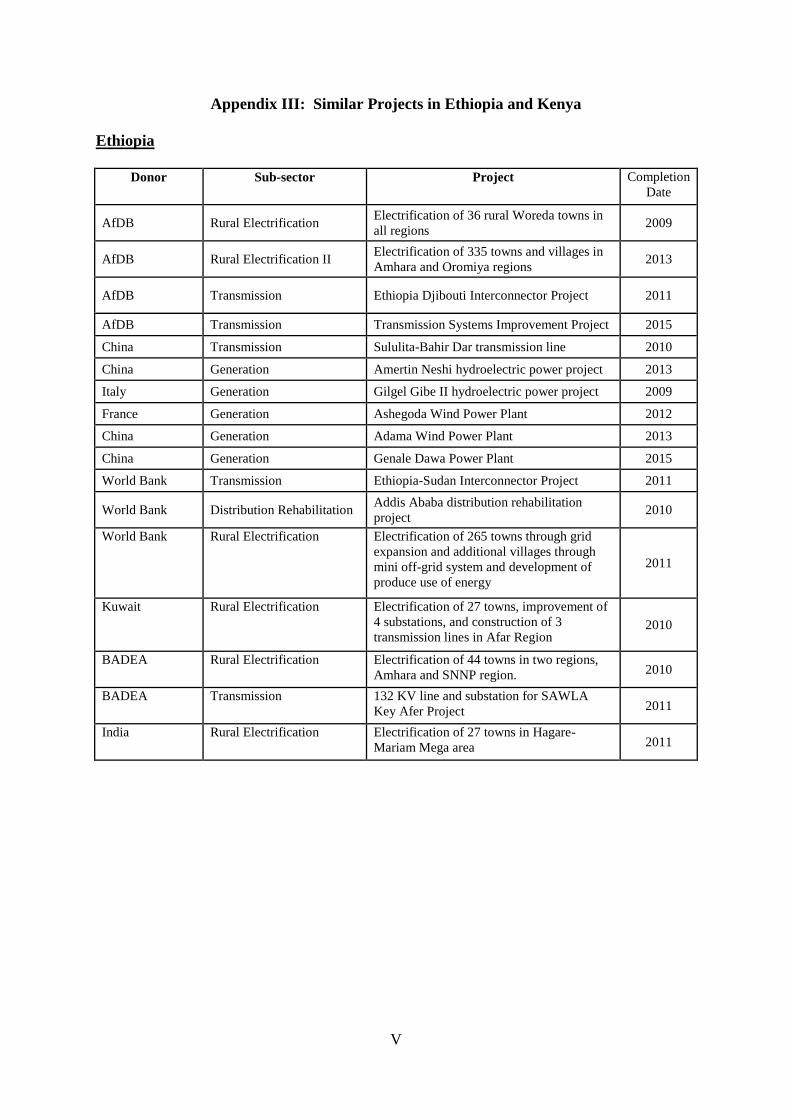
V
Appendix III: Similar Projects in Ethiopia and Kenya
Ethiopia
Donor Sub-sector Project Completion
Date
AfDB Rural Electrification Electrification of 36 rural Woreda towns in
all regions 2009
AfDB Rural Electrification II Electrification of 335 towns and villages in
Amhara and Oromiya regions 2013
AfDB Transmission Ethiopia Djibouti Interconnector Project 2011
AfDB Transmission Transmission Systems Improvement Project 2015
China Transmission Sululita-Bahir Dar transmission line 2010
China Generation Amertin Neshi hydroelectric power project 2013
Italy Generation Gilgel Gibe II hydroelectric power project 2009
France Generation Ashegoda Wind Power Plant 2012
China Generation Adama Wind Power Plant 2013
China Generation Genale Dawa Power Plant 2015
World Bank Transmission Ethiopia-Sudan Interconnector Project 2011
World Bank Distribution Rehabilitation Addis Ababa distribution rehabilitation
project 2010
World Bank Rural Electrification Electrification of 265 towns through grid
expansion and additional villages through
mini off-grid system and development of
produce use of energy
2011
Kuwait Rural Electrification Electrification of 27 towns, improvement of
4 substations, and construction of 3
transmission lines in Afar Region 2010
BADEA Rural Electrification Electrification of 44 towns in two regions,
Amhara and SNNP region. 2010
BADEA Transmission 132 KV line and substation for SAWLA
Key Afer Project 2011
India Rural Electrification Electrification of 27 towns in Hagare-
Mariam Mega area 2011

VI
Kenya
Donor Title Main GoK priority Status Period of
implementation Commitment
in credit currency ('000 000)
Currency
AFD/PROPARCO
Mumias Sugar co-generation
Promotion of renewable energies
Completed 2007/2009 35,00 USD
AFD/PROPARCO
Rabai Thermal Plant Generation capacity expansion
Completed 2008/2011 23,00 EUR
AFD/PROPARCO
Lake Turkana Wind Farm
Promotion of renewable energies
Planned 2011/2015 35,00 EUR
Proparco Olkaria III Promotion of renewable energies
Ongoing 2008/2010 15,00 USD
AFD Olkaria II-3rd Unit Promotion of renewable energies
Completed 2007/2010 20,00 EUR
AFD Olkaria I and IV Project
Promotion of renewable energies
Ongoing 2010/2014 150,00 EUR
AFD Support to the development of renewable energy and geothermal energy
Promotion of renewable energies
Ongoing 2010/2014 56,00 EUR
AFD Renewable Energy and Energy Efficiency credit line
Promotion of renewable energies
Ongoing 2011/2015 30,00 EUR
AfDB Lake Turkana Wind Power
Promotion of renewable energies
Planned 2012-2014 50,00 EUR
AfDB Thika Thermal Power Project
Generation capacity expansion
Planned 2011-2012 26,00 EUR
EIB Olkaria II Extension Promotion of renewable energies
Ongoing 2006-2007 50,00 USD
EIB Olkaria I and IV Project
Promotion of renewable energies
Ongoing 2010/2014 119,00 EUR
Government of
PRC/CHINA EXIMBANK
Olkaria I and IV Geothermal Project
Promotion of renewable energies
Ongoing 2010/2013 95,00 USD
Go Spain Ngong II Wind Project Promotion of renewable energies
Ongoing 2010/2011 20,00 EUR
IDA /WB Energy Sector Recovery Project
Various Ongoing 2005/2010 80,00 USD
IDA/WB Energy Sector Recovery Project Additional financing
Various Ongoing 2009/2013 80,00 USD
IDA/WB Electricity Expansion Project
Various Ongoing 2010-2015 330,00 USD
IDA/IFC/MIGA
Partial Risk Guarantee Project
Generation capacity expansion
Planned - USD
MIGA/WB OrPower4 (Olkaria III) Promotion of renewable energies
Ongoing - USD
JICA Sondu-Miriu Hydropower Project Sang'oro Power Plant
Generation capacity expansion
Ongoing 2007-2012 5 620,00 Yen
JICA Olkaria I Unit 4 and 5 Geothermal Power Project
Generation capacity expansion
Ongoing 2010-2013 29 516,00 Yen
KfW Olkaria IV appraisal drilling (geothermal)
Promotion of renewable energies
Planned 2006-20011 10,60 EUR
KfW Hydropower Plant Kindaruma
Generation capacity expansion
Ongoing 2009-2013 39,10 EUR
KfW Olkaria I and IV Project
Promotion of renewable energies
Planned 2010-2014 60 EUR

VII
KfW/DEG Olkaria III (geothermal)
Promotion of renewable energies
Ongoing 2007-2010 20 USD
KfW/DEG Olkaria III (geothermal)
Promotion of renewable energies
Planned 2011-2014 0 USD
UNEP/GEF Cogen for Africa Promotion of renewable energies
Ongoing 2007/2013 5,25 USD
UNEP/GEF Greening the Tea Industry in East Africa (GTIEA)
Promotion of renewable energies
Ongoing 2007/2011 2,85 USD
UNEP/GEF African Rift Geothermal Development Facility (ARGEO)
Promotion of renewable energies
Ongoing 2010/2015 2,85 USD
UNDP Access to Clean and sustainable energy services
Promotion of renewable energies
Completed 2006 - 2010 0,10 USD
UNIDO Africa Adaptation Programme
Promotion of renewable energies
Ongoing 2010-2011 1,44 USD
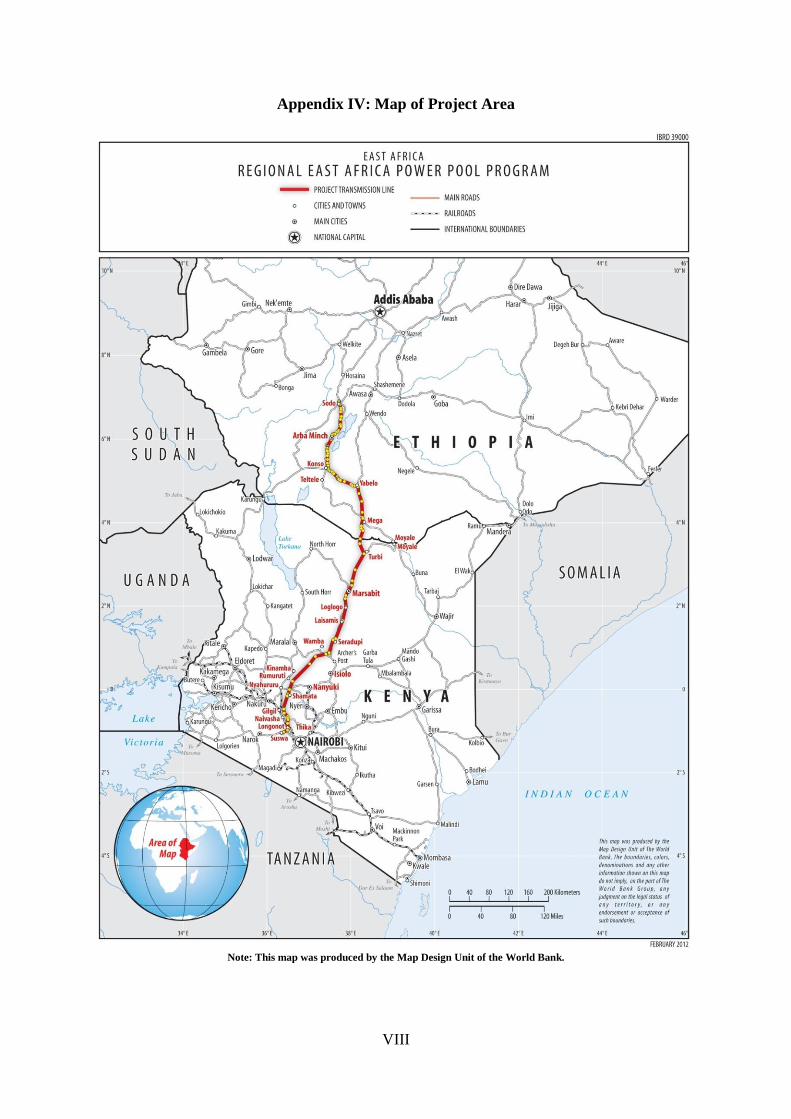
VIII
Appendix IV: Map of Project Area
Note: This map was produced by the Map Design Unit of the World Bank.