1 Analysis of Genes Encoding for Penicillin-Binding Proteins in ...
Upload
vuongthienCategory
view
224download
0
Ethanolamine Controls Expression of Genes Encoding ComponentsInvolved in Interkingdom Signaling and Virulence inEnterohemorrhagic Escherichia coli O157:H7
Melissa M. Kendall,a,b Charley C. Gruber,a,b Christopher T. Parker,a,b and Vanessa Sperandioa,b
Department of Microbiology, University of Texas Southwestern Medical School, Dallas, Texas, USA,a and Department of Biochemistry, University of Texas SouthwesternMedical School, Dallas, Texas, USAb
ABSTRACT Bacterial pathogens must be able to both recognize suitable niches within the host for colonization and successfullycompete with commensal flora for nutrients in order to establish infection. Ethanolamine (EA) is a major component of mam-malian and bacterial membranes and is used by pathogens as a carbon and/or nitrogen source in the gastrointestinal tract. Thedeadly human pathogen enterohemorrhagic Escherichia coli O157:H7 (EHEC) uses EA in the intestine as a nitrogen source as acompetitive advantage for colonization over the microbial flora. Here we show that EA is not only important for nitrogen metab-olism but that it is also used as a signaling molecule in cell-to-cell signaling to activate virulence gene expression in EHEC. EA inconcentrations that cannot promote growth as a nitrogen source can activate expression of EHEC’s repertoire of virulence genes.The EutR transcription factor, known to be the receptor of EA, is only partially responsible for this regulation, suggesting thatyet another EA receptor exists. This important link of EA with metabolism, cell-to-cell signaling, and pathogenesis, highlightsthe fact that a fundamental means of communication within microbial communities relies on energy production and processingof metabolites. Here we show for the first time that bacterial pathogens not only exploit EA as a metabolite but also coopt EA as asignaling molecule to recognize the gastrointestinal environment and promote virulence expression.
IMPORTANCE In order to successfully cause disease, a pathogen must be able to sense a host environment and modulate expres-sion of its virulence genes as well as compete with the indigenous microbiota for nutrients. Ethanolamine (EA) is present in thelarge intestine due to the turnover of intestinal cells. Here, we show that the human pathogen Escherichia coli O157:H7, whichcauses bloody diarrhea and hemolytic-uremic syndrome, regulates virulence gene expression through EA metabolism and byresponding to EA as a signal. These findings provide the first information directly linking EA with bacterial pathogenesis.
Received 24 February 2012 Accepted 23 April 2012 Published 15 May 2012
Citation Kendall MM, Gruber CC, Parker CT, Sperandio V. 2012. Ethanolamine controls expression of genes encoding components involved in interkingdom signaling andvirulence in enterohemorrhagic Escherichia coli O157:H7. mBio 3(3):e00050-12. doi:10.1128/mBio.00050-12
Editor Jo Handelsman, Yale University
Copyright © 2012 Kendall et al. This is an open-access article distributed under the terms of the Creative Commons Attribution-Noncommercial-Share Alike 3.0 UnportedLicense, which permits unrestricted noncommercial use, distribution, and reproduction in any medium, provided the original author and source are credited.
Address correspondence to Vanessa Sperandio, [email protected].
To establish infection, bacterial pathogens must be able to sensethe host environment, express genes essential for colonization
and virulence, and compete with commensal flora for nutrients.Ethanolamine (EA) is a major component of both bacterial andmammalian cell membranes (1–3), and the rapid turnover andexfoliation of intestinal cells releases EA into the intestine (4, 5).The ability to use ethanolamine as a noncompetitive source ofcarbon and/or nitrogen may aid a pathogen in colonizing the host(6); however, it is currently not known whether EA directly influ-ences a pathogen’s ability to recognize the host environmentand/or coordinate expression of virulence genes.
Enterohemorrhagic Escherichia coli O157:H7 (EHEC) is afood-borne pathogen that causes bloody diarrhea and hemolytic-uremic syndrome (HUS) worldwide (7). In the intestines, EHECcauses the formation of attaching and effacing (AE) lesions thatare characterized by the destruction of microvilli and rearrange-ment of the cytoskeleton to form a pedestal-like structure thatcups the bacteria individually (8). Most of the genes involved inAE lesion formation are carried on the locus of enterocyte efface-
ment (LEE) pathogenicity island (9). Additionally, EHEC pro-duces Shiga toxin (Stx). Stx is responsible for the severe compli-cations associated with diseases caused by EHEC, includinghemorrhagic colitis, and HUS, which may be fatal (7). EHEC vir-ulence gene regulation is complex and involves interkingdom sig-naling. EHEC carries genes that encode the sensor kinases QseCand QseE that recognize diverse environmental signals, includingthe host hormones epinephrine (EPI) and norepinephrine (NE),to coordinate expression of its virulence genes (10, 11). The tran-scriptional regulator QseA is also part of EHEC’s regulatory cas-cade through its direct interaction and activation of ler, the masterregulator of the LEE genes (12) and of putative virulence genes(13). Although previous studies have suggested a role for EA inbacterial pathogenesis (reviewed in reference 14), we demonstratefor the first time a direct role for EA in virulence gene regulation ofa bacterial pathogen. Furthermore, we show that EA stimulatesvirulence gene expression not only due to metabolism, but alsothrough signaling when EA is present at concentrations that areinsufficient to support growth.
RESEARCH ARTICLE
May/June 2012 Volume 3 Issue 3 e00050-12 ® mbio.asm.org 1
on August 20, 2018 by guest
http://mbio.asm
.org/D
ownloaded from

RESULTS AND DISCUSSIONEA regulates virulence gene expression. The ability to harvestnutrients is fundamental for the successful colonization of thegastrointestinal (GI) tract by a bacterium. Pathogens have to com-pete for nutrients with the members of the indigenous microbiota,which far outnumber them. Hence, one advantage for pathogensis to proficiently use nutrients to gain a competitive advantageover the microbiota. EA is an abundant source of carbon andnitrogen in the intestine and is used as a nitrogen source by EHECin the GI tracts of mammals (15). Genes that encode componentsinvolved in EA metabolism have been identified in many mem-bers of the family Enterobacteriaceae (16), and organization of theeut (ethanolamine utilization) operon is similar in EHEC and Sal-monella (17–19). The eut operon is comprised of 17 genes thatcode for components involved in transport and catabolism of EA,as well as homologs of carboxysome shell proteins (18, 20–24).The eut operon also contains genes that encode EutR, which acti-vates expression of the entire eut (ethanolamine utilization)operon in response to EA and vitamin B12 (20, 22).
We first investigated the ability of EHEC strain 86-24 to growon a modified minimal M9 medium (25) with EA (EA medium) asthe sole carbon or nitrogen source. Our initial studies were con-ducted aerobically with 30 mM EA and 150 nM vitamin B12, con-ditions frequently used to study the EA metabolism in E. coli andSalmonella (20, 23, 24, 26–29). EHEC grew using EA as a nitrogensource, although its growth was slower than growth with NH4 orglutamine. EHEC strain 86-24 did not grow when EA served as the
sole carbon source under aerobic or anaerobic conditions (datanot shown). These results are consistent with EA metabolism inEHEC strain EDL933 for which it was previously reported thatEHEC can use EA only as a nitrogen source and not as a carbonsource (15).
The utilization of EA as a nitrogen source during growth in theGI tract confers a competitive advantage to EHEC (15). However,it has never been investigated whether EA could also modulatevirulence gene expression in bacterial pathogens. Hence, we com-pared virulence gene expression in EHEC cells grown with NH4 orEA. We first examined expression of the qseC and qseE genes thatencode global regulators in EHEC (10, 11). Transcription of thesegenes was significantly increased in EA medium at early and mid-log growth phases compared to EHEC grown with NH4, and nosignificant differences in gene expression were measured at late loggrowth phase (Fig. 1A). The sensor kinases QseC and QseE playcritical roles in EHEC gene expression by integrating environmen-tal cues present in the human GI tract and activating virulencegenes. In response to EPI, phosphate, or sulfate, QseE autophos-phorylates and subsequently phosphorylates its cognate responseregulator (RR) QseF that in turn promotes AE lesion formationand Stx production (11, 30). QseC senses EPI, NE, and the bacte-rial signaling molecule autoinducer-3 (AI-3) to increase phos-phorylation (10, 31). QseC then phosphorylates its cognate RRQseB that activates flagella (32). QseC can also phosphorylate theresponse regulators KdpE, which activates ler, and QseF (33).These data suggest that EA metabolism induces expression of
FIG 1 EA increases expression of EHEC virulence genes. (A) qRT-PCR of qseC and qseE of WT EHEC strain 86-24 grown in minimal medium containingglucose (glucose minimal medium) and either NH4, EA, or NH4 plus EA to early, mid-, and late log growth phases. (B) qRT-PCR of ler of WT EHEC grown inglucose minimal medium containing either NH4, EA, or NH4 plus EA to early, mid-, and late log phases. (C) Western blots of secreted proteins from WT EHECgrown to late log in glucose minimal medium containing either NH4 or EA probed with antisera against EspA from WT EHEC grown to late log. BSA, bovineserum albumin. (D) qRT-PCR of stx2a of WT EHEC grown in glucose minimal medium containing either NH4, EA, or NH4 plus EA to early, mid-, and late log.(E) Western blots of whole-cell lysates of WT EHEC grown in glucose minimal medium containing either NH4 or EA to mid log with antisera against Stx andRpoA (loading control). qRT-PCR expression values in panels A, B, and D are presented as relative values compared to the value for WT EHEC strain 86-24grown with NH4. Values are means plus standard deviations (error bars) for 3 independent experiments. Values that are significantly different from the value forWT EHEC strain 86-24 grown with NH4 are indicated by asterisks as follows: *, P � 0.05; **, P � 0.005; ***, P � 0.0005.
Kendall et al.
2 ® mbio.asm.org May/June 2012 Volume 3 Issue 3 e00050-12
on August 20, 2018 by guest
http://mbio.asm
.org/D
ownloaded from

genes necessary for EHEC to integrate environmental signals andconsequently activate virulence genes.
We also examined expression of ler (Fig. 1B). At early logphase, ler expression is increased more than 15-fold when EHEC isgrown with EA as the sole nitrogen source and ler expression con-tinued to be significantly increased at mid-log phase. At late logphase, ler transcription was decreased in minimal medium withEA only. The LEE encodes a type III secretion system (TSS) thatinjects bacterial effectors into host cells as well as the translocon ofthis system made up of EspA, EspB, and EspD that are secretedthrough the TTS. EHEC secreted proteins can be detected at latelog phase; therefore, we examined EspA expression at this timepoint (Fig. 1C). Expression of EspA was decreased in cells grownwith EA compared to cells grown with NH4. These data agreedwith the ler transcription data.
Mortality due to EHEC-caused disease is most commonly as-sociated with the production of Stx; thus, we examined how EAaffected Stx expression (Fig. 1D and E). Expression of the stx2agene that encodes Stx was most significantly increased duringearly and mid-log growth phases in EA medium at both the tran-scriptional and translational levels (Fig. 1D). At late log phase, nosignificant differences in expression were observed for EHECgrown in the NH4 or EA medium.
To confirm that the increase in gene expression was due togrowth on EA, as opposed to NH4 causing a decrease in expres-sion, we grew EHEC cells with glucose and both EA and NH4 asnitrogen sources and measured gene expression at early log phase.When cells were grown aerobically in the presence of alternativenitrogen sources, EA metabolism did not seem to play a role in qseexpression, as no significant differences in expression were ob-served in EHEC cells grown with both EA and NH4 compared toEHEC cells grown with NH4 only (Fig. 1A). However, expressionof the ler gene, which is carried on LEE, the espA gene, which iscarried in LEE4, and the eae gene, which is carried in LEE5, as wellas stx2a was significantly increased in EHEC cells grown with bothEA and NH4 compared to EHEC cells grown with NH4 only(Fig. 1B and D). These data indicate that EA metabolism is impor-tant for assimilating environmental information by activating ex-pression of major EHEC regulators and virulence factors. Thegreatest differences in gene expression were measured at early loggrowth phase, suggesting that EA metabolism and/or that EA rec-ognition trigger induction of virulence genes that allows for rapidadaptation to the host environment.
Expression of the eut genes in EHEC grown with alternativeN sources. The GI tract contains several nitrogen sources availableto commensal and pathogenic bacteria (34). To better understand
expression of the genes encoding components involved in EA me-tabolism and their roles in EHEC gene regulation, we examinedexpression of eutR, eutB, which encodes the EA lyase large subunit(20, 21), and eutS, which encodes a carboxysome structural pro-tein (18) in EHEC cells grown in Dulbecco’s modified Eagle me-dium (DMEM) with or without the addition of EA (Fig. 2A to C).DMEM contains glutamine as the major nitrogen source, which ismetabolized by EHEC, and DMEM promotes expression of theLEE (35). These studies were conducted using both low- and high-glucose conditions (5.56 mM and 25 mM glucose, respectively),because a previous study showed that EutBC activity was de-creased when E. coli was grown with glucose compared to glycerol,potentially due to catabolite repression (36). Our data indicatedthat expression of eutR, eutB, and eutS was very significantly in-creased in EHEC cells grown with EA compared to EHEC cellsgrown in the absence of EA under both low- and high-glucoseconditions (Fig. 2A to C). Because expression of these genes washighest when EHEC cells were grown in the low-glucose DMEM,all subsequent experiments were performed using this medium.Additionally, expression of eut genes in EHEC cells grown withalternative nitrogen sources suggests that EHEC metabolizes EAeven when alternative nitrogen sources are available. These dataare consistent with previous work that showed that E. coli strainNCIB8114 metabolized EA when grown in the presence of bothEA and NH4 (29).
EHEC carries genes that encode two sensors that respond toEA. To better elucidate the role of EA in virulence gene regulation,we constructed an isogenic eutR mutant in EHEC (strain MK37).The eutR mutant did not grow in minimal medium with EA andvitamin B12, whereas growth in minimal medium was restoredupon complementation with eutR expressed on a plasmid (strainMK41; data not shown). Subsequently, we examined expressionof the qse, ler, and stx2a genes in wild-type (WT) EHEC strain86-24 and the eutR mutant MK37 grown aerobically in Dulbecco’smodified Eagle medium with or without the addition of EA atearly, mid-, and late log growth stages. At early log phase, expres-sion of the global signaling genes qseC and qseE was significantlyincreased when EA was added to the medium, and this effect wasslightly diminished at mid-log phase. At late log phase, no signif-icant differences were observed in qseC or qseE expression inEHEC cells grown in DMEM or DMEM plus EA (Fig. 3A). Thesedata are consistent with previous experiments that examined qseexpression in EHEC cells grown in minimal medium with both EAand NH4 (Fig. 1A).
Next, we measured expression of the LEE genes (Fig. 3B andC). During growth at early log phase, ler expression in WT EHEC
FIG 2 Expression of the eut operon genes eutR (A), eutB (B), and eutS (C) is induced in cells grown with EA in both low- and high-glucose media. qRT-PCRexpression values are presented as relative values compared to WT EHEC strain 86-24 grown in low-glucose DMEM without EA. Error bars represent thestandard deviations for 3 independent experiments. **, P � 0.005; ***, P � 0.0005.
Ethanolamine Regulation of EHEC Virulence
May/June 2012 Volume 3 Issue 3 e00050-12 ® mbio.asm.org 3
on August 20, 2018 by guest
http://mbio.asm
.org/D
ownloaded from
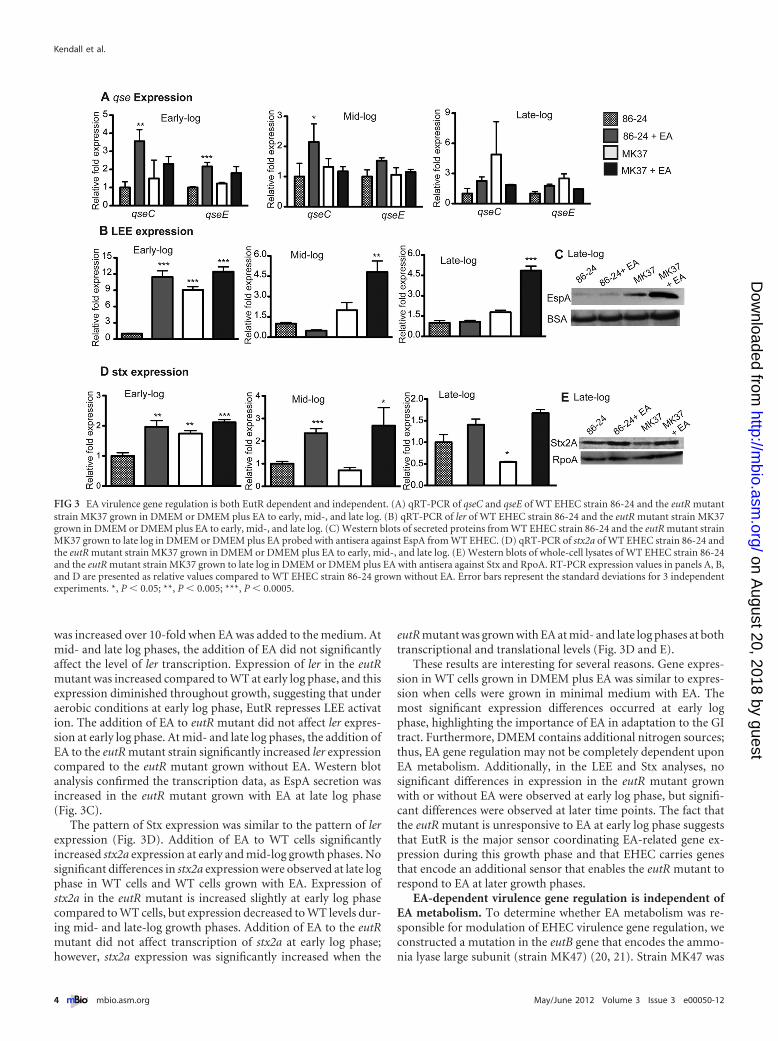
was increased over 10-fold when EA was added to the medium. Atmid- and late log phases, the addition of EA did not significantlyaffect the level of ler transcription. Expression of ler in the eutRmutant was increased compared to WT at early log phase, and thisexpression diminished throughout growth, suggesting that underaerobic conditions at early log phase, EutR represses LEE activation. The addition of EA to eutR mutant did not affect ler expres-sion at early log phase. At mid- and late log phases, the addition ofEA to the eutR mutant strain significantly increased ler expressioncompared to the eutR mutant grown without EA. Western blotanalysis confirmed the transcription data, as EspA secretion wasincreased in the eutR mutant grown with EA at late log phase(Fig. 3C).
The pattern of Stx expression was similar to the pattern of lerexpression (Fig. 3D). Addition of EA to WT cells significantlyincreased stx2a expression at early and mid-log growth phases. Nosignificant differences in stx2a expression were observed at late logphase in WT cells and WT cells grown with EA. Expression ofstx2a in the eutR mutant is increased slightly at early log phasecompared to WT cells, but expression decreased to WT levels dur-ing mid- and late-log growth phases. Addition of EA to the eutRmutant did not affect transcription of stx2a at early log phase;however, stx2a expression was significantly increased when the
eutR mutant was grown with EA at mid- and late log phases at bothtranscriptional and translational levels (Fig. 3D and E).
These results are interesting for several reasons. Gene expres-sion in WT cells grown in DMEM plus EA was similar to expres-sion when cells were grown in minimal medium with EA. Themost significant expression differences occurred at early logphase, highlighting the importance of EA in adaptation to the GItract. Furthermore, DMEM contains additional nitrogen sources;thus, EA gene regulation may not be completely dependent uponEA metabolism. Additionally, in the LEE and Stx analyses, nosignificant differences in expression in the eutR mutant grownwith or without EA were observed at early log phase, but signifi-cant differences were observed at later time points. The fact thatthe eutR mutant is unresponsive to EA at early log phase suggeststhat EutR is the major sensor coordinating EA-related gene ex-pression during this growth phase and that EHEC carries genesthat encode an additional sensor that enables the eutR mutant torespond to EA at later growth phases.
EA-dependent virulence gene regulation is independent ofEA metabolism. To determine whether EA metabolism was re-sponsible for modulation of EHEC virulence gene regulation, weconstructed a mutation in the eutB gene that encodes the ammo-nia lyase large subunit (strain MK47) (20, 21). Strain MK47 was
FIG 3 EA virulence gene regulation is both EutR dependent and independent. (A) qRT-PCR of qseC and qseE of WT EHEC strain 86-24 and the eutR mutantstrain MK37 grown in DMEM or DMEM plus EA to early, mid-, and late log. (B) qRT-PCR of ler of WT EHEC strain 86-24 and the eutR mutant strain MK37grown in DMEM or DMEM plus EA to early, mid-, and late log. (C) Western blots of secreted proteins from WT EHEC strain 86-24 and the eutR mutant strainMK37 grown to late log in DMEM or DMEM plus EA probed with antisera against EspA from WT EHEC. (D) qRT-PCR of stx2a of WT EHEC strain 86-24 andthe eutR mutant strain MK37 grown in DMEM or DMEM plus EA to early, mid-, and late log. (E) Western blots of whole-cell lysates of WT EHEC strain 86-24and the eutR mutant strain MK37 grown to late log in DMEM or DMEM plus EA with antisera against Stx and RpoA. RT-PCR expression values in panels A, B,and D are presented as relative values compared to WT EHEC strain 86-24 grown without EA. Error bars represent the standard deviations for 3 independentexperiments. *, P � 0.05; **, P � 0.005; ***, P � 0.0005.
Kendall et al.
4 ® mbio.asm.org May/June 2012 Volume 3 Issue 3 e00050-12
on August 20, 2018 by guest
http://mbio.asm
.org/D
ownloaded from
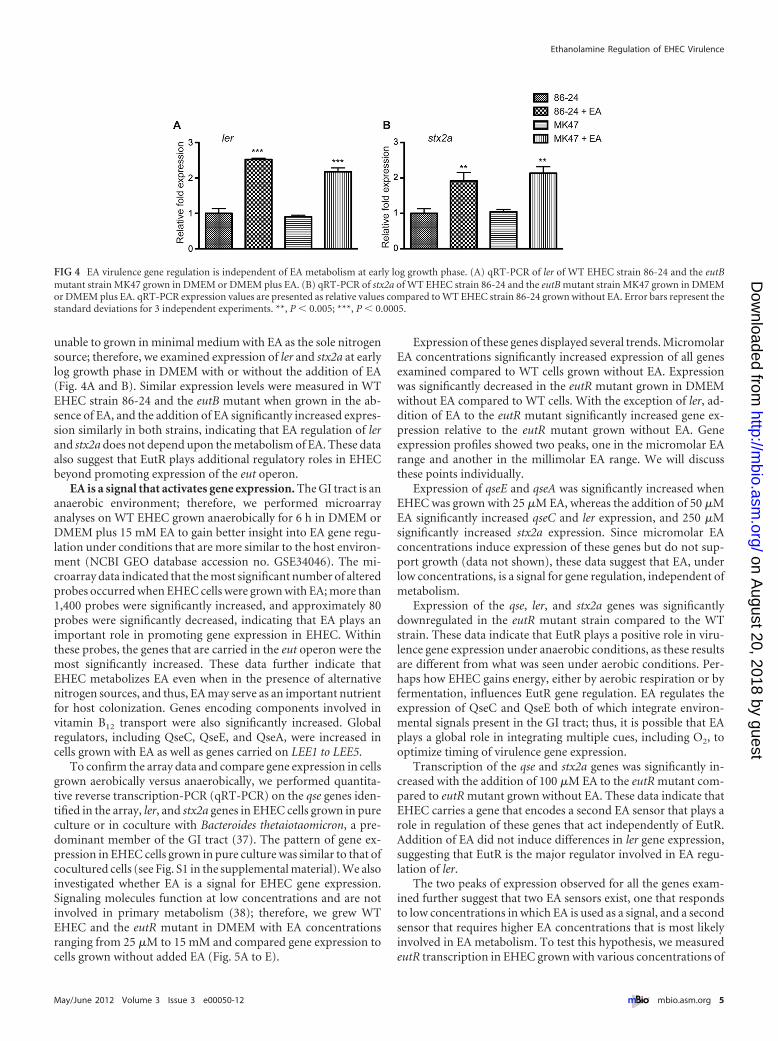
unable to grown in minimal medium with EA as the sole nitrogensource; therefore, we examined expression of ler and stx2a at earlylog growth phase in DMEM with or without the addition of EA(Fig. 4A and B). Similar expression levels were measured in WTEHEC strain 86-24 and the eutB mutant when grown in the ab-sence of EA, and the addition of EA significantly increased expres-sion similarly in both strains, indicating that EA regulation of lerand stx2a does not depend upon the metabolism of EA. These dataalso suggest that EutR plays additional regulatory roles in EHECbeyond promoting expression of the eut operon.
EA is a signal that activates gene expression. The GI tract is ananaerobic environment; therefore, we performed microarrayanalyses on WT EHEC grown anaerobically for 6 h in DMEM orDMEM plus 15 mM EA to gain better insight into EA gene regu-lation under conditions that are more similar to the host environ-ment (NCBI GEO database accession no. GSE34046). The mi-croarray data indicated that the most significant number of alteredprobes occurred when EHEC cells were grown with EA; more than1,400 probes were significantly increased, and approximately 80probes were significantly decreased, indicating that EA plays animportant role in promoting gene expression in EHEC. Withinthese probes, the genes that are carried in the eut operon were themost significantly increased. These data further indicate thatEHEC metabolizes EA even when in the presence of alternativenitrogen sources, and thus, EA may serve as an important nutrientfor host colonization. Genes encoding components involved invitamin B12 transport were also significantly increased. Globalregulators, including QseC, QseE, and QseA, were increased incells grown with EA as well as genes carried on LEE1 to LEE5.
To confirm the array data and compare gene expression in cellsgrown aerobically versus anaerobically, we performed quantita-tive reverse transcription-PCR (qRT-PCR) on the qse genes iden-tified in the array, ler, and stx2a genes in EHEC cells grown in pureculture or in coculture with Bacteroides thetaiotaomicron, a pre-dominant member of the GI tract (37). The pattern of gene ex-pression in EHEC cells grown in pure culture was similar to that ofcocultured cells (see Fig. S1 in the supplemental material). We alsoinvestigated whether EA is a signal for EHEC gene expression.Signaling molecules function at low concentrations and are notinvolved in primary metabolism (38); therefore, we grew WTEHEC and the eutR mutant in DMEM with EA concentrationsranging from 25 �M to 15 mM and compared gene expression tocells grown without added EA (Fig. 5A to E).
Expression of these genes displayed several trends. MicromolarEA concentrations significantly increased expression of all genesexamined compared to WT cells grown without EA. Expressionwas significantly decreased in the eutR mutant grown in DMEMwithout EA compared to WT cells. With the exception of ler, ad-dition of EA to the eutR mutant significantly increased gene ex-pression relative to the eutR mutant grown without EA. Geneexpression profiles showed two peaks, one in the micromolar EArange and another in the millimolar EA range. We will discussthese points individually.
Expression of qseE and qseA was significantly increased whenEHEC was grown with 25 �M EA, whereas the addition of 50 �MEA significantly increased qseC and ler expression, and 250 �Msignificantly increased stx2a expression. Since micromolar EAconcentrations induce expression of these genes but do not sup-port growth (data not shown), these data suggest that EA, underlow concentrations, is a signal for gene regulation, independent ofmetabolism.
Expression of the qse, ler, and stx2a genes was significantlydownregulated in the eutR mutant strain compared to the WTstrain. These data indicate that EutR plays a positive role in viru-lence gene expression under anaerobic conditions, as these resultsare different from what was seen under aerobic conditions. Per-haps how EHEC gains energy, either by aerobic respiration or byfermentation, influences EutR gene regulation. EA regulates theexpression of QseC and QseE both of which integrate environ-mental signals present in the GI tract; thus, it is possible that EAplays a global role in integrating multiple cues, including O2, tooptimize timing of virulence gene expression.
Transcription of the qse and stx2a genes was significantly in-creased with the addition of 100 �M EA to the eutR mutant com-pared to eutR mutant grown without EA. These data indicate thatEHEC carries a gene that encodes a second EA sensor that plays arole in regulation of these genes that act independently of EutR.Addition of EA did not induce differences in ler gene expression,suggesting that EutR is the major regulator involved in EA regu-lation of ler.
The two peaks of expression observed for all the genes exam-ined further suggest that two EA sensors exist, one that respondsto low concentrations in which EA is used as a signal, and a secondsensor that requires higher EA concentrations that is most likelyinvolved in EA metabolism. To test this hypothesis, we measuredeutR transcription in EHEC grown with various concentrations of
FIG 4 EA virulence gene regulation is independent of EA metabolism at early log growth phase. (A) qRT-PCR of ler of WT EHEC strain 86-24 and the eutBmutant strain MK47 grown in DMEM or DMEM plus EA. (B) qRT-PCR of stx2a of WT EHEC strain 86-24 and the eutB mutant strain MK47 grown in DMEMor DMEM plus EA. qRT-PCR expression values are presented as relative values compared to WT EHEC strain 86-24 grown without EA. Error bars represent thestandard deviations for 3 independent experiments. **, P � 0.005; ***, P � 0.0005.
Ethanolamine Regulation of EHEC Virulence
May/June 2012 Volume 3 Issue 3 e00050-12 ® mbio.asm.org 5
on August 20, 2018 by guest
http://mbio.asm
.org/D
ownloaded from

FIG 5 EA gene regulation in anaerobic conditions. (A) qRT-PCR of qseC in WT EHEC strain 86-24 and the eutR mutant strain MK37 in DMEM or DMEM plusEA. (B) qRT-PCR of qseE in WT EHEC strain 86-24 and the eutR mutant strain MK37 in DMEM or DMEM plus EA. (C) qRT-PCR of qseA in WT EHEC strain86-24 and the eutR mutant strain MK37 in DMEM or DMEM plus EA. (D) qRT-PCR of ler in WT EHEC strain 86-24 and the eutR mutant strain MK37 in DMEMor DMEM plus EA. (E) qRT-PCR of stx2a in WT EHEC and eutR mutant strain MK37 in DMEM or DMEM plus EA. (F) qRT-PCR of eutR in WT EHEC grownin DMEM or DMEM plus EA and the eutR mutant strain MK37 grown in DMEM. The concentrations of EA (micromolar and millimolar) are shown on the xaxes. qRT-PCR expression values are presented as relative values compared to WT EHEC strain 86-24 grown without EA. Error bars represent the standarddeviations for 3 independent experiments. Statistical significance is indicated by symbols as follows. The asterisks indicate significance in gene expression betweenWT EHEC cells (0 �M EA), WT EHEC cells grown with EA, and the eutR mutant strain (0 �M EA): *, P � 0.05; **, P � 0.005; ***, P � 0.0005. The carets indicatesignificance in gene expression between the eutR mutant (0 �M EA) and eutR mutant cells grown with EA: ^, P � 0.05; ^^, P � 0.005; ^^^, P � 0.0005.
Kendall et al.
6 ® mbio.asm.org May/June 2012 Volume 3 Issue 3 e00050-12
on August 20, 2018 by guest
http://mbio.asm
.org/D
ownloaded from
EA (Fig. 5F). The data revealed that micromolar EA concentra-tions were not sufficient to significantly increase eutR expressioncompared to WT cells grown without EA. However, the additionof 1 to 15 mM EA greatly increased eutR expression. These data arenot surprising, because it would be energetically expensive to up-regulate the genes involved in EA metabolism, including thosethat encode the carboxysome shell proteins (18). However, thesedata are intriguing. On the basis of the results of the DMEM timecourse experiments (Fig. 3), we hypothesized that EutR was themajor sensor of EA at early log phase and that a second sensor wasresponsible for EA gene regulation at later growth phases. EA con-centrations would be highest at earlier time points, during whichEutR is expressed and involved in EA-related gene expression andmetabolism. As EA is consumed, regulation by the second sensorthat responds to EA as a signal becomes apparent. Expression ofqseC, qseE, qseA and stx2a in the eutR mutant increased when cellswere grown with 100 �M EA, highlighting that the second sensorresponds to low EA concentrations.
To determine the global role of EA signaling-related gene reg-ulation in EHEC, we also performed microarray analyses andcompared gene expression of EHEC cells grown in the absence ofEA to EHEC cells grown with 50 �M EA. These data revealed thatnearly 200 probes were significantly increased and about 700 weremildly increased, whereas 50 probes were significantly decreasedin cells grown with micromolar EA concentrations. The results ofthese analyses indicate that EA signaling is important in EHECgene regulation but that EutR/metabolism-based regulation ismore extensive. Current studies are being undertaken to identifythe second EA sensor and to more clearly elucidate the roles ofEutR and the second EA sensor in EHEC virulence gene expres-sion.
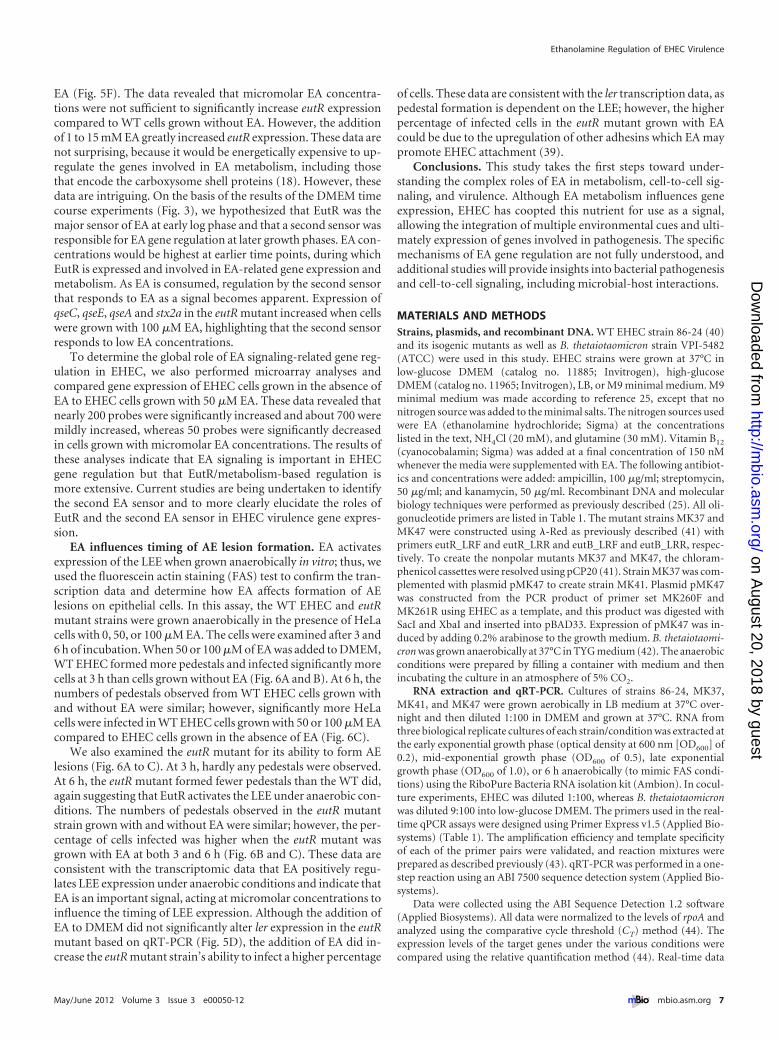
EA influences timing of AE lesion formation. EA activatesexpression of the LEE when grown anaerobically in vitro; thus, weused the fluorescein actin staining (FAS) test to confirm the tran-scription data and determine how EA affects formation of AElesions on epithelial cells. In this assay, the WT EHEC and eutRmutant strains were grown anaerobically in the presence of HeLacells with 0, 50, or 100 �M EA. The cells were examined after 3 and6 h of incubation. When 50 or 100 �M of EA was added to DMEM,WT EHEC formed more pedestals and infected significantly morecells at 3 h than cells grown without EA (Fig. 6A and B). At 6 h, thenumbers of pedestals observed from WT EHEC cells grown withand without EA were similar; however, significantly more HeLacells were infected in WT EHEC cells grown with 50 or 100 �M EAcompared to EHEC cells grown in the absence of EA (Fig. 6C).
We also examined the eutR mutant for its ability to form AElesions (Fig. 6A to C). At 3 h, hardly any pedestals were observed.At 6 h, the eutR mutant formed fewer pedestals than the WT did,again suggesting that EutR activates the LEE under anaerobic con-ditions. The numbers of pedestals observed in the eutR mutantstrain grown with and without EA were similar; however, the per-centage of cells infected was higher when the eutR mutant wasgrown with EA at both 3 and 6 h (Fig. 6B and C). These data areconsistent with the transcriptomic data that EA positively regu-lates LEE expression under anaerobic conditions and indicate thatEA is an important signal, acting at micromolar concentrations toinfluence the timing of LEE expression. Although the addition ofEA to DMEM did not significantly alter ler expression in the eutRmutant based on qRT-PCR (Fig. 5D), the addition of EA did in-crease the eutR mutant strain’s ability to infect a higher percentage
of cells. These data are consistent with the ler transcription data, aspedestal formation is dependent on the LEE; however, the higherpercentage of infected cells in the eutR mutant grown with EAcould be due to the upregulation of other adhesins which EA maypromote EHEC attachment (39).
Conclusions. This study takes the first steps toward under-standing the complex roles of EA in metabolism, cell-to-cell sig-naling, and virulence. Although EA metabolism influences geneexpression, EHEC has coopted this nutrient for use as a signal,allowing the integration of multiple environmental cues and ulti-mately expression of genes involved in pathogenesis. The specificmechanisms of EA gene regulation are not fully understood, andadditional studies will provide insights into bacterial pathogenesisand cell-to-cell signaling, including microbial-host interactions.
MATERIALS AND METHODSStrains, plasmids, and recombinant DNA. WT EHEC strain 86-24 (40)and its isogenic mutants as well as B. thetaiotaomicron strain VPI-5482(ATCC) were used in this study. EHEC strains were grown at 37°C inlow-glucose DMEM (catalog no. 11885; Invitrogen), high-glucoseDMEM (catalog no. 11965; Invitrogen), LB, or M9 minimal medium. M9minimal medium was made according to reference 25, except that nonitrogen source was added to the minimal salts. The nitrogen sources usedwere EA (ethanolamine hydrochloride; Sigma) at the concentrationslisted in the text, NH4Cl (20 mM), and glutamine (30 mM). Vitamin B12
(cyanocobalamin; Sigma) was added at a final concentration of 150 nMwhenever the media were supplemented with EA. The following antibiot-ics and concentrations were added: ampicillin, 100 �g/ml; streptomycin,50 �g/ml; and kanamycin, 50 �g/ml. Recombinant DNA and molecularbiology techniques were performed as previously described (25). All oli-gonucleotide primers are listed in Table 1. The mutant strains MK37 andMK47 were constructed using �-Red as previously described (41) withprimers eutR_LRF and eutR_LRR and eutB_LRF and eutB_LRR, respec-tively. To create the nonpolar mutants MK37 and MK47, the chloram-phenicol cassettes were resolved using pCP20 (41). Strain MK37 was com-plemented with plasmid pMK47 to create strain MK41. Plasmid pMK47was constructed from the PCR product of primer set MK260F andMK261R using EHEC as a template, and this product was digested withSacI and XbaI and inserted into pBAD33. Expression of pMK47 was in-duced by adding 0.2% arabinose to the growth medium. B. thetaiotaomi-cron was grown anaerobically at 37°C in TYG medium (42). The anaerobicconditions were prepared by filling a container with medium and thenincubating the culture in an atmosphere of 5% CO2.
RNA extraction and qRT-PCR. Cultures of strains 86-24, MK37,MK41, and MK47 were grown aerobically in LB medium at 37°C over-night and then diluted 1:100 in DMEM and grown at 37°C. RNA fromthree biological replicate cultures of each strain/condition was extracted atthe early exponential growth phase (optical density at 600 nm [OD600] of0.2), mid-exponential growth phase (OD600 of 0.5), late exponentialgrowth phase (OD600 of 1.0), or 6 h anaerobically (to mimic FAS condi-tions) using the RiboPure Bacteria RNA isolation kit (Ambion). In cocul-ture experiments, EHEC was diluted 1:100, whereas B. thetaiotaomicronwas diluted 9:100 into low-glucose DMEM. The primers used in the real-time qPCR assays were designed using Primer Express v1.5 (Applied Bio-systems) (Table 1). The amplification efficiency and template specificityof each of the primer pairs were validated, and reaction mixtures wereprepared as described previously (43). qRT-PCR was performed in a one-step reaction using an ABI 7500 sequence detection system (Applied Bio-systems).
Data were collected using the ABI Sequence Detection 1.2 software(Applied Biosystems). All data were normalized to the levels of rpoA andanalyzed using the comparative cycle threshold (CT) method (44). Theexpression levels of the target genes under the various conditions werecompared using the relative quantification method (44). Real-time data
Ethanolamine Regulation of EHEC Virulence
May/June 2012 Volume 3 Issue 3 e00050-12 ® mbio.asm.org 7
on August 20, 2018 by guest
http://mbio.asm
.org/D
ownloaded from
are expressed as the changes in expression levels compared to the WTlevels. Statistical significance was determined by Student’s t test, and aP value of �0.05 was considered significant.
Microarray. Affymetrix 2.0 E. coli gene arrays were used to comparegene expression of strain 86-24 grown anaerobically with 5% CO2 inDMEM, DMEM plus 15 mM EA, or DMEM plus 50 �M EA at 37°C for6 h. The RNA processing, labeling, hybridization, and slide-scanning pro-cedures were performed as described by the manufacturer (Affymetrix).The array data analyses were performed as described previously (45). Theoutput from scanning a single replicate of the Affymetrix GeneChip E. coliGenome 2.0 array for each of the biological conditions was obtained usingGCOS v 1.4 according to the manufacturer’s instructions. Data were nor-malized using Robust Multiarray analyses (46, 47), and the resulting datawere compared to determine features whose expression was increased ordecreased in response to EA. Custom analysis scripts were written in Perlin order to sort the Affymetrix output data and complete the multiplearray analyses. The microarray data have been deposited in the NationalCenter of Biotechnology Information Gene Expression Omnibus data-base (accession no. GSE34046).
FAS assay. Fluorescein actin staining (FAS) assays were performed aspreviously described (48). Briefly, OVN bacterial cultures were grownaerobically in LB at 37°C and then diluted 1:100 to infect HeLa cells. HeLacells were grown on glass coverslips for 3 or 6 h at 37°C and 5% CO2. Thecoverslips were then washed, permeabilized with 0.2% Triton X, andtreated with fluorescein isothiocyanate-labeled phalloidin to visualize ac-tin accumulation. Propidium iodide was added to stain the bacteria.
SDS-PAGE and immunoblotting. Secreted proteins from strains86-24 and MK37 were harvested as previously described (49). Whole-celllysates were prepared from strains grown in DMEM to mid- or late-loggrowth. SDS-PAGE and immunoblotting were completed as previouslydescribed (25). Preparations were probed by Western blot analysis usingpolyclonal antisera to EspA or monoclonal antisera against Stx2A (SantaCruz Biotechnology) and RpoA (Neoclone).
SUPPLEMENTAL MATERIALSupplemental material for this article may be found at http://mbio.asm.org/lookup/suppl/doi:10.1128/mBio.00050-12/-/DCSupplemental.
Figure S1, PDF file, 0.5 MB.
FIG 6 Detection of AE lesion formation using the FAS test on HeLa cells. (A) WT EHEC strain 86-24 and the eutR mutant strain MK37 in the presence andabsence of EA at 3 h (top row) and 6 h (bottom row). The HeLa cell actin cytoskeleton (green) and the bacteria and HeLa cell nuclei (red) are shown. Pedestalsare observed as bright green structures that are typically associated with bacterial cells. The cells were viewed at a magnification of �640. The micromolarconcentrations of EA are shown. (B and C) Percentage of infected HeLa cells after 3 h (B) or 6 h (C) of incubation. Error bars represent the standard deviationsof 2 independent experiments. Statistical significance is indicated by symbols as follows. The asterisks indicate significance in gene expression between WT (0 �MEA), WT cells grown with EA, and the eutR mutant strain (0 �M EA): **, P � 0.005; ***, P � 0.0005. The carets indicate significance in gene expression betweenthe eutR mutant cells (0 �M EA) and eutR mutant cells grown with EA; ^^, P � 0.005.
Kendall et al.
8 ® mbio.asm.org May/June 2012 Volume 3 Issue 3 e00050-12
on August 20, 2018 by guest
http://mbio.asm
.org/D
ownloaded from
ACKNOWLEDGMENTS
This work was supported by National Institutes of Health grant AI053067,the Ellison Medical Foundation, the Burroughs Wellcome Fund, and aNIH Ruth L. Kirschstein Fellowship F32AI80115 to M.M.K.
The contents of this article are solely the responsibility of the authorsand do not represent the official views of the NIH NIAID.
REFERENCES1. Bakovic M, Fullerton MD, Michel V. 2007. Metabolic and molecular
aspects of ethanolamine phospholipid biosynthesis: the role of CTP:phosphoethanolamine cytidylyl-transferase (Pcyt2). Biochem. Cell Biol.85:283–300.
2. Dowhan W. 1997. Molecular basis for membrane phospholipid diversity:why are there so many lipids? Annu. Rev. Biochem. 66:199 –232.
3. Dowhan W. 1997. Phosphatidylserine decarboxylases: pyruvoyl-dependent enzymes from bacteria to mammals. Methods Enzymol. 280:81– 88.
4. Cotton PB. 1972. Non-dietary lipid in the intestinal lumen. Gut 13:675– 681.
5. Snoeck V, Goddeeris B, Cox E. 2005. The role of enterocytes in theintestinal barrier function and antigen uptake. Microbes Infect.7:997–1004.
6. Thiennimitr P, et al. 2011. Intestinal inflammation allows Salmonella touse ethanolamine to compete with the microbiota. Proc. Natl. Acad. Sci.108:17480 –17485.
7. Karmali MA, Petric M, Lim C, Fleming PC, Steele BT. 1983. Escherichiacoli cytotoxin, haemolytic-uraemic syndrome, and haemorrhagic colitis.Lancet ii:1299 –1300.
8. Kaper JB, Nataro JP, Mobley HL. 2004. Pathogenic Escherichia coli. Nat.Rev. Microbiol. 2:123–140.
9. McDaniel TK, Jarvis KG, Donnenberg MS, Kaper JB. 1995. A genetic
locus of enterocyte effacement conserved among diverse enterobacterialpathogens. Proc. Natl. Acad. Sci. U. S. A. 92:1664 –1668.
10. Clarke MB, Hughes DT, Zhu C, Boedeker EC, Sperandio V. 2006. TheQseC sensor kinase: a bacterial adrenergic receptor. Proc. Natl. Acad. Sci.U. S. A. 103:10420 –10425.
11. Reading NC, et al. 2007. A novel two-component signaling system thatactivates transcription of an enterohemorrhagic Escherichia coli (EHEC)effector involved in remodeling of host actin. J. Bacteriol. 189:2468 –2476.
12. Mellies JL, Elliott SJ, Sperandio V, Donnenberg MS, Kaper JB. 1999.The Per regulon of enteropathogenic Escherichia coli: identification of aregulatory cascade and a novel transcriptional activator, the locus of en-terocyte effacement (LEE)-encoded regulator (Ler). Mol. Microbiol. 33:296 –306.
13. Kendall MM, Rasko DA, Sperandio V. 2010. The LysR-type regulatorQseA regulates both characterized and putative virulence genes in entero-haemorrhagic Escherichia coli. Mol. Microbiol. 76:-1306 –1321.
14. Garsin DA. 2010. Ethanolamine utilization in bacterial pathogens: rolesand regulation. Nat. Rev. Microbiol. 8:290 –295.
15. Bertin Y, et al. 2011. Enterohaemorrhagic Escherichia coli gains a com-petitive advantage by using ethanolamine as a nitrogen source in the bo-vine intestinal content. Environ. Microbiol. 13:365–377.
16. Tsoy O, Ravcheev D, Mushegian A. 2009. Comparative genomics ofethanolamine utilization. J. Bacteriol. 191:7157–7164.
17. Hayashi T, et al. 2001. Complete genome sequence of enterohemorrhagicEscherichia coli O157:H7 and genomic comparison with a laboratorystrain K-12. DNA Res. 8:11–22.
18. Kofoid E, Rappleye C, Stojiljkovic I, Roth J. 1999. The 17-gene ethanol-amine (eut) operon of Salmonella typhimurium encodes five homologuesof carboxysome shell proteins. J. Bacteriol. 181:5317–5329.
19. Perna NT, et al. 2001. Genome sequence of enterohaemorrhagic Esche-richia coli O157:H7. Nature 409:529 –533.
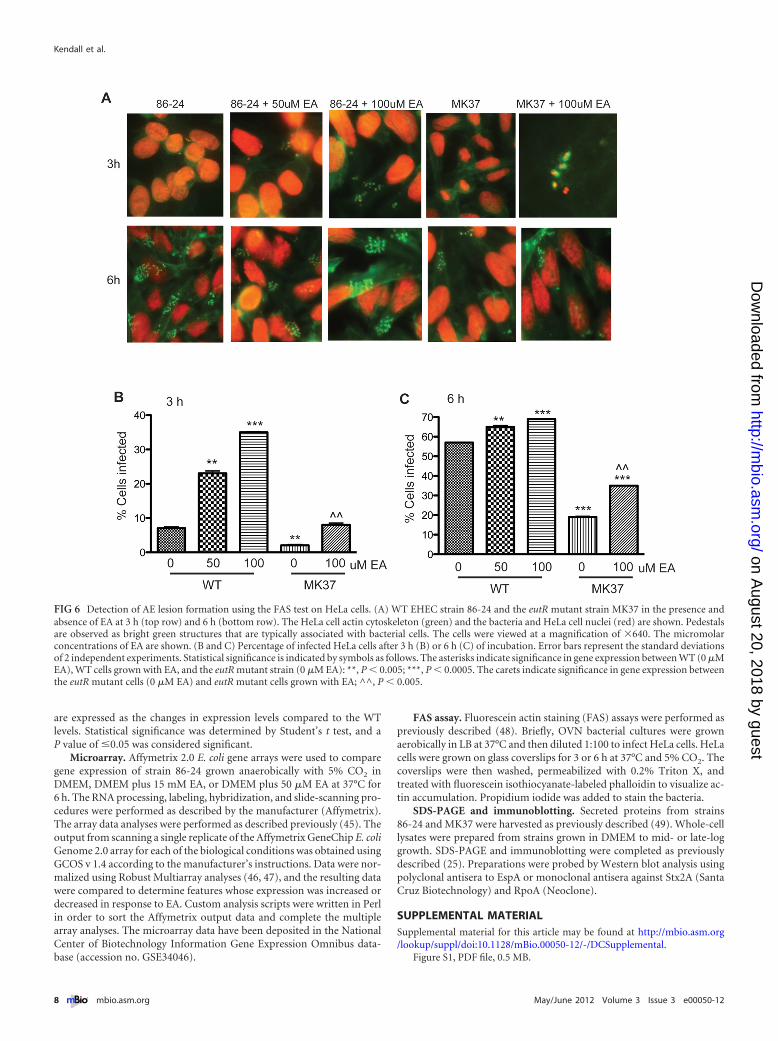
TABLE 1 Oligonucleotide primers used in this study
Primera Sequence Function
eutR_LRF TAACTCCCTCACCCCCATTCCCGCATCCGCTGATGCAACGTCAACGACGGCTGTGTAGGCTGGAGCTGCTTC
Isogenic mutant construction
eutR_LRR ATCATGAAAAAGACCCGTACAGCCAATTTGCACCATCTTTATCATGAACCCTCATATGAATATCCTCCTTAG
Isogenic mutant construction
eutB_LRF CCGCGTCATCAGAAGAACAGTGACGGATCGCCCGCCCGTTTGGTCAGGCGACGTGTAGGCTGGAGCTGCTTC
Isogenic mutant construction
eutB_LRR CTTATGAAACTAAAGACCACATTGTTCGGCAATGTATATCAGTTTAAGGATGCATATGAATATCCTCCTTAG
Isogenic mutant construction
qseB-F CGGTGATCCTGGATTTAACCTT qRT-PCRqseB-R GCTGACCTTTTTCTCGCCATT qRT-PCRqseC-F AATGGGAATACCGTGAAGACAT qRT-PCRqseC-R CCAACCACGGGATCAATTG qRT-PCRqseE-F ACAATCCCTGGCAATGCTTAA qRT-PCRqseE-R GAAGCCACCAGCGAAAAGG qRT-PCRler-F CGACCAGGTCTGCCC qRT-PCRler-R GCGCGGAACTCATC qRT-PCRespA-F TCAGAATCGCAGCCTGAAAA qRT-PCRespA-R CGAAGGATGAGGTGGTTAAGCT qRT-PCReae-F GCTGGCCCTTGGTTTGATCA qRT-PCReae-R GCGGAGATGACTTCAGCACTT qRT-PCRstx2a-F ACCCCACCGGGCAGTT qRT-PCRstx2a-R GGTCAAAACGCGCCTGATA qRT-PCRqseA-F GGCAAGGGAGATTTGTGACTAAT qRT-PCRqseA-R GGCACCCGCCGTTAGC qRT-PCRrpoA-F GCGCTCATCTTCTTCCGAATrpoA-R CGCGGTCGTGGTTATGTGeutRcompF CTCGAGATGCCGCCACTGGTACGCTG Construction of pMK47eutRcompR CCCGGGCAGCTCTTTTCTGCTGGGAC Construction of pMK47a The final letter in the primer name indicates the orientation: F, forward; R, reverse.
Ethanolamine Regulation of EHEC Virulence
May/June 2012 Volume 3 Issue 3 e00050-12 ® mbio.asm.org 9
on August 20, 2018 by guest
http://mbio.asm
.org/D
ownloaded from

20. Roof DM, Roth JR. 1988. Ethanolamine utilization in Salmonella typhi-murium. J. Bacteriol. 170:3855–3863.
21. Roof DM, Roth JR. 1989. Functions required for vitamin B12-dependentethanolamine utilization in Salmonella typhimurium. J. Bacteriol. 171:3316 –3323.
22. Roof DM, Roth JR. 1992. Autogenous regulation of ethanolamine utili-zation by a transcriptional activator of the eut operon in Salmonella typhi-murium. J. Bacteriol. 174:6634 – 6643.
23. Sheppard DE, Penrod JT, Bobik T, Kofoid E, Roth JR. 2004. Evidencethat a B12-adenosyl transferase is encoded within the ethanolamineoperon of Salmonella enterica. J. Bacteriol. 186:7635–7644.
24. Stojiljkovic I, Baümler AJ, Heffron F. 1995. Ethanolamine utilization inSalmonella typhimurium: nucleotide sequence, protein expression, andmutational analysis of the cchA cchB eutE eutJ eutG eutH gene cluster. J.Bacteriol. 177:1357–1366.
25. Sambrook J, Fritsch EF, Maniatis T. 1989. Molecular cloning: a labora-tory manual, 2nd ed. Cold Spring Harbor Laboratory Press, Cold SpringHarbor, NY.
26. Jones PW, Turner JM. 1984. Interrelationships between the enzymes ofethanolamine metabolism in Escherichia coli. J. Gen. Microbiol. 130:299 –308.
27. Jones PW, Turner JM. 1984. A model for the common control of enzymesof ethanolamine catabolism in Escherichia coli. J. Gen. Microbiol. 130:849 – 860.
28. Penrod JT, Mace CC, Roth JR. 2004. A pH-sensitive function andphenotype: evidence that EutH facilitates diffusion of uncharged ethanol-amine in Salmonella enterica. J. Bacteriol. 186:6885– 6890.
29. Scarlett FA, Turner JM. 1976. Microbial metabolism of amino alcohols.Ethanolamine catabolism mediated by coenzyme B12-dependent etha-nolamine ammonia-lyase in Escherichia coli and Klebsiella aerogenes. J.Gen. Microbiol. 95:173–176.
30. Reading NC, Rasko DA, Torres AG, Sperandio V. 2009. The two-component system QseEF and the membrane protein QseG link adrener-gic and stress sensing to bacterial pathogenesis. Proc. Natl. Acad. Sci. U. S.A. 106:5889 –5894.
31. Sperandio V, Torres AG, Jarvis B, Nataro JP, Kaper JB. 2003. Bacteria-host communication: the language of hormones. Proc. Natl. Acad. Sci.U. S. A. 100:8951– 8956.
32. Sperandio V, Torres AG, Kaper JB. 2002. Quorum sensing Escherichiacoli regulators B and C (QseBC): a novel two-component regulatory sys-tem involved in the regulation of flagella and motility by quorum sensingin E. coli. Mol. Microbiol. 43:809 – 821.
33. Hughes DT, Clarke MB, Yamamoto K, Rasko D, Sperandio AV. 2009.The QseC adrenergic signaling cascade in enterohemorrhagic E. coli(EHEC). PLoS Pathog. 5:e10000553.
34. Wrong O. 1978. Nitrogen metabolism in the gut. Am. J. Clin. Nutr.3:1587–1593.
35. Ebel F, Deibel C, Kresse AU, Guzmán CA, Chakraborty T. 1996.Temperature- and medium-dependent secretion of proteins by Shigatoxin-producing Escherichia coli. Infect. Immun. 64:4472– 4479.
36. Blackwell CM, Scarlett FA, Turner JM. 1977. Microbial metabolism ofamino alcohols. Control of formation and stability of partially purifiedethanolamine ammonia-lyase in Escherichia coli. J. Gen. Microbiol. 98:133–139.
37. Moore WE, Holdeman LV. 1974. Human fecal flora: the normal flora of20 Japanese-Hawaiians. Appl. Microbiol. 27:961–979.
38. Keller L, Surette MG. 2006. Communication in bacteria: an ecologicaland evolutionary perspective. Nat. Rev. Microbiol. 4:250 –258.
39. Barnett-Foster D, et al. 1999. Phosphatidylethanolamine recognitionpromotes enteropathogenic E. coli and enterohemorrhagic E. coli host cellattachment. Microb. Pathog. 27:289 –301.
40. Griffin PM, et al. 1988. Illnesses associated with Escherichia coli. Ann.Intern. Med. 109:-705–712.
41. Datsenko KA, Wanner BL. 2000. One-step inactivation of chromosomalgenes in Escherichia coli K-12 using PCR products. Proc. Natl. Acad. Sci.U. S. A. 97:6640 – 6645.
42. Holdeman LV, Cato ED, Moore WE. 1977. Anaerobe laboratory manual.Virginia Polytechnic Institute and State University Anaerobe Laboratory,Blacksburg, VA.
43. Walters M, Sperandio V. 2006. Autoinducer 3 and epinephrine signalingin the kinetics of locus of enterocyte effacement gene expression in entero-hemorrhagic Escherichia coli. Infect. Immun. 74:544 –5455.
44. Biosystems., Applied. 1997. ABI Prism 7700 sequence detection system:user bulletin #2. Applied Biosystems, Foster City, CA.
45. Kendall MM, Rasko DA, Sperandio V. 2007. Global effects of the cell-to-cell signaling molecules autoinducer-2, autoinducer-3, and epineph-rine in a luxS mutant of enterohemorrhagic Escherichia coli. Infect. Im-mun. 75:4875– 4884.
46. Bolstad BM, Irizarry RA, Astrand M, Speed TP. 2003. A comparison ofnormalization methods for high density oligonucleotide array data basedon variance and bias. Bioinformatics 19:185–193.
47. Irizarry RA, et al. 2003. Exploration, normalization, and summaries ofhigh density oligonucleotide array probe level data. Biostatistics4:249 –264.
48. Knutton S, Baldwin T, Williams PH, McNeish AS. 1989. Actin accumu-lation at sites of bacterial adhesion to tissue culture cells: basis of a newdiagnostic test for enteropathogenic and enterohemorrhagic Escherichiacoli. Infect. Immun. 57:1290 –1298.
49. Jarvis KG, et al. 1995. Enteropathogenic Escherichia coli contains a puta-tive type III secretion system necessary for the export of proteins involvedin attaching and effacing lesion formation. Proc. Natl. Acad. Sci. U. S. A.92:7996 – 8000.
Kendall et al.
10 ® mbio.asm.org May/June 2012 Volume 3 Issue 3 e00050-12
on August 20, 2018 by guest
http://mbio.asm
.org/D
ownloaded from