et al., Nigeria and Indonesia (pdf)
40
Public Disclosure Authorized Public Disclosure Authorized Public Disclosure Authorized Public Disclosure Authorized Public Disclosure Authorized Public Disclosure Authorized Public Disclosure Authorized Public Disclosure Authorized
Transcript of et al., Nigeria and Indonesia (pdf)

Pub
lic D
iscl
osur
e A
utho
rized
Pub
lic D
iscl
osur
e A
utho
rized
Pub
lic D
iscl
osur
e A
utho
rized
Pub
lic D
iscl
osur
e A
utho
rized
Pub
lic D
iscl
osur
e A
utho
rized
Pub
lic D
iscl
osur
e A
utho
rized
Pub
lic D
iscl
osur
e A
utho
rized
Pub
lic D
iscl
osur
e A
utho
rized
WB456286
Typewritten Text
91023

CLEAR SKIESCAMBODIA ECONOMIC UPDATE
OCTOBER 2014
CLEAR SKIESCAMBODIA ECONOMIC UPDATE
OCTOBER 2014

@ All rights reserved
This Cambodia Economic Update is a product of the World Bank.
The findings, interpretations, and conclusions expressed in the update are those of World Bank staff, and do not necessarily reflect the views of its management, Executive Board, or the governments they represent.
The World Bank does not guarantee the accuracy of the data included in this work.
Preface and Acknowledgements
The Cambodia Economic Update (CEU) is a product of the staff of the World Bank. It was prepared by Sodeth Ly and Enrique Aldaz-Carroll, Macroeconomics and Fiscal Management Global Practice (MFM GP), Cambodia Country Office, the World Bank. Linna Ky served as research assistant. The team worked under the guidance of Mathew A. Verghis, Practice Manager, MFM GP. Munichan Kung, Urban Rural and Social Development GP, contributed to the selected issue on the ‘Cambodia Rice Sector’ for the update and Julian Latimer Clarke, Trade and Competitiveness GP, contributed to the selected issue on the ‘Investment Climate Assessment.’ The team is grateful for the comments, advice and guidance provided by Ulrich Zachau, Country Director and Alassane Sow, Country Manager.
The CEU is produced bi-annually to provide up-to-date information on macroeconomic developments in Cambodia. It is published and distributed widely to the Cambodian authorities, the development partner community, the private sector, think tanks, civil society organizations, non-government organizations, and academia. The update is timed to coincide with the six-monthly publication of the East Asia Economic Update by the East Asia MFM GP of the World Bank.
We received valuable comments and suggestions from colleagues, namely Shabih Ali Mohib, Country Management Unit, Sergiy Zorya, Agriculture GP, and Samsen Neak, Poverty GP. We are also grateful for insightful comments and suggestions provided by Ratchada Anantavrasilpa and James Seward, Finance and Markets GP.
The report benefited from the advice, comments, and views of various stakeholders in the Royal Government of Cambodia (RGC), the private sector, development partner institutions and academia. The team is very grateful for their time and inputs.
We are very grateful to the Cambodian authorities, in particular the Ministry of Economy and Finance, and the National Bank of Cambodia for their cooperation and support in the preparation of the CEU.
The Cambodia Communications Team, comprising Saroeun Bou and Sophinith Sam Oeun prepared the media release, web display, and dissemination.
For information about the World Bank and its activities in Cambodia, please visit our website at www.worldbank.org/cambodia.
To be included in the email distribution list of the Cambodia Economic Update and related publications, please contact Linna Ky ([email protected]). For questions on the content of this publication, please contact Saroeun Bou ([email protected]).

Table of Contents Executive Summary ...................................................................................................................................... 1
Recent Economic Developments ..................................................................................................................
1. Real sector ............................................................................................................................................. a) Garments ........................................................................................................................................... b) Construction and real estate .............................................................................................................. c) Tourism ............................................................................................................................................. d) Agriculture ........................................................................................................................................
2. External sector..................................................................................................................................... a) Exports ............................................................................................................................................ 1b) Imports ............................................................................................................................................13
3. Inflation ............................................................................................................................................... 14. Monetary sector................................................................................................................................... 1
a) Monetary aggregates, interest rates, and exchange rates ................................................................ 1b) The banking sector .......................................................................................................................... 1
5. Fiscal sector......................................................................................................................................... 1a) Revenue composition...................................................................................................................... 1b) Expenditure composition ................................................................................................................ 1c) Fiscal balance .................................................................................................................................. 1
Key messages and recommendations ......................................................................................................... 1
Selected Issue 1 – Making the most of the Cambodian Rice Sector .......................................................... 2
1. Motivation ........................................................................................................................................... 22. Rice production and processing .......................................................................................................... 23. Rice exports......................................................................................................................................... 24. Export procedures and logistics .......................................................................................................... 25. Rice prices........................................................................................................................................... 26. Conclusion .......................................................................................................................................... 2
Selected Issue 2 – Creating Opportunities for Firms: Findings from the Investment Climate Assessment 2
1. Motivation ........................................................................................................................................... 22. Progress and remaining constraints..................................................................................................... 23. Proposed next steps in reforming the business environment .............................................................. 2
Cambodia: Key Indicators ..........................................................................................................................

Executive Summary
Economic growth has held up well despite domestic uncertainty and instability in neighboring countries. Real growth for 2014 is estimated to reach 7.2 percent, driven by the garment, construction, and services sectors. Overall macroeconomic management has been good with fiscal consolidation underpinned by improved revenue administration. In 2015, with the expectation of renewed confidence and the return of political stability after ending a year-long political deadlock in July 2014, bolstered by a strengthening global economy, Cambodia’s real economic growth rate is expected to reach 7.5 percent, similar to that of 2013. The downside risks to the projected robust growth are a potential recurrence of labor unrest, natural disasters, especially the possibility of heavy floods, as well as regional political uncertainty.
Recent Economic Developments
Garments continue to be Cambodia’s key engine of growth, while construction overtook the decelerating tourism and crops sectors as the second most important growth driver. The garment sector grew at a year-on-year growth rate of 14.1 percent by mid-2014, supported by an improved global economic environment and greater labor market stability. Construction has picked up on the back of renewed domestic confidence, overtaking tourism and crops. Services sector growth remains robust although tourism sector growth has decelerated with a year-on-year arrival growth rate of only 5.2 percent during the first six months, owing to political turmoil in neighboring Thailand and tensions between Vietnam and China. Agricultural growth has also decelerated, as world agricultural prices have been easing.
Poverty reduction continued, thanks to strong growth, but at a slower pace than before. The poverty rate fell to 18.6 percent in 2012, down 1.9 percentage points from its level
in 2011. However, the pace of poverty reduction in 2011-12 is slower than that seen during 2004-11, when poverty fell by 4.7 percentage points per year on the back of increases in rice prices, which helped the rural poor.
This year’s continued healthy economic growth is underpinned by stable external sector performance on the back of rising FDI inflows that help largely finance a slightly widened current account deficit contributing to an increase in international reserves. Garment export growth has continued while FDI inflows are rising due to the return of relative labor market stability and investors’ renewed appetite for the construction and real estate sector, leading to growing construction materials imports. Consumption goods imports have also picked up, driven largely by vehicle and petroleum products. The current account deficit is projected to reach 11.3 percent of GDP, slightly larger than the 10.7 percent estimated for 2013, largely financed by FDI. Gross international reserves, therefore, rose to US$4.2 billion or about 3.5 months of imports by mid-2014, from US$3.6 billion or 3.4 months at the end of 2013.
Though there has been a slight increase in inflation, price stability remains within acceptable levels fostering economic expansion and supporting poverty reduction. Inflation rose to 4.9 percent year-on-year by mid-2014, slightly higher than the 4.6 percent at the end of 2013. The prices of most staple food items remain stable, although prices of some food items, such as meat and fruit, and other non-food items, such as utilities, are inching up gradually. Regional and other developing-country inflation remains benign.
Private sector deposit growth has picked up swiftly thanks to renewed confidence on the economy, contributing to greater stability in the banking sector. Private sector deposits picked up sharply, reaching US$8.09 billion or a 22.2 percent year-on-year increase by mid-2014, compared with US$6.88 billion, or 14.2 percent

1
Executive Summary
Economic growth has held up well despite domestic uncertainty and instability in neighboring countries. Real growth for 2014 is estimated to reach 7.2 percent, driven by the garment, construction, and services sectors. Overall macroeconomic management has been good with fiscal consolidation underpinned by improved revenue administration. In 2015, with the expectation of renewed confidence and the return of political stability after ending a year-long political deadlock in July 2014, bolstered by a strengthening global economy, Cambodia’s real economic growth rate is expected to reach 7.5 percent, similar to that of 2013. The downside risks to the projected robust growth are a potential recurrence of labor unrest, natural disasters, especially the possibility of heavy floods, as well as regional political uncertainty.
Recent Economic Developments
Garments continue to be Cambodia’s key engine of growth, while construction overtook the decelerating tourism and crops sectors as the second most important growth driver. The garment sector grew at a year-on-year growth rate of 14.1 percent by mid-2014, supported by an improved global economic environment and greater labor market stability. Construction has picked up on the back of renewed domestic confidence, overtaking tourism and crops. Services sector growth remains robust although tourism sector growth has decelerated with a year-on-year arrival growth rate of only 5.2 percent during the first six months, owing to political turmoil in neighboring Thailand and tensions between Vietnam and China. Agricultural growth has also decelerated, as world agricultural prices have been easing.
Poverty reduction continued, thanks to strong growth, but at a slower pace than before. The poverty rate fell to 18.6 percent in 2012, down 1.9 percentage points from its level
in 2011. However, the pace of poverty reduction in 2011-12 is slower than that seen during 2004-11, when poverty fell by 4.7 percentage points per year on the back of increases in rice prices, which helped the rural poor.
This year’s continued healthy economic growth is underpinned by stable external sector performance on the back of rising FDI inflows that help largely finance a slightly widened current account deficit contributing to an increase in international reserves. Garment export growth has continued while FDI inflows are rising due to the return of relative labor market stability and investors’ renewed appetite for the construction and real estate sector, leading to growing construction materials imports. Consumption goods imports have also picked up, driven largely by vehicle and petroleum products. The current account deficit is projected to reach 11.3 percent of GDP, slightly larger than the 10.7 percent estimated for 2013, largely financed by FDI. Gross international reserves, therefore, rose to US$4.2 billion or about 3.5 months of imports by mid-2014, from US$3.6 billion or 3.4 months at the end of 2013.
Though there has been a slight increase in inflation, price stability remains within acceptable levels fostering economic expansion and supporting poverty reduction. Inflation rose to 4.9 percent year-on-year by mid-2014, slightly higher than the 4.6 percent at the end of 2013. The prices of most staple food items remain stable, although prices of some food items, such as meat and fruit, and other non-food items, such as utilities, are inching up gradually. Regional and other developing-country inflation remains benign.
Private sector deposit growth has picked up swiftly thanks to renewed confidence on the economy, contributing to greater stability in the banking sector. Private sector deposits picked up sharply, reaching US$8.09 billion or a 22.2 percent year-on-year increase by mid-2014, compared with US$6.88 billion, or 14.2 percent
2
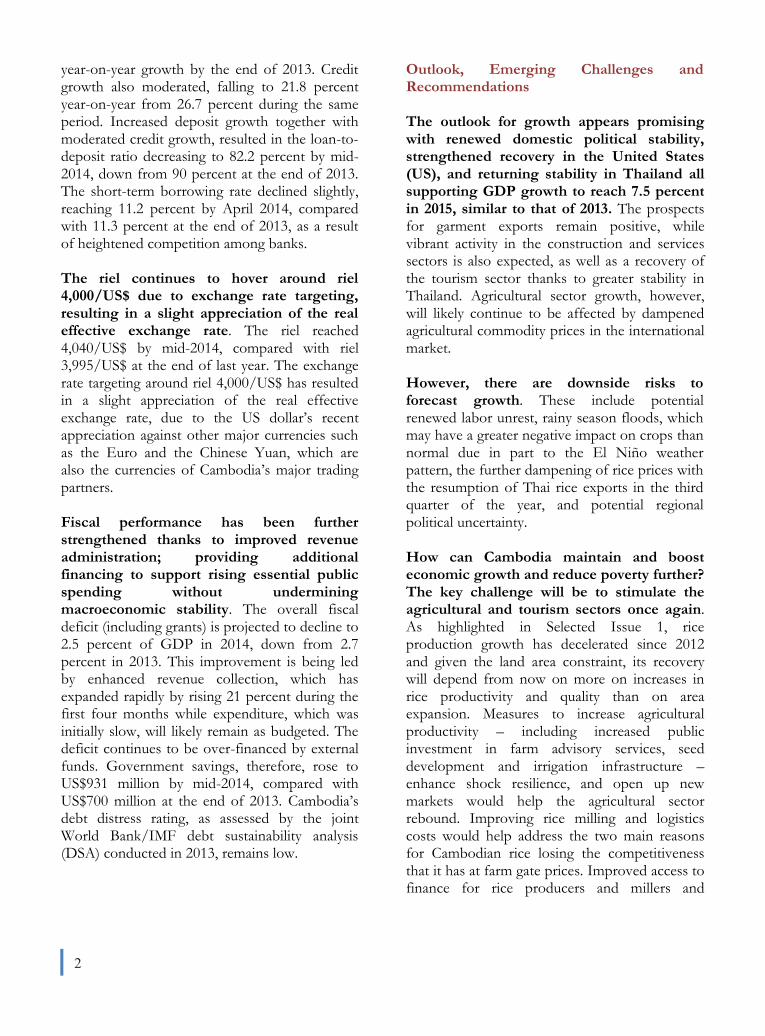
year-on-year growth by the end of 2013. Credit growth also moderated, falling to 21.8 percent year-on-year from 26.7 percent during the same period. Increased deposit growth together with moderated credit growth, resulted in the loan-to-deposit ratio decreasing to 82.2 percent by mid-2014, down from 90 percent at the end of 2013. The short-term borrowing rate declined slightly, reaching 11.2 percent by April 2014, compared with 11.3 percent at the end of 2013, as a result of heightened competition among banks.
The riel continues to hover around riel 4,000/US$ due to exchange rate targeting, resulting in a slight appreciation of the real effective exchange rate. The riel reached 4,040/US$ by mid-2014, compared with riel 3,995/US$ at the end of last year. The exchange rate targeting around riel 4,000/US$ has resulted in a slight appreciation of the real effective exchange rate, due to the US dollar’s recent appreciation against other major currencies such as the Euro and the Chinese Yuan, which are also the currencies of Cambodia’s major trading partners.
Fiscal performance has been further strengthened thanks to improved revenue administration; providing additional financing to support rising essential public spending without undermining macroeconomic stability. The overall fiscal deficit (including grants) is projected to decline to 2.5 percent of GDP in 2014, down from 2.7 percent in 2013. This improvement is being led by enhanced revenue collection, which has expanded rapidly by rising 21 percent during the first four months while expenditure, which was initially slow, will likely remain as budgeted. The deficit continues to be over-financed by external funds. Government savings, therefore, rose to US$931 million by mid-2014, compared with US$700 million at the end of 2013. Cambodia’s debt distress rating, as assessed by the joint World Bank/IMF debt sustainability analysis (DSA) conducted in 2013, remains low.
Outlook, Emerging Challenges and Recommendations
The outlook for growth appears promising with renewed domestic political stability, strengthened recovery in the United States (US), and returning stability in Thailand all supporting GDP growth to reach 7.5 percent in 2015, similar to that of 2013. The prospects for garment exports remain positive, while vibrant activity in the construction and services sectors is also expected, as well as a recovery of the tourism sector thanks to greater stability in Thailand. Agricultural sector growth, however, will likely continue to be affected by dampened agricultural commodity prices in the international market.
However, there are downside risks to forecast growth. These include potential renewed labor unrest, rainy season floods, which may have a greater negative impact on crops than normal due in part to the El Niño weather pattern, the further dampening of rice prices with the resumption of Thai rice exports in the third quarter of the year, and potential regional political uncertainty.
How can Cambodia maintain and boost economic growth and reduce poverty further? The key challenge will be to stimulate the agricultural and tourism sectors once again. As highlighted in Selected Issue 1, rice production growth has decelerated since 2012 and given the land area constraint, its recovery will depend from now on more on increases in rice productivity and quality than on area expansion. Measures to increase agricultural productivity – including increased public investment in farm advisory services, seed development and irrigation infrastructure – enhance shock resilience, and open up new markets would help the agricultural sector rebound. Improving rice milling and logistics costs would help address the two main reasons for Cambodian rice losing the competitiveness that it has at farm gate prices. Improved access to finance for rice producers and millers and
reduced costs of doing business would help increase milling volumes and reduce milling costs. Improving logistics will also enhance the competitiveness of agricultural production and exports helping Cambodia get closer to its one million rice milled export target. Improved road transportation, together with greater coordination of efforts between central and local governments, the private sector and local communities, would help promote diversification of tourist destinations beyond the Angkor Archeological Park.
Facilitating the growth of the manufacturing sector will also be instrumental to maintain and boost economic growth. As highlighted in the Selected Issue 2, the latest Enterprise Survey of the forthcoming Investment Climate Assessment indicates that the business environment continues to hamper the competitiveness of firms in Cambodia. The key constraints for firms continue to be electricity cost and access, informal payments and uncompetitive practices. The survey also shows that Special Economic Zones (SEZ), which were meant to provide an improved business environment, are not yet delivering the benefits expected by foreign investors. The present robust economic growth therefore presents an opportunity to improve the business environment by addressing the high cost of electricity with transparent solicitation; continuing the automation of business processes; improving trade facilitation; increasing the attractiveness of SEZs; completing competition and investment laws that enhance the investment climate; and simplifying business registration. To further strengthen exports by maximizing the benefits from the global recovery, it is also important to maintain political stability and to
reach a conclusive and transparent process in tripartite minimum wage negotiations for the garment sector. This will also help attract additional foreign investment projects relocating from more advanced economies in the region.
Safeguarding stability in the financial sector through enhanced banking supervision will help prevent a bubble in the construction and real estate sectors, while also strengthening the country's resilience in facing possible higher volatility in international financial markets.
More broadly, increasing capital investment, deepening structural reforms, and improving formal and vocational education will help Cambodia return to a higher growth path. Further broadening the tax base and strengthening tax administration will help finance this much needed development spending. The successful implementation of reforms would help investment increase by more than 5 percentage points of GDP and allow Cambodia to attain a GDP growth path above 8 percent.
The development of very specific reform agendas with targets linked to priority reforms and a strong monitoring framework would help enhance the effectiveness of government implementation. The Royal Government of Cambodia’s (RGC) new five-year Rectangular Strategy (RS) III, clearly identifies the development challenges and priorities for the country. The development of very specific and detailed action plans linked to the priorities and the establishment of a strong monitoring system to check regularly performance, would help Cambodia address development challenges and meet its priorities more effectively.

3
reduced costs of doing business would help increase milling volumes and reduce milling costs. Improving logistics will also enhance the competitiveness of agricultural production and exports helping Cambodia get closer to its one million rice milled export target. Improved road transportation, together with greater coordination of efforts between central and local governments, the private sector and local communities, would help promote diversification of tourist destinations beyond the Angkor Archeological Park.
Facilitating the growth of the manufacturing sector will also be instrumental to maintain and boost economic growth. As highlighted in the Selected Issue 2, the latest Enterprise Survey of the forthcoming Investment Climate Assessment indicates that the business environment continues to hamper the competitiveness of firms in Cambodia. The key constraints for firms continue to be electricity cost and access, informal payments and uncompetitive practices. The survey also shows that Special Economic Zones (SEZ), which were meant to provide an improved business environment, are not yet delivering the benefits expected by foreign investors. The present robust economic growth therefore presents an opportunity to improve the business environment by addressing the high cost of electricity with transparent solicitation; continuing the automation of business processes; improving trade facilitation; increasing the attractiveness of SEZs; completing competition and investment laws that enhance the investment climate; and simplifying business registration. To further strengthen exports by maximizing the benefits from the global recovery, it is also important to maintain political stability and to
reach a conclusive and transparent process in tripartite minimum wage negotiations for the garment sector. This will also help attract additional foreign investment projects relocating from more advanced economies in the region.
Safeguarding stability in the financial sector through enhanced banking supervision will help prevent a bubble in the construction and real estate sectors, while also strengthening the country's resilience in facing possible higher volatility in international financial markets.
More broadly, increasing capital investment, deepening structural reforms, and improving formal and vocational education will help Cambodia return to a higher growth path. Further broadening the tax base and strengthening tax administration will help finance this much needed development spending. The successful implementation of reforms would help investment increase by more than 5 percentage points of GDP and allow Cambodia to attain a GDP growth path above 8 percent.
The development of very specific reform agendas with targets linked to priority reforms and a strong monitoring framework would help enhance the effectiveness of government implementation. The Royal Government of Cambodia’s (RGC) new five-year Rectangular Strategy (RS) III, clearly identifies the development challenges and priorities for the country. The development of very specific and detailed action plans linked to the priorities and the establishment of a strong monitoring system to check regularly performance, would help Cambodia address development challenges and meet its priorities more effectively.

Recent Economic Developments
1. Real sector
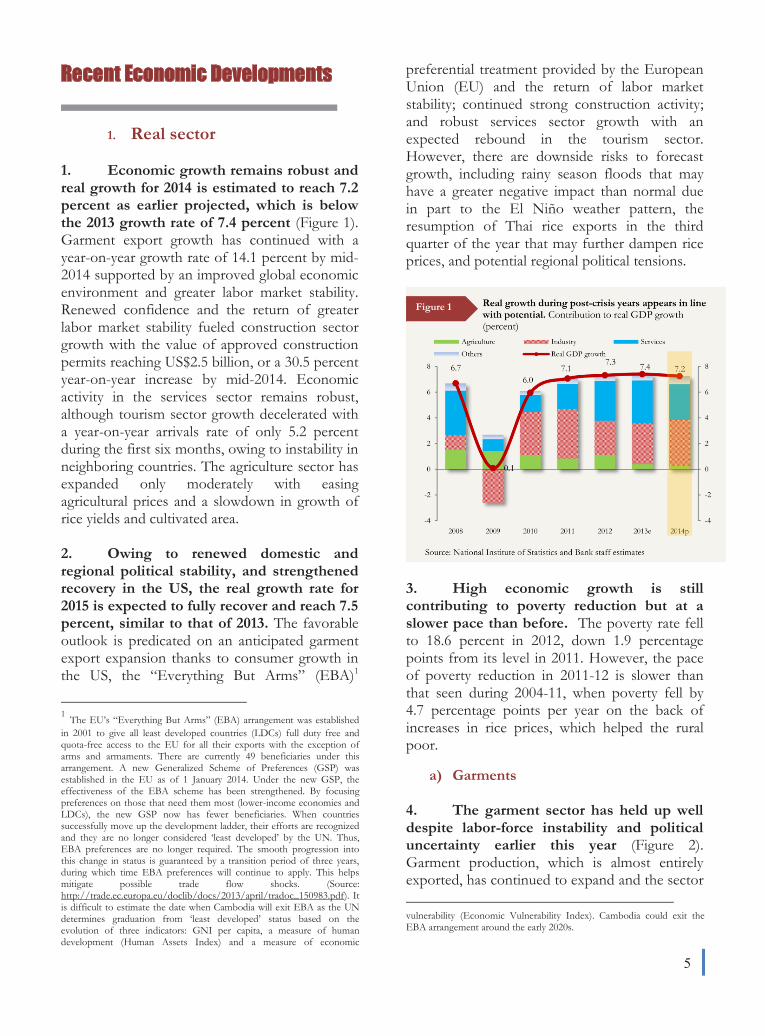
1. Economic growth remains robust andreal growth for 2014 is estimated to reach 7.2 percent as earlier projected, which is below the 2013 growth rate of 7.4 percent (Figure 1). Garment export growth has continued with a year-on-year growth rate of 14.1 percent by mid-2014 supported by an improved global economic environment and greater labor market stability. Renewed confidence and the return of greater labor market stability fueled construction sector growth with the value of approved construction permits reaching US$2.5 billion, or a 30.5 percent year-on-year increase by mid-2014. Economic activity in the services sector remains robust, although tourism sector growth decelerated with a year-on-year arrivals rate of only 5.2 percent during the first six months, owing to instability in neighboring countries. The agriculture sector has expanded only moderately with easing agricultural prices and a slowdown in growth of rice yields and cultivated area.
2. Owing to renewed domestic andregional political stability, and strengthened recovery in the US, the real growth rate for 2015 is expected to fully recover and reach 7.5 percent, similar to that of 2013. The favorable outlook is predicated on an anticipated garment export expansion thanks to consumer growth in the US, the “Everything But Arms” (EBA)1
1 The EU’s “Everything But Arms” (EBA) arrangement was established in 2001 to give all least developed countries (LDCs) full duty free and quota-free access to the EU for all their exports with the exception of arms and armaments. There are currently 49 beneficiaries under this arrangement. A new Generalized Scheme of Preferences (GSP) was established in the EU as of 1 January 2014. Under the new GSP, the effectiveness of the EBA scheme has been strengthened. By focusing preferences on those that need them most (lower-income economies and LDCs), the new GSP now has fewer beneficiaries. When countries successfully move up the development ladder, their efforts are recognized and they are no longer considered ‘least developed’ by the UN. Thus, EBA preferences are no longer required. The smooth progression into this change in status is guaranteed by a transition period of three years, during which time EBA preferences will continue to apply. This helps mitigate possible trade flow shocks. (Source: http://trade.ec.europa.eu/doclib/docs/2013/april/tradoc_150983.pdf). It is difficult to estimate the date when Cambodia will exit EBA as the UN determines graduation from ‘least developed’ status based on the evolution of three indicators: GNI per capita, a measure of human development (Human Assets Index) and a measure of economic
preferential treatment provided by the European Union (EU) and the return of labor market stability; continued strong construction activity; and robust services sector growth with an expected rebound in the tourism sector. However, there are downside risks to forecast growth, including rainy season floods that may have a greater negative impact than normal due in part to the El Niño weather pattern, the resumption of Thai rice exports in the third quarter of the year that may further dampen rice prices, and potential regional political tensions.
3. High economic growth is stillcontributing to poverty reduction but at a slower pace than before. The poverty rate fell to 18.6 percent in 2012, down 1.9 percentage points from its level in 2011. However, the pace of poverty reduction in 2011-12 is slower than that seen during 2004-11, when poverty fell by 4.7 percentage points per year on the back of increases in rice prices, which helped the rural poor.
a) Garments
4. The garment sector has held up welldespite labor-force instability and political uncertainty earlier this year (Figure 2). Garment production, which is almost entirely exported, has continued to expand and the sector
vulnerability (Economic Vulnerability Index). Cambodia could exit the EBA arrangement around the early 2020s.
Figure 1
5
Recent Economic Developments
1. Real sector
1. Economic growth remains robust andreal growth for 2014 is estimated to reach 7.2 percent as earlier projected, which is below the 2013 growth rate of 7.4 percent (Figure 1). Garment export growth has continued with a year-on-year growth rate of 14.1 percent by mid-2014 supported by an improved global economic environment and greater labor market stability. Renewed confidence and the return of greater labor market stability fueled construction sector growth with the value of approved construction permits reaching US$2.5 billion, or a 30.5 percent year-on-year increase by mid-2014. Economic activity in the services sector remains robust, although tourism sector growth decelerated with a year-on-year arrivals rate of only 5.2 percent during the first six months, owing to instability in neighboring countries. The agriculture sector has expanded only moderately with easing agricultural prices and a slowdown in growth of rice yields and cultivated area.
2. Owing to renewed domestic andregional political stability, and strengthened recovery in the US, the real growth rate for 2015 is expected to fully recover and reach 7.5 percent, similar to that of 2013. The favorable outlook is predicated on an anticipated garment export expansion thanks to consumer growth in the US, the “Everything But Arms” (EBA)1
1 The EU’s “Everything But Arms” (EBA) arrangement was established in 2001 to give all least developed countries (LDCs) full duty free and quota-free access to the EU for all their exports with the exception of arms and armaments. There are currently 49 beneficiaries under this arrangement. A new Generalized Scheme of Preferences (GSP) was established in the EU as of 1 January 2014. Under the new GSP, the effectiveness of the EBA scheme has been strengthened. By focusing preferences on those that need them most (lower-income economies and LDCs), the new GSP now has fewer beneficiaries. When countries successfully move up the development ladder, their efforts are recognized and they are no longer considered ‘least developed’ by the UN. Thus, EBA preferences are no longer required. The smooth progression into this change in status is guaranteed by a transition period of three years, during which time EBA preferences will continue to apply. This helps mitigate possible trade flow shocks. (Source: http://trade.ec.europa.eu/doclib/docs/2013/april/tradoc_150983.pdf). It is difficult to estimate the date when Cambodia will exit EBA as the UN determines graduation from ‘least developed’ status based on the evolution of three indicators: GNI per capita, a measure of human development (Human Assets Index) and a measure of economic
preferential treatment provided by the European Union (EU) and the return of labor market stability; continued strong construction activity; and robust services sector growth with an expected rebound in the tourism sector. However, there are downside risks to forecast growth, including rainy season floods that may have a greater negative impact than normal due in part to the El Niño weather pattern, the resumption of Thai rice exports in the third quarter of the year that may further dampen rice prices, and potential regional political tensions.
3. High economic growth is stillcontributing to poverty reduction but at a slower pace than before. The poverty rate fell to 18.6 percent in 2012, down 1.9 percentage points from its level in 2011. However, the pace of poverty reduction in 2011-12 is slower than that seen during 2004-11, when poverty fell by 4.7 percentage points per year on the back of increases in rice prices, which helped the rural poor.
a) Garments
4. The garment sector has held up welldespite labor-force instability and political uncertainty earlier this year (Figure 2). Garment production, which is almost entirely exported, has continued to expand and the sector
vulnerability (Economic Vulnerability Index). Cambodia could exit the EBA arrangement around the early 2020s.
Figure 1

6
continues to attract investment. Strong garment exports continue, reaching US$2.6 billion, or a 14.1 percent year-on-year increase by June 2014, compared with US$2.3 billion, or a 17.4 percent year-on-year increase over the same period last year. In value terms, the share of garment exports to the EU of 37 percent of total garment export value surpassed that of the US, at 36 percent, during the first half of 2014. In volume terms, the share of garment exports to the US remains the highest, at 46 percent of total garment export volume, while the EU share is second, at 34 percent. This continues to reflect the strategy of exporting high-end garment products to the EU to benefit from the EU’s EBA preferential treatment.
b) Construction and real estate
5. As political stability has returned,investors’ renewed appetite for medium-to large-scale construction projects in the services sector, especially in the retail and financial sub-sectors, as well as office and residential development, has emerged. This has contributed to the recent significant expansion of the construction and real estate sector. The value of construction permits (Figure 3) issued by the Ministry of Land, Constructionand Urbanization, and that of investment projects (fixed assets) in the tourism sector approved by the Council for the Development of
Cambodia (CDC) (Figure 4) surged, reaching US$2.5 billion, or a 30.5 percent year-on-year increase, and US$258 million, or a 144 percent year-on-year increase, by mid-2014, respectively. The expansion of the construction and services sectors against the backdrop of moderated tourism sector growth reflects a substantial boost in investors’ confidence in the economy.
6. It is crucial, however, to mitigatepotential risks associated with construction and real estate growth. The expansion of the sector has just started and is being financed largely by FDI inflows with a diminishing role of domestic credit, which grew at a slower pace during the first half of 2014 (see the section on the monetary sector below for more details). While the recent recovery in the construction and real estate sector is a welcomed development, this expansion poses potential key risks associated with: (1) the intrinsic cyclicality of construction; (2) the high FDI share – vulnerability if and/or when FDI recedes; (3) speculative bubbles; and (4) typical challenges facing land policy for growth, transparent land management, poverty reduction, and shared prosperity. International experience shows construction driven growth is volatile and less equitable, which suggests the desirability of guarding against an unsustainable construction boom.
Figure 2
Figure 3
Garment export growth continues to underpin real economic growth. Garment exports (YTD, US$ million)
Renewed appetite for construction projects in 2014. Construction approval permits (YTD, y/y % change)
c) Tourism
7. Due to the recent political turmoil inThailand and the tensions between Vietnam and China, tourist arrival growth has moderated, reaching only 5.2 percent during the first half of 2014, compared with 19 percent during the same period last year (Figure 5). The negative impacts have largely affected arrivals by land, which account for about half of total arrivals. As a result, during the first half of 2014, Vietnamese tourist arrivals (97 percent of whom arrive by land), which grew by 9 percent in 2013, stagnated, while Chinese tourist arrivals (90 percent of whom arrive by air), which grew by 55 percent in 2013, moderated, growing at 19.1 percent. Cambodia is more often than not just one part of a regional tourist’s visit (combined with Thailand and/or Vietnam). With both Vietnam and Thailand becoming uncertain destinations, this has also made trips to Cambodia less attractive.
8. Chinese and South Korean touristarrival growth has slowed significantly while arrival growth from Japan has been sustained (Figure 6). This appears to reflect a recent development that Cambodia has become more attractive to Japanese tourists and investors.
d) Agriculture
9. Agriculture growth has continued, butat a slower pace, as expansion of cultivated areas and yields, particularly in the case of rice, has slowed during the past two years (Figure 7). In 2013, growth became negative for dry season rice, which accounts for about 23 percent of total rice production. Lower agricultural prices, especially for rice, not compensated by reductions in production and marketing costs, adversely affect agriculture sector growth and rice exports. Other key agricultural commodities, such as rubber and cassava, have also been affected by softer agriculture commodity prices. Rice prices are not expected to increase substantially in the near future because international price volatility for most commodities has now returned to historical norms. See Selected Issue 1: Making the most of the Cambodian Rice Sector, for an in-depth discussion on rice prices, production, processing, and exports.
Figure 4
Figure 5
Figure 6
Tourism projects (fixed assets) are rising after negative growth last year. Approved tourism sector related projects (YTD, y/y % change)
Japanese arrivals have posted gradual growth while South Korean and Chinese arrivals have slowed significantly. (Year on year, % change)
Source: Ministry of Tourism

7
c) Tourism
7. Due to the recent political turmoil inThailand and the tensions between Vietnam and China, tourist arrival growth has moderated, reaching only 5.2 percent during the first half of 2014, compared with 19 percent during the same period last year (Figure 5). The negative impacts have largely affected arrivals by land, which account for about half of total arrivals. As a result, during the first half of 2014, Vietnamese tourist arrivals (97 percent of whom arrive by land), which grew by 9 percent in 2013, stagnated, while Chinese tourist arrivals (90 percent of whom arrive by air), which grew by 55 percent in 2013, moderated, growing at 19.1 percent. Cambodia is more often than not just one part of a regional tourist’s visit (combined with Thailand and/or Vietnam). With both Vietnam and Thailand becoming uncertain destinations, this has also made trips to Cambodia less attractive.
8. Chinese and South Korean touristarrival growth has slowed significantly while arrival growth from Japan has been sustained (Figure 6). This appears to reflect a recent development that Cambodia has become more attractive to Japanese tourists and investors.
d) Agriculture
9. Agriculture growth has continued, butat a slower pace, as expansion of cultivated areas and yields, particularly in the case of rice, has slowed during the past two years (Figure 7). In 2013, growth became negative for dry season rice, which accounts for about 23 percent of total rice production. Lower agricultural prices, especially for rice, not compensated by reductions in production and marketing costs, adversely affect agriculture sector growth and rice exports. Other key agricultural commodities, such as rubber and cassava, have also been affected by softer agriculture commodity prices. Rice prices are not expected to increase substantially in the near future because international price volatility for most commodities has now returned to historical norms. See Selected Issue 1: Making the most of the Cambodian Rice Sector, for an in-depth discussion on rice prices, production, processing, and exports.
Figure 4
Figure 5
Figure 6
Tourism projects (fixed assets) are rising after negative growth last year. Approved tourism sector related projects (YTD, y/y % change)
Japanese arrivals have posted gradual growth while South Korean and Chinese arrivals have slowed significantly. (Year on year, % change)
Source: Ministry of Tourism

8
10. It is important to uncover the reasonsbehind the deceleration in dry season rice production. Dry season rice production growth, which peaked in 2011, has decelerated since and became negative last year (Figure 8). As this has occurred against a backdrop of continued efforts to improve irrigation and agricultural extension—among the key priorities under the RGC’s new five-year RS III—additional analysis would be needed to uncover the reasons behind this deceleration. A study conducted jointly by the World Bank, AusAID, and the RGC in 2011 recommended improving funding for agricultural research, increasing the effectiveness of irrigation investments by rehabilitating tertiary canals, and providing sufficient investment for maintenance of irrigation systems and for agricultural extension.2 However, it is not clear to what extent the recommendations have been successfully implemented.
2 Cambodia More Efficient Government Spending for Strong and Inclusive Growth, Integrated Fiduciary Assessment and Public Expenditure Review, November 2011, The World Bank.
Figure 7
Figure 8
Cambodia has only started to fully realize the potential of its tourism sector since the past decade or so. Although the country is endowed with countless attraction sites, which include historical, cultural, and natural destinations, the development of Cambodia’s tourism sector has been relatively new. In 1993, a newfound peace with the first general election helped Cambodia attract about 100,000 visitors (Figure B1.1), representing only 2 percent of the total international arrivals visiting Thailand (Figure B1.2). Cambodia arrivals, however, have risen rapidly during the past 10 years, reaching 15 percent of the total of Thailand’s arrivals by 2013. It is estimated that the tourism sector directly creates 300,000 jobs and indirectly generates another 700,000 jobs. Therefore, the combined direct and indirect employment created by the sector covers 15 percent of the total employment in Cambodia or more than half of the total jobs employed by the services sector. The year-on-year arrival growth of Cambodia appears to follow Thailand’s at least during the past decade, although it reflects some level of uncertainty for international arrivals during general election years (Figure B1.3). Unlike Thailand, where 80 percent of tourists prefer sea-sun-sand and nature-based destinations, Cambodia’s most attractive site is the Angkor Archeological Park (AAP), the magnificent remains of the different capitals of the Khmer Empire, from the 9th to the 15th century. Tourists traveling by air account for only about 50 percent of total arrivals for Cambodia. Arrivals from Vietnam have been the largest (20.3 percent in 2013) (arrivals from China and South Korea are next) and almost all of the Vietnamese tourists (97 percent) arrive by land. This highlights the importance of building and maintaining adequate infrastructure linking Cambodian-Vietnamese border crossings to tourist attraction sites such as Angkor Wat. For Thailand, however, tourist arrivals by air have been as high as 65 percent; and arrivals from China (Malaysia and Russia are next) have been the largest (17.3 percent in 2013).
Cambodia’s total tourism receipts (direct contribution) are estimated to reach US$2.5 billion (or 16 percent of GDP) in 2013 or US$605 per tourist while Thailand’s is US$39.2 billion (or 10 percent of GDP) or US$1,479 per tourist. Visitors coming to Cambodia only stay an average of 6.7 days and spend US$120 per day whereas those visiting Thailand stay 9.8 days and spend US$150 per day. Return tourists cover only 16 percent for Cambodia versus 50 percent for Thailand (Table B1.1). The main reasons why international tourists return to Thailand are: (i) destination attractions, including opportunities for adventure, exciting entertainment, friendly people, safety, and attractive sightseeing; and (ii) food attractions that cover a variety of food, cultural experiences, local ingredients, tasty, nourishing and unique food, and high levels of food hygiene.
Box 1 Development of the tourism sector
There is plenty of room to further develop the tourism sector to increase its contribution to growth, shared prosperity and poverty reduction, and the public sector is well placed to undertake or help facilitate this development. As the experience of Costa Rica shows, the diversification of tourist sites to tap the huge potential of coastal areas as well as the potential for eco-tourism in rural areas will help expand the tourism sector and share its benefits across the country, generating jobs for local communities and contributing to reduce poverty and vulnerability. Implementing successfully the key activities and targets set in Cambodia’s 2012-2020 Tourism Development Strategic Plan (TDSP) will provide a sound basis, though more can be done to ensure greatest impact. While the TDSP’s focus on connecting and facilitating air travel will help increase tourist arrival numbers, a larger impact can be obtained by simultaneously developing physical infrastructure, particularly publicly financed paved and rural roads, as half of total arrivals is via land. Facilitating the development of privately financed hospitality and logistics support services will also be key to support tourism diversification and expansion. It is thus important to clearly define the roles of the public sector, local authorities, private sector and local communities, and to establish a well-functioning coordination arrangement to prioritize, implement, and monitor key activities and targets. For instance, efforts have been made to rehabilitate and expand a number of highways linking Cambodia to Thailand and Vietnam, but without sufficient coordination and prioritized resource allocation, maintaining the rehabilitated and expanded highways including its tourist information, rest stops, and toilet facilities in decent shape will likely remain a challenge. Similarly, central and provincial authorities have been making good efforts to strengthen safety, security, and the environment to attract tourists, but without the active participation of the local community those efforts may not be as effective. Coordination also at the regional level will help increase the attractiveness of joint tour packages. For instance, combining eco-tourism, cultural and beach packages with neighboring countries will attract tourists visiting the region to also come to Cambodia. As shown in Figure B1.2, the dependency of Cambodia‘s relatively new tourism sector on Thailand’s more developed tourism sector points out to the importance of close cooperation between ministries, agencies and private sector of the two countries.
Figure B1.1 Figure B1.2
-
5
10
15
20
25
30
1993
1994
1995
1996
1997
1998
1999
2000
2001
2002
2003
2004
2005
2006
2007
2008
2009
2010
2011
2012
2013
Cambodia Thailand
0.05
0.15
0.25
0.35
0.45
0.55
0.0
0.5
1.0
1.5
2.0
2.5
3.0
Jan-
05Ju
n-05
Nov
-05
Apr
-06
Sep-
06Fe
b-07
Jul-0
7D
ec-0
7M
ay-0
8O
ct-0
8M
ar-0
9A
ug-0
9Ja
n-10
Jun-
10N
ov-1
0A
pr-1
1Se
p-11
Feb-
12Ju
l-12
Dec
-12
May
-13
Oct
-13
Mar
-14
THA KHM (RHS)
Figure B1.3 Table B1. 1
0
2
4
6
8
10
12
14
16
18
1993
1994
1995
1996
1997
1998
1999
2000
2001
2002
2003
2004
2005
2006
2007
2008
2009
2010
2011
2012
2013
Cambodia arrival (as % Thailand arrival)
Cambodia ThailandTotal arrivals (2013, in million of tourists) 4.2 26.5
by air (percent of total) 50.0 65.0
Estimated tourism receipts/direct contribution (2013, in US$ mln) 2,547.0 39,282.3
In percent of GDP 16.0 10.0 Per visitor 605.0 1,479.7 Per day 120.7 150.2
Estimated tourism indirect contribution (2012, in US$ mln) 3,600.0 61,000.0
In percent of GDP 25.4 16.7
Length of stay (days) 6.7 9.8 Return visitors (percent of total) 16.0 50.0
Employment ('000 jobs) 1,083.4 6,838.6 Direct 320.1 2,019.9 Indirect 763.3 4,818.7
Tourism sector highlights
Development of the tourism sector (continued)Box 1
Closely follows (and reflects its dependency on) the trend & seasonal patterns of Thailand's arrivals.Arrivals to Cambodia (KHM) and Thailand (THA) (In million of tourists)
Cambodia’s international tourist arrival continues to rise. (In million of tourists)
It is increasing as a share of Thailand's international tourist arrival.
Source: Ministry of Tourism, Cambodia; Ministry of Tourism and Sports, Thailand; World Travel and Tourism Council (Travel and Tourism Economic Impact 2013 Thailand); and Bank staff estimates
WB456286
Typewritten Text

9
There is plenty of room to further develop the tourism sector to increase its contribution to growth, shared prosperity and poverty reduction, and the public sector is well placed to undertake or help facilitate this development. As the experience of Costa Rica shows, the diversification of tourist sites to tap the huge potential of coastal areas as well as the potential for eco-tourism in rural areas will help expand the tourism sector and share its benefits across the country, generating jobs for local communities and contributing to reduce poverty and vulnerability. Implementing successfully the key activities and targets set in Cambodia’s 2012-2020 Tourism Development Strategic Plan (TDSP) will provide a sound basis, though more can be done to ensure greatest impact. While the TDSP’s focus on connecting and facilitating air travel will help increase tourist arrival numbers, a larger impact can be obtained by simultaneously developing physical infrastructure, particularly publicly financed paved and rural roads, as half of total arrivals is via land. Facilitating the development of privately financed hospitality and logistics support services will also be key to support tourism diversification and expansion. It is thus important to clearly define the roles of the public sector, local authorities, private sector and local communities, and to establish a well-functioning coordination arrangement to prioritize, implement, and monitor key activities and targets. For instance, efforts have been made to rehabilitate and expand a number of highways linking Cambodia to Thailand and Vietnam, but without sufficient coordination and prioritized resource allocation, maintaining the rehabilitated and expanded highways including its tourist information, rest stops, and toilet facilities in decent shape will likely remain a challenge. Similarly, central and provincial authorities have been making good efforts to strengthen safety, security, and the environment to attract tourists, but without the active participation of the local community those efforts may not be as effective. Coordination also at the regional level will help increase the attractiveness of joint tour packages. For instance, combining eco-tourism, cultural and beach packages with neighboring countries will attract tourists visiting the region to also come to Cambodia. As shown in Figure B1.2, the dependency of Cambodia‘s relatively new tourism sector on Thailand’s more developed tourism sector points out to the importance of close cooperation between ministries, agencies and private sector of the two countries.
Figure B1.1 Figure B1.2
-
5
10
15
20
25
30
1993
1994
1995
1996
1997
1998
1999
2000
2001
2002
2003
2004
2005
2006
2007
2008
2009
2010
2011
2012
2013
Cambodia Thailand
0.05
0.15
0.25
0.35
0.45
0.55
0.0
0.5
1.0
1.5
2.0
2.5
3.0
Jan-
05Ju
n-05
Nov
-05
Apr
-06
Sep-
06Fe
b-07
Jul-0
7D
ec-0
7M
ay-0
8O
ct-0
8M
ar-0
9A
ug-0
9Ja
n-10
Jun-
10N
ov-1
0A
pr-1
1Se
p-11
Feb-
12Ju
l-12
Dec
-12
May
-13
Oct
-13
Mar
-14
THA KHM (RHS)
Figure B1.3 Table B1. 1
0
2
4
6
8
10
12
14
16
18
1993
1994
1995
1996
1997
1998
1999
2000
2001
2002
2003
2004
2005
2006
2007
2008
2009
2010
2011
2012
2013
Cambodia arrival (as % Thailand arrival)
Cambodia ThailandTotal arrivals (2013, in million of tourists) 4.2 26.5
by air (percent of total) 50.0 65.0
Estimated tourism receipts/direct contribution (2013, in US$ mln) 2,547.0 39,282.3
In percent of GDP 16.0 10.0 Per visitor 605.0 1,479.7 Per day 120.7 150.2
Estimated tourism indirect contribution (2012, in US$ mln) 3,600.0 61,000.0
In percent of GDP 25.4 16.7
Length of stay (days) 6.7 9.8 Return visitors (percent of total) 16.0 50.0
Employment ('000 jobs) 1,083.4 6,838.6 Direct 320.1 2,019.9 Indirect 763.3 4,818.7
Tourism sector highlights
Development of the tourism sector (continued)Box 1
Closely follows (and reflects its dependency on) the trend & seasonal patterns of Thailand's arrivals.Arrivals to Cambodia (KHM) and Thailand (THA) (In million of tourists)
Cambodia’s international tourist arrival continues to rise. (In million of tourists)
It is increasing as a share of Thailand's international tourist arrival.
Source: Ministry of Tourism, Cambodia; Ministry of Tourism and Sports, Thailand; World Travel and Tourism Council (Travel and Tourism Economic Impact 2013 Thailand); and Bank staff estimates
10
Cambodia Joins the Olympians of Growth
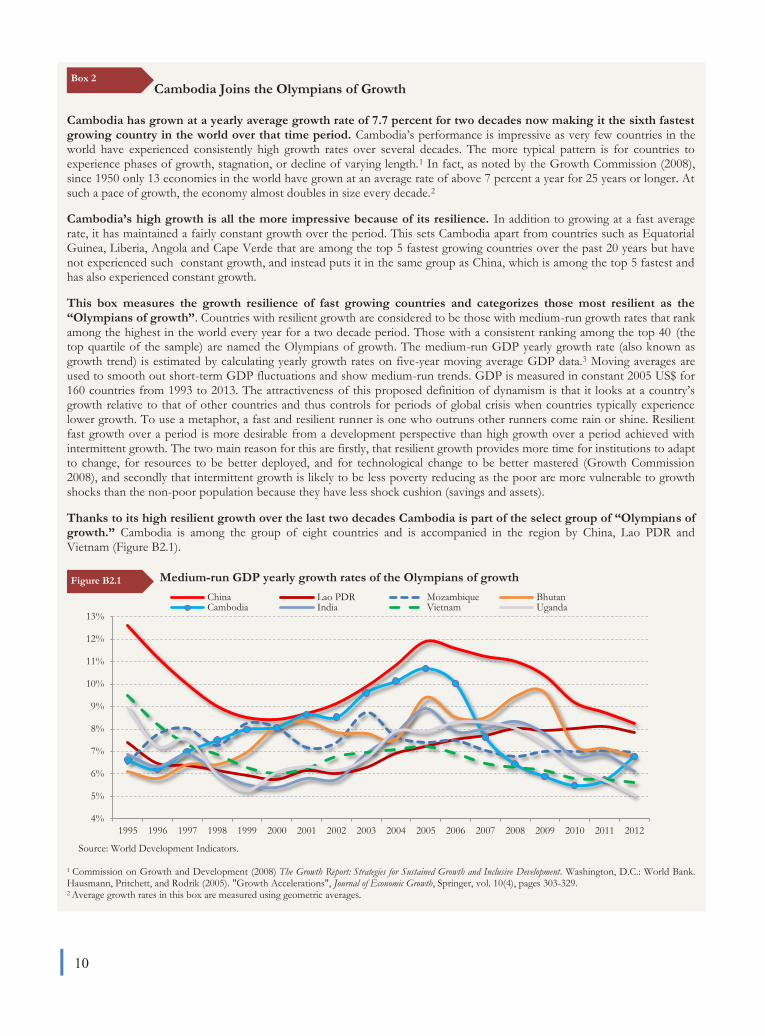
Cambodia has grown at a yearly average growth rate of 7.7 percent for two decades now making it the sixth fastest growing country in the world over that time period. Cambodia’s performance is impressive as very few countries in the world have experienced consistently high growth rates over several decades. The more typical pattern is for countries to experience phases of growth, stagnation, or decline of varying length.1 In fact, as noted by the Growth Commission (2008), since 1950 only 13 economies in the world have grown at an average rate of above 7 percent a year for 25 years or longer. At such a pace of growth, the economy almost doubles in size every decade.2
Cambodia’s high growth is all the more impressive because of its resilience. In addition to growing at a fast average rate, it has maintained a fairly constant growth over the period. This sets Cambodia apart from countries such as Equatorial Guinea, Liberia, Angola and Cape Verde that are among the top 5 fastest growing countries over the past 20 years but have not experienced such constant growth, and instead puts it in the same group as China, which is among the top 5 fastest and has also experienced constant growth.
This box measures the growth resilience of fast growing countries and categorizes those most resilient as the “Olympians of growth”. Countries with resilient growth are considered to be those with medium-run growth rates that rank among the highest in the world every year for a two decade period. Those with a consistent ranking among the top 40 (the top quartile of the sample) are named the Olympians of growth. The medium-run GDP yearly growth rate (also known as growth trend) is estimated by calculating yearly growth rates on five-year moving average GDP data.3 Moving averages are used to smooth out short-term GDP fluctuations and show medium-run trends. GDP is measured in constant 2005 US$ for 160 countries from 1993 to 2013. The attractiveness of this proposed definition of dynamism is that it looks at a country’s growth relative to that of other countries and thus controls for periods of global crisis when countries typically experience lower growth. To use a metaphor, a fast and resilient runner is one who outruns other runners come rain or shine. Resilient fast growth over a period is more desirable from a development perspective than high growth over a period achieved with intermittent growth. The two main reason for this are firstly, that resilient growth provides more time for institutions to adapt to change, for resources to be better deployed, and for technological change to be better mastered (Growth Commission 2008), and secondly that intermittent growth is likely to be less poverty reducing as the poor are more vulnerable to growth shocks than the non-poor population because they have less shock cushion (savings and assets).
Thanks to its high resilient growth over the last two decades Cambodia is part of the select group of “Olympians of growth.” Cambodia is among the group of eight countries and is accompanied in the region by China, Lao PDR and Vietnam (Figure B2.1).
Medium-run GDP yearly growth rates of the Olympians of growth
Source: World Development Indicators.
1 Commission on Growth and Development (2008) The Growth Report: Strategies for Sustained Growth and Inclusive Development. Washington, D.C.: World Bank. Hausmann, Pritchett, and Rodrik (2005). "Growth Accelerations", Journal of Economic Growth, Springer, vol. 10(4), pages 303-329. 2 Average growth rates in this box are measured using geometric averages.
Box 2
4%
5%
6%
7%
8%
9%
10%
11%
12%
13%
1995 1996 1997 1998 1999 2000 2001 2002 2003 2004 2005 2006 2007 2008 2009 2010 2011 2012
China Lao PDR Mozambique BhutanCambodia India Vietnam Uganda
Figure B2.1
Cambodia Joins the Olympians of Growth (continued)
Cambodia’s growth has been driven by four engines. These four engines of growth are: garment exports, tourism, crops and construction/real estate. Growth was spurred by both factor accumulation and productivity gains, which were favored by an expansion of international trade and sustained investment. Growth decomposition shows that factor accumulation contributed, on average, about 4 percentage points to potential GDP growth, with roughly equal contributions from capital (2 percentage points) and labor accumulation (2 percentage points) over the 1987–2011 period. Growth in productivity contributed about 3 percentage points to potential GDP growth on average, and has been a relatively stable source of growth for Cambodia.4
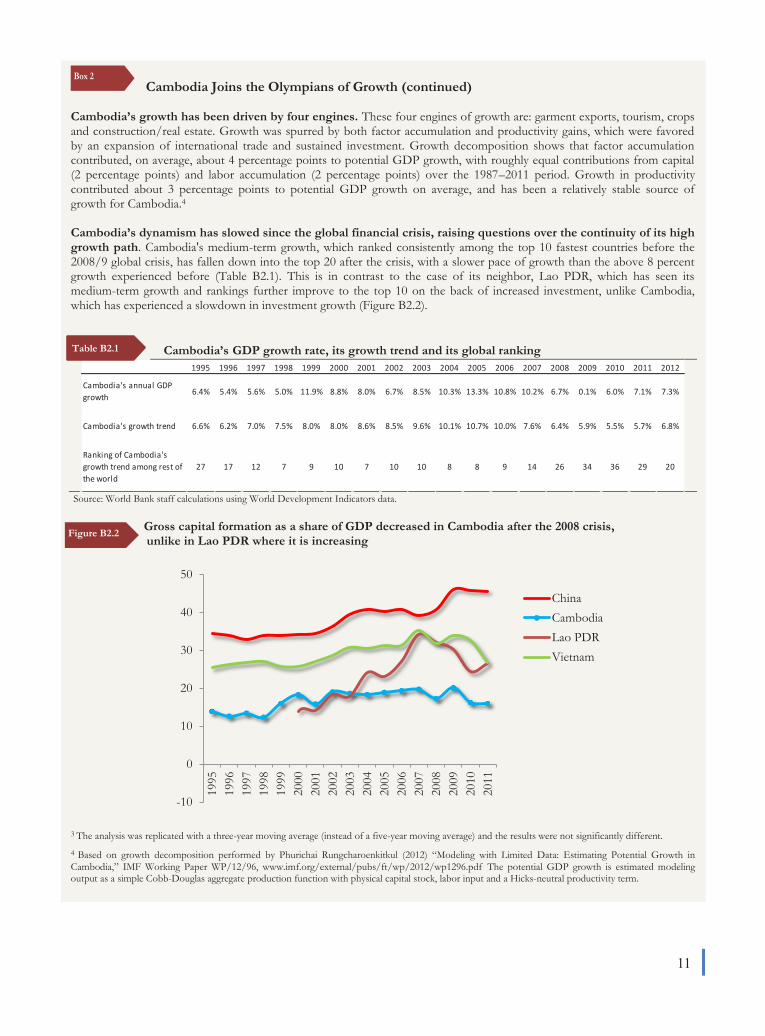
Cambodia’s dynamism has slowed since the global financial crisis, raising questions over the continuity of its high growth path. Cambodia's medium-term growth, which ranked consistently among the top 10 fastest countries before the 2008/9 global crisis, has fallen down into the top 20 after the crisis, with a slower pace of growth than the above 8 percent growth experienced before (Table B2.1). This is in contrast to the case of its neighbor, Lao PDR, which has seen its medium-term growth and rankings further improve to the top 10 on the back of increased investment, unlike Cambodia, which has experienced a slowdown in investment growth (Figure B2.2).
Cambodia’s GDP growth rate, its growth trend and its global ranking
Source: World Bank staff calculations using World Development Indicators data.
Gross capital formation as a share of GDP decreased in Cambodia after the 2008 crisis, unlike in Lao PDR where it is increasing
3 The analysis was replicated with a three-year moving average (instead of a five-year moving average) and the results were not significantly different. 4 Based on growth decomposition performed by Phurichai Rungcharoenkitkul (2012) “Modeling with Limited Data: Estimating Potential Growth in Cambodia,” IMF Working Paper WP/12/96, www.imf.org/external/pubs/ft/wp/2012/wp1296.pdf The potential GDP growth is estimated modeling output as a simple Cobb-Douglas aggregate production function with physical capital stock, labor input and a Hicks-neutral productivity term.
Box 2
1995 1996 1997 1998 1999 2000 2001 2002 2003 2004 2005 2006 2007 2008 2009 2010 2011 2012
Cambodia's annual GDP growth 6.4% 5.4% 5.6% 5.0% 11.9% 8.8% 8.0% 6.7% 8.5% 10.3% 13.3% 10.8% 10.2% 6.7% 0.1% 6.0% 7.1% 7.3%
Cambodia's growth trend 6.6% 6.2% 7.0% 7.5% 8.0% 8.0% 8.6% 8.5% 9.6% 10.1% 10.7% 10.0% 7.6% 6.4% 5.9% 5.5% 5.7% 6.8%
Ranking of Cambodia's growth trend among rest of the world
27 17 12 7 9 10 7 10 10 8 8 9 14 26 34 36 29 20
-10
0
10
20
30
40
50
1995
1996
1997
1998
1999
2000
2001
2002
2003
2004
2005
2006
2007
2008
2009
2010
2011
ChinaCambodiaLao PDRVietnam
Figure B2.2
Table B2.1
11
Cambodia Joins the Olympians of Growth (continued)
Cambodia’s growth has been driven by four engines. These four engines of growth are: garment exports, tourism, crops and construction/real estate. Growth was spurred by both factor accumulation and productivity gains, which were favored by an expansion of international trade and sustained investment. Growth decomposition shows that factor accumulation contributed, on average, about 4 percentage points to potential GDP growth, with roughly equal contributions from capital (2 percentage points) and labor accumulation (2 percentage points) over the 1987–2011 period. Growth in productivity contributed about 3 percentage points to potential GDP growth on average, and has been a relatively stable source of growth for Cambodia.4
Cambodia’s dynamism has slowed since the global financial crisis, raising questions over the continuity of its high growth path. Cambodia's medium-term growth, which ranked consistently among the top 10 fastest countries before the 2008/9 global crisis, has fallen down into the top 20 after the crisis, with a slower pace of growth than the above 8 percent growth experienced before (Table B2.1). This is in contrast to the case of its neighbor, Lao PDR, which has seen its medium-term growth and rankings further improve to the top 10 on the back of increased investment, unlike Cambodia, which has experienced a slowdown in investment growth (Figure B2.2).
Cambodia’s GDP growth rate, its growth trend and its global ranking
Source: World Bank staff calculations using World Development Indicators data.
Gross capital formation as a share of GDP decreased in Cambodia after the 2008 crisis, unlike in Lao PDR where it is increasing
3 The analysis was replicated with a three-year moving average (instead of a five-year moving average) and the results were not significantly different. 4 Based on growth decomposition performed by Phurichai Rungcharoenkitkul (2012) “Modeling with Limited Data: Estimating Potential Growth in Cambodia,” IMF Working Paper WP/12/96, www.imf.org/external/pubs/ft/wp/2012/wp1296.pdf The potential GDP growth is estimated modeling output as a simple Cobb-Douglas aggregate production function with physical capital stock, labor input and a Hicks-neutral productivity term.
Box 2
1995 1996 1997 1998 1999 2000 2001 2002 2003 2004 2005 2006 2007 2008 2009 2010 2011 2012
Cambodia's annual GDP growth 6.4% 5.4% 5.6% 5.0% 11.9% 8.8% 8.0% 6.7% 8.5% 10.3% 13.3% 10.8% 10.2% 6.7% 0.1% 6.0% 7.1% 7.3%
Cambodia's growth trend 6.6% 6.2% 7.0% 7.5% 8.0% 8.0% 8.6% 8.5% 9.6% 10.1% 10.7% 10.0% 7.6% 6.4% 5.9% 5.5% 5.7% 6.8%
Ranking of Cambodia's growth trend among rest of the world
27 17 12 7 9 10 7 10 10 8 8 9 14 26 34 36 29 20
-10
0
10
20
30
40
50
1995
1996
1997
1998
1999
2000
2001
2002
2003
2004
2005
2006
2007
2008
2009
2010
2011
ChinaCambodiaLao PDRVietnam
Figure B2.2
Table B2.1
12
-3,500
-3,000
-2,500
-2,000
-1,500
-1,000
-500
0
0
2,000
4,000
6,000
8,000
10,000
2008 2009 2010 2011 2012 2013 2014p
Other exports garment export
Trade deficit (RHS)
Source: National Bank of Cambodia and World Bank staff projections
2. External sector
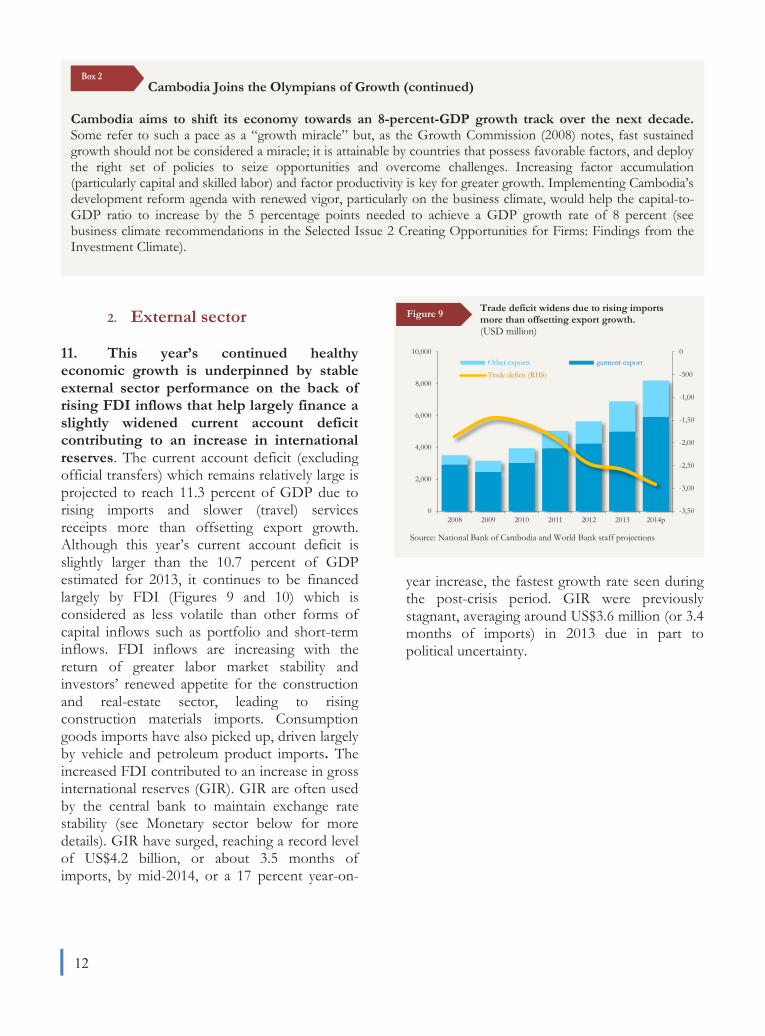
11. This year’s continued healthy economic growth is underpinned by stable external sector performance on the back of rising FDI inflows that help largely finance a slightly widened current account deficit contributing to an increase in international reserves. The current account deficit (excluding official transfers) which remains relatively large is projected to reach 11.3 percent of GDP due to rising imports and slower (travel) services receipts more than offsetting export growth. Although this year’s current account deficit is slightly larger than the 10.7 percent of GDP estimated for 2013, it continues to be financed largely by FDI (Figures 9 and 10) which is considered as less volatile than other forms of capital inflows such as portfolio and short-term inflows. FDI inflows are increasing with the return of greater labor market stability and investors’ renewed appetite for the construction and real-estate sector, leading to rising construction materials imports. Consumption goods imports have also picked up, driven largely by vehicle and petroleum product imports. The increased FDI contributed to an increase in gross international reserves (GIR). GIR are often used by the central bank to maintain exchange rate stability (see Monetary sector below for more details). GIR have surged, reaching a record level of US$4.2 billion, or about 3.5 months of imports, by mid-2014, or a 17 percent year-on-
year increase, the fastest growth rate seen during the post-crisis period. GIR were previously stagnant, averaging around US$3.6 million (or 3.4 months of imports) in 2013 due in part to political uncertainty.
Cambodia Joins the Olympians of Growth (continued)
Cambodia aims to shift its economy towards an 8-percent-GDP growth track over the next decade. Some refer to such a pace as a “growth miracle” but, as the Growth Commission (2008) notes, fast sustained growth should not be considered a miracle; it is attainable by countries that possess favorable factors, and deploy the right set of policies to seize opportunities and overcome challenges. Increasing factor accumulation (particularly capital and skilled labor) and factor productivity is key for greater growth. Implementing Cambodia’s development reform agenda with renewed vigor, particularly on the business climate, would help the capital-to-GDP ratio to increase by the 5 percentage points needed to achieve a GDP growth rate of 8 percent (see business climate recommendations in the Selected Issue 2 Creating Opportunities for Firms: Findings from the Investment Climate).
Box 2
Figure 9 Trade deficit widens due to rising imports more than offsetting export growth.(USD million)
a) Exports
12. The country’s macroeconomic stability is maintained partly by its stable external position backed by continued robust export growth. Export growth has continued thanks to the steady performance of the labor-intensive manufacturing exports such as garments and footwear. Exports have been supported by an improved global economic environment, the preferential treatment Cambodia receives under the EU's EBA scheme, and favorable external financing conditions including increased foreign investment. In value terms, agricultural commodity exports such as rice and rubber, however, continue to be adversely affected by dampened global agriculture commodity prices although their exports continue to grow in volume terms. Nevertheless, total export value in US dollar terms is estimated to have grown by more than 18 percent year-on-year by mid-2014, compared with only 14.5 percent in 2013, thanks to continued healthy garment exports.
b) Imports
12. Given Cambodia’s early stage ofeconomic development, the rising imports play an important role in supporting the rapidly growing service and manufacturing sectors. Import growth is picking up, driven by
rising imports of vehicles, petroleum products, and construction materials, as consumers and investor confidence has returned. Import growth appears slower than export growth during the first six months but is projected to accelerate during the second half of the year as confidence in the economy was restored with the end of the political deadlock in July this year.
3. Inflation
13. Thought there has been a slightincrease in inflation, price stability remains within acceptable levels fostering economic expansion and supporting poverty reduction. Inflation picked up slightly and reached 4.9 percent year-on-year by mid-2014, higher than its 4.6 percent value by the end of 2013 (Figure 11). Prices of most staple food items, which are the main driver of Cambodia’s consumer price index (CPI) covering 43.3 percent weight, remain stable. Some food items such as meat and fruit and non-food items such as utilities, however, continue to exert inflationary pressure due largely to rising demand.
14. Easing regional country inflation alsohelps contain inflation in Cambodia. Regional and other developing country inflation has eased since the second quarter of 2014 (Figure 12). The decline mainly reflects lower inflation in China in line with slower growth. Stable commodity prices
Figure 10
Figure 11 Contributions to 12-month inflation are largely driven by food sub-index. (CPI, Phnom Penh)
Widened current account deficit continues to be largely financed by FDI inflows. Current account and FDI (In percent of GDP)
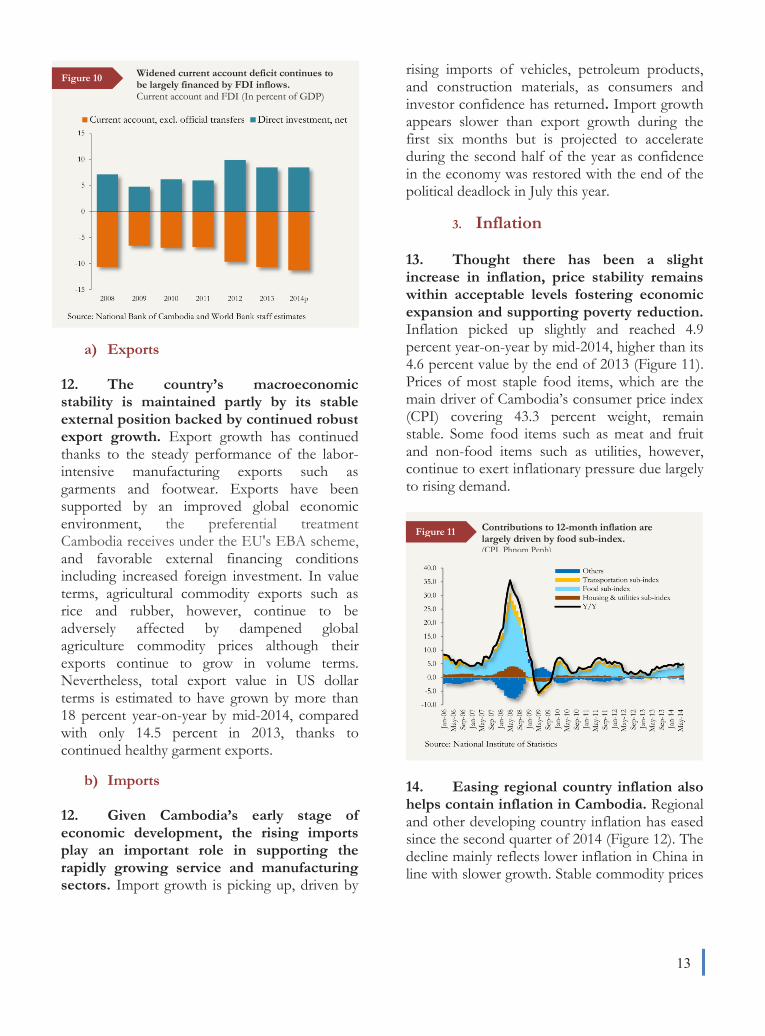
13
a) Exports
12. The country’s macroeconomic stability is maintained partly by its stable external position backed by continued robust export growth. Export growth has continued thanks to the steady performance of the labor-intensive manufacturing exports such as garments and footwear. Exports have been supported by an improved global economic environment, the preferential treatment Cambodia receives under the EU's EBA scheme, and favorable external financing conditions including increased foreign investment. In value terms, agricultural commodity exports such as rice and rubber, however, continue to be adversely affected by dampened global agriculture commodity prices although their exports continue to grow in volume terms. Nevertheless, total export value in US dollar terms is estimated to have grown by more than 18 percent year-on-year by mid-2014, compared with only 14.5 percent in 2013, thanks to continued healthy garment exports.
b) Imports
12. Given Cambodia’s early stage ofeconomic development, the rising imports play an important role in supporting the rapidly growing service and manufacturing sectors. Import growth is picking up, driven by
rising imports of vehicles, petroleum products, and construction materials, as consumers and investor confidence has returned. Import growth appears slower than export growth during the first six months but is projected to accelerate during the second half of the year as confidence in the economy was restored with the end of the political deadlock in July this year.
3. Inflation
13. Thought there has been a slightincrease in inflation, price stability remains within acceptable levels fostering economic expansion and supporting poverty reduction. Inflation picked up slightly and reached 4.9 percent year-on-year by mid-2014, higher than its 4.6 percent value by the end of 2013 (Figure 11). Prices of most staple food items, which are the main driver of Cambodia’s consumer price index (CPI) covering 43.3 percent weight, remain stable. Some food items such as meat and fruit and non-food items such as utilities, however, continue to exert inflationary pressure due largely to rising demand.
14. Easing regional country inflation alsohelps contain inflation in Cambodia. Regional and other developing country inflation has eased since the second quarter of 2014 (Figure 12). The decline mainly reflects lower inflation in China in line with slower growth. Stable commodity prices
Figure 10
Figure 11 Contributions to 12-month inflation are largely driven by food sub-index. (CPI, Phnom Penh)
Widened current account deficit continues to be largely financed by FDI inflows. Current account and FDI (In percent of GDP)
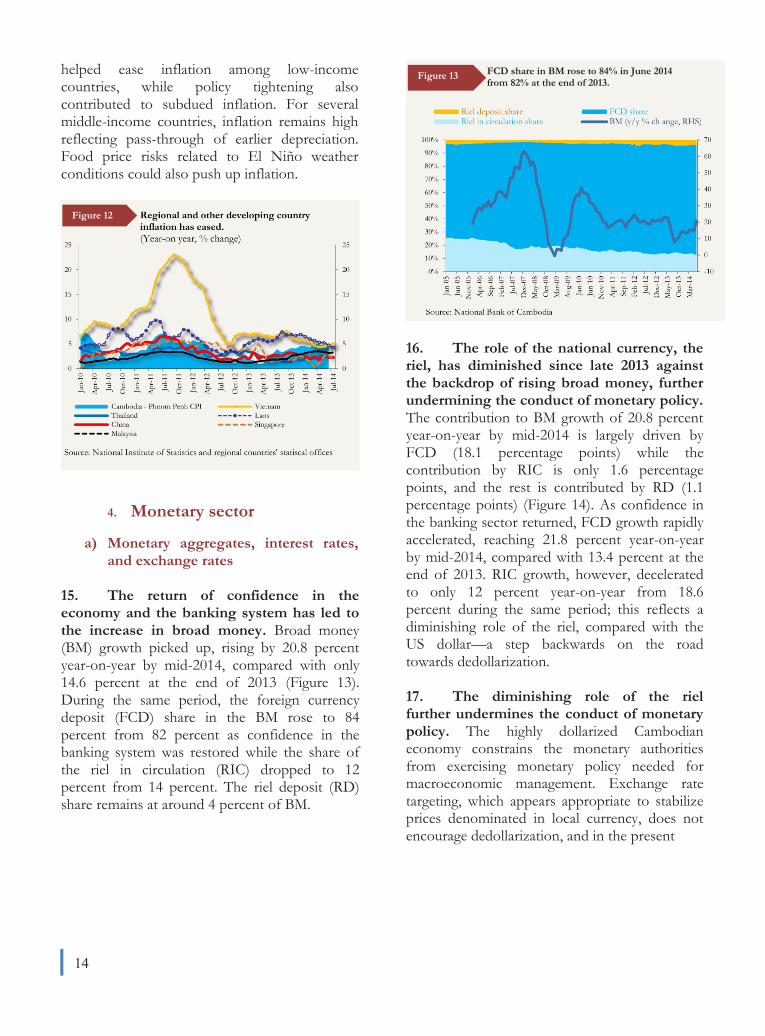
14
helped ease inflation among low-income countries, while policy tightening also contributed to subdued inflation. For several middle-income countries, inflation remains high reflecting pass-through of earlier depreciation. Food price risks related to El Niño weather conditions could also push up inflation.
4. Monetary sector
a) Monetary aggregates, interest rates,and exchange rates
15. The return of confidence in theeconomy and the banking system has led to the increase in broad money. Broad money (BM) growth picked up, rising by 20.8 percent year-on-year by mid-2014, compared with only 14.6 percent at the end of 2013 (Figure 13). During the same period, the foreign currency deposit (FCD) share in the BM rose to 84 percent from 82 percent as confidence in the banking system was restored while the share of the riel in circulation (RIC) dropped to 12 percent from 14 percent. The riel deposit (RD) share remains at around 4 percent of BM.
16. The role of the national currency, theriel, has diminished since late 2013 against the backdrop of rising broad money, further undermining the conduct of monetary policy. The contribution to BM growth of 20.8 percent year-on-year by mid-2014 is largely driven by FCD (18.1 percentage points) while the contribution by RIC is only 1.6 percentage points, and the rest is contributed by RD (1.1 percentage points) (Figure 14). As confidence in the banking sector returned, FCD growth rapidly accelerated, reaching 21.8 percent year-on-year by mid-2014, compared with 13.4 percent at the end of 2013. RIC growth, however, decelerated to only 12 percent year-on-year from 18.6 percent during the same period; this reflects a diminishing role of the riel, compared with the US dollar—a step backwards on the road towards dedollarization.
17. The diminishing role of the rielfurther undermines the conduct of monetary policy. The highly dollarized Cambodian economy constrains the monetary authorities from exercising monetary policy needed for macroeconomic management. Exchange rate targeting, which appears appropriate to stabilize prices denominated in local currency, does not encourage dedollarization, and in the present
Figure 12
Figure 13 FCD share in BM rose to 84% in June 2014 from 82% at the end of 2013.
context where Asian currencies are depreciating versus the US dollar, this also hurts Cambodia’s export competitiveness. Although gross international reserves reached a record level of US$4.2 billion, or about 3.5 months of imports, by mid-2014, they remain low by regional standards and particularly in a context where the central bank cannot serve as a lender of last resort due to high dollarization.
18. Heightened competition among banks has contributed to easing domestic US dollar interest rates, and therefore, reducing borrowing costs, despite gradual Fed tapering.3 The US dollar (12-month) lending rate declined slightly, reaching 11.2 percent by April 2014, compared with 11.3 percent at the end of 2013 (Figure 15). Although the interest rate spread (the difference between the nominal lending rate and deposit rate) remains wide, it has been shrinking as result of heightened competition among banks. Capital inflows swiftly recovered after political instability declined earlier this year and helped ease borrowing costs.
3 According to the Minutes of the Federal Open Market Committee July 29–30, 2014 of the Federal Reserve System (Fed), the Committee agreed that, beginning in August, it would add to its holdings of agency MBS at a pace of $10 billion per month rather than $15 billion per month, and it would add to its holdings of Treasury securities at a pace of $15 billion per month rather than $20 billion per month.
19. The nominal and real effectiveexchange rates have experienced a slight appreciation during the first half of 2014. Exchange rate targeting has contributed to a stable riel versus US dollar exchange rate which has hovered at around riel 4,000/US$ for several years. The targeting, however, has resulted in an initial appreciation of the nominal effective exchange rate (NEER) and real effective exchange rate (REER), as the US dollar has recently appreciated against other major currencies such as the Euro and Chinese Yuan, the currencies of Cambodia’s major trading partners (Figure 16). The NEER index (2010=100) dropped to 103.3 in May 2014 from 103.9 at the end of 2013, while the REER index also shrank to 109.5 from 109.9 during the same period. As the US dollar strengthened, so the riel/US$ exchange rate has slightly depreciated, reaching riel 4,040/US$ by mid-2014, compared with riel 3,995/US$ at the end of 2013.
Figure 14 FCD growth is accelerating as confidence in the banking sector returns. Contribution to broad money growth (y/y % change)
Glo
bal f
inan
cial c
risis
July
2013
elec
tion
Figure 15

15
context where Asian currencies are depreciating versus the US dollar, this also hurts Cambodia’s export competitiveness. Although gross international reserves reached a record level of US$4.2 billion, or about 3.5 months of imports, by mid-2014, they remain low by regional standards and particularly in a context where the central bank cannot serve as a lender of last resort due to high dollarization.
18. Heightened competition among banks has contributed to easing domestic US dollar interest rates, and therefore, reducing borrowing costs, despite gradual Fed tapering.3 The US dollar (12-month) lending rate declined slightly, reaching 11.2 percent by April 2014, compared with 11.3 percent at the end of 2013 (Figure 15). Although the interest rate spread (the difference between the nominal lending rate and deposit rate) remains wide, it has been shrinking as result of heightened competition among banks. Capital inflows swiftly recovered after political instability declined earlier this year and helped ease borrowing costs.
3 According to the Minutes of the Federal Open Market Committee July 29–30, 2014 of the Federal Reserve System (Fed), the Committee agreed that, beginning in August, it would add to its holdings of agency MBS at a pace of $10 billion per month rather than $15 billion per month, and it would add to its holdings of Treasury securities at a pace of $15 billion per month rather than $20 billion per month.
19. The nominal and real effectiveexchange rates have experienced a slight appreciation during the first half of 2014. Exchange rate targeting has contributed to a stable riel versus US dollar exchange rate which has hovered at around riel 4,000/US$ for several years. The targeting, however, has resulted in an initial appreciation of the nominal effective exchange rate (NEER) and real effective exchange rate (REER), as the US dollar has recently appreciated against other major currencies such as the Euro and Chinese Yuan, the currencies of Cambodia’s major trading partners (Figure 16). The NEER index (2010=100) dropped to 103.3 in May 2014 from 103.9 at the end of 2013, while the REER index also shrank to 109.5 from 109.9 during the same period. As the US dollar strengthened, so the riel/US$ exchange rate has slightly depreciated, reaching riel 4,040/US$ by mid-2014, compared with riel 3,995/US$ at the end of 2013.
Figure 14 FCD growth is accelerating as confidence in the banking sector returns. Contribution to broad money growth (y/y % change)
Glo
bal f
inan
cial c
risis
July
2013
elec
tion
Figure 15

16
b) The banking sector
20. Private sector deposit growth pickedup swiftly thanks to renewed confidence, contributing to greater stability in the banking sector. Private sector deposits reached US$8.09 billion, or a 22.2 percent year-on-year increase, by mid-2014, compared with US$6.88 billion, or a 14.2 percent year-on-year increase, at the end of 2013 (note that private sector deposits declined during the post-election period, covering July to August 2013, contracting from US$6.5 billion in June to US$5.9 billion in August, but recovering in November). Credit growth, which was exceptionally high during the past few years, has moderated, falling to 21.8 percent year-on-year with an outstanding credit amount of US$7.58 billion by mid-2014, down from 26.7 percent with an outstanding credit amount of US$6.91 billion at the end of 2013. Increased deposit growth together with moderated credit growth have resulted in the loan-to-deposit ratio decreasing to 82.2 percent by mid-2014, down from 90 percent at the end of 2013 (Figure 17).
21. The financial and banking sectorcontinues to support the services sector (an important engine of GDP growth), in particular, wholesale and retail businesses. Wholesale and retail businesses continue to absorb about one third of the total credit flowing into the private sector. Other than that, credit does not appear to be highly concentrated in a single or a few sectors (Figure 18).
5. Fiscal sector
Fiscal performance has been further strengthened; providing additional financing
Figure 16 Figure 17
Figure 18
to support rising essential public spending without undermining macroeconomic stability. Revenue collection has expanded rapidly, rising by 21 percent during the first four months while expenditure, which was initially slow, will likely remain as budgeted. The overall fiscal deficit (including grants) improved, reaching 2.7 percent of GDP in 2013 and is projected to further reduce to 2.5 percent of GDP in 2014.
a) Revenue composition
22. The general government domesticrevenue is projected to increase to 16 percent of GDP, or US$2.68 billion, in 2014 thanks to improved revenue administration (Figure 19). In 2013, domestic revenue fell to 15.1 percent of GDP, down from 15.3 percent of GDP in 2012, as the increase in indirect tax collection was more than offset by the drop in non-tax and provincial revenues. Cambodia’s domestic revenue is heavily reliant on indirect taxes. Value-added tax alone contributed to more than one third of total tax revenue in 2013, while trade taxes (including excise on imports) contributed about 20 percent. Direct taxes, which cover mainly corporate income tax, continue to be modest due to generous tax incentives. Domestic revenue in 2014 is projected to increase thanks to improvements in revenue administration (Box 3) and expansion of economic activity including imports.
b) Expenditure composition
23. Total general government expenditure is projected to be in line with the budgeted 20.4 percent of GDP in 2014, or US$3.4 billion (Figure 20). This is well below the 21.5 percent of GDP disbursed in 2013, which was an election year. Thanks to grants and concessional borrowing, Cambodia has been able to allocate most of its domestic revenue during the previous years to cover its recurrent spending amounting to about 12 percent of GDP (55 percent of the total outlays), while also maintaining large capital spending at around 8 percent of GDP (45 percent of the total outlays) of which three-quarters are externally financed.
Figure 19
Improving revenue administration
The RGC, under the Public Financial Management Reform Program (PFMRP), is working to strengthen revenue administration. Revenue enhancement measures include establishing the medium-term revenue mobilization strategy 2014-18, strengthening the automated system for customs data (ASYCUDA), and improving the customs risk-management database system with better functions, risk indicators, and post-clearance audits. Other revenue enhancement activities consist of: inter-ministerial working groups to discuss and coordinate on issues related to revenue mobilization from oil and gas, rollout of the non-tax revenue receipting system to subnational administrations, further strengthened and expanded self-assessed system of taxpayers, strengthened and expanded payment through banking system for medium-size taxpayers in the provinces, and further development of the code of conduct for tax officers. A legal and regulatory framework for revenue administration is also being defined, including draft laws on state property management and casinos.
Box 3
Source: 2014 PFMRP progress, Ministry of Economy and Finance
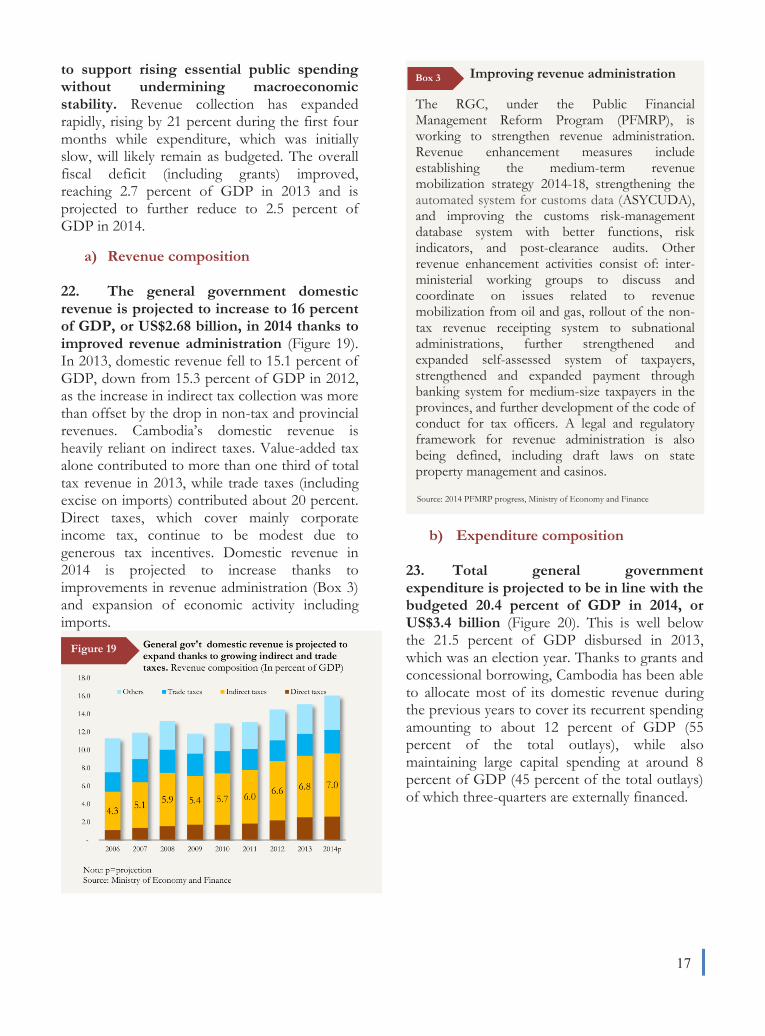
17
to support rising essential public spending without undermining macroeconomic stability. Revenue collection has expanded rapidly, rising by 21 percent during the first four months while expenditure, which was initially slow, will likely remain as budgeted. The overall fiscal deficit (including grants) improved, reaching 2.7 percent of GDP in 2013 and is projected to further reduce to 2.5 percent of GDP in 2014.
a) Revenue composition
22. The general government domesticrevenue is projected to increase to 16 percent of GDP, or US$2.68 billion, in 2014 thanks to improved revenue administration (Figure 19). In 2013, domestic revenue fell to 15.1 percent of GDP, down from 15.3 percent of GDP in 2012, as the increase in indirect tax collection was more than offset by the drop in non-tax and provincial revenues. Cambodia’s domestic revenue is heavily reliant on indirect taxes. Value-added tax alone contributed to more than one third of total tax revenue in 2013, while trade taxes (including excise on imports) contributed about 20 percent. Direct taxes, which cover mainly corporate income tax, continue to be modest due to generous tax incentives. Domestic revenue in 2014 is projected to increase thanks to improvements in revenue administration (Box 3) and expansion of economic activity including imports.
b) Expenditure composition
23. Total general government expenditure is projected to be in line with the budgeted 20.4 percent of GDP in 2014, or US$3.4 billion (Figure 20). This is well below the 21.5 percent of GDP disbursed in 2013, which was an election year. Thanks to grants and concessional borrowing, Cambodia has been able to allocate most of its domestic revenue during the previous years to cover its recurrent spending amounting to about 12 percent of GDP (55 percent of the total outlays), while also maintaining large capital spending at around 8 percent of GDP (45 percent of the total outlays) of which three-quarters are externally financed.
Figure 19
Improving revenue administration
The RGC, under the Public Financial Management Reform Program (PFMRP), is working to strengthen revenue administration. Revenue enhancement measures include establishing the medium-term revenue mobilization strategy 2014-18, strengthening the automated system for customs data (ASYCUDA), and improving the customs risk-management database system with better functions, risk indicators, and post-clearance audits. Other revenue enhancement activities consist of: inter-ministerial working groups to discuss and coordinate on issues related to revenue mobilization from oil and gas, rollout of the non-tax revenue receipting system to subnational administrations, further strengthened and expanded self-assessed system of taxpayers, strengthened and expanded payment through banking system for medium-size taxpayers in the provinces, and further development of the code of conduct for tax officers. A legal and regulatory framework for revenue administration is also being defined, including draft laws on state property management and casinos.
Box 3
Source: 2014 PFMRP progress, Ministry of Economy and Finance
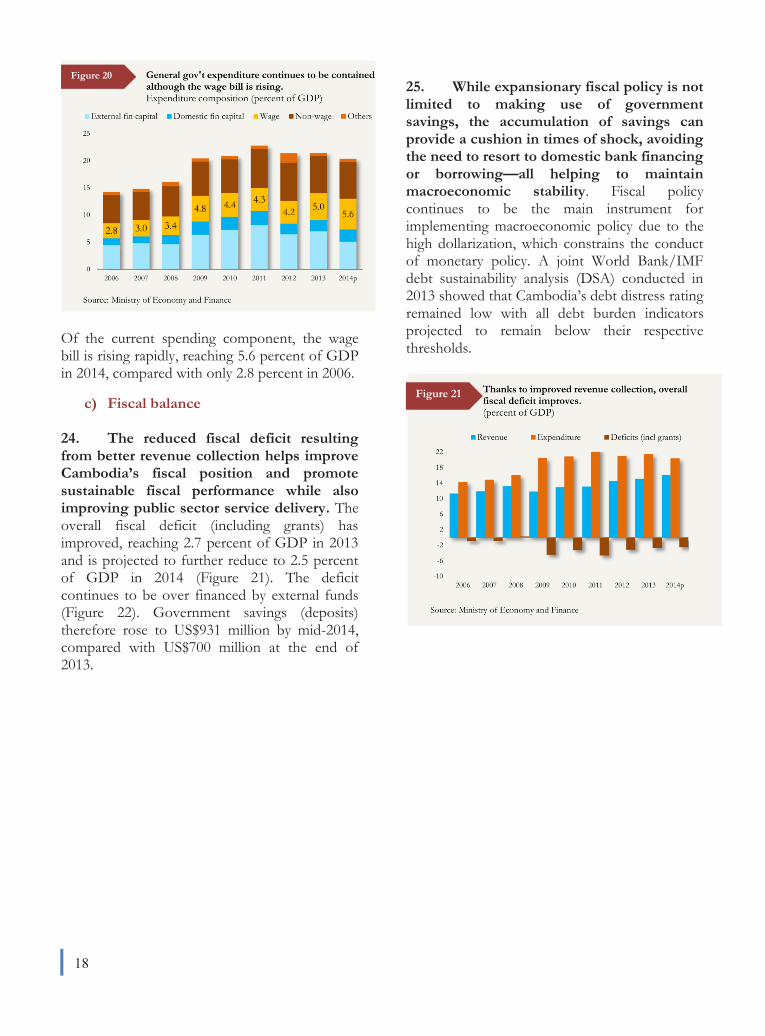
18
Of the current spending component, the wage bill is rising rapidly, reaching 5.6 percent of GDP in 2014, compared with only 2.8 percent in 2006.
c) Fiscal balance
24. The reduced fiscal deficit resultingfrom better revenue collection helps improve Cambodia’s fiscal position and promote sustainable fiscal performance while also improving public sector service delivery. The overall fiscal deficit (including grants) has improved, reaching 2.7 percent of GDP in 2013 and is projected to further reduce to 2.5 percent of GDP in 2014 (Figure 21). The deficit continues to be over financed by external funds (Figure 22). Government savings (deposits) therefore rose to US$931 million by mid-2014, compared with US$700 million at the end of 2013.
25. While expansionary fiscal policy is notlimited to making use of government savings, the accumulation of savings can provide a cushion in times of shock, avoiding the need to resort to domestic bank financing or borrowing—all helping to maintain macroeconomic stability. Fiscal policy continues to be the main instrument for implementing macroeconomic policy due to the high dollarization, which constrains the conduct of monetary policy. A joint World Bank/IMF debt sustainability analysis (DSA) conducted in 2013 showed that Cambodia’s debt distress rating remained low with all debt burden indicators projected to remain below their respective thresholds.
Figure 20
Figure 21 Key messages and recommendations
26. Cambodia is on track to post anotheryear of high growth thanks to the incipient recovery in developed economies and the waning of domestic uncertainty. Investor confidence has returned after a period of uncertainty that started in July 2013 and lasted until earlier this year, and with it investment has been revitalized. Maintaining peace and labor market stability will be critical to continue to attract foreign investment, support the expansion of the manufacturing sector and benefit to the greatest extent possible from the global recovery. Reaching a conclusive and transparent process of tripartite minimum wage negotiation will be instrumental in promoting the continued development of the garment sector.
27. The relative weights of Cambodia’susual engines of growth have changed, suggesting a need to stimulate the agriculture and tourism sectors, which have experienced a growth slowdown. A review of the allocation and the effectiveness of agricultural investments would be instrumental, especially for irrigation and extension, as rice production growth has been slow. This will help to ascertain
whether the earlier findings that recommended improving funding for agricultural research, increasing the effectiveness of irrigation investments by rehabilitating tertiary canals, and providing sufficient investment for irrigation systems maintenance and for agricultural extension remain valid and require addressing. More cost-efficient and faster logistics for exporting agricultural products would further stimulate rice sector growth and also help diversify agricultural exports. Enhanced preparedness for potential floods and droughts would increase the resilience of the agricultural sector, which is currently already facing weaker prices. Agriculture sector expansion and resilience to shocks have a direct positive impact on poverty as the majority of Cambodians remain dependent on the sector for their livelihoods.
28. Further developing the tourism sectorwould help it rebound. There is plenty of room to further develop the tourism sector, and the public sector is well placed to undertake or help facilitate this development by engaging further with the private sector. Cambodia’s ecotourism is underdeveloped and has a huge potential together with the development of coastal areas. As the experience of Costa Rica shows, the promotion of a diversified tourism could help raise arrival numbers and increase the impact of tourism on shared prosperity and poverty reduction through increased jobs in rural areas. As 50 percent of tourist arrivals are by land, the rehabilitation and development of roads connecting tourist attraction sites to the borders would have a significant impact on tourist arrivals. Greater coordination between national government, local government, private sector and local communities would help increase the diversification efforts. Promoting stability, regional cooperation, enhanced partnerships with neighboring countries, hospitality and safety would all help to further expand the sector.
29. Facilitating the growth of themanufacturing sector will also be instrumental to maintain and boost economic growth. As highlighted in the
Figure 22

19
Key messages and recommendations
26. Cambodia is on track to post anotheryear of high growth thanks to the incipient recovery in developed economies and the waning of domestic uncertainty. Investor confidence has returned after a period of uncertainty that started in July 2013 and lasted until earlier this year, and with it investment has been revitalized. Maintaining peace and labor market stability will be critical to continue to attract foreign investment, support the expansion of the manufacturing sector and benefit to the greatest extent possible from the global recovery. Reaching a conclusive and transparent process of tripartite minimum wage negotiation will be instrumental in promoting the continued development of the garment sector.
27. The relative weights of Cambodia’susual engines of growth have changed, suggesting a need to stimulate the agriculture and tourism sectors, which have experienced a growth slowdown. A review of the allocation and the effectiveness of agricultural investments would be instrumental, especially for irrigation and extension, as rice production growth has been slow. This will help to ascertain
whether the earlier findings that recommended improving funding for agricultural research, increasing the effectiveness of irrigation investments by rehabilitating tertiary canals, and providing sufficient investment for irrigation systems maintenance and for agricultural extension remain valid and require addressing. More cost-efficient and faster logistics for exporting agricultural products would further stimulate rice sector growth and also help diversify agricultural exports. Enhanced preparedness for potential floods and droughts would increase the resilience of the agricultural sector, which is currently already facing weaker prices. Agriculture sector expansion and resilience to shocks have a direct positive impact on poverty as the majority of Cambodians remain dependent on the sector for their livelihoods.
28. Further developing the tourism sectorwould help it rebound. There is plenty of room to further develop the tourism sector, and the public sector is well placed to undertake or help facilitate this development by engaging further with the private sector. Cambodia’s ecotourism is underdeveloped and has a huge potential together with the development of coastal areas. As the experience of Costa Rica shows, the promotion of a diversified tourism could help raise arrival numbers and increase the impact of tourism on shared prosperity and poverty reduction through increased jobs in rural areas. As 50 percent of tourist arrivals are by land, the rehabilitation and development of roads connecting tourist attraction sites to the borders would have a significant impact on tourist arrivals. Greater coordination between national government, local government, private sector and local communities would help increase the diversification efforts. Promoting stability, regional cooperation, enhanced partnerships with neighboring countries, hospitality and safety would all help to further expand the sector.
29. Facilitating the growth of themanufacturing sector will also be instrumental to maintain and boost economic growth. As highlighted in the
Figure 22

20
Selected Issue 2, the latest Enterprise Survey of the forthcoming Investment Climate Assessment indicates that the business environment continues to hamper the competitiveness of firms in Cambodia. The key constraints for firms continue to be electricity cost and access, informal payments and uncompetitive practices. The survey also shows that Special Economic Zones (SEZ), which were meant to provide an improved business environment, are not yet delivering the benefits expected by foreign investors.
30. Further efforts to increase revenuesand efficiency in spending will allow increased social spending and public investment. Continued broadening of the tax base and strengthening tax administration will boost revenue collection, which in turn will allow for more public investments in key social and economic sectors such as education, skills development, and infrastructure.
31. Enhancing banking supervision tostrengthen the financial sector and moves to regain monetary policy independence will support macro-financial management. The recently introduced risk-based supervision process is an important step towards promoting financial stability. The Central Bank is currently promoting the use of the riel and also implementing its Financial Sector Development Strategy 2011-2020.
32. Focusing on implementation. Most ofthe messages above are not new to Cambodia and are rightly identified in the RGC’s new five-year RS III; the key challenge for Cambodia is developing a reform agenda and effectively implementing it4, which will require increased inter-ministerial coordination, leadership, and most importantly, the monitoring of specific targets linked to those reforms. Successful implementation of the reforms could help
4 An example of implementation not reaching the expected speed is the similarity between the actions included in the updated 12 action plan for trade facilitation of 2014 and of 2004.
Cambodia return to a GDP growth path of above 8 percent.
Cambodia rice production, 2008-13
Source: Ministry of Agriculture, Forestry, and Fisheries
Figure S1.1
Selected Issue 1 – Making the most of the Cambodian Rice Sector
1. Motivation
1. Rice is important for Cambodia inmany respects. Rice production accounts for 15 percent of agricultural value added and paddy occupies 75 percent of the cultivated land. Rice production, processing, and marketing are estimated to employ 3 million people, more than one-fifth of the country's population. In the last decade, half of the poverty reduction has been driven by higher rice prices, increased rice production, and higher farm wages.5 Given the criticality of rice, the RGC developed in 2010 a Rice Policy to further develop the sector and set an export target of one million tons of milled rice. Among the notable achievements are the doubling of paddy production, from 4.3 million tons in 2003 to 9.3 million tons in 2013, and the significant increase in formal rice export, from 12,600 tons in 2009 to 378,800 tons in 2013. There has also been increased international recognition with Cambodian jasmine rice receiving the best in the world award the past two years. This Special issue therefore reviews the latest progress in rice production, processing and exports and provides some recommendations for further development.
5 World Bank. 2013. “Where Have All The Poor Gone?-Cambodia Poverty Assessment 2013.” A World Bank Country Study, November 2013.
2. Rice production andprocessing
2. The majority of the rice farms inCambodia are smaller than 1 hectare (ha), have not yet obtain a formal land title and still use traditional methods. Access to credit is not significantly affected by the lack of a formal title as a soft title (letter of certification from village or commune chief) is also recognized by local micro-financial institutions as collateral. Many of the smaller farms still follow traditional methods with minimal use of purchased inputs. But more and more farmers, especially those with larger farms from 2 to 5 ha, are modernizing their production by using improved seed varieties, applying fertilizers, following good agricultural practices, and hiring mechanized services.6
3. Despite some disruption from theMekong River flood last year, Cambodia’s 2013 rice production slightly improved compared with that of 2012. Total paddy production in 2013 is estimated at 9.3 million tons (Figure S1.1), of which 77 percent (7.2 million tons) was from the wet season. The
6 World Bank. 2014. “Cambodia Agriculture in Transition: Opportunities and Risks.” February 6, 2014.

21
Cambodia rice production, 2008-13
Source: Ministry of Agriculture, Forestry, and Fisheries
Figure S1.1
Selected Issue 1 – Making the most of the Cambodian Rice Sector
1. Motivation
1. Rice is important for Cambodia inmany respects. Rice production accounts for 15 percent of agricultural value added and paddy occupies 75 percent of the cultivated land. Rice production, processing, and marketing are estimated to employ 3 million people, more than one-fifth of the country's population. In the last decade, half of the poverty reduction has been driven by higher rice prices, increased rice production, and higher farm wages.5 Given the criticality of rice, the RGC developed in 2010 a Rice Policy to further develop the sector and set an export target of one million tons of milled rice. Among the notable achievements are the doubling of paddy production, from 4.3 million tons in 2003 to 9.3 million tons in 2013, and the significant increase in formal rice export, from 12,600 tons in 2009 to 378,800 tons in 2013. There has also been increased international recognition with Cambodian jasmine rice receiving the best in the world award the past two years. This Special issue therefore reviews the latest progress in rice production, processing and exports and provides some recommendations for further development.
5 World Bank. 2013. “Where Have All The Poor Gone?-Cambodia Poverty Assessment 2013.” A World Bank Country Study, November 2013.
2. Rice production andprocessing
2. The majority of the rice farms inCambodia are smaller than 1 hectare (ha), have not yet obtain a formal land title and still use traditional methods. Access to credit is not significantly affected by the lack of a formal title as a soft title (letter of certification from village or commune chief) is also recognized by local micro-financial institutions as collateral. Many of the smaller farms still follow traditional methods with minimal use of purchased inputs. But more and more farmers, especially those with larger farms from 2 to 5 ha, are modernizing their production by using improved seed varieties, applying fertilizers, following good agricultural practices, and hiring mechanized services.6
3. Despite some disruption from theMekong River flood last year, Cambodia’s 2013 rice production slightly improved compared with that of 2012. Total paddy production in 2013 is estimated at 9.3 million tons (Figure S1.1), of which 77 percent (7.2 million tons) was from the wet season. The
6 World Bank. 2014. “Cambodia Agriculture in Transition: Opportunities and Risks.” February 6, 2014.
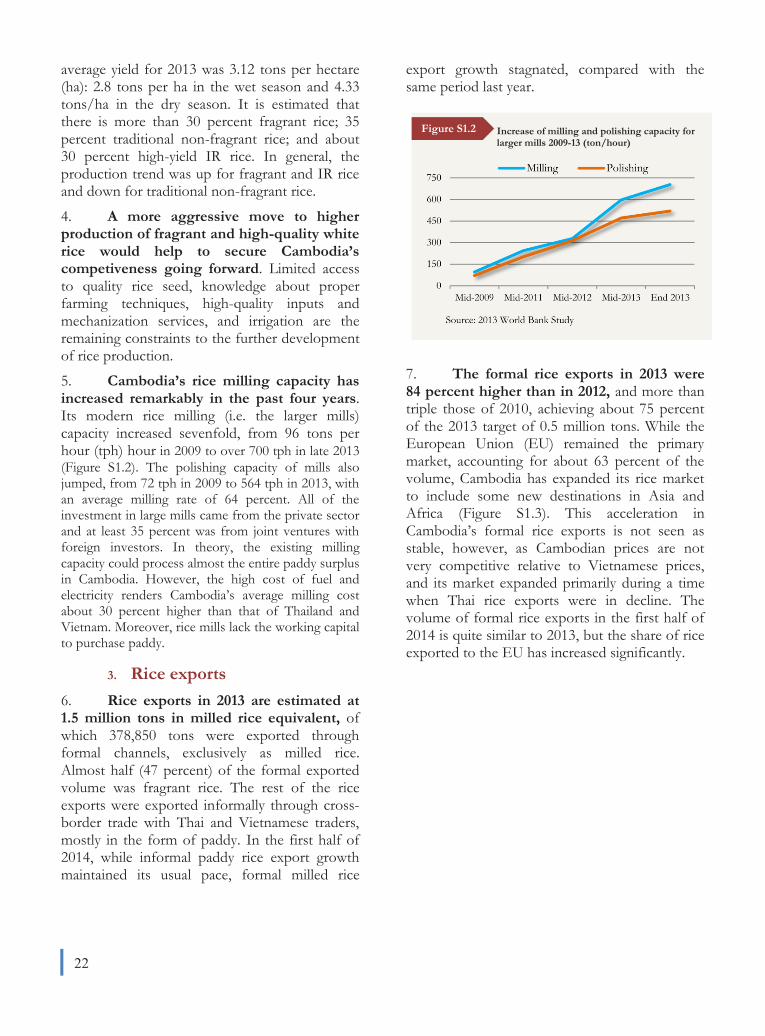
22
Increase of milling and polishing capacity for larger mills 2009-13 (ton/hour)
Figure S1.2
average yield for 2013 was 3.12 tons per hectare (ha): 2.8 tons per ha in the wet season and 4.33 tons/ha in the dry season. It is estimated that there is more than 30 percent fragrant rice; 35 percent traditional non-fragrant rice; and about 30 percent high-yield IR rice. In general, the production trend was up for fragrant and IR rice and down for traditional non-fragrant rice.
4. A more aggressive move to higherproduction of fragrant and high-quality white rice would help to secure Cambodia’s competiveness going forward. Limited access to quality rice seed, knowledge about proper farming techniques, high-quality inputs and mechanization services, and irrigation are the remaining constraints to the further development of rice production.
5. Cambodia’s rice milling capacity hasincreased remarkably in the past four years. Its modern rice milling (i.e. the larger mills) capacity increased sevenfold, from 96 tons per hour (tph) hour in 2009 to over 700 tph in late 2013 (Figure S1.2). The polishing capacity of mills also jumped, from 72 tph in 2009 to 564 tph in 2013, with an average milling rate of 64 percent. All of the investment in large mills came from the private sector and at least 35 percent was from joint ventures with foreign investors. In theory, the existing milling capacity could process almost the entire paddy surplus in Cambodia. However, the high cost of fuel and electricity renders Cambodia’s average milling cost about 30 percent higher than that of Thailand and Vietnam. Moreover, rice mills lack the working capital to purchase paddy.
3. Rice exports6. Rice exports in 2013 are estimated at1.5 million tons in milled rice equivalent, of which 378,850 tons were exported through formal channels, exclusively as milled rice. Almost half (47 percent) of the formal exported volume was fragrant rice. The rest of the rice exports were exported informally through cross-border trade with Thai and Vietnamese traders, mostly in the form of paddy. In the first half of 2014, while informal paddy rice export growth maintained its usual pace, formal milled rice
export growth stagnated, compared with the same period last year.
7. The formal rice exports in 2013 were84 percent higher than in 2012, and more than triple those of 2010, achieving about 75 percent of the 2013 target of 0.5 million tons. While the European Union (EU) remained the primary market, accounting for about 63 percent of the volume, Cambodia has expanded its rice market to include some new destinations in Asia and Africa (Figure S1.3). This acceleration in Cambodia’s formal rice exports is not seen as stable, however, as Cambodian prices are not very competitive relative to Vietnamese prices, and its market expanded primarily during a time when Thai rice exports were in decline. The volume of formal rice exports in the first half of 2014 is quite similar to 2013, but the share of rice exported to the EU has increased significantly.
4. Export procedures andlogistics
8. Cambodia’s export procedures weresomewhat simplified by the establishment of the Secretariat of the One Window Services for Rice Exports (SOW-REF). Although the time and cost for obtaining necessary approvals have been significantly reduced, there is still room for improvement in this area (Table S1.1). The recent commitments and reforms made by some relevant government ministries on this matter are quite promising.
9. Cambodia’s informal rice exportswent to Vietnam and Thailand via cross-border trade. This informal trade is known to all stakeholders, but its volume remains a rough estimate. It is believed that more than 1.7 million tons of paddy were exported to Vietnam during 2013, while around 0.25 million tons of paddy and 0.3 million tons of low-quality milled rice went to Thailand. It appears that the limited working capital of local millers and traders is seen as the main cause of this informal flow. On the positive side, informal exports provide rice farmers with a stable market, technology transfers, and a source of motivation, although less value-added stays in country.
10. Cambodia’s infrastructure and logistics have improved but do not yet fully facilitate rice exports. Cambodia’s rank in the Logistic Performance Index moved to 83 in 2014, up 46 places from 2010, a spectacular increase albeit still far behind Thailand and Vietnam (Table S1.2). A Road transport cost per container saw a 15 percent decline, but is still more than double the cost per kilometer than in Vietnam. Virtually all of Cambodia's formal rice exports are moved via container—a mode for which Cambodia is at a relative disadvantage. It also contrasts with global trends. Most of the non-aromatic rice and one third of the aromatic rice is transported as break bulk cargo in the rest of the world. The first phase of the extended Phnom Penh Mekong River Port has been completed and the port started operating in early 2013. The physical capacity upgrading of the sea port is ongoing. Reconstruction of the 256-km railway between Phnom Penh and the port of the Sihanoukville is complete but some additional structures are still needed for the railway to be advantageous for rice exports.
EBA rice export to the EU, tons, 2005/06-2012/13 Figure S1.3
Cambodia: Time and cost in rice export procedures, 2012 and 2013
Services Processing Costs Processing Time 2012 2013 2012 2013
Sanitary and Phytosanitary Certificate
$150/case $35/case 2 days 1 day
Fumigation Certificate
$20/ container
$35/ container
1 day 1 day
Certificate of Origin
$250/case $141/case 1 day 1 day
Custom Certificate
$25/ container
$6.50/ container
2 days ½ day
CamControl Certificate
$25/ container
$52.50/ container
2 days ½ day
GMO Certificate
$150/sample $80/sample 3-4 days 2-3 days
Average total*
$20/ton $14/ton 8 days 4 days
Source: World Bank team’s estimates based on information from key rice exporters and SOWS-REF. *The average services fee per ton is lower for the larger export size.
Table S1.1
Source: European Union
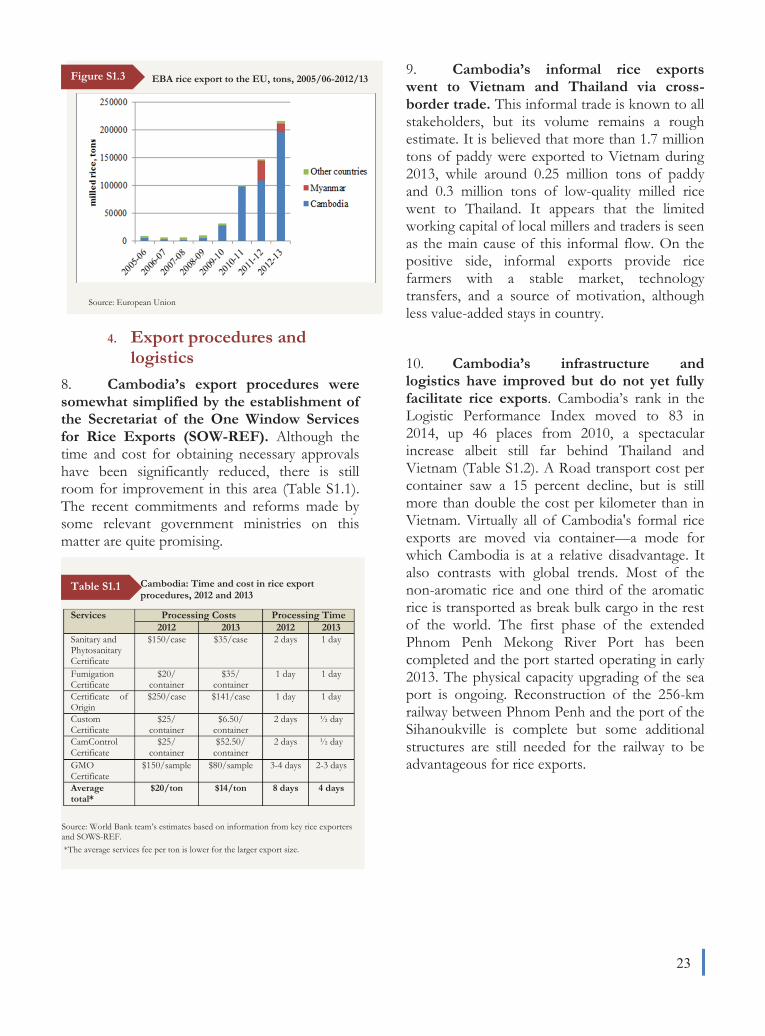
23
4. Export procedures andlogistics
8. Cambodia’s export procedures weresomewhat simplified by the establishment of the Secretariat of the One Window Services for Rice Exports (SOW-REF). Although the time and cost for obtaining necessary approvals have been significantly reduced, there is still room for improvement in this area (Table S1.1). The recent commitments and reforms made by some relevant government ministries on this matter are quite promising.
9. Cambodia’s informal rice exportswent to Vietnam and Thailand via cross-border trade. This informal trade is known to all stakeholders, but its volume remains a rough estimate. It is believed that more than 1.7 million tons of paddy were exported to Vietnam during 2013, while around 0.25 million tons of paddy and 0.3 million tons of low-quality milled rice went to Thailand. It appears that the limited working capital of local millers and traders is seen as the main cause of this informal flow. On the positive side, informal exports provide rice farmers with a stable market, technology transfers, and a source of motivation, although less value-added stays in country.
10. Cambodia’s infrastructure and logistics have improved but do not yet fully facilitate rice exports. Cambodia’s rank in the Logistic Performance Index moved to 83 in 2014, up 46 places from 2010, a spectacular increase albeit still far behind Thailand and Vietnam (Table S1.2). A Road transport cost per container saw a 15 percent decline, but is still more than double the cost per kilometer than in Vietnam. Virtually all of Cambodia's formal rice exports are moved via container—a mode for which Cambodia is at a relative disadvantage. It also contrasts with global trends. Most of the non-aromatic rice and one third of the aromatic rice is transported as break bulk cargo in the rest of the world. The first phase of the extended Phnom Penh Mekong River Port has been completed and the port started operating in early 2013. The physical capacity upgrading of the sea port is ongoing. Reconstruction of the 256-km railway between Phnom Penh and the port of the Sihanoukville is complete but some additional structures are still needed for the railway to be advantageous for rice exports.
EBA rice export to the EU, tons, 2005/06-2012/13 Figure S1.3
Cambodia: Time and cost in rice export procedures, 2012 and 2013
Services Processing Costs Processing Time 2012 2013 2012 2013
Sanitary and Phytosanitary Certificate
$150/case $35/case 2 days 1 day
Fumigation Certificate
$20/ container
$35/ container
1 day 1 day
Certificate of Origin
$250/case $141/case 1 day 1 day
Custom Certificate
$25/ container
$6.50/ container
2 days ½ day
CamControl Certificate
$25/ container
$52.50/ container
2 days ½ day
GMO Certificate
$150/sample $80/sample 3-4 days 2-3 days
Average total*
$20/ton $14/ton 8 days 4 days
Source: World Bank team’s estimates based on information from key rice exporters and SOWS-REF. *The average services fee per ton is lower for the larger export size.
Table S1.1
Source: European Union

24
5. Rice prices11. The price of rice in Cambodia continuesto follow the price of rice in Thailand and Vietnam (Figure S1.4). In 2013 and early 2014, Cambodia’s paddy prices were influenced more by Vietnamese prices than by Thai prices. The 2013 farm gate price of paddy was comparable to that of 2011 and 2012, and lower than the price in neighboring countries, as it typically is. Transportation costs often push down the farm gate paddy price in remote areas while non-fragrant quality paddy tends to experience more seasonal volatility than other varieties. At around US$270/ton, the ex-farm prices for Cambodian fragrant rice in 2013 were quite stable throughout the year, and lower than Vietnam’s prices. The Thai price was high for almost the whole year but
declined during December 2013 and the first half of 2014.
12. The 2013 regional rice trade pattern wasquite similar to that of 2012 but showed some signs of change. Vietnam’s total rice export volume in 2013 was 13 percent lower than in 2012, despite the fact that its rice price quotes are always the lowest in the region. The trend continues in 2014 as Vietnamese rice exports in the first half of 2014 (3.62 million tons) were 12 percent down compared with 2013 (4.1 million tons). Thailand’s rice market was disadvantaged by its rice pledging scheme, which was terminated in 2014 and is struggling to regain its position in 2014. Myanmar is in the recovery stage of returning to the world rice market with its recent reforms, and is encouraged by the “Everything but Arms” (EBA) status from the EU. India remains robust as the world’s lead rice exporter.
6. Conclusion13. Rice production growth decelerated in2013 highlighting the importance of revitalizing the rice sector so it becomes once again a key engine of GDP growth. Given the land area constraint, future rice production increases will depend more on the increase of rice productivity and quality than area expansion. 14. While the milled-rice export market issteadily expanding and increasing the number of destination markets, the milling and transport costs of Cambodian rice make it loose the competitiveness it has at farm gate prices. This is illustrated in Figure S1.5, which compares Cambodia’s white rice prices at the farm gate, miller and FOB with those of Vietnam and Thailand.
Cambodia’s Logistic Performance Index compared with neighbors, 2010-14
Logistic rank in LPI 2014 2010 2012 2014
Thailand 38 35
Vietnam 53 48 Cambodia 129 101 83
Myanmar 129 145
Table S1.2
Rice prices in selected Asian countries, US$/ton, 2006-13
Source: FAO GIEWS. Note: Mixed rice wholesale prices in Cambodia, 5% broken FOB Thailand, and 5% broken FOB Vietnam.
Figure S1.4
Prices of white rice per ton in 2013 at the farm gate, miller and FOB
Source: Staff calculations based on World Bank 2014 Rice Monitoring Note.
Figure S1.5
Source: World Bank
15. RGC has set a very legitimate target ofone million tons of milled rice exports that matters tremendously for poverty reduction and shared prosperity. The status quo in terms of farm productivity, milling, and logistics prevents Cambodia from meeting this target. Cambodia can increase the effectiveness of its liberal policy environment by increasing public investment in farm advisory services, technology development (especially seeds), rural transport, and irrigation infrastructure. In addition increasing the competitiveness of the milled-rice supply chain would enable Cambodia to significantly increase its presence in the global rice market. Better access for rice producers and processers to finance, lower electricity costs, and reduced costs of doing business would help increase the competitiveness of the milling industry. Improving logistics would also critically contribute to meeting the export target. Two important actions to reduce Cambodia’s high logistics costs are the transport of milled rice in bulk cargo, and not only by container, and making use of the Tonle Sap and the Mekong river, which experience from neighboring countries indicates could be half as expensive as transport by road. The private sector has already piloted the transport by river, but faced hurdles mostly of a bureaucratic nature that could be
overcome with the support of the RGC to fully tap the potential of Cambodia’s water ways. The establishment of a national logistics task force would help identify low hanging fruit and medium term actions, coordinate efforts between different ministries and stakeholders, assign implementers and effectively monitor implementation for greatest impact.

25
15. RGC has set a very legitimate target ofone million tons of milled rice exports that matters tremendously for poverty reduction and shared prosperity. The status quo in terms of farm productivity, milling, and logistics prevents Cambodia from meeting this target. Cambodia can increase the effectiveness of its liberal policy environment by increasing public investment in farm advisory services, technology development (especially seeds), rural transport, and irrigation infrastructure. In addition increasing the competitiveness of the milled-rice supply chain would enable Cambodia to significantly increase its presence in the global rice market. Better access for rice producers and processers to finance, lower electricity costs, and reduced costs of doing business would help increase the competitiveness of the milling industry. Improving logistics would also critically contribute to meeting the export target. Two important actions to reduce Cambodia’s high logistics costs are the transport of milled rice in bulk cargo, and not only by container, and making use of the Tonle Sap and the Mekong river, which experience from neighboring countries indicates could be half as expensive as transport by road. The private sector has already piloted the transport by river, but faced hurdles mostly of a bureaucratic nature that could be
overcome with the support of the RGC to fully tap the potential of Cambodia’s water ways. The establishment of a national logistics task force would help identify low hanging fruit and medium term actions, coordinate efforts between different ministries and stakeholders, assign implementers and effectively monitor implementation for greatest impact.

Selected Issue 2 – Creating Opportunities for Firms: Findings from the Investment Climate Assessment
1. Motivation
1. The Royal Government of Cambodia’s (RGC) new five-year Rectangular Strategy III (RS III) continues to prioritize improving the business environment to help diversify and increase value-added in production. Cambodia has seen a resurgence of foreign direct investment (FDI) in the wake of the global financial crisis. This FDI has mostly been attracted by its low wages, openness, “Everything But Arms” free access to the EU, and tax holidays, which help compensate for the high cost of doing business in the country. Despite this FDI and some initial signs of diversification (such as the establishment of Japanese firms involved in electronic parts and components), manufacturing and exports still remain for the most part heavily concentrated. Addressing the key constraints in the business environment will help to promote foreign and domestic investment in non-traditional areas, thereby helping to diversify and increase value-added in production.
2. Progress and remainingconstraints
2. Progress has been greatest on tradefacilitation. This is reflected in the impressive improvements in Cambodia’s ranking on the World Bank’s Logistics Performance Index (LPI). Cambodia has improved 46 places in the LPI rankings to 83 from 129 in 2010. Customs clearance times have fallen from 5.9 days in 2010 to only 1.4 days in 2014, while the percentage of consignments selected for inspection has fallen from 29 percent in 2010 to only 17 percent in 2014.
3. But despite such progress, thebusiness environment continues to hamper the competitiveness of firms in Cambodia, as reflected in the forth-coming World Bank and ADB Investment Climate Assessment (ICA) 2014. The major or severe constraints
faced by firms found in the ICA report are shown in Figure S2.1.
Electricity is now seen by firms as the numberone constraint on the business environment.Worries about electricity are 50 percent higher thanthey were in the 2007 survey. Not only is electricitymore expensive in Cambodia than in almostevery other country in the region, but thesupply is inefficient and intermittent.Cambodia’s electric power transmission anddistribution losses as a percentage of output arehigher than in any comparator country. Inaddition to having the highest loss rate in theregion, Cambodia’s proportion of losses in itsoutput has more than doubled since 2004.Manufacturers are forced to rely on electricalgenerators for a substantial amount of theirpower needs. This problem is particularly acutein the border regions where the specialeconomic zones (SEZs) are located. While theRGC has made strong efforts to increase theavailability of power supply through domesticproduction (hydropower plants) and imports, itis not yet clear how electricity will be madeavailable at a more affordable price in the near-term for the manufacturing sector.
Note: Data is from the World Bank Enterprise Survey 2012. Source: ICA 2014.
Figure S2.1 Major or severe constraints faced by all firms (registered and unregistered) in Cambodia, 2012
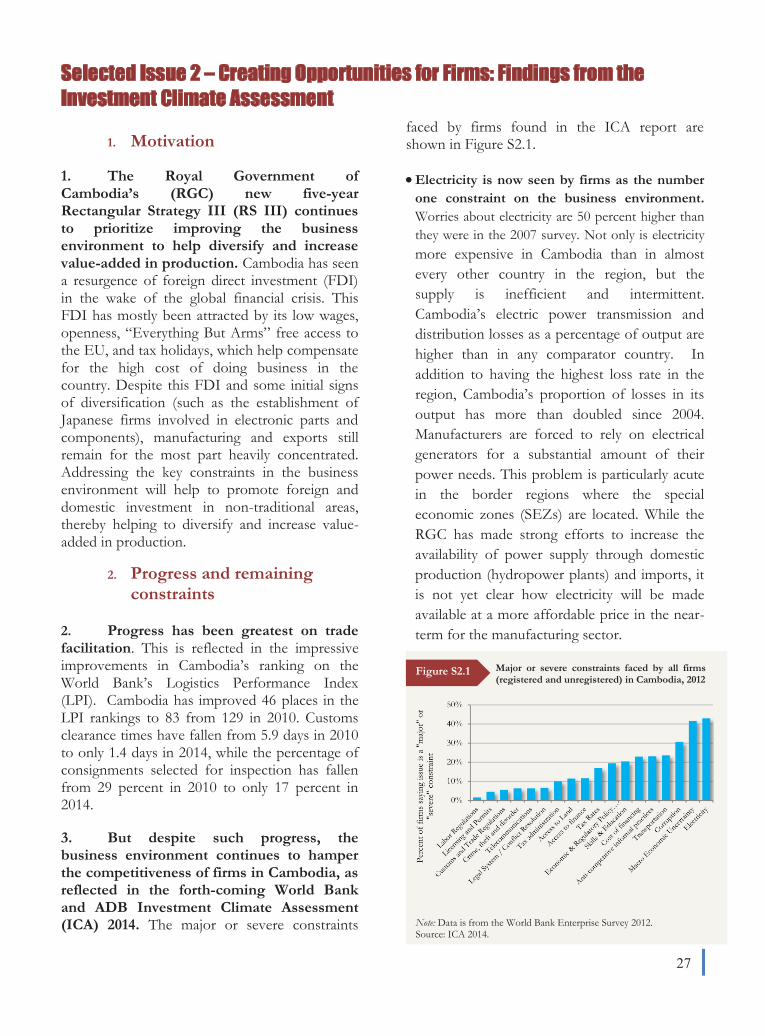
27
Selected Issue 2 – Creating Opportunities for Firms: Findings from the Investment Climate Assessment
1. Motivation
1. The Royal Government of Cambodia’s (RGC) new five-year Rectangular Strategy III (RS III) continues to prioritize improving the business environment to help diversify and increase value-added in production. Cambodia has seen a resurgence of foreign direct investment (FDI) in the wake of the global financial crisis. This FDI has mostly been attracted by its low wages, openness, “Everything But Arms” free access to the EU, and tax holidays, which help compensate for the high cost of doing business in the country. Despite this FDI and some initial signs of diversification (such as the establishment of Japanese firms involved in electronic parts and components), manufacturing and exports still remain for the most part heavily concentrated. Addressing the key constraints in the business environment will help to promote foreign and domestic investment in non-traditional areas, thereby helping to diversify and increase value-added in production.
2. Progress and remainingconstraints
2. Progress has been greatest on tradefacilitation. This is reflected in the impressive improvements in Cambodia’s ranking on the World Bank’s Logistics Performance Index (LPI). Cambodia has improved 46 places in the LPI rankings to 83 from 129 in 2010. Customs clearance times have fallen from 5.9 days in 2010 to only 1.4 days in 2014, while the percentage of consignments selected for inspection has fallen from 29 percent in 2010 to only 17 percent in 2014.
3. But despite such progress, thebusiness environment continues to hamper the competitiveness of firms in Cambodia, as reflected in the forth-coming World Bank and ADB Investment Climate Assessment (ICA) 2014. The major or severe constraints
faced by firms found in the ICA report are shown in Figure S2.1.
Electricity is now seen by firms as the numberone constraint on the business environment.Worries about electricity are 50 percent higher thanthey were in the 2007 survey. Not only is electricitymore expensive in Cambodia than in almostevery other country in the region, but thesupply is inefficient and intermittent.Cambodia’s electric power transmission anddistribution losses as a percentage of output arehigher than in any comparator country. Inaddition to having the highest loss rate in theregion, Cambodia’s proportion of losses in itsoutput has more than doubled since 2004.Manufacturers are forced to rely on electricalgenerators for a substantial amount of theirpower needs. This problem is particularly acutein the border regions where the specialeconomic zones (SEZs) are located. While theRGC has made strong efforts to increase theavailability of power supply through domesticproduction (hydropower plants) and imports, itis not yet clear how electricity will be madeavailable at a more affordable price in the near-term for the manufacturing sector.
Note: Data is from the World Bank Enterprise Survey 2012. Source: ICA 2014.
Figure S2.1 Major or severe constraints faced by all firms (registered and unregistered) in Cambodia, 2012

28
Informal payments are seen as the thirdmost important constraint among all firms,after macroeconomic uncertainty7, and asthe second most important constraint forregistered firms. Informal payment practicesremain widespread in Cambodia. While theamount of informal fees paid has declined as aproportion of overall sales, the incidence ofinformal practices has not diminished, implyingthat while official may be demanding informalfees less frequently, the proportion of firmspaying informal fees has not diminished (andthere are indications that for certain activitiessuch as importing goods, the proportion offirms paying gifts at the time of the survey hadincreased). In contrast, in Lao PDR informalpayments are perceived to be decreasing as amajor constraint between 2009 and 2012 (thedate of the latest ICA), as well as the briberyincidence.
Uncompetitive practices, which are closelyrelated to informal payments, rank fifth,after transport. The level of informality inCambodia is still high. Informal firms areperceived to have a price advantage over formalfirms and face fewer regulatory obstacles inconducting their activities. This competitiveedge appears to prevent formal firms fromoperating on a level playing field. Thepersistence of these constraints over severalICA surveys indicates that they are deeplyembedded in the local business culture and aretherefore challenging for policymakers toaddress and alleviate. Rather than attempting torepress informality, the RGC may wish toconsider fostering firms in the informal sectorto grow by adopting enabling policies such asincentives to become formal which may includefast-track registration, licensing, and approvalprocesses, thereby contributing to fiscalrevenues, higher wages for workers and betterknowledge transfers.
4. In addition to presenting the keyconstraints, the ICA includes two key findings. The first is that Special Economic Zones (SEZs) are not delivering the benefits
7 The identification of macroeconomic uncertainty as a key bottleneck is surprising; it may be capturing the uncertain external macroeconomic environment post 2008/9 global financial crisis.
expected by foreign investors. While the zones offer several benefits in terms of One-Stop-Shops and enhanced border clearance procedures, investors continue to express disappointment that their expectations for a benign investment environment inside the zones are not being fulfilled.
5. The second key finding is that there isa “missing middle” in the composition of Cambodian companies involved in exports. Compared with countries at the same level of Gross Domestic Product (GDP), very few medium-size firms actively export from Cambodia. The existence of a missing middle is likely to be associated with a costly business environment that favors large businesses and encourages small firms to remain small and informal in order to remain hidden from the regulatory environment.
6. The current period of robust growthrepresents an opportunity to make improvements to the business environment that will attract long-term investors. Many investors are attracted by the “Everything But Arms” initiative (EBA) that allows duty-free access to the European Union market and to tax holidays, but these preferential treatments will not last forever. Improvements to the investment climate now will pay off in anchor investment that is more likely to remain in Cambodia when the preferential treatments are eventually withdrawn.
3. Proposed next steps inreforming the businessenvironment
a) Address the high cost of electricity with acomprehensive national plan comprising thereview of energy sources (including renewable)and identify specific practices (e.g. non-transparent solicitation of power purchaseagreements) that may be contributing to thehigh cost of energy. Improving existingagreements with neighboring countries wouldensure the steady and reliable provision ofelectricity to the SEZs located nearCambodia’s borders. A regional approachtowards addressing constraints currently faced
by the power sector may be more appropriate, as an isolated power sector expansion will likely require difficult trade-offs between economic growth and environmental challenges.
b) Automate government processes. Corruptand informal practices proliferate in opaqueenvironments that often require face-to-facecontact between investors and governmentofficials. Automation of key governmentprocesses could help to eliminate thesepractices by reducing personal contactbetween parties and by creating a transparentonline portal for information about rules andprocesses required by firms. Automation hasthe added advantage of creating a traceablerecord of transactions between theGovernment and the private sector. To thisend, the swift passing of the e-Commerce Lawby the National Assembly as soon as possiblewould enable firms to perform e-payments forgovernment services. Both the Ministry ofEconomy and Finance (MEF) and Ministry ofCommerce (MOC) are implementingautomation in the areas of customs and borderreform, new company registration andCertificate of Origin (CO) that can serve asmodels for other ministries.
c) Encourage new investment, particularly inthe SEZs. It is important that the revision ofthe current Investment Law is completed assoon as possible to modernize the existingregime. A system of smart incentives andmore effective investment protection can pavethe way for foreign investors deciding to moveinto Cambodia, taking advantage of itscompetitive labor cost and its favorablegeographical location at the center of theASEAN Economic Community (AEC). TheRGC could also consider designing andimplementing a Zero-Corruption Strategy tocurb corruptive practices within the SEZs.Policing this strategy would be feasible in thecontrolled environment of the SEZs, and havea strong resonance in terms of building apositive image for Cambodia as an FDIdestination.
d) Continued improvements to tradefacilitation. The important improvements
made by Customs leave no room for complacency as there are still cumbersome and time-consuming procedures to be completed manually through several agencies before import-export permits and licenses can be obtained. By streamlining and automating these procedures, in the framework of the National Single Window (NSW), Cambodia could improve its trade performance dramatically by contributing to decreased trade costs and improved firm competitiveness.
e) Completing the draft Competition Law andsetting up an independent CompetitionAgency would go a long way in ensuring alevel playing field across all firms.
f) Design and implement a system ofincentives for business registrationencouraging companies to become formal,with a strong impact on fiscal revenues andenterprise productivity that would have animpact on firms’ capacity to grow and toaccess foreign markets. Experience in othercountries indicates that lowering the cost andcomplexity of registration is a necessary, butoften not sufficient step, and that improvedenforcement is also needed to encouragecompanies to be formal.8
g) Focus on implementation and enforcement. Cambodia’s regulatory environment often follows international bestpractice and appears to comply with theRGC’s international commitments andobligations. However, informal practices arestill prevalent with poor implementation oftenhindering the stated objectives of theregulations.
8 Bruhn and McKenzie (2013) “Entry regulation and formalization of microenterprises in developing countries”, p.17.

29
by the power sector may be more appropriate, as an isolated power sector expansion will likely require difficult trade-offs between economic growth and environmental challenges.
b) Automate government processes. Corruptand informal practices proliferate in opaqueenvironments that often require face-to-facecontact between investors and governmentofficials. Automation of key governmentprocesses could help to eliminate thesepractices by reducing personal contactbetween parties and by creating a transparentonline portal for information about rules andprocesses required by firms. Automation hasthe added advantage of creating a traceablerecord of transactions between theGovernment and the private sector. To thisend, the swift passing of the e-Commerce Lawby the National Assembly as soon as possiblewould enable firms to perform e-payments forgovernment services. Both the Ministry ofEconomy and Finance (MEF) and Ministry ofCommerce (MOC) are implementingautomation in the areas of customs and borderreform, new company registration andCertificate of Origin (CO) that can serve asmodels for other ministries.
c) Encourage new investment, particularly inthe SEZs. It is important that the revision ofthe current Investment Law is completed assoon as possible to modernize the existingregime. A system of smart incentives andmore effective investment protection can pavethe way for foreign investors deciding to moveinto Cambodia, taking advantage of itscompetitive labor cost and its favorablegeographical location at the center of theASEAN Economic Community (AEC). TheRGC could also consider designing andimplementing a Zero-Corruption Strategy tocurb corruptive practices within the SEZs.Policing this strategy would be feasible in thecontrolled environment of the SEZs, and havea strong resonance in terms of building apositive image for Cambodia as an FDIdestination.
d) Continued improvements to tradefacilitation. The important improvements
made by Customs leave no room for complacency as there are still cumbersome and time-consuming procedures to be completed manually through several agencies before import-export permits and licenses can be obtained. By streamlining and automating these procedures, in the framework of the National Single Window (NSW), Cambodia could improve its trade performance dramatically by contributing to decreased trade costs and improved firm competitiveness.
e) Completing the draft Competition Law andsetting up an independent CompetitionAgency would go a long way in ensuring alevel playing field across all firms.
f) Design and implement a system ofincentives for business registrationencouraging companies to become formal,with a strong impact on fiscal revenues andenterprise productivity that would have animpact on firms’ capacity to grow and toaccess foreign markets. Experience in othercountries indicates that lowering the cost andcomplexity of registration is a necessary, butoften not sufficient step, and that improvedenforcement is also needed to encouragecompanies to be formal.8
g) Focus on implementation and enforcement. Cambodia’s regulatory environment often follows international bestpractice and appears to comply with theRGC’s international commitments andobligations. However, informal practices arestill prevalent with poor implementation oftenhindering the stated objectives of theregulations.
8 Bruhn and McKenzie (2013) “Entry regulation and formalization of microenterprises in developing countries”, p.17.
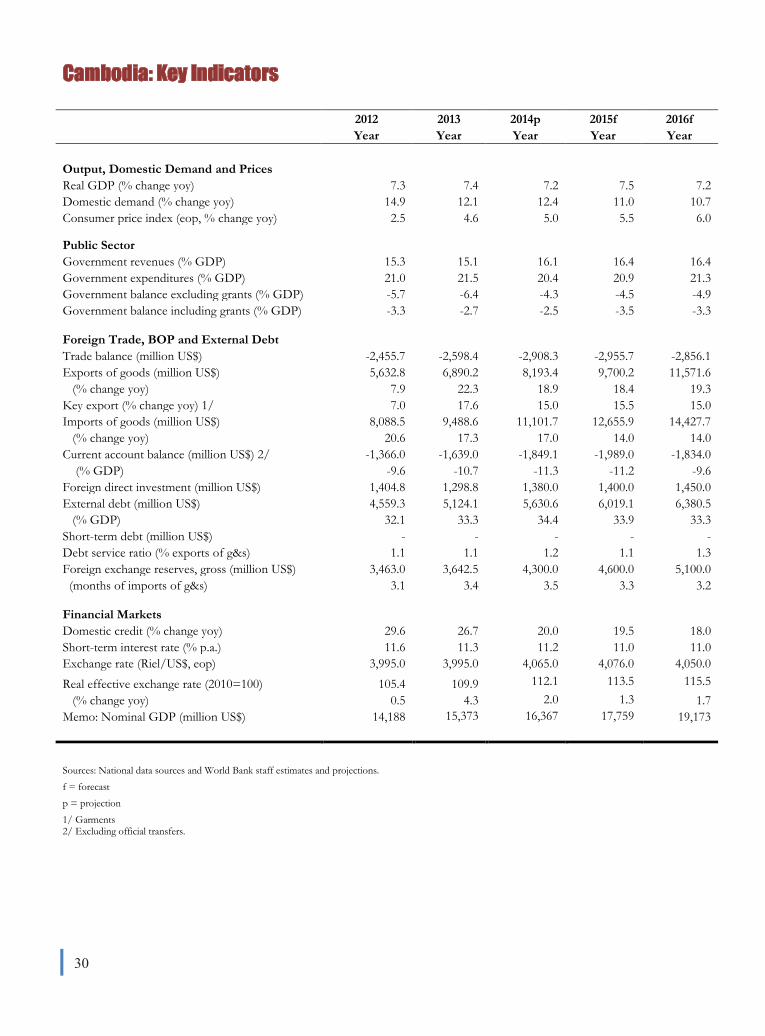
30
Cambodia: Key Indicators
2012 2013 2014p 2015f 2016f Year Year Year Year Year
Output, Domestic Demand and Prices Real GDP (% change yoy) 7.3 7.4 7.2 7.5 7.2 Domestic demand (% change yoy) 14.9 12.1 12.4 11.0 10.7 Consumer price index (eop, % change yoy) 2.5 4.6 5.0 5.5 6.0
Public Sector Government revenues (% GDP) 15.3 15.1 16.1 16.4 16.4 Government expenditures (% GDP) 21.0 21.5 20.4 20.9 21.3 Government balance excluding grants (% GDP) -5.7 -6.4 -4.3 -4.5 -4.9 Government balance including grants (% GDP) -3.3 -2.7 -2.5 -3.5 -3.3
Foreign Trade, BOP and External Debt Trade balance (million US$) -2,455.7 -2,598.4 -2,908.3 -2,955.7 -2,856.1 Exports of goods (million US$) 5,632.8 6,890.2 8,193.4 9,700.2 11,571.6 (% change yoy) 7.9 22.3 18.9 18.4 19.3 Key export (% change yoy) 1/ 7.0 17.6 15.0 15.5 15.0 Imports of goods (million US$) 8,088.5 9,488.6 11,101.7 12,655.9 14,427.7 (% change yoy) 20.6 17.3 17.0 14.0 14.0 Current account balance (million US$) 2/ -1,366.0 -1,639.0 -1,849.1 -1,989.0 -1,834.0 (% GDP) -9.6 -10.7 -11.3 -11.2 -9.6 Foreign direct investment (million US$) 1,404.8 1,298.8 1,380.0 1,400.0 1,450.0 External debt (million US$) 4,559.3 5,124.1 5,630.6 6,019.1 6,380.5 (% GDP) 32.1 33.3 34.4 33.9 33.3 Short-term debt (million US$) - - - - - Debt service ratio (% exports of g&s) 1.1 1.1 1.2 1.1 1.3 Foreign exchange reserves, gross (million US$) 3,463.0 3,642.5 4,300.0 4,600.0 5,100.0 (months of imports of g&s) 3.1 3.4 3.5 3.3 3.2
Financial Markets Domestic credit (% change yoy) 29.6 26.7 20.0 19.5 18.0 Short-term interest rate (% p.a.) 11.6 11.3 11.2 11.0 11.0 Exchange rate (Riel/US$, eop) 3,995.0 3,995.0 4,065.0 4,076.0 4,050.0 Real effective exchange rate (2010=100) 105.4 109.9 112.1 113.5 115.5 (% change yoy) 0.5 4.3 2.0 1.3 1.7 Memo: Nominal GDP (million US$) 14,188 15,373 16,367 17,759 19,173
Sources: National data sources and World Bank staff estimates and projections. f = forecast p = projection 1/ Garments 2/ Excluding official transfers.