Estuary Productivity & Complexity Evaluating Human Impacts.
24
Estuary Productivity & Estuary Productivity & Complexity Complexity Evaluating Human Impacts Evaluating Human Impacts
-
Upload
ralf-sanders -
Category
Documents
-
view
227 -
download
1
Transcript of Estuary Productivity & Complexity Evaluating Human Impacts.

Estuary Productivity & Estuary Productivity & ComplexityComplexity
Evaluating Human ImpactsEvaluating Human Impacts
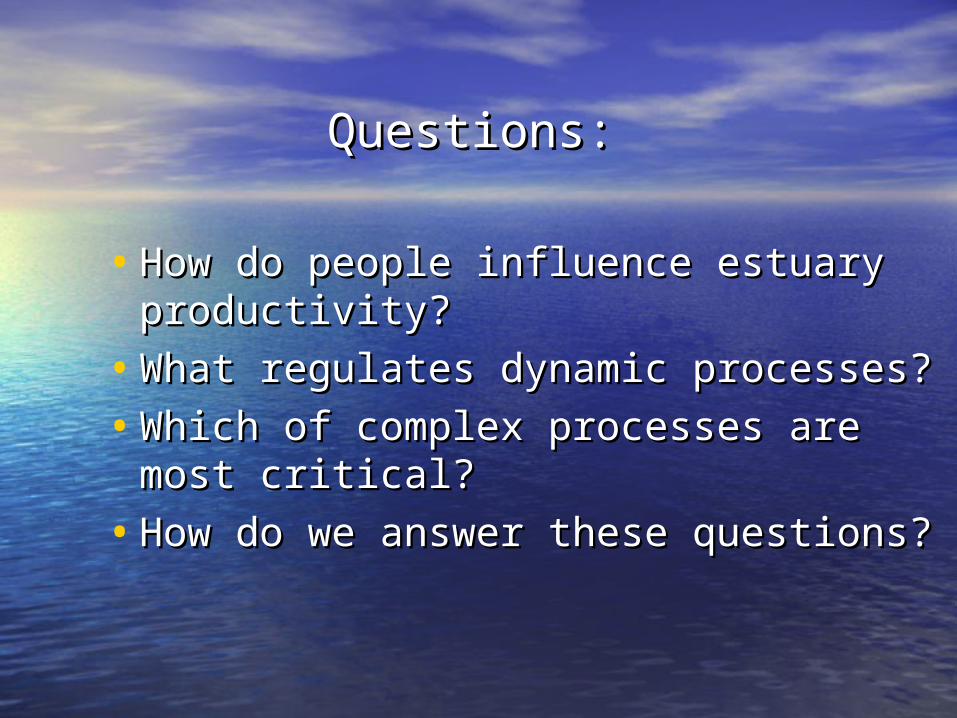
Questions:Questions:
• How do people influence estuary How do people influence estuary productivity?productivity?
• What regulates dynamic processes?What regulates dynamic processes?
• Which of complex processes are Which of complex processes are most critical?most critical?
• How do we answer these questions?How do we answer these questions?
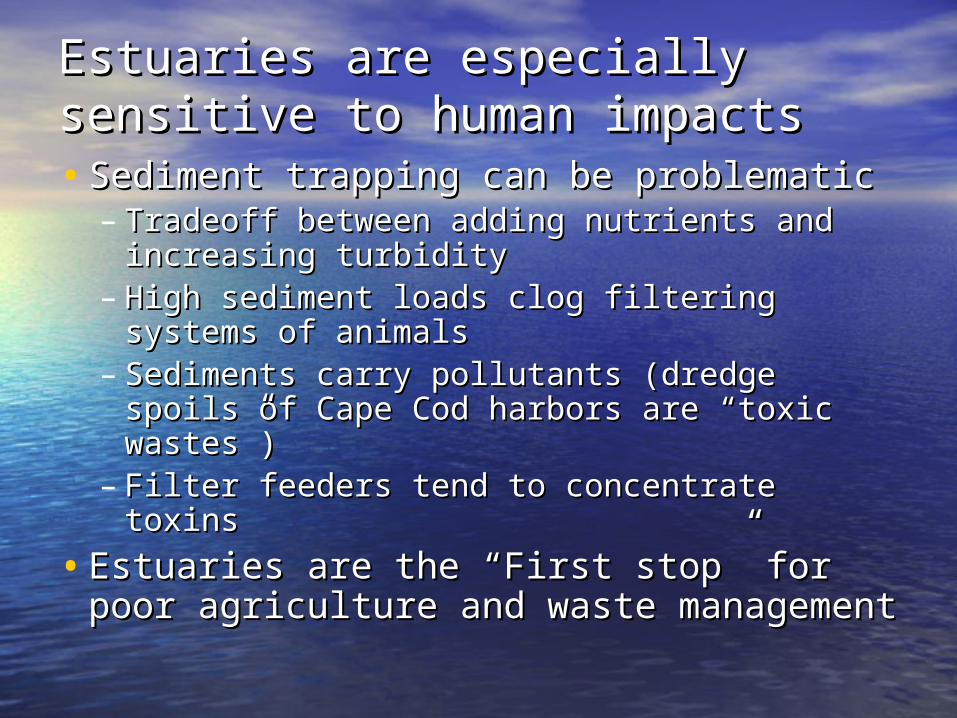
Estuaries are especially sensitive Estuaries are especially sensitive to human impactsto human impacts• Sediment trapping can be problematicSediment trapping can be problematic
– Tradeoff between adding nutrients and Tradeoff between adding nutrients and increasing turbidityincreasing turbidity
– High sediment loads clog filtering systems High sediment loads clog filtering systems of animalsof animals
– Sediments carry pollutants (dredge spoils Sediments carry pollutants (dredge spoils of Cape Cod harbors are “toxic wastes”)of Cape Cod harbors are “toxic wastes”)
– Filter feeders tend to concentrate toxinsFilter feeders tend to concentrate toxins
• Estuaries are the “First stop” for poor Estuaries are the “First stop” for poor agriculture and waste managementagriculture and waste management

Other reasons for estuarine Other reasons for estuarine sensitivitysensitivity
• Vulnerability of estuarine organismsVulnerability of estuarine organisms– Many already at the limit of Many already at the limit of
physiological tolerancesphysiological tolerances– Added stress of chemicals, hypoxia may Added stress of chemicals, hypoxia may
reduce reproduction below critical limitsreduce reproduction below critical limits
• Food web structure is based on few Food web structure is based on few speciesspecies– Low diversity is high riskLow diversity is high risk

SedimentSedimentSources to Sources to the Bay and the Bay and TribsTribs
• Watershed Inputs Watershed Inputs (1,2 and 3)(1,2 and 3)
• Shoreline erosion (4)Shoreline erosion (4)
• Ocean (5)Ocean (5)
• Biogenic productionBiogenic production
• Relative contribution Relative contribution varies in proportionvaries in proportion different areas of different areas of the Bay and tribsthe Bay and tribs

Sediment Sediment transport in transport in Cheasapeake BayCheasapeake Bay

Sediment Budget – Choptank Estuary 1979-80 (Yarbro et. al, 1983)
12 %
Upland
80 %
Shoreline
8 %
From estuary
81 %
Deposited
19 %
Transfer down estuary
Total Sediment input 0.43 x 10⁶ metric tonnes
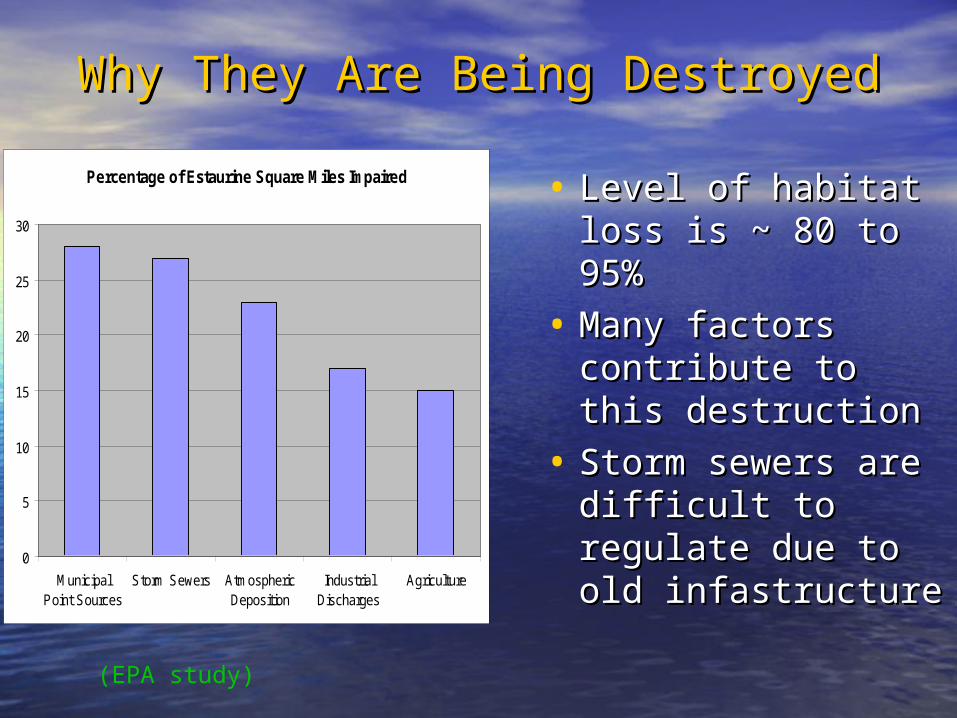
Why They Are Being DestroyedWhy They Are Being Destroyed
• Level of habitat Level of habitat loss is ~ 80 to 95%loss is ~ 80 to 95%
• Many factors Many factors contribute to this contribute to this destructiondestruction
• Storm sewers are Storm sewers are difficult to regulate difficult to regulate due to old due to old infastructureinfastructure
Percentage of Estaurine Square Miles Impaired
0
5
10
15
20
25
30
MunicipalPoint Sources
Storm Sewers AtmosphericDeposition
IndustrialDischarges
Agriculture
(EPA study)
Information about StormwaterInformation about Stormwater
• More oil than was released in the More oil than was released in the Exxon Valdez spill flows into Galveston Exxon Valdez spill flows into Galveston Bay per yrBay per yr
• One quart of spilled motor oil covers One quart of spilled motor oil covers three football fieldsthree football fields
• Takes 20 years for an aquatic system Takes 20 years for an aquatic system to recover from oil contaminationto recover from oil contamination
• In the Chesapeake Bay, 15% P, 14% N, In the Chesapeake Bay, 15% P, 14% N, and 9% of sediment loads come from and 9% of sediment loads come from storm waterstorm water
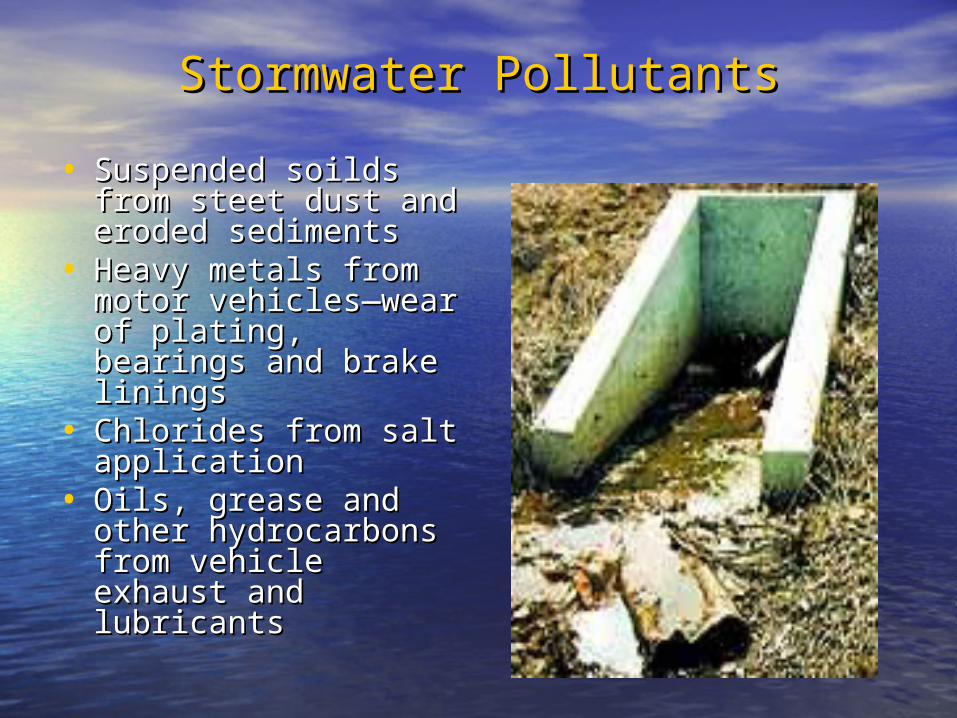
Stormwater PollutantsStormwater Pollutants
• Suspended soilds from Suspended soilds from steet dust and eroded steet dust and eroded sedimentssediments
• Heavy metals from Heavy metals from motor vehicles—wear motor vehicles—wear of plating, bearings of plating, bearings and brake liningsand brake linings
• Chlorides from salt Chlorides from salt applicationapplication
• Oils, grease and other Oils, grease and other hydrocarbons from hydrocarbons from vehicle exhaust and vehicle exhaust and lubricantslubricants

Potential PoliciesPotential PoliciesVegetated Shoreline Buffer ZonesVegetated Shoreline Buffer Zones
• Improve water Improve water quality, create new quality, create new habitathabitat
• Difficulties: Difficulties: waterfront land waterfront land values are values are expensive, need to expensive, need to remove existing remove existing buildings, political buildings, political opposition, opposition, reluctant reluctant governmentsgovernments
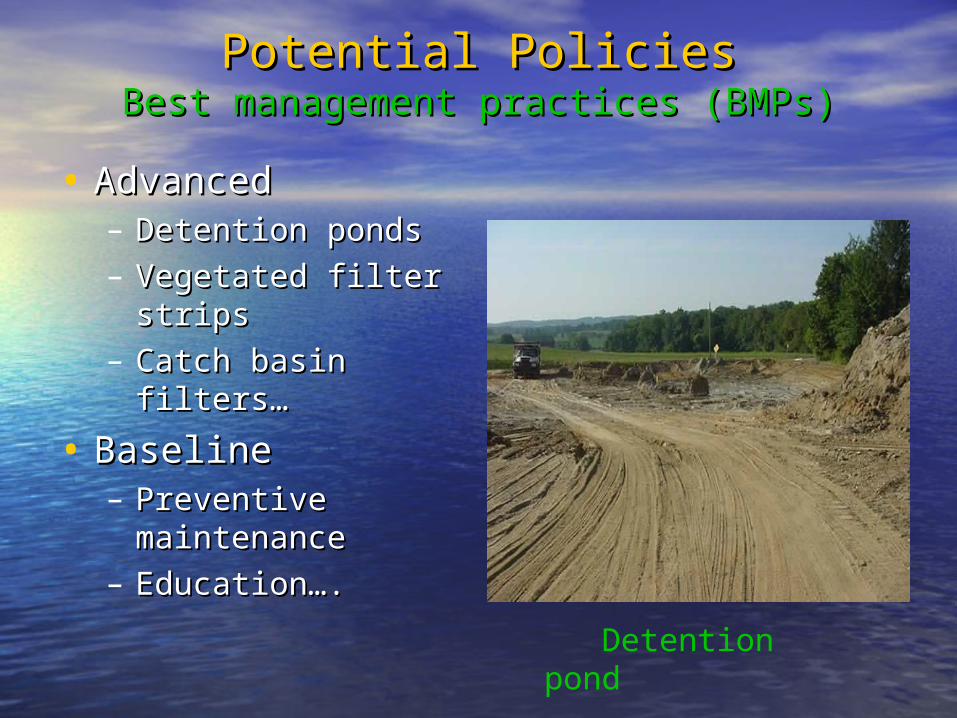
Potential PoliciesPotential PoliciesBest management practices (BMPs)Best management practices (BMPs)
• AdvancedAdvanced– Detention pondsDetention ponds– Vegetated filter Vegetated filter
stripsstrips– Catch basin filters…Catch basin filters…
• BaselineBaseline– Preventive Preventive
maintenancemaintenance– Education….Education….
Detention pond
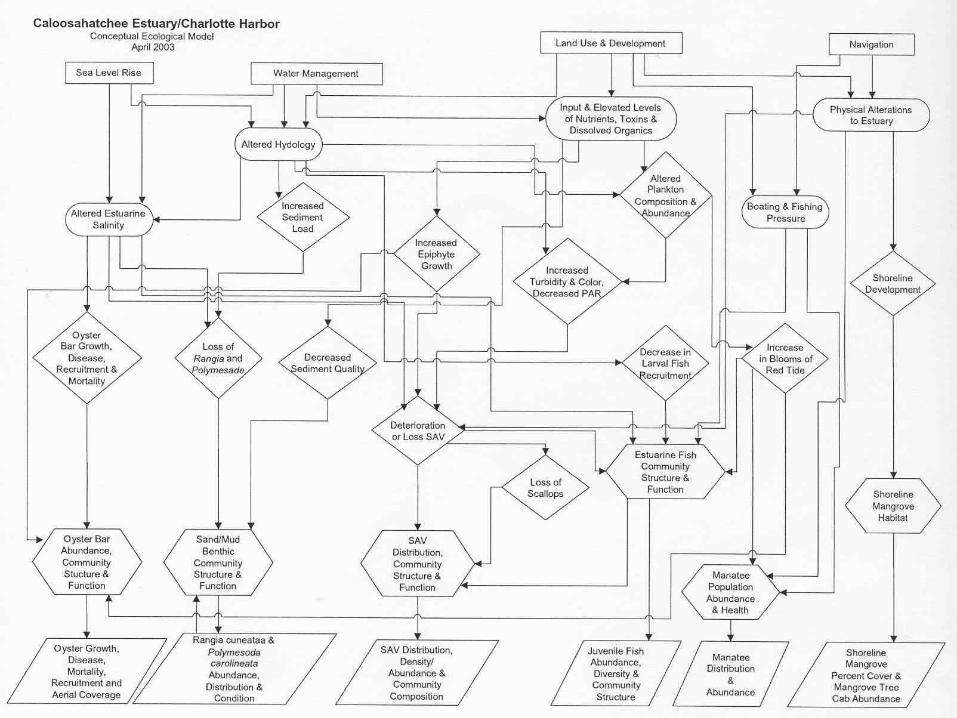
Systems model approachSystems model approach
• Start with general, conceptual modelStart with general, conceptual model
• Add specificity and ability to measureAdd specificity and ability to measure
• Evaluate quality and degrees of Evaluate quality and degrees of influenceinfluence
• Aggregate groups that are very Aggregate groups that are very similar; add more specificity where similar; add more specificity where necessarynecessary

Most general level of “model”Most general level of “model”

22ndnd level of abstraction: level of abstraction: componentscomponents
• Materials to be measuredMaterials to be measured
• Processes that define the systemProcesses that define the system
• Influences on those processesInfluences on those processes
• Simplify by aggregating Simplify by aggregating functional functional groupsgroups

HierarchyHierarchy, , state variablesstate variables and and forcesforces

Vocabulary of systems symbologyVocabulary of systems symbology
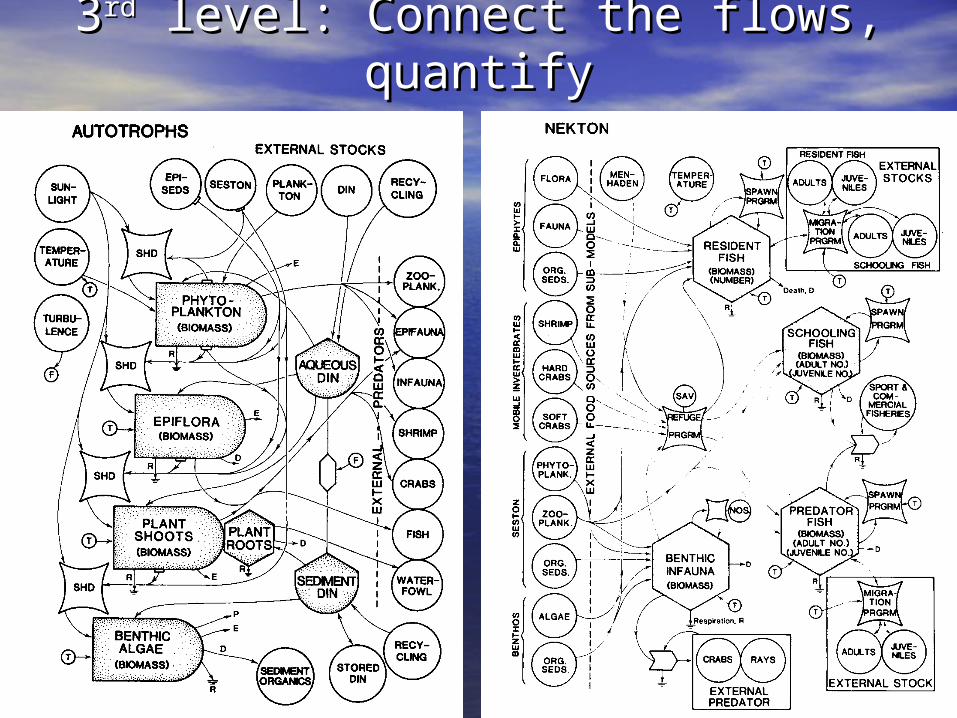
33rdrd level: Connect the flows, level: Connect the flows, quantifyquantify

44thth level: run and evaluate the level: run and evaluate the modelmodel

55thth level: refine the model level: refine the model

66thth level: make predictions level: make predictions
• ““What if” . . .What if” . . .
• Sensitivity Sensitivity analysisanalysis

Recent applicationsRecent applications

Symbols in modelSymbols in model
• Stressors: sea level rise, societal-Stressors: sea level rise, societal-drivendriven
• Responses: SAV, Oysters, Benthic Responses: SAV, Oysters, Benthic Diversity, Fish, Manatees, MangrovesDiversity, Fish, Manatees, Mangroves
• Concerns: population declines, loss of Concerns: population declines, loss of habitat, altered hydrologyhabitat, altered hydrology