ESTUARY GENERAL EIA REPORT - Department of …€¦ · ESTUARY GENERAL EIA REPORT Prepared for: NSW...
233
ESTUARY GENERAL EIA REPORT Prepared for: NSW Fisheries September 2001 Prepared by: SMEC Australia Pty Ltd ACN 065 475 149 Project Number: 31229.001
Transcript of ESTUARY GENERAL EIA REPORT - Department of …€¦ · ESTUARY GENERAL EIA REPORT Prepared for: NSW...

ESTUARY GENERALEIA REPORT
Prepared for:NSW Fisheries
September 2001
Prepared by:
SMEC Australia Pty LtdACN 065 475 149
Project Number: 31229.001

PREPARATION, REVIEW AND AUTHORISATION
Project Name: Estuary General EIA Report Project No.: 31229.001
Prepared by: Ros Taplin Signature:
Position: Senior Consultant Date: 13th September 2001
Reviewed by: Jan Parsons Signature:
Position E n v i r o n m e n t M a n a g e r(Australia)
Date: 13th September 2001
This report was prepared in accordance with the scope of services set out in the contract betweenSMEC Australia Pty Ltd (SMEC) and the Client. To the best of SMEC’s knowledge the proposalpresented herein reflects the Client’s intentions when the report was printed. In preparing this report,SMEC relied upon data, surveys, analyses, designs, plans and other information provided by theClient and other individuals and organisations referenced herein. Except as otherwise stated in thisreport, SMEC has not undertaken further verification regarding the accuracy or completeness ofthese information sources.

TABLE OF CONTENTS
1 INTRODUCTION ....................................................................... 1-1
1.1 BACKGROUND ............................................................................... 1-11.2 METHODOLOGY............................................................................. 1-11.3 CONSULTATION............................................................................. 1-2
2 ESTUARY AND FISHERY DESCRIPTION............................... 2-1
2.1 ESTUARIES .................................................................................... 2-12.1.1 Description ........................................................................... 2-12.1.2 Land Uses Surrounding Estuaries......................................... 2-1
2.2 FISHERY DESCRIPTION ................................................................ 2-2
3 IMPACT ASSESSMENT ........................................................... 3-1
3.1 NOISE ............................................................................................ 3-13.1.1 Impact Assessment .............................................................. 3-13.1.2 Mitigation Measures ............................................................. 3-3
3.2 LIGHT ............................................................................................ 3-63.2.1 Impact Identification.............................................................. 3-63.2.2 Mitigation Measures ............................................................. 3-6
3.3 AIR QUALITY .................................................................................. 3-6
4 ENERGY AND GREENHOUSE ISSUES .................................. 4-1
4.1 DESCRIPTION OF FISHING FLEET................................................ 4-14.2 ENERGY AND GREENHOUSE ASSESSMENT............................... 4-2
5 REFERENCES .......................................................................... 5-1
APPENDICES
A Questionnaire to Councils

31229.001 September 2001Estuary General EIA Report
1-1
1 INTRODUCTION
1.1 BACKGROUND
NSW Fisheries is currently preparing fishery management strategies for the State’s commercialmarine fisheries. Concurrently, environmental assessments are being prepared under Division 5,Part 5 of the Environmental Planning and Assessment Act 1979. The assessments will estimatethe level of pressure on the environment from the fishing activities and predict the likely impactsof implementing the draft fishery management strategies. The guidelines for the preparation ofthe environmental assessments issued by the Department of Urban Affairs and Planning (DUAP)requires that among other issues NSW Fisheries must address noise, light, air quality, and energyand greenhouse issues.
SMEC Environment was commissioned by NSW Fisheries to prepare assessments addressingnoise, light, air quality, and energy and greenhouse issues for three commercial fisheries, EstuaryGeneral, Ocean Haul and Estuary Prawn Trawl. This report presents the assessment for theEstuary General Fishery.
1.2 METHODOLOGY
Estuary General Fishing:
• involves over 20 different fishing methods;• is undertaken by about 940 fishing businesses;• occurs in approximately 80 estuaries; and• involves over 100 species.
This complexity has made it impossible to assess each activity and estuary separately. Themethodology adopted involved:
• consultation with NSW Fisheries, members of the fishing industry and local councils;• broadly describing each method of fishing and identifying the activities that may generate
noise, light or air emissions;• identifying the types of land use that occurs within the estuaries;• combining the above two factors to identify whether there was any potential for significant
adverse effects; and• identifying mitigation measures to minimise or reduce identified areas of impact.
Greenhouse and energy issues were considered by examination of the fishing fleet and methods offishing.
To present the findings of the investigations this report contains four sections:
1. this brief introduction;2. a description of the fishing activity and estuarine environment;3. an impact assessment for noise, light and air quality issues; and4. a consideration of greenhouse and energy issues.

31229.001 September 2001Estuary General EIA Report
1-2
1.3 CONSULTATION
To facilitate an understanding of the Estuary General Fishery and relevant environmental issuesconsultation was undertaken with members of the Estuary General Management AdvisoryCommittee (EGMAC), Local Councils and the staff of NSW Fisheries.
i Consultation With EGMAC Members
Three members of EGMAC, Mr. Karl Tesar, Mr. Graeme Byrnes and Mr. Brian Clifford, werecontacted regarding issues in the Estuary General Fishery. These members of EGMAC serve asindustry representatives for commercial fishing operators in the Estuary General fishery, and havefirst-hand experience of the fisheries’ issues.
Responses from the three members indicate that commercial fishermen are generally engaged in abroad range of activities within the Estuary General Fishery, and utilise a wide variety of differentequipment to conduct their activities. The peak fishing season extends throughout spring, summerand autumn, with winter being the least active period. On a daily basis, there was a generalbalance between daytime and nocturnal fishing activities, with neither period dominating.
The Estuary General Fishery is subject to a large number of restrictions, the majority of which areimposed by NSW Fisheries. The National Parks and Wildlife Service (NPWS) also imposes somerestrictions in estuaries that are bounded by National Parks. Local Councils play a limited role incontrolling commercial fishing activities, with their input generally limited to location and accesscontrols.
In relation to noise, light, air quality/energy and greenhouse issues, there was an appreciation thatcommercial fishing activities do have some impact on these areas as follows.
• Noise Issues
Estuary General Fishing activities can have associated noise problems. Fishermen generallytake precautions to avoid excessive noise, and attempt to avoid any audible noise in thevicinity of residential dwellings.
• Light Issues
The use of equipment, in particular spotlights, can result in issues concerning light. There areattempts to minimise the impacts of such equipment, and use of this equipment is avoidedwhere possible, particularly during night operations.
• Air Quality/Energy and Greenhouse Issues
There is an appreciation that the use of boats do have associated air quality and energy andgreenhouse issues. While it would be possible to make improvements in these areas, likeswitching from 2-stroke engines to 4-stroke engines, there is an associated economic cost.
It was felt that the impact of commercial fishing on these issues was less than the cumulativeimpact of recreational fishing. The rationale behind this was that the total number of recreationalfishermen is much greater than the number of commercial fishing operators, and recreationalfishermen are generally less concerned about taking necessary precautions to minimise theimpacts they have. Commercial operators have a greater awareness of the implications of theiractivities and the need to minimise their impact.

31229.001 September 2001Estuary General EIA Report
1-3
ii Consultation With Local Councils
Questionnaires were sent to seven local councils, Eurobodalla Shire Council, Maclean ShireCouncil, Great Lakes Council, Lake Macquarie City Council , Port Stephens Council, GreaterTaree City Council and Richmond Valley Council. A copy of the questionnaire is included asAppendix A. These Councils were selected because they contain some of the major commercialfishing estuaries within New South Wales, and because they offer a diversity of estuary typeswithin their local government area.
Three responses were received, from Eurobodalla Shire Council, Greater Taree City Council andPort Stephens Council. The responses were, on the whole, very similar, with all indicating thatthese Councils had very little to do with commercial fishing management, largely because theCouncils do not have the staff expertise available to deal effectively with fishery issues.
No public complaints had been received at the three Councils about noise, light, air quality orenergy issues in relation to commercial fishing activities.
iii Consultation With Regional Offices of NSW Fisheries
Regional offices of NSW Fisheries were contacted to determine the numbers and types ofcomplaints received concerning commercial fishing activities.
Very few complaints are received concerning commercial fishing operations and for the most part,the complaints that are received related to noise issues. In particular, the complaints haveidentified issues such as the banging the sides of boats with oars or other objects to scare fish intomeshing nets, the use of outboard motors in residential areas at night, noise from winches, andfrom prawn cookers (gas blowers) used on estuary banks in residential areas.

31229.001 September 2001Estuary General EIA Report
2-1
2 ESTUARY AND FISHERY DESCRIPTION
2.1 ESTUARIES
2.1.1 Description
Estuaries are partially enclosed bodies of waters that are connected to the ocean. The FisheriesManagement Act 1994 defines estuarine waters as “waters other than ocean waters that areordinarily subject to tidal influence”. Estuaries are found along the entire NSW coastline, with atotal of 690 water bodies being identified, many of which are small and unnamed. Of these waterbodies, 135 are considered to be major estuaries (NSW Fisheries, 2001). Major estuaries includerivers, such as the Clarence, Richmond and Manning Rivers, bays, such as Jervis Bay and BotanyBay, large coastal lagoons or lakes, such as Myall Lakes, Lake Macquarie and Lake Illawarra, andsmaller lakes, such as Smiths Lake and Coila Lake.
Approximately 80 estuaries in NSW are used for commercial fishing. Twenty four of theseestuaries produce almost 95% of the total catch in the Estuary General Fishery (NSW Fisheries2001). A majority of the catch comes from large coastal lagoons in the central region of the NSWcoast, with the exception to this being the Clarence River on the north coast, which is the highestproducing estuary in NSW.
Estuaries are characterised by brackish water caused by the mixing of ocean and fresh waters.They generally comprise complex ecosystems and sustain high levels of biodiversity, supporting awide variety of fish and invertebrates and providing a diverse range of habitats, includingmangroves, seagrasses, mud flats and sheltered rocky reef. Estuaries and their associated habitatsalso provide a significant contribution to terrestrial biodiversity, supporting insects, reptiles,mammals and, especially, birds.
2.1.2 Land Uses Surrounding Estuaries
Many of the estuaries throughout NSW have become a focus for anthropogenic activities and landuse. In particular, urban development has become more concentrated around estuaries due to theattractive environment they offer. This has placed increasing pressures on estuaries and theirsurrounding environment.
To illustrate the type of land use adjoining estuaries, four commercial fishing estuaries wereselected. These were the Clarence and Richmond Rivers (examples of larger river estuaries),Myall Lakes (example of smaller coastal lakes) and Lake Macquarie (a larger coastal lakesurrounding by urban and industrial development). Brief descriptions of these estuaries follow.
• Clarence River
There are a diverse range of land uses close to the Clarence River. Significant areas of StateForest (Fortis Creek State Forest) exist in the region, while there are also areas used foragriculture particularly sugar cane growing and cattle grazing. Large urban areas, mostnotably Grafton, are found on the shores of the river, while a number of smaller urbanvillages, such as Copmanhurst, Moleville and Eatonsville can also be found along the river.
• Richmond River

31229.001 September 2001Estuary General EIA Report
2-2
The land uses surrounding the Richmond River are similar to those found on the ClarenceRiver. Nature Reserves, including mangroves, dominate the area; although while there areareas used for agricultural purposes. A major urban centre, Ballina, is located on the river,and has some associated river developments including marinas. Small urban villages, such asTimbali, can be found along the river.
• Myall Lakes
The land surrounding Myall Lakes is dominated by National Parks, specifically, the MyallLakes National Park. There are a number of small urban villages, such as Bungwahl, thatfringe the lake. Scattered dwellings are found at various locations, such as at Mayers Pointand Nerani.
• Lake Macquarie
Many small urban areas, including Swansea, Blacksmiths, Belmont, Warners Bay andBoolaroo dominate the shores of Lake Macquarie. Linked to these urban uses are tourismfacilities such as caravan parks and camping areas. Small parks and reserves are alsoabundant around the lake. A number of major industrial uses are also located close to the lake,including the Eraring Power Station, an aluminium smelter and several coal mines.
2.2 FISHERY DESCRIPTION
Over 15 different types of fishing gear are used in the Estuary General Fishery ranging from handcollecting to motorised hauling nets. Most gear catches a wide number of species but some, suchas eel traps, target specific species. Table 2.1 describes the main fishing methods and identifieswhere the activity may interact with the noise, light and air environments. Energy and greenhouseissues are also identified in the table. Fishing methods described are:
• traps;• hoop or lift nets;• mesh nets; and• hauling nets. The table describes general purpose hauling nets. There are specific methods
and types of hauling used for some species and these are not separately described. Thespecies these methods target include pilchards anchovies and bait trumpeter, whiting andgarfish.
This assessment is limited to the effects of fishing on activities associated with the management ofthe fishery. It does not extend to shore-based activities such as processing plants, cooperativesand boat ramps.

Dominion Consulting Pty. Ltd. A.C.N. 079 198 780.
Consulting in fisheries management, economics and training.
An Assessment of Economic and Social
Issues in the NSW Estuary General
Fisheries Management Strategy
A report to NSW Fisheries
by Dominion Consulting Pty Ltd
September, 2001
______________________________________________________________________________________

Economic Issues: Estuary General FMS Dominion Consulting Pty Ltd
1
Disclaimer
This report has been compiled on the basis of existing literature, information, and targeted surveys some ofwhich was supplied by the client, New South Wales (Fisheries) and compiled under limited time and financialresources. Neither Dominion Consulting Pty. Ltd, its employees or sub-contracting parties undertakeresponsibility arising in any way to any persons in respect of the data, errors, or omissions arising, through mis-interpretation of information, negligence or otherwise, however caused. This report should not be used as thebasis for commercial decisions; those so doing, do so at their own risk.
Dominion Consulting Pty Ltd is an independent consulting company undertaking projects in fisherieseconomics, management and training.
Contact for author
Dominion Consulting Pty Ltd,Suite 7/8, 822 Old Princes Highway,Sutherland,NSW 2232.
Tel. (02) 9545 4317 and Fax (02) 9545 4316E mail: [email protected]
Acknowledgments
We acknowledge the assistance of Mr Steve Dunn, Mr Paul O’Connor, Mr Max Withnell, Mr AndrewGoulstone, Mr Jim Couch and Ms Marnie Tanner, in accessing NSW Fisheries information and data. Thanks MrDon Moore of Newcastle Marine Brokers NMB for provision of licence value information.
Thanks to Dr Melanie Fisher and Mr Colin McGregor of Bureau of Rural Science, Social Science Unit forassistance with obtaining Australian Bureau of Statistics data and social indices. We acknowledge the commentsof Dr David Godden, University of Sydney, Dr Ron West, University of Wollongong and Dr Marc Fenton,James Cook University on a first draft of sections G and H. Thanks to Dr Roy Powell of Centre for RegionalEconomics (CARE Pty Ltd) for information of regional multipliers and Professor Harry Campbell, University ofQueensland for preliminary contributions.
The normal disclaimer applies.
Economic Issues: Estuary General FMS Dominion Consulting Pty Ltd
2
(G) ECONOMIC ISSUES
Introduction
The DUAP Directors Guidelines require that the impacts of a Fisheries Management Strategy
are assessed as part of an Environmental Impact Statement (EIS). Under the principles of
Ecologically Sustainable Development, the DUAP Director’s guidelines include assessment
of the economic and social impacts of any proposed fishery management strategies according
to sixteen economic and nineteen social considerations, respectively. This is to make the
economic and social aspects of sustainable resource use and management more transparent in
the decision-making process. It also enables potential policy impacts to be mitigated in the
policy development process, rather than after the event.
The economic and social assessment sections of the DUAP Directors Guidelines require a
review of existing fisheries information in section (1) and an evaluation of the likely
implications of the plan (fishery management strategies) in section (2). Section 3 requires
information shortfalls to be identified. The DUAP Directors guidelines for commercial
fisheries are new and it is envisaged that they may be further developed after their application
to a fisheries management strategy.
The management of fisheries in NSW has not previously integrated economic and social
information into the planning process in a formal manner. The current initiative to incorporate
available economic and social information is an important step towards more comprehensive
planning. In undertaking the assessment, there is a lack of information on basic economic
characteristics of fishing operations and the secondary seafood industries. There have been no
previous state-wide economic surveys or economic appraisals of the sustainability of fishing
operations. There has been some social information on fishers, but little on the social
composition of fishing communities in NSW. The lack of previous information, available
time and resources means the current study is a first attempt to gather and analyse economic
and social information in order to appraise the fisheries management plan of a specific
fishery. The study is potentially short of a state-wide all fisheries perspective of economic and
social information. The DUAP process enables such information needs to be identified.

Economic Issues: Estuary General FMS Dominion Consulting Pty Ltd
3
Much of the available economic and social information comes from regulatory sources, such
as NSW Fisheries licence records and fishers’ catch returns. Catch records can be combined
with price information available from the Sydney Fish Markets Pty Ltd to impute revenues to
fishers and fisheries to estimate a value at point of first sale. This may give a minimum
estimated value and probably underestimates the industry catch value.
Concurrent to the fisheries management strategy assessment process, is the recreational
fishing area (RFA) process which has involved debate on value of commercial and
recreational fishing sectors. The current study is not intended as a “valuation” of the fishing
industry and existing economic and social information is presented as a background to the
assessment of specific fishery management strategies envisaged in the future management of
the Estuary General fishery. The secondary information available on the seafood industry is
limited coming from licensing details of registered premises. There is no publicly available
descriptive information or an economic profile of the processing, wholesaling and retail side
of the NSW seafood industry. This leaves an information void in which secondary value
estimates of the seafood industry in NSW are not available.
To gain economic and social information for the assessment process, two surveys were
commissioned by NSW Fisheries in May 2001 to gain up to date economic and social
information across all fishery primary producers in NSW who directly interface with the fish
resource. There was insufficient time to survey the secondary level of the seafood industry
and this is recommended for future work. The economic and social surveys were to gain
information on the fishers and their fishing operations to enable the impacts of implementing
fishery management strategies to be appraised. Given this is the first fishery assessment
process, subsequent research and information gathering is recommended for future appraisals
as per section 3 of the guidelines.
The social assessment of the fisheries management strategies also uses existing administrative
information from licence records and has been augmented by a telephone survey of fishers in
NSW (RM, 2001b). This information was gathered to fill the most immediate information
shortfalls for assessment purposes and to give a social profile of the state’s fishers in relation
to the impending need created by the FMS. This approach will need to be augmented with
further fishing community surveys in the future. There is a lack of independent surveyed
community opinion on fishing issues.

Economic Issues: Estuary General FMS Dominion Consulting Pty Ltd
4
This economic and social fishery management strategy assessment is the first of a series in
NSW and has been compiled in a short time period in which source data has been collected
and analysed. It should be regarded as a first step towards more accountable and transparent
fisheries management strategy assessment in order to improve ecological sustainability.
Available information
Initial analysis of available data revealed a deficit of economic and social information, with
the available data coming from the licensing and catch record information held by NSW
Fisheries. Available data from the Australian Bureau of Statistics (ABS) was accessed via the
Bureau of Rural Science, Social Science unit for the social assessment. Aggregate ABS data
is of limited use to a specific EG fishery study being across fishery administrations, thus
including Commonwealth and interstate fishing activity. The NSW EIS process and ABS data
access is an area for future development. Separate social and economic surveys were
undertaken across all commercial fisheries in NSW in the May-June period of 2001 in order
that this and six subsequent environmental impacts assessments could benefit from improved
information.
Given the time available, the survey was able to address shortages in information on the
fishing industry at the primary level of fishing enterprises and fishers. Time precluded
surveying of the secondary level of the processing industry and the industrial activity
associated with the seafood industry. The limitations on data are discussed as part 3 of the
guidelines. As part of the assessment process, recommendations are made on how to improve
the data available for future assessments.
There are four main sources of information and data for the economic and social assessment:
a) existing NSW Fisheries records from licensing and catch records;
b) results of the Social survey ( Roy Morgan, 2001a);
c) results of the Economic survey (Roy Morgan, 2001b);
d) other publications with relevant material where available.
Other sources of information have been cited, including general literature and available
government and industry statistics. Some background on each of the data sources used in the
assessment is given below:

Economic Issues: Estuary General FMS Dominion Consulting Pty Ltd
5
a) Existing NSW Fisheries licensing records show endorsements holdings and fisher file and
business numbers. They also have some fisher details such as date of birth and home
postcode. Catch and effort information from the NSW Fisheries database can be added to
existing licensing information to determine catches in each administered fishery.
An imputed Sydney value at time of first sale can be obtained by combining fishers’ catch
return data and the Sydney Fish Market (SFM) monthly average species prices. The
“Sydney index” value infers that the price for all seafood landed in NSW is the monthly
average price at first sale in Sydney. This may under or over report the revenue associated
with individual fishers. The revenue estimate at point of first sale does not include market
deductions, and it does not account for export sales outside the Sydney Fish Market which
“exceeds Sydney prices” (pers. comm., EG MAC). Premium seafood is often sold by
fishers near point of landing to obtain higher prices, with minimal freight or marketing
costs. Data sourced from Department’s records will be referred to as “Source: NSWF” or
when combined with SFM data the “Sydney index”.
Comparisons of the Sydney Index revenue estimates and revenues, as stated by the
respondents to the economic survey, indicate that the Sydney index probably understates
fisher revenue at point of first sale by between 12% and 21%;
b) A specially devised social survey was executed by telephone by Roy Morgan Research in
May 2001 (Roy Morgan, 2001a). A total of 870 fisher responses were recorded from a
total of 1,751 fishers contacted state-wide. The survey results have been analysed for the
Estuary General fishery and will be referred to as “Source: RM-SS”;
c) An economic survey was designed and executed by mail in May/June 2001 by Roy
Morgan Research (Roy Morgan, 2001b). A total of 250 fisher responses were recorded
from a total of 1640 fishers and businesses contacted state-wide. The survey results have
been provisionally analysed in the current study for the fishing businesses in the Estuary
General and will be referred to “Source: RM-ES”;
Other information from existing literature will be referenced.

Economic Issues: Estuary General FMS Dominion Consulting Pty Ltd
6
The DUAP guidelines for economic issues will be followed below. The guidelines are
presented as headings to guide the reader with a response stated below each guideline. The
DUAP Director’s guidelines require the following:
“ Assess the likely economic impacts of implementing the management plan having regard to
the following”:
(1) Review of the existing situation
(a) location, structure (including interrelationships), age and investment in the fishing fleet (if
relevant); consider the regional or sub-regional implications
Location and number of fishers and vessels in fishery and sub regions.
The Estuary General (EG) fishery has commercially licensed fishers operating in 80 estuaries
in coastal NSW. The list of estuaries and administrative zones are reported in the Estuary
General Fisheries Management Strategy (EGFMS, 2001).
In May 2001, there were 944 EG businesses. Of these, 40% were north of the Manning river,
42% were in the Wallis Lake to South Sydney area and 18% in the area South of Sydney.
The total catch and value of the EG fishery in the 1984-2000 period is reported in Figure G1.
Figure G1: Total catch (Kg) and total value ($) of catch (nominal), in the NSW Estuaryfisheries in the 1984-2000 period (Source: NSWF; Sydney index). (Estuary data 1984-2000 includesEstuary Prawn Trawl data as well as EG).
-
5,000,000
10,000,000
15,000,000
20,000,000
25,000,000
84/8
585
/86
86/8
787
/88
88/8
989
/90
90/9
191
/92
92/9
393
/94
94/9
595
/96
96/9
797
/98
98/9
999
/00
Weight (kg)
Value ($)

Economic Issues: Estuary General FMS Dominion Consulting Pty Ltd
7
The total production in the 1997-2000 period, when Estuary General (EG) was a distinct
fishery, was approximately 5,000 tonnes of seafood which had an estimated value at first sale
of $18.1m in 1999-2000 as reported in Table G1.
Relationship between EG and other endorsed fisheries
The EG fishery has an annual revenue of $17.3 to $19.4m and is approximately 27% by
revenue of the total annual fishery production in NSW as reported in Table G1. Calibration of
the Sydney index data suggests the value may be 12%-21% underestimated.
Table G1: The total revenue of fisheries production in different fisheries in NSW (excludingAbalone) in the years 1997-2000 (millions $, nominal. Source: NSWF; Sydney index).
Year EG EPT OH OPT OFT OTL RL Total
1997/98 19.4 2.6 7.2 20.9 5.2 11.2 4.2 70.71998/99 17.6 3.2 4.1 23.4 4.1 9.6 3.8 65.81999/00 17.3 3.8 4.4 22.4 3.9 9.8 4.5 66.1
Average 18.1 3.2 5.2 22.2 4.4 10.2 4.2 67.5% 27% 5% 8% 33% 7% 15% 6% 100%
* 1999/2000 data as of May 2001 (Key: EG Estuary General; EPT Estuary Prawn Trawl; OH Ocean Haul; OPT Ocean Prawn Trawl; OFTOcean Fish Trawl; OTL Ocean Trap and Line and RL Rock Lobster) Dollar ($) values are nominal.
Due to the mixed endorsement holdings of EG fishers across several fisheries, the revenue
associated with catches across several fisheries made by fishers and fishing businesses
holding EG endorsements is greater than 18.1m per annum and is reported in Table G2.
Table G2: Fishery revenue for EG endorsement holders in the EG and other fishers in theyears 1997-2000 (millions $, nominal. Source: NSWF; Sydney index).
Year EG EPT OH OPT OFT OTL RL Total
1997/98 19.4 1.8 4.2 2.0 0.3 2.4 2.1 32.21998/99 17.6 2.5 2.5 1.0 0.1 2.3 1.7 27.71999/00 17.3 3.0 2.9 2.3 0.0 3.4 2.7 31.6
Ave. 18.1 2.4 3.2 1.8 0.1 2.7 2.2 30.5% 59% 8% 10% 6% 0% 9% 7% 100%
Table G2 reports that EG endorsed fishers had an average catch value of $18.1m from the EG
fishery over the 1997-2000 period, but an additional $12.4m from these fishers’ activities in
other NSW commercial fisheries. The extent of the relative revenue of EG endorsed fishers
across all fishing activities is reported in the percentages at the bottom of Table 2. Estuary
General fishers’ catch revenue is 59% of their total fishing revenue across all fisheries.

Economic Issues: Estuary General FMS Dominion Consulting Pty Ltd
8
Significant operator links exist between the EG fishery with both Estuary and Ocean Prawn
trawl fisheries, Ocean haul, Trap and line and Rock lobster fisheries.
The NSW fishery revenue for different districts along the NSW coast is reported in Table G3.
The EG fishers operate regionally within this state-wide picture of fishery interactions.
Table G3: State-wide fishery revenue in different fishery zones and districts of NSW in1999-2000 ($‘000. Source: NSWF; Sydney Index).
The regional fishery revenue associated with endorsed EG fishers is reported in Table G4.
The state-wide fishery relationships reported in Table G3 reveal that the Clarence district has
23% of state-wide fishing revenue, reflecting the OPT, EPT and EG fisheries in that region.
The Clarence EG fishery revenue is the highest EG district fishery revenue and with Wallis
Lake and the Richmond River second and third. The zones 1-4 north of Sydney/Hawkesbury
have approximately 80% of the revenue from state-wide fish production.
Table G4 reports the revenue associated with EG endorsed fishers in 1999/2000 across all
fisheries, giving the total catch in each district as a percentage of the total of $31.7m. In Table
G4 the EG revenues are as the state-wide picture, the EG endorsed fishers having
approximately 75% of revenue in EG fishing in the Zones 1-4 north of Sydney/ Hawkesbury.
Table G4 indicates the EG catch as a percentage of total catch in a district for the year 1999-
2000.
ZONE DISTRICT EG EPT OH OPT OFT OTL RL TOTALEG % of
Total
1 TWEED 655 - 342 1,703 - 775 - 3,475 5.2%1 RICHMOND 1,856 14 - 3,067 21 1,172 53 6,183 9.3%2 CLARENCE 2,740 2,607 157 9,081 - 341 217 15,142 22.8%3 COFFS HARBOUR 245 - 212 2,538 3 1,585 431 5,013 7.6%3 HASTINGS 912 20 504 1,634 26 468 234 3,798 5.7%4 MANNING 1,193 8 258 420 38 445 288 2,651 4.0%4 WALLIS LAKE 2,272 48 266 614 40 495 600 4,336 6.5%4 PORT STEPHENS 860 - 200 1,430 925 312 829 4,556 6.9%4 HUNTER 1,555 287 57 1,187 1,003 282 133 4,505 6.8%4 CENTRAL COAST 1,061 182 106 1 50 645 154 2,200 3.3%5 HAWKESBURY 251 312 - 4 - 1 - 568 0.9%5 SYDNEY NORTH 290 185 69 257 686 181 58 1,726 2.6%5 SYDNEY SOUTH 467 170 22 151 13 417 430 1,670 2.5%6 ILLAWARRA 876 - 1,206 62 1 861 565 3,572 5.4%6 SHOALHAVEN 1,042 10 73 134 292 606 132 2,289 3.5%7 BATEMANS BAY 442 1 258 88 715 271 395 2,171 3.3%7 MONTAGUE 451 4 60 30 8 742 17 1,312 2.0%7 FAR SOUTH COAST 128 - 645 37 60 228 20 1,118 1.7%
Total 17,299 3,848 4,434 22,439 3,880 9,826 4,558 66,283 100%

Economic Issues: Estuary General FMS Dominion Consulting Pty Ltd
9
Table G4: Fisher revenue for EG fishers in the EG and other fisheries, in different estuarydistricts of NSW in 1999-2000 ( $ ‘000. Source: NSWF; Sydney Index).
Key – END, Endorsements; Active, submitted one or more catch returns in 1999-2000.
Table G4 also reports that in May 2001, there were 1,003 endorsement holders in EG (944
fishing businesses). In the 1999-2000 year, 713 endorsement holders had fished in the EG
fishery, compared with 750 in the previous year illustrating annual variation. The EG fishery
reflects the diversity in fisher activity state-wide and also regional patterns of operation. The
EG fishery is primarily based in the central and northern regions of the state where fishers are
also endorsed in other fisheries. The final column of Table G4 illustrates the regional
dependence on the EG fishery in the different fishery districts and also shows the dependence
on the fishery in the southern area.
The diversity of fishery operations between multiple fisheries and multiple regions is
compounded by multiple methods used in taking the NSW estuary fish catch. The estimated
value of catch by different methods is reported for all estuary fishing in 1997-98 in Table G5
below. There are approximately 27 fishing methods used in NSW estuaries with different
impacts on the fisheries and environment. Mesh netting and haul netting are seen to take 43%
of estuary product value.
Vessel data from licence records
Vessels in the EG fishery are diverse as businesses and fishers can have several licensed
vessels. These vary from open vessels with no wheel house or decking, to small powered and
unpowered vessels about 5 metres in length (Newcastle Marine Brokers, 2000).
Zone District END ACTIVE EG EPT OH OPT OFT OTL RL TOTALEG % of district
1 TWEED 41 30 655 - 206 - - 191 - 970 59%1 RICHMOND 35 29 1,856 14 - 407 - 196 - 2,473 75%2 CLARENCE 156 134 2,740 2,538 116 1,372 - 198 217 7,137 38%3 COFFS HARBOUR 52 34 245 - 157 - - 253 187 842 29%3 HASTINGS 57 48 912 13 341 35 - 118 50 1,468 62%4 MANNING 48 38 1,193 - 162 7 - 31 138 1,447 77%4 WALLIS LAKE 88 72 2,272 1 190 198 8 265 447 3,382 67%4 PORT STEPHENS 65 41 860 - 163 17 - 176 571 1,787 48%4 HUNTER 77 50 1,555 213 57 168 9 211 126 2,338 67%4 CENTRAL COAST 81 54 1,061 107 106 1 - 421 133 1,830 58%5 HAWKESBURY 30 18 251 102 - - - 1 - 341 70%5 SYDNEY NORTH 39 19 290 54 69 1 - 123 51 587 49%5 SYDNEY SOUTH 41 23 467 6 22 - - 379 262 1,129 41%6 ILLAWARRA 56 35 876 - 983 54 - 26 188 2,128 41%6 SHOALHAVEN 56 30 1,042 - 57 - - 457 132 1,688 62%7 BATEMANS BAY 43 29 442 1 77 33 13 76 189 832 53%7 MONTAGUE 22 18 451 - 57 - 8 142 0 658 69%7 FAR SOUTH COAST 16 11 128 - 114 - - 134 15 388 32%
TOTAL 1,003 713 17,299 3,049 2,877 2,293 38 3,396 2,707 31,659 54%

Economic Issues: Estuary General FMS Dominion Consulting Pty Ltd
10
The NSWF licence data confirms the length of vessels, but the nature of EG fishing means
that several small vessels can be held by one fisher or fishing business. Estuary boats are not
as central a capital item as in the offshore fisheries. Figure G3 reports available details on the
vessels used only in the EG fishery (n=624, mean length = 5.1m and sd= 0.91m) and EG and
other fishing activity vessels (n=1416, mean length = 6.7m and sd= 3.3m). EG endorsed
fishers who fish in other fisheries such as the OPT, account for the vessels over 9 metres. EG
fishers have 2,040 boats from a state-wide total of 2,950.
Table G5: Revenue associated with different fishing methods in all NSW estuaries 1998-99(in $, Source: NSWF; Sydney index).
(nb. This is for all NSW estuary fishing an includes EPT fishery. See Table G3 for EG and EPT values).
Method 1998-99 %1 Mesh net, top set bottom set or splashing 5,435,908 28%2 Estuarine prawn trawl 3,166,949 16%3 Hauling net, beach haul 2,957,741 15%4 Crab pot (Trap) 1,497,123 8%5 Prawn haul net 1,087,431 6%6 Prawn set pocket net 964,424 5%7 Prawn running net 953,032 5%8 Bait net 923,204 5%9 Prawn seine (Snigger) 565,849 3%10 Eel trap 361,786 2%11 Mesh net, flathead 335,662 2%12 Other or ambiguous 297,599 2%13 Hand gathering 289,880 1%14 Fish trap,bottom/demersal 275,253 1%15 Handline 169,414 1%16 General purpose, trumpeter whiting or garfish net 98,920 1%17 Pound net 56,881 0.3%18 Hoop or lift netting 39,112 0.2%19 Pilchard,anchovy,bait net 35,177 0.2%20 Garfish net (hauling) 14,278 0.1%21 Setlining 9,715 0.0%22 Lobster/Crayfish pot 7,472 0.0%23 Skindiving 4,596 0.0%24 Jigging 2,439 0.0%25 Trolling 1,429 0.0%26 Mesh net, bottom set 19 0.0%
Grand Total 19,551,290 100%
Economic Issues: Estuary General FMS Dominion Consulting Pty Ltd
11
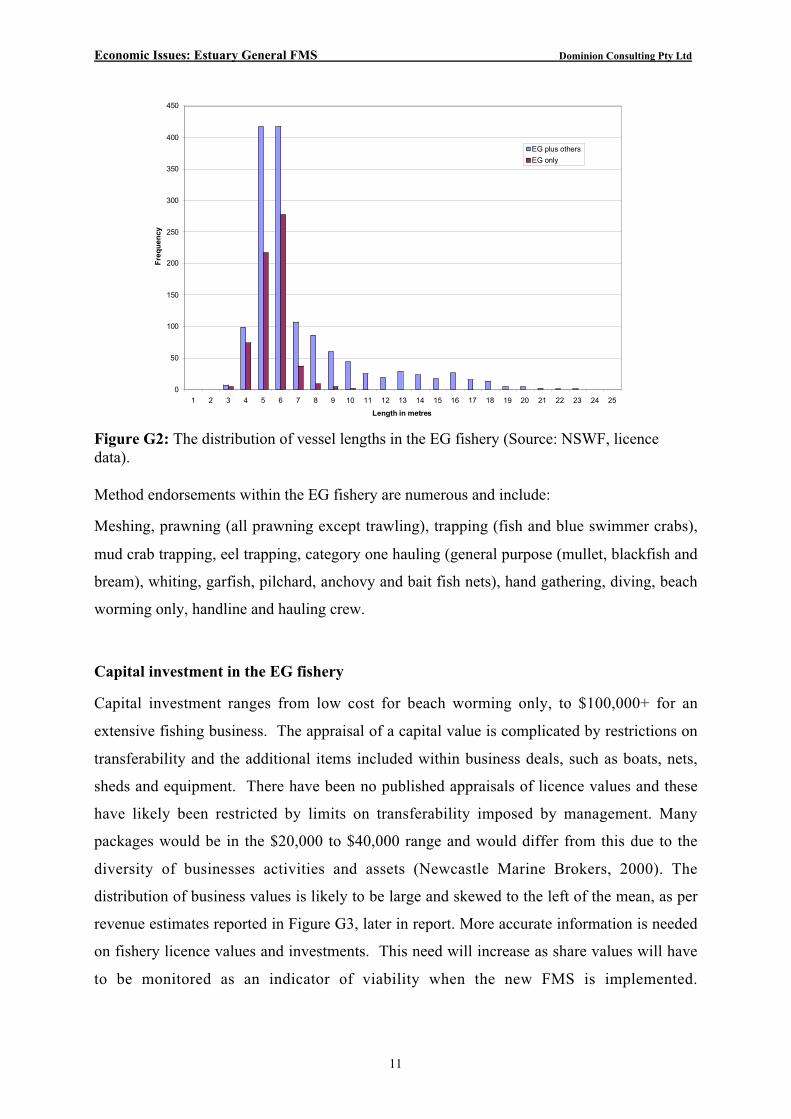
Figure G2: The distribution of vessel lengths in the EG fishery (Source: NSWF, licencedata).
Method endorsements within the EG fishery are numerous and include:
Meshing, prawning (all prawning except trawling), trapping (fish and blue swimmer crabs),
mud crab trapping, eel trapping, category one hauling (general purpose (mullet, blackfish and
bream), whiting, garfish, pilchard, anchovy and bait fish nets), hand gathering, diving, beach
worming only, handline and hauling crew.
Capital investment in the EG fishery
Capital investment ranges from low cost for beach worming only, to $100,000+ for an
extensive fishing business. The appraisal of a capital value is complicated by restrictions on
transferability and the additional items included within business deals, such as boats, nets,
sheds and equipment. There have been no published appraisals of licence values and these
have likely been restricted by limits on transferability imposed by management. Many
packages would be in the $20,000 to $40,000 range and would differ from this due to the
diversity of businesses activities and assets (Newcastle Marine Brokers, 2000). The
distribution of business values is likely to be large and skewed to the left of the mean, as per
revenue estimates reported in Figure G3, later in report. More accurate information is needed
on fishery licence values and investments. This need will increase as share values will have
to be monitored as an indicator of viability when the new FMS is implemented.
0
50
100
150
200
250
300
350
400
450
1 2 3 4 5 6 7 8 9 10 11 12 13 14 15 16 17 18 19 20 21 22 23 24 25
Length in metres
Fre
qu
ency
EG plus others
EG only

Economic Issues: Estuary General FMS Dominion Consulting Pty Ltd
12
(b) location and condition of existing infrastructure – such as transport (water and road),
berthing facilities, maintenance and repairs, cold stores if relevant, distribution and/or
processing facilities; consider the regional or sub-regional implications
Information on port infrastructure comes from records held by Department of Land and Water
Conservation (DLWC) and licensing records for fish receivers held by NSW Fisheries.
EG Ports in NSW with berthing facilities
The operators in the EG use a variety of sites and facilities for boat storage and operation.
Some of these are in conjunction with established wharf and fishing cooperatives. A list of all
public port assets for NSW was obtained from the Department of Land and Water
Conservation which was then compared with areas of operation of the EG fishers, Fishing Co-
operatives and towns in coastal NSW. The locations of port infrastructure are reported in
Table G6.
Table G6 reports the major port facilities available to EG fishers. The use of port assets by EG
fishers was sourced from Department Fishery Officers and EG MAC members. Interview
comments are attached to the right hand side of Table G6 and indicate that the estuarine
nature of the EG fishery means that coastal port facilities are not central to the operations of
EG fishers, especially compared to some of the ocean fisheries which involve larger vessels
and established harbour facilities.
Distribution – licensed processing facilities/ cooperatives
In the period prior to deregulation of fish marketing, NSW had a system of fish marketing
cooperatives, certificates of exemption and consents given to fishers to sell outside the
regulated system. Deregulation of fish marketing has brought a new system in which
Cooperatives have a less central role than before.
NSW Fisheries has a system of Registered Fish Receivers (RFR) and Restricted RFRs
(RRFR) to enable monitoring of the seafood industry. The system has two categories of
receiver:
(1) RFR, for large seafood receivers of which there are 92 state-wide, and

Economic Issues: Estuary General FMS Dominion Consulting Pty Ltd
13
(2) the RRFR, generally fishers or small businesses holding permission to sell catch
locally and which number 83 state-wide.
Table G6: The EG fishery and public port assets in NSW. Comments on EG use (Source:DLWC).
Town Port Assets HBR JET WHV ACC Comment
Tweed Heads Tweed Heads 1 2 1Estuary fishers use trailer boats and ramps
Brunswick HeadsBrunswick Heads 1 3 2 1 Only open to crab trapping trailer boatsBallina Ballina 1 1 2 1 Moor along river or trailerEvans Head Evans Head 1 1 1 1
Maclean Yamba & Iluka 2 4 3 2
Estuary fishers use trailer boats and ramps unless set pocket and truck catch to cooperative
Wolli Wooli 1 1 1Coffs Harbour Coffs Harbour 1 5 1 Trailer boatsSouth West Rocks South West Rocks 1 2 1 1 Trailer or moor in creekJerseyville TrailerPort Macquarie Port Macquarie 1 2 1 Trailer or moor along riverLaurieton Camden Haven 1 1 2 1 Trailer or moor along river
Crowdy Head Crowdy Head 1 2 1 1Ocean access harbour only. Fishers in lower end of Manning trailer
Taree Trailer or moor along riverTuncurry Tuncurry 1 1 3 Moor around lakeNelson Bay Nelson Bay 1 1 5 1Tea Gardens Tea Gardens 1 1 Trailer or moor along MyalWickham Raymond Terrace 1 1 1 Harbour at Wickham with Co-op
Newcastle Swansea 1 1Trailer boats or moor around lake Jty x2, Whv x 1
Mannering Park Trailer boats or moor around lake Tacoma Pat of Newcastle District
Brooklyn Brooklyn 1 1Trailer boats or moor along river and Pitt Water
PyrmontTrailer or moor at Pyrmont and Leichhardt
Mascot Cooks River Moorings only with ramp accessWollongong Wollongong 3 2 1 1 Ocean access only
Berkley Berkeley 1 1 2 1Trailer boats or moor at Berkeley Harbour or around lake
Port Kembla Port Kembla 1 1 Ocean access onlyShellharbour Shellharbour 1 1 1 Ocean access onlyKiama Kiama 1 1 1 1 Ocean access only
Nowra Greenwell Point 2 3 0 1Used mainly as ocean access Port. Trailer boats
Huskisson Trailer boats or moor in creekUlladulla Ulladulla 1 1 2 1 Ocean access onlyUlladulla Ulladulla
Batemans Bay 1 2 2 1 Trailer boats or moor along river
Narooma 1 1 3 2Woogonga Inlet closed to fishing comercially
Bermagui South Bermagui 1 3 1Ocean access port. River closed to fishing
Eden Eden 1 2 3 1 Trailer boats or moor in harbourThrosby Creek 1 2 2 1
(nb: HBR- harbour; JET – jetty; WHF – wharf; Acc – Access ramp)

Economic Issues: Estuary General FMS Dominion Consulting Pty Ltd
14
Tables G7a and b were compiled from these regulatory forms and can give some indication as
to the number of licensed processing facilities associated with EG and the location of the RFR
and RRFR holders in the EG fishery- (there is insufficient data in this area and it should be
treated with caution).
Table G7a: The RFRs associated with the EG fishery (Source: NSWF Fish receiver records).
Table G7b: The RRFRs associated with the EG fishery (Source: NSWF Fish receiverrecords).
The estimates come from the data submitted to NSW Fisheries in registering fish receivers
and the forms have limited information on the NSW seafood processing sector (see data
deficiencies section 3). It is estimated that 29 of the 92 RFRs establishments in the state
(30%) deal with EG species, but the proportion and volume of business is unknown. There are
17 of 29 RFRs associated with EG species in the northern area, and less in the central and
south of the state. Approximately 83% of processors by number are north of Sydney which is
similar to fisher numbers and the value of fishery revenue. Cold storage and retail sales also
follow this pattern.
The RRFR data indicates that of 83 RRFRs state-wide, 29 (35%) may have involvement with
EG species. Of these 21 have access to a cold store below 5 degrees C, and 8 have ice box
arrangements in place to maintain quality (Table G7b). Due to historical reasons there are
more RRFRs (formerly consent holders) in the southern area of the state with cold storage
capacity.
Road transport and cold stores
Road transport in the estuary general fishery is required to take the catch from the landing
point to market via processors or cooperatives. From state-wide records, there are 28 fish
No. RRFR's
EGEG - Cold
Store
No. Ice Boxes -
EGNorth Tweed-Manning 22 5 3 2Central Wallis-Sydney 26 6 5 1South Illawarra - Far South Coast 35 18 13 5Total 83 29 21 8
AreasNo.
RFR'sWith Cold
StoreNo. ColdVehicles
EGEG - Cold
StoreNo. ColdVeh. - EG
North Tweed-Manning 38 34 39 17 15 10Central Wallis-Sydney 29 21 30 7 7 8South Illawarra - Far South Coast 25 22 33 5 5 7Total 92 77 102 29 27 25

Economic Issues: Estuary General FMS Dominion Consulting Pty Ltd
15
transport vehicles (capable of holding fish below 5degrees C) associated with establishments
which handle EG species amongst other seafood. Again, an unknown proportion of this
capacity would be directly attributable to the EG fishery. Approximately 27 of 29 RFRs have
a cold store colder than 5 degrees.
(c) Employment by regions and sub-regions for fishers including direct employment eg boat owners,
skippers and crew and indirect employment (cold stores, traders, suppliers); identify the distribution of
income including seasonality factors; identify proportion of fishers with employment in other sectors
as well as fishing (where possible estimate % of income non-fisheries related for boat owners, skippers
and crew) or could be considered to be semi-retired;
The NSW Fishing industry has direct employment in fishing operations and indirect
employment through the cold stores, processors and traders. Current information is available
for direct employment only with the social survey giving new employment estimates. Table
G4 has presented the regional employment of EG fishers along the NSW coast.
Direct employment
Fishers are employed in businesses, though each business may have several fishers, and
fishers can work in several businesses. Fishers can be either owner operators, nominated
fishers, employees or crew depending on the fishery. However the analysis is complicated by
the ability of fishers to form several businesses, or be part of partnerships and companies, or
to work for other businesses as well as their own. All this also takes place within the broader
state-wide activity patterns of fishers fishing in different fisheries where one person can be
endorsed in up to six fisheries. The following facts from the database are provided at state-
wide and the EG fishery level for consideration.
The fishing industry state-wide has the following figures obtained from available data sets in
May 2001:
• In NSW there are 1,603 fishing businesses associated with 1,921 fisher file numbers*
(NSW F database);
• There are 1,590 Owner operators, 295 nominated fishers, 119 Skippers and 95
registered crew associated with the marine fisheries in NSW (NSW F database);
• A further breakdown of “entities” state-wide reports 84 companies, 149 partnerships
and 1,674 male and 14 female fishers;
• There were 1,407 active file numbers fishing in 1999-2000.
* a file number is a unique number given to a fisher, partnership or company by NSWF.

Economic Issues: Estuary General FMS Dominion Consulting Pty Ltd
16
The following facts for Estuary General were obtained from available data sets:
• In the EG fishery 944 businesses are associated with 1,003 fisher file numbers (NSW
F database);
• In May 2001 there were 919 Owner operators and 58 nominated fishers associated
with the EG fishery (NSW F database);
• A further breakdown of “entities” reports 14 companies, 44 partnerships and 922 male
and 11 female fishers.
The social survey investigated employment in the EG fishery. There were 502 respondents
holding EG endorsements. Each was asked: How many people have you employed in the last
12 months? (Full time, F-T or Part time, P-T). The results are presented in Table G8.
Table G8: Estimation of number of employees in Estuary General fishing businesses,2001(Source: RM- SS).
No of employees Frequency Total employees Full-Time Part –Time0 393 0 0 01 47 47 23 242 22 44 0 443 13 39 10 294 7 28 16 125 1 5 1 46 4 24 12 127 1 7 7 08 2 16 8 810 2 20 12 8>10 3 53 28 25Total 495 283 117 166
The 502 fishers interviewed had a total of 283 employees of whom 117 were full-time and
166 part-time. Assuming the sample is representative, given there were 502 responses from
1,003 fishers, it is proposed to double the survey estimate. This may be an over estimate given
that respondents tended to be more active fishers ceteris paribus. The EG whole fishing
population infers 566 employees (234 full time and 332 part time). Many employees may be
in processing, rather than assisting with EG catch. The fishers are also to be included in
employment estimates and represent 1,003 fishers/ endorsement holders both full time and
part time. Only 632 fishers (both part time and full time) chose to fish in the EG in 1999-
2000.

Economic Issues: Estuary General FMS Dominion Consulting Pty Ltd
17
There are between 1,1981 and 1,5692 persons employed full time and part time in EG fishing,
or as employees associated with fishing businesses which hold an EG fishing permit. The
survey estimate includes employees in fishing and processing, but is not a direct measure of
the employment in the processing sector, which is unknown. The actual proportion of
employees attributable to the EG fishery would be significantly less than the number
employed in businesses with an EG endorsement.
There is no established measure of either full time or part time commercial fishers. All fishers
were asked about the percentage of their income from fishing as compared to non-fishing.
Income from directorships and general investments was also identified as reported in Table
G9.
Table G9: The percentage of income from fishing and non-fishing sources, in which EGfishers participated in the last 12 months (Source: RM- SS).
Frequencies % EG Fishing % Fisheries %General % Other industries Representative Investments Work
29 <10 4.5 15.3 46.9 1 10-19 - 85.0 - 55 20-29 6.3 6.3 60.0 2 30-39 5.0 - 55.0 19 40-49 10.9 7.3 30.5 7 50-59 3.8 13.9 18.3 14 60-69 0.3 9.6 16.4 21 70-79 5.3 5.3 5.4 73 80-89 0.6 1.9 2.2319 90-100 - - -
Table G9 reports 319 fishers with 100% income from fishing and 94 with 80-90% of income
from fishing. Part time fishing involvement is revealed in 85 persons with less than 30% of
income from fishing and up to 60% of income from another industries. Of this paid
representative committee and Directors ships is less than returns from general investments
and other industries. Fishers working in other industries are described in the social issues
section H.
The social survey employment estimates also include the employment of fishers’ partners. In
the survey sample, 135 of 502 fishers had their marital partners “in the business” of which 45
were full time and 90 part time.
1 (632 active EG fishers+566 employees)
2 (1,003 endorsed EG fishers + 566 employees)

Economic Issues: Estuary General FMS Dominion Consulting Pty Ltd
18
Dependence measures
There are several measures of dependence. The revenue from the EG fishery as a share of
total fishing catch revenue is reported in Table G2. The regional dependence for the different
zones and districts in the EG is reported in Table G4. Table G4 reports that endorsed fishers
in areas such as the Richmond River, the Hastings River, Manning River, Wallis Lake, Hunter
River, Hawkesbury River, Shoalhaven River and Montague Island are relatively most
dependent on the EG fishery having over 60% of estimated district revenue derived from the
EG fishery. The method dependence in the EG is reported in Table G5. Income dependence
patterns are described below.
A measure of dependence of each fisher category is given by the estimates revenue of
different catch combinations in the EG fishery as reported in Table G10a. Approximately
32% of fishers fish EG only, having 21% of the value of all EG endorsed catch and are 100%
dependent on the EG fishery. The decreasing level of dependence is seen in the right hand
side column of Table G10a in relation to active endorsement numbers fished:- EG only, 2, 3
and 4 and 5 endorsement holders. Major catch inter-dependencies are with the Ocean haul,
Ocean trap and line and Estuarine prawn trawl as reported in Table G10b. Comparison of
percentages enable inferences about the relative earning capacity in each fishery as
represented by the Sydney index.
Table G10a: The dependence on the EG fishery, by EG endorsed fishers with other fisheryendorsements, in 1999-2000 (Source: NSWF; Sydney index).
No. Active FisheriesNo.
Fishers% Total Catch % EG Catch % %EG
1 324 32% 9,329,210 30% 9,329,210 55% 100%2 211 21% 11,355,512 36% 5,873,035 34% 52%3 72 7% 4,101,146 13% 1,614,029 9% 39%
4 & 5 16 2% 1,284,393 4% 249,355 1% 19%Endorsed - No Catch 290 29% 0% 0%Endorsed - Other Catch 90 9% 5,355,588 17% 0%Total 1,003 100% 31,425,849 100% 17,065,629 100%
Nb. “Endorsed no catch” are latent endorsements and “Endorsed –other catch” are fishers endorsed in EG who chose to fish in other fisheries

Economic Issues: Estuary General FMS Dominion Consulting Pty Ltd
19
Table G10b: The dependence on the EG fishery, by EG endorsed fishers with other fisheryendorsements, in 1999-2000 (Source: NSWF; Sydney index).
Catch CombinationsNo.
Fishers% Total Catch % EG Catch % %EG
EG Only 324 32% 9,329,210 30% 9,329,210 55% 100%EG & OH 47 5% 3,426,642 11% 2,459,705 14% 72%EG & OTL 70 7% 3,018,078 10% 1,681,309 10% 56%EG, OTL & OH 26 3% 1,673,585 5% 880,233 5% 53%EG & RL 12 1% 624,154 2% 287,625 2% 46%EG & EPT 75 7% 3,730,884 12% 1,315,303 8% 35%EG, OTL & RL 20 2% 1,275,442 4% 400,110 2% 31%EG, OTL, OH, RL 10 1% 780,490 2% 200,144 1% 26%Other Combinations 27 3% 1,499,758 5% 367,522 2% 25%EG & OPT 6 1% 532,168 2% 118,987 1% 22%EG, EPT & OPT 6 1% 179,850 1% 25,481 0% 14%Endorsed - No Catch 290 29% 0% 0%Endorsed - Other Catch 90 9% 5,355,588 17% 0% 0%Total 1003 100% 31,425,849 100% 17,065,629 100% 54%
Nb. “Endorsed no catch” are latent endorsements and “Endorsed –other catch” are fishers endorsed in EG who chose to fish in other fisheries
Distribution of income among fishers – categories of annual income etc.
The distribution of income is available through several measures. Firstly, revenues associated
with each EG only endorsed catch combination are reported in Table G11 from the Sydney
index. The EG fishers have the lowest average revenue in comparison to other fishing
combinations as seen in the average revenue and index of average revenue. The distribution of
annual revenue varies by fishing category and as reported by the coefficient of variation
(se/mean), the variation in annual fisher’s return is substantial. Frequencies of gross revenue
are plotted for single and multiple EG endorsed fishers in Figure G3.
Table G11: The distribution of average annual revenue for all EG fishers, fishing within theEG fishery in 1999-2000 (Source: NSWF; Sydney index).
No. Active FisheriesNo.
Fishers
AverageRevenue($) perannum
Index of AR sd Coeff. Of
Var.
4 & 5 16 80,275 2.79 41,757 0.52Endorsed - Other Catch 90 59,507 2.07 79,488 1.33
3 72 56,960 1.98 41,165 0.732 211 53,818 1.87 49,210 0.911 324 28,794 1 36,896 1.28
Nb. “Endorsed –other catch” are fishers endorsed in EG who chose to fish in other fisheries

Economic Issues: Estuary General FMS Dominion Consulting Pty Ltd
20
Figure G3: A frequency distribution of annual fishing revenue for EG fishers in 1998-99,fishing EG Only, 2, 3 or 4 fisheries (Source: NSWF; Sydney index).
Figure G3 confirms the diversity in revenue among fishers (file numbers) where a total of 148
EG only fishers have revenue below $10,000 per annum probably being part time fishers.
Both Table G11 and Figure G3 indicate the variation in fisher income.
Figure G4 displays this information to relate cumulative revenue and numbers of fishers in the
fishery. This shows that by fisher number, the distribution of annual catch among EG fishers
is evident. It should be noted that:
• 50% of fishers take 90% of the fishery revenue• the top 10% of fishers take 38% of fishery revenue• the top 20% of fishers take 57% of fishery revenue• the top 30% of fishers take 72% of fishery revenue• the bottom 50% of fishers take 10% of fishery revenue indicating part
time fishers.

Economic Issues: Estuary General FMS Dominion Consulting Pty Ltd
21
Figure G4: A plot of cumulative revenue versus cumulative number of endorsed fishers inthe EG fishery in 1998-99 (Source: NSWF; Sydney index).
Other fisher income data is available from the social survey. Table G12 reports the frequency
of gross income from all sources for 370 EG fishers who responded.
Table G12: The frequency of EG fishers’ gross incomes from the social survey in allindustries (Source: RM-SS).
Gross individual income (all industries)Dollars per annum %< 6,000 1% 60,000-69,999 4%6,000-9,999 1% 70,000-79,999 4%10,000-19,999 5% 80,000-89,999 4%20,000-29,999 13% 90,000-99,999 1%30,000-39,999 12% 100,000+ 7%40,000-49,999 11% Can't say 19%50,000-59,999 12% refused 7%
The distribution of income question revealed a mean income of circa $40,000, but there were
26% of fishers interviewed who did not to reply. A significant number of incomes of
$100,000 or over were recorded (7%). The accuracy of this cannot be verified, but as it
represents income from all industries, it may indicate financial diversification and business
interests outside the EG fishery.
0% 10% 20% 30%40%
50%
60%
70%
80%
90%
100%
-
0.10
0.20
0.30
0.40
0.50
0.60
0.70
0.80
0.90
1.00
0% 10% 20% 30% 40% 50% 60% 70% 80% 90% 100%
Cumulative endorsed fishers
Cu
mu
lati
ve r
even
ue

Economic Issues: Estuary General FMS Dominion Consulting Pty Ltd
22
Seasonal employment
There was no previous data on seasonal employment prior to this study. The seasonal
occurrence of the fish species is reported below as it gives some background to seasonality in
the fishery and the need for labour. Employment opportunities for fishers in other industries
have been investigated through the social survey.
The monthly variation in EG catches is reported in Figure G5 and indicates a reduced catch
and revenue in the third quarter of the year (July- October). Employment attributable to the
EG fishery is likely reduced in these months, as effort and labour is rested or may move to
other fisheries.
Figure G5: The monthly variation in catch and revenue in the EG fishery for years 1997/98and 1998/99 averaged (Source: NSWF; Sydney Index).
The actual seasonality of part time work in other industries was investigated in the social
survey. Figure G6 reports the timing of this non-fishing employment by asking “in what
months did you undertake paid employment outside the fishing industry”? Figure G6 reports
monthly frequencies and annual frequencies for those who worked all year.
-
500,000
1,000,000
1,500,000
2,000,000
2,500,000
JANUARY
FEBRUARY
MARCH
APRILM
AY
JUNE
JULY
AUGUST
SEPTEMBER
OCTOBER
NOVEMBER
DECEMBER
Month
$ o
r K
g
Catch (kg)
Revenue ($)

Economic Issues: Estuary General FMS Dominion Consulting Pty Ltd
23
Figure G6: Monthly frequency of employment outside fishing, (including all year round) inthe EG fishery (Source: RM- SS).
The correlation between the survey responses (Figure G6) and the Fishery Department EG
catch data (Figure G5) indicates fishers work in other industries in the EG low season and all
year round (see social section for further non-fishery employment analysis).
(d) examine current effort levels including latent effort and the link between effort and economic
performance and the viability of the commercial operations
Fishing Effort and latent effort in the EG fishery
Effort in a fishery can be appraised at different levels of aggregation. In the Estuary General
fishery, each business produces effort in the EG fishery and in other fisheries for which it
holds endorsements. Endorsements can be inactive, or if active, used lightly or to a fuller
extent, with the fishing activity being measured in days fished.
There were 944 businesses holding 1,003 endorsements to fish in EG in 2001. For the 1,003
licence holders holding EG endorsements, 623 were actively fishing in a range of commercial
fisheries in 1999-2000 and 380 were not.
8
109
10
16 16
22
25
17
21
17
14
36
0
5
10
15
20
25
30
35
40
Jan Feb mar Apr May Jun Jul Aug Sept Oct Nov Dec 12 months
Months, + all yr
Fre
qu
ency
(%
)

Economic Issues: Estuary General FMS Dominion Consulting Pty Ltd
24
Of the 623 active fishers, 90 could have fished in EG, but chose to catch fish in other fisheries
for which they were endorsed. This left 533 with a catch record in EG in 1999-2000. Of
these, 360 fished EG only and 173 fished EG and other fisheries.
In the discussion below, the term latent effort is used. It is defined as an endorsed fisher who
has not submitted a catch return in a given period as they have not fished. Active effort can be
thought of as having three layers in relation to effort in the EG.
Firstly, some businesses may not be fishing any of their endorsements in EG or other
fisheries. There are 380 endorsements with no fishing activity associated with them in 1999-
2000. These are considered latent and are unfished for a variety of reasons (for example,
multiple endorsement holdings, in another industry for a period, ill health and old age. The
social section of this report provides further details). These business operators could activate
their endorsements by fishing or transferring them to other operators hence raising active
effort in the fishery. Holding the licence as a fishing right for its option value is also
permissible and owners incur management and licence fees.
Secondly, EG endorsement holders that fished in other fisheries can be considered latent
when considering the EG, but not to the degree of the previous case. They have chosen to
fish other fisheries for a variety of reasons, but to hold the EG endorsement for its option
value. They may choose to use it again next season. This behaviour may reflect both
economic and social reasons and also perceived resource catch rates among alternative
fisheries.
Thirdly, there are fishers in the EG fishery who could increase their effort by increasing the
days fished to a higher level. The management issues with latent effort are discussed in
Appendix 1a.
Fishing Effort in the EG fishery
Fishing effort records are available through the NSWF logbook system. Those records before
1997 are less precise than recent logbook records. Effort levels can be measured in
endorsement numbers or in days fished. Effort measures may also be duplicative as fishing by
three methods in one day represents three fishing days. Thus it is possible for a fisher to have

Economic Issues: Estuary General FMS Dominion Consulting Pty Ltd
25
more than 365 days a year of effort. Past endorsement numbers by region, an aggregate effort
measure are reported in Table G13a and effort in days in Table G13b.
Table G13a: Current EG endorsement numbers by region, May 2001 (Source: NSWF-licensing records).
Zones Method 1 2 3 4 5 6 7 Total
Crab trap 22 59 68 119 20 4 4 296Eel trap 8 46 36 66 20 28 22 226Fish trap 5 23 48 120 49 6 9 260Hand gathering 29 4 29 40 2 15 5 124Handlining & HC 58 152 96 300 116 96 62 880Hauling Cat. 1 12 25 11 77 36 28 14 203Hauling Cat. 2 11 32 26 77 17 32 15 210Meshing 54 119 81 264 95 89 53 755Prawning 31 109 47 241 12 77 49 566
Total 230 569 442 1304 367 375 233 3520
The days effort associated with those endorsements in the years 1997-2000 are reported in
Table G13b. It can be seen that shareholdings are being used under the FMS as an aggregate
measure for the control of effort. Effort varies significantly between areas and endorsements.
Table G13b: Historical average effort levels in the zones of the Estuary General fishery,1997-2000 (Source: NSW F – catch effort records).
Key *Other records- not in zones.
Sum of Days Fished ZonesEndorsement Category Financial Year 1 2 3 4 5 6 7 * Grand TotalCrab Trap 1997/98 1,887 3,503 6,863 8,714 300 29 205 21,501
1998/99 2,155 3,248 6,997 7,825 272 2 12 41 20,5521999/00 1,782 3,420 6,033 7,651 452 21 74 30 19,463
Eel Trap 1997/98 684 1,299 717 907 834 1,010 798 105 6,3541998/99 774 1,142 926 1,315 965 1,006 674 123 6,9251999/00 969 1,218 1,628 1,307 853 1,058 336 65 7,434
Fish Trap 1997/98 5 932 2,495 1,470 790 11 2 7 5,7121998/99 91 709 2,416 1,349 591 6 57 5,2191999/00 24 474 2,084 1,363 581 26 77 - 4,629
Hand gathering 1997/98 82 11 67 39 120 207 96 200 8221998/99 64 8 78 175 193 166 299 6 9891999/00 89 60 214 81 123 67 25 659
Handlining 1997/98 43 822 145 534 317 94 1 49 2,0051998/99 233 663 106 656 318 50 6 3 2,0351999/00 112 635 120 695 260 197 29 3 2,051
Hauling 1 1997/98 386 4,119 312 3,361 1,534 1,160 198 374 11,4441998/99 405 2,950 258 4,378 1,062 1,456 130 16 10,6551999/00 327 3,227 411 3,606 886 1,263 107 2 9,829
Meshing 1997/98 2,006 5,603 5,838 18,650 3,582 3,533 2,406 473 42,0911998/99 2,284 6,101 6,151 16,851 3,437 4,194 2,582 188 41,7881999/00 2,464 6,201 5,963 17,192 3,276 3,397 2,211 93 40,797
Prawning 1997/98 1,458 3,640 1,382 6,727 115 1,606 739 205 15,8721998/99 1,182 2,437 1,205 7,362 62 880 1,344 88 14,5601999/00 1,552 2,424 1,245 6,732 16 1,429 884 26 14,308
Grand Total 21,058 54,786 53,500 119,073 20,897 22,895 13,101 2,384 307,694

Economic Issues: Estuary General FMS Dominion Consulting Pty Ltd
26
Under the FMS, effort measured in endorsement numbers, would be the prime control for
management. The regional catch will be monitored and a review of effort levels will occur if
the catch triggers are reached.
(e) Markets for fish harvested under the plan, eg. as domestic/export market for human food,
pet/aquaculture food or other uses
Available marketing information comes from Sydney Fish Markets and gives base line
minimum values of fish prices in the EG fishery. The Sydney prices do not incorporate the
prices of exported product and refer to unweighted monthly average prices. The Sydney price
may not adequately reflect a significant portion of the EG catch marketed outside Sydney, as
it includes product from many fisheries outside the EG Fishery. Market prices are a major
data shortfall (see section 3).
For example, the fish produced in the EG fishery has a significant export from NSW to
Queensland for some species such as mullet. These often receive a much higher price for
females in roe, than for male fish which tend to be closer to Sydney price. Using an average
price for a species does not reflect quality and grading issues.
The economic survey revealed EG Only fishers exported 2% of their product, by value, to
outside Australia. This was higher for fishers fishing EG and other fishers at 12% (RM-ES).
Marketing expenses as a percentage of gross revenue were 13.5% across all EG businesses
(RM-ES).
In the economic survey, 170 EG fishers were asked to state their main marketing options. EG
fishers with other fisheries have more diversified marketing arrangements as reported in Table
G14 in number of fishers (percentage of fishers, not volume). EG only fishers tend to supply
the Co-operatives and Sydney markets (78% by number), more than EG plus other fishing
businesses (55% by number).
Economic Issues: Estuary General FMS Dominion Consulting Pty Ltd
27
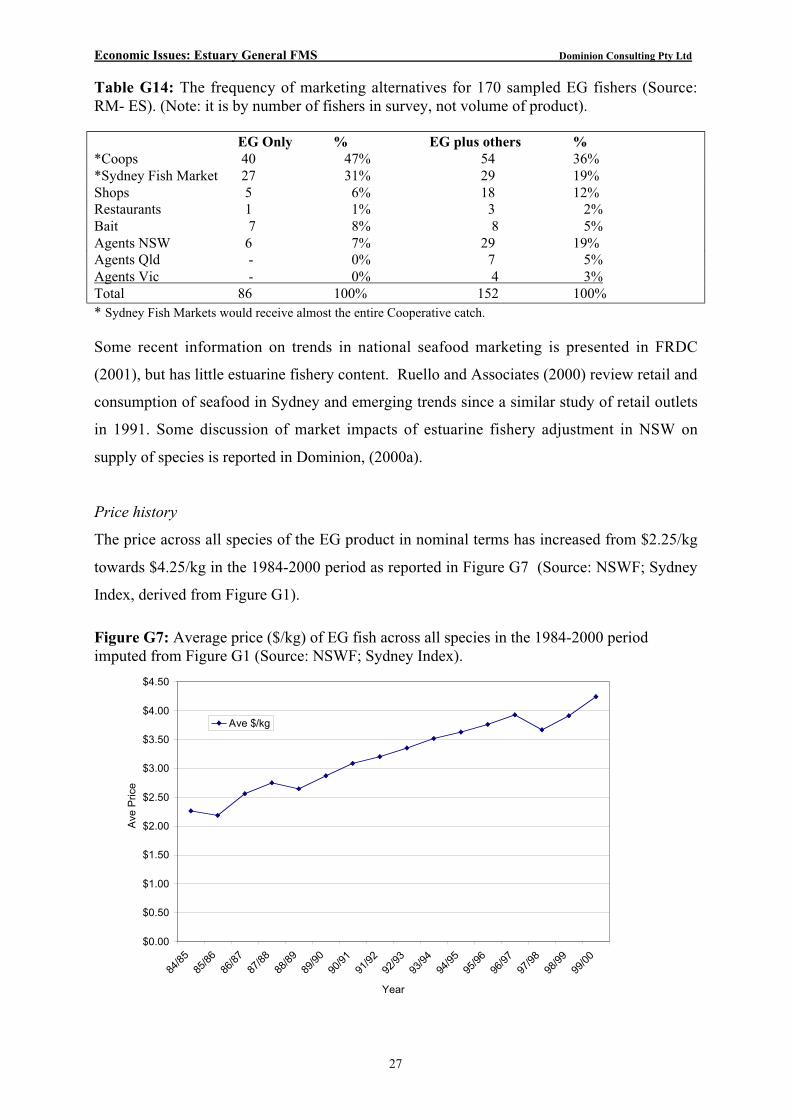
Table G14: The frequency of marketing alternatives for 170 sampled EG fishers (Source:RM- ES). (Note: it is by number of fishers in survey, not volume of product).
EG Only % EG plus others %*Coops 40 47% 54 36%*Sydney Fish Market 27 31% 29 19%Shops 5 6% 18 12%Restaurants 1 1% 3 2%Bait 7 8% 8 5%Agents NSW 6 7% 29 19%Agents Qld - 0% 7 5%Agents Vic - 0% 4 3%Total 86 100% 152 100%* Sydney Fish Markets would receive almost the entire Cooperative catch.
Some recent information on trends in national seafood marketing is presented in FRDC
(2001), but has little estuarine fishery content. Ruello and Associates (2000) review retail and
consumption of seafood in Sydney and emerging trends since a similar study of retail outlets
in 1991. Some discussion of market impacts of estuarine fishery adjustment in NSW on
supply of species is reported in Dominion, (2000a).
Price history
The price across all species of the EG product in nominal terms has increased from $2.25/kg
towards $4.25/kg in the 1984-2000 period as reported in Figure G7 (Source: NSWF; Sydney
Index, derived from Figure G1).
Figure G7: Average price ($/kg) of EG fish across all species in the 1984-2000 periodimputed from Figure G1 (Source: NSWF; Sydney Index).
$0.00
$0.50
$1.00
$1.50
$2.00
$2.50
$3.00
$3.50
$4.00
$4.50
84/8
585
/86
86/8
787
/88
88/8
989
/90
90/9
191
/92
92/9
393
/94
94/9
595
/96
96/9
797
/98
98/9
999
/00
Year
Ave
Pric
e
Ave $/kg

Economic Issues: Estuary General FMS Dominion Consulting Pty Ltd
28
This represents a nominal price trend of 4.16% per annum in price across all species in the
1984-2000 period. However, considering the consumer price index rise for the period was
4.2% per annum, there has been no real increase in the price of fish across all species.
(f) the economic return from the fishery including its contribution to individual, regional,
state and national income; estimate the value of the share/licence held by individual fishers
within the fishery
There is no previous information on economic performance of fishers or fishing businesses in
the Estuary General fishery. A brief review of a cross section of fishing businesses in NSW
was undertaken by IPART (1998), to establish the capacity of fishers to pay management
charges.
The Department of Urban Affairs and Planning (DUAP) Director’s Guidelines process
requires a measure of the net returns of each fishery and an estimate of the fishery’s
contribution to national income and the value of licences.
Economic return
A fishing industry economic survey was developed and distributed to industry by Roy
Morgan Research (Roy Morgan, 2001b). The survey methods and results are reported in
Appendix 2.
The economic survey indicates that 20% of businesses respondents are earning an economic
surplus under the levels of opportunity costs and economic depreciation assumed for long
term viability. These operators are contributing to the local, state and national economy in
terms of economic profit though the economic surplus. Approximately 80% of operators are
under the long term viability measure and a significant proportion will not be adding
contributing local, state and national income as discussed in Appendix 2.
The mean economic rate of return across businesses with EG fishing endorsements was -17%
to capital and the median rate of return was -30%, indicating 50% of operators falling below
this when examined on a single operational year. The results indicate significant long run
economic viability issues for industry and the need to address the economic performance of
up to 80% of operators in the fishery.

Economic Issues: Estuary General FMS Dominion Consulting Pty Ltd
29
Economic rates of return within the social and socio-economic context of rural estuary fishers
requires further study, incorporating the contribution to household income from work in other
sectors and family income including welfare and social security payments. This should be
part of the adjustment process and subsequent monitoring.
Gross costs and benefits and fishery management
The fishery has not been subject to a gross cost-benefit analysis. Environmental accounting
under the principles of Ecologically Sustainable Development (ESD) require that all inputs
are priced at their true cost. In the fisheries case, this would include the operational costs,
costs of management and ancillary services and the costs incurred in any depletion of the fish
stock (ABARE, 2000; p16).
A cost-benefit schedule of the EG fishery
The economics of fisheries management enables an appraisal to be made of the economic
contribution of the fishery to the economy and to analyse the impact of the changes advocated
in the FMS. ESD principles dictate that resources should be valued at their market values and
that subsidies should be taken into account in the form of an environmental accounting
statement. The NSWF Department costs of management, research and compliance, (less any
of these cost recovered from industry) should be added to the costs of fishing operations to
give a full economic cost. The rise or fall in the value of the fish stocks should also be
included in an environmental account as illustrated in Box G1 below:
Box G1: An economic environmental account of the Estuary General fishery.
Gross revenue from catch* per annum $20.9m
Less economic cost of operations** $25.3m
Operational Economic surplus $ -4.4m
less cost subsidies*** $ 1.43m
Total economic contribution $ -5.83m
Plus rise or fall in fish stocks**** $ 0m
Total of Management cost account $ -5.83m
* This is the revenue of catch from all EG businesses in the EG fishery and is the Sydney index estimate, adjusted by the
economic survey results (see Table G3 ie $17.3m + 21% = $20.9m) to take account of prices higher than the Sydney index.

Economic Issues: Estuary General FMS Dominion Consulting Pty Ltd
30
** This is the estimated cost of fishing inferred from the EG economic survey results for EG fishing businesses ( ie.
Appendix Table GA3 reports the average business as having $78,481 of economic costs for $65,350 of revenue ie. economic
costs are 1.21 times revenue). The total economic costs includes opportunity costs, costs of licences and some costs of
management.
*** To the operational surplus (TR-TC) costs of management not attributed to fishers under current cost policy are added
(ie. management, research, compliance, etc). IPART estimates of this are $1.883m, less fishers payments already in
economic costs, $0.455m = $1.43m. This does not include Commonwealth fuel or other primary producer subsidies.
**** The change in value of the stocks are unknown and are assumed to be zero, but may not be.
The cost benefit schedule illustrates how the operational performance of the fishery,
management charges and stock health can be related. The intention of the FMS is to move
towards greater economic viability and full cost recovery by 2008-09.
Licences
If licences are tradeable, then licence values can provide some information about the health of
the industry. However, licence prices can reflect short-run effects which are not necessarily
associated with a healthy fishery, reflecting over-capacity or over-fishing (ABARE, 2000).
Nonetheless, interpreted correctly, licence prices can be a useful indicator of the performance
of the industry in generating net value or rent.
In a fishery which has been under management and restructuring there is an expectation of an
increase in endorsement values through time. Available observations of endorsement/
business value data from Newcastle Marine Brokers suggests there has been no significant
increase in EG business values in the last eight years. This may reflect profitability,
management rules which limit endorsement transfer and reflect the attitude of the market and
confidence in management. However, since 1987 when the licence freeze came into being,
licences went from the old $2 administrative charge to the $20,000-$40,000 business values
of the mid 1990s and current period.
Detailed inference as to price structure of licence trades is not possible due to a lack of
available licence purchase information. Available imputed fish market data indicates an
increasing nominal fish price trend of 4.1% per annum which in eight years would give an
expectation of a 33% in nominal fish prices in the 1993-2000 period and a potential rise in
endorsement and business values. There has been no rise in nominal licence values which
may reflect the limitations on licence transferability. Other evidence of perceived economic
surplus may include the entry of new fishers, which has happened in recent years (see fishers

Economic Issues: Estuary General FMS Dominion Consulting Pty Ltd
31
and licence duration in social section). This may be as much a social phenomenon due to
children and relatives of fishers entering, rather than an indicator of fishing prosperity.
(g) Existing economic multiplier effects – costs and benefits
Review of information on economic multiplier effects in the fishing industry of NSW.
Economic multipliers come from input-output modelling of economies and relate to the flow-
on impacts of expenditure within a closed local economy and the revolving benefits of this.
Similarly employment multipliers estimate the impacts on employment of expenditures in the
locality. There are several historical fishing community studies appraising the multipliers and
flow-on impacts in the NSW fishing industry. These studies can be used as a guide to likely
economic impacts of policies and with some careful interpretation are likely to be preferred to
interpolations from non-fishing industry material. In particular note should be taken of
changes in the structure and operations of the industry since the studies were undertaken (Dr
R. Powell, pers. comm.).
The available literature enables discussion of multipliers in four fishing communities in NSW,
Eden and Ulladulla (Powell et al., 1989), the Northern NSW region (Tamblyn and Powell,
1988) and the Clarence region (McVerry, 1996).
The economic significance of an industry, such as commercial fishing, can be measured in
terms of direct and indirect effects. The direct effects are a measure of the value of output of
the industry itself, the number of people employed and the income they receive. The indirect
effects can be divided into production induced and consumption induced effects. Production
induced effects are the industry's purchase of goods and services from other industries.
Consumption induced effects arise from the spending of household income received as
payment for labour. The multipliers indicate the size of those impacts relative to the level of
sales to final demand. The Type II ratios reflect the relationship between the total impact
(direct and indirect) to the direct effect. Table G15 presents multiplier estimates from the
economic studies of fisheries in coastal regions of NSW.
A significant issue is whether the multipliers and/or estimated flow-on impacts include the
downstream effects of transport, marketing and packing? The calculation of multipliers from

Economic Issues: Estuary General FMS Dominion Consulting Pty Ltd
32
fishing, will only include the linkages effects that occur back through the supply of inputs to
fishermen and not any effects downstream toward the consumer.
Table G15: Output, income and employment multiplier estimates from fishing community
studies in NSW (Tamblyn and Powell, 1988; McVerry,1996; and Powell et al., 1989).
OUTPUT (a) Initial First IndustryProduction
inducedConsumption
inducedTotal
Type II ratio
Northern NSW (1)Fishing 1 0.1521 0.0412 0.1933 0.7166 1.91 1.91
Clarence (2)Fishing 1 0.063 0.028 0.091 0.787 1.877 1.877
Ulladulla (3)Trawl 1 0.1705 0.0663 0.2368 0.3269 1.5637 1.5637Non trawl 1 0.1645 0.0588 0.2233 0.3409 1.5642 1.5642
Eden (3)Trawl 1 0.1702 0.0478 0.218 0.2206 1.4387 1.4387Non trawl 1 0.1813 0.039 0.2203 0.1977 1.4179 1.417Process+ 1 0.3363 0.0893 0.4256 0.1051 1.5307 1.5307
INCOME (b) Initial First IndustryProduction
inducedConsumption
inducedTotal
Type II ratio
Northern NSW (1)Fishing 0.4999 0.0409 0.0147 0.0556 0.2691 0.8329 1.662
Clarence (2)Fishing 0.59 0.017 0.009 0.026 0.308 0.924 1.566
Ulladulla (3) Trawl 0.2999 0.0472 0.0218 0.069 0.1266 0.4955 1.6524Non trawl 0.3156 0.0497 0.0195 0.0692 0.1321 0.5168 1.6378
Eden (3) Trawl 0.2999 0.037 0.0128 0.0498 0.0802 0.4299 1.4337Non trawl 0.2489 0.0535 0.0109 0.0644 0.0719 0.3852 1.5475Process+ 0.0621 0.0824 0.022 0.1044 0.0382 0.2047 3.2982
EMPLOYMENT (b)
Initial First IndustryProduction
inducedConsumption
inducedTotal
Type II ratio
Northern NSW (1)Fishing 0.0376 0.0031 0.0009 0.0416 0.0181 0.0596 1.5868
Clarence (2)Fishing 0.029 0.001 0 0.03 0.014 0.044 1.499
Ulladulla (3) Trawl 0.0184 0.0026 0.001 0.0036 0.0062 0.0282 1.5363Non trawl 0.0268 0.0023 0.0009 0.03 0.0065 0.0365 1.3592
Eden (3)Trawl 0.0184 0.0018 0.0005 0.0207 0.0033 0.0239 1.3009Non trawl 0.0147 0.002 0.0004 0.0024 0.0029 0.02 1.3669Process+ 0.0034 0.0045 0.001 0.0055 0.0016 0.0106 3.06
(a) per dollar of output Sources: (1) Tamblyn & Powell, 1988(b) employment per thousand dollars of output (2) McVerry, 1996.
(3) Powell et al. 1989

Economic Issues: Estuary General FMS Dominion Consulting Pty Ltd
33
Output flow-on effects
From the initial output of one dollar there are total flow-on output effects ranging between
41.7 cents (non trawl Eden) and 91.0 cents (Northern NSW). Those levels of flow-on effect
are relatively modest. They refer to the level of the flow-on effects within the small local
area. In most cases, this reflects the limited capacity of the local economy to supply inputs to
the fishing activities as well as the relatively low level of purchased inputs used. Comments
from each study are reported in Appendix 3 and discussed below.
Discussion
From a state-wide perspective the comparison of Eden and Ulladulla in 1978-88 with the
Northern NSW 1984-85 and the Clarence in 1992-93 shows a contrast in the nature of the
fisheries, time periods, regions and what is included in the analysis ie. fishing only, or
processing, handling, transport and less usually wholesale and retail.
The Eden and Ulladulla trawl fishing flow-ons reflect the structure of the trawl industry and
the influence of the orange roughy catch at that time. The non-trawl data from the same period
is reported and is not significantly different from the trawl data in Eden and Ulladulla when
output and income multipliers are compared.
In the Northern NSW study based on 1984-85 data and covering the Tweed Heads to
Tuncurry area, the activity in a range of fisheries, especially the prawn industry sector, is
captured. The Clarence region study in 1992-93 focuses on the fishing activity and processing
in the Clarence at that time.
Given our interest is in the flow on effects associated with the Estuary General fishery in the
current year 2001 period, the use of historical information is limited.
It is unlikely that either the Clarence or the Eden and Ulladulla results will be a representative
source of “typical” multiplier values for impact appraisal in the EG fishery. The Northern
NSW regional study covers the region in which the EG fishery is a major contributor, though
the study may reflect the prawn industry influence. The two potential differences to take note
of are the type of fishery included and what of the downstream activities are included –
processing etc. (Dr R. Powell, pers. comm.).

Economic Issues: Estuary General FMS Dominion Consulting Pty Ltd
34
Conclusion
The Northern NSW study indicates fishing as 82% of the total flow on effect, which reflects
many single person businesses in estuary fishing and a limited amount of processing. Both the
southern and northern study indicate the ratio of all effects to direct fishing effects is between
1.5 and 2.0, with one result of 2.4 (Tamblyn and Powell, 1988; Powell et al. 1988). Local
multiplier effects are likely to be relatively small at around 1.5 for most fishing activities.
Even in that case, the larger part of the flow-ons will be consumption-induced effects. That
reflects a relatively low level of use of purchased operating inputs apart from labour, while
many of the specialist inputs used are not likely to be produced locally. The multiplier will be
higher where there is a significant amount of on-shore activities associated with handling,
marketing and transporting the catch. The more value adding undertaken within the local area,
the higher the multiplier. That could result in multipliers near to 2.0 (Dr. R. Powell, pers.
comm.).
The Regional expenditure of fishers
Fisher expenditures can be divided into expenditure on employment, inputs for the fishing
process and capital items for fishing. The previous section examined results of detailed
regional expenditure studies which give multipliers showing employment and production
induced expenditure effects. Capital and input expenditures are investigated below. Little
information exists on regional expenditure interactions. For the Clarence region, McVerry
(1996) estimated that 27% of fishing business expenditures move outside the region, leaving
approximately 70% of the first sale value of catch in the local fishing community.
The regional nature of fishers’ business expenditures in the EG fishery was examined through
questions on the larger scale purchases of EG endorsed businesses in the social survey. A
total of 502 EG fishers were asked about the amount and location of their major purchase
over $1,000. 285 had no major expenditures, but other expenditure locations and items
purchased are reported in Table G16a and b.
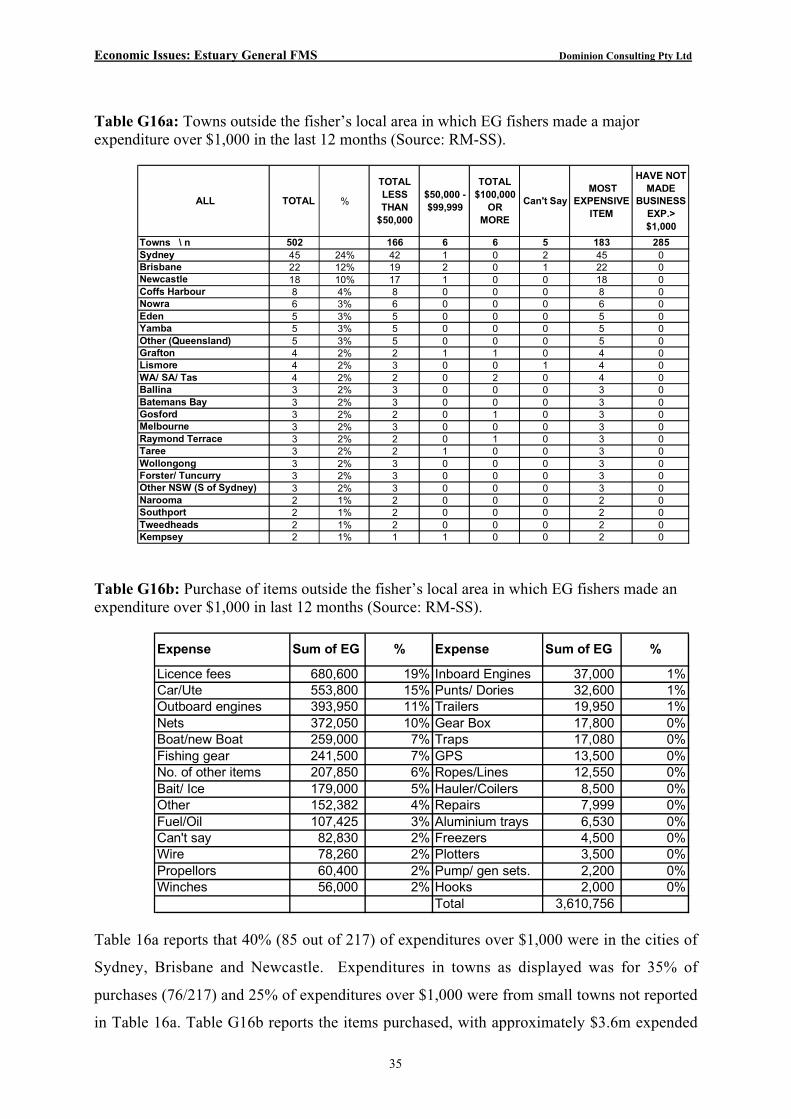
Economic Issues: Estuary General FMS Dominion Consulting Pty Ltd
35
Table G16a: Towns outside the fisher’s local area in which EG fishers made a majorexpenditure over $1,000 in the last 12 months (Source: RM-SS).
Table G16b: Purchase of items outside the fisher’s local area in which EG fishers made anexpenditure over $1,000 in last 12 months (Source: RM-SS).
Table 16a reports that 40% (85 out of 217) of expenditures over $1,000 were in the cities of
Sydney, Brisbane and Newcastle. Expenditures in towns as displayed was for 35% of
purchases (76/217) and 25% of expenditures over $1,000 were from small towns not reported
in Table 16a. Table G16b reports the items purchased, with approximately $3.6m expended
ALL TOTAL %
TOTAL LESS THAN
$50,000
$50,000 - $99,999
TOTAL $100,000
OR MORE
Can't Say MOST
EXPENSIVE ITEM
HAVE NOT MADE
BUSINESS EXP.> $1,000
Towns \ n 502 166 6 6 5 183 285Sydney 45 24% 42 1 0 2 45 0Brisbane 22 12% 19 2 0 1 22 0Newcastle 18 10% 17 1 0 0 18 0Coffs Harbour 8 4% 8 0 0 0 8 0Nowra 6 3% 6 0 0 0 6 0Eden 5 3% 5 0 0 0 5 0Yamba 5 3% 5 0 0 0 5 0Other (Queensland) 5 3% 5 0 0 0 5 0Grafton 4 2% 2 1 1 0 4 0Lismore 4 2% 3 0 0 1 4 0WA/ SA/ Tas 4 2% 2 0 2 0 4 0Ballina 3 2% 3 0 0 0 3 0Batemans Bay 3 2% 3 0 0 0 3 0Gosford 3 2% 2 0 1 0 3 0Melbourne 3 2% 3 0 0 0 3 0Raymond Terrace 3 2% 2 0 1 0 3 0Taree 3 2% 2 1 0 0 3 0Wollongong 3 2% 3 0 0 0 3 0Forster/ Tuncurry 3 2% 3 0 0 0 3 0Other NSW (S of Sydney) 3 2% 3 0 0 0 3 0Narooma 2 1% 2 0 0 0 2 0Southport 2 1% 2 0 0 0 2 0Tweedheads 2 1% 2 0 0 0 2 0Kempsey 2 1% 1 1 0 0 2 0
Expense Sum of EG % Expense Sum of EG %
Licence fees 680,600 19% Inboard Engines 37,000 1%Car/Ute 553,800 15% Punts/ Dories 32,600 1%Outboard engines 393,950 11% Trailers 19,950 1%Nets 372,050 10% Gear Box 17,800 0%Boat/new Boat 259,000 7% Traps 17,080 0%Fishing gear 241,500 7% GPS 13,500 0%No. of other items 207,850 6% Ropes/Lines 12,550 0%Bait/ Ice 179,000 5% Hauler/Coilers 8,500 0%Other 152,382 4% Repairs 7,999 0%Fuel/Oil 107,425 3% Aluminium trays 6,530 0%Can't say 82,830 2% Freezers 4,500 0%Wire 78,260 2% Plotters 3,500 0%Propellors 60,400 2% Pump/ gen sets. 2,200 0%Winches 56,000 2% Hooks 2,000 0%
Total 3,610,756

Economic Issues: Estuary General FMS Dominion Consulting Pty Ltd
36
on items over $1,000 outside the fisher’s local area. Capital items, such as cars, nets, boats
and fishing gear are approximately 60% of the expenditure in the survey sample. The
expenditures by businesses on licence fees is for more than the EG fishery only.
Table 16c reports the pattern of expenditure on major purchases for 158 of 217 purchases.
Generally fishers in the north and south purchase some major items in their respective areas,
with Sydney, Melbourne and Queensland having trade with a range of areas. The major
purchase link between the Clarence and Brisbane for EG businesses is significant.
Table G16c: Purchase location outside fisher’s residence area, in which EG fishers made anexpenditure of over $1,000 in last 12 months (Source: RM- SS).
Regional expenditures, multipliers in the fishing and the seafood processing industries are an
area for further research. Expenditures of fishers and businesses and interactions between
fishing communities along the NSW coast could also be investigated on a state-wide basis.
Town of residence
B'b
ane
Qld
Lis
mo
re
Yam
ba
Gra
fto
n
Co
ffs
Hb
r
Fo
rste
r/
Tu
ncu
rry
New
cast
le
Syd
ney
No
wra
Bat
eman
s B
ay
Ed
en
Mel
b. V
ic
To
tal
Tweed Heads 1 - - - - - - 1 - - - - 2Richmond River 3 2 1 - - - - 2 - - - 2 10Clarence River 17 3 1 5 6 - - 4 - - - 1 37Macleay River 2 1 - 1 - - 2 1 - - - - 7Port Macquarie 1 - 1 - - - - 2 - 1 - 1 6Camden Haven - - - - 2 - - 2 - - - - 4Manning River 1 - - - - 2 - - - - - - 3Wallis Lake 1 - - - 1 1 1 4 - - - 1 9Port Stephens 3 - - - - - 11 7 - - - 1 22Hunter River - - - - - - 1 3 - - - - 4Newcastle - - - - - - 3 1 - - - - 4Lake Macquarie - - 1 - - - 1 - - - - - 2Tuggerah Lakes - - - - - - 1 2 - - - - 3Hawkesbury River - - 1 - - - 3 6 - - - - 10Botany Bay 1 - - - - - - - 1 - - 1 3Lake Illawarra 1 - - - - - - 3 1 - - - 5Jervis Bay - - - - - 1 - 4 2 - - - 7Ulladulla - - - - - - - - 2 1 1 - 4Batemans Bay - - - - - - - 6 1 3 1 - 11Narooma - - - - - - - 3 1 - 1 - 5 31 6 5 6 9 4 23 51 8 5 3 7 158
Town of major purchase over $1,000
Economic Issues: Estuary General FMS Dominion Consulting Pty Ltd
37
(2) Likely economic implications of implementing the plan
Under the DUAP Director’s Guidelines the likely economic implications of implementing the
Fisheries management Strategy must be evaluated against six criteria (a)-(f). Economic
impacts of the FMS are presented in section G and social impacts in section H.
The available descriptive economic information has been described in the previous section.
There is insufficient economic data available to appraise many of the issues proposed in the
fisheries management strategy (FMS). This limit should be recognised by the reader and
where insufficient data is available this will be indicated.
Economic assessment
The economic issues section will follow the DUAP Director’s guidelines and notes that the
economic impact assessment process in NSW has also been addressed in several other
documents (NSW Government, 1997c and DUAP, 1997). The purpose of economic appraisal
in an environmental context is “to achieve a socially efficient allocation of scarce resources ie.
one which maximises the return, including the environmental capital stock, in order to
maximise economic welfare of all citizens over time” (NSW Government 1997c; annex 5).
This requires that benefits and costs are measured through market values. Total social costs
and benefits also include running down, or building up of the environment (NSW
Government 1997c; annex 5). This would include the fish stock in the current analysis.
The major economic assessment technique is cost-benefit analysis (CBA), which quantifies in
money terms all major costs and benefits, providing a consistent basis for evaluating costs and
benefit, though it does not necessarily show the distribution of benefits or costs (NSW
Government 1997c). CBA requires transparent information .
There are different types of impacts to be considered in an Environmental Economic Impact
Assessment process. According to Thomas (1998) these are:
- Direct impacts of proposal;
- Indirect impacts, being one step removed;
- Cumulative impacts coming from the interaction of proposal elements;
- Predicted residual impacts, impacts not avoided or mitigated;
- Predicted probability, magnitude, distribution and timing of expected impacts;

Economic Issues: Estuary General FMS Dominion Consulting Pty Ltd
38
- Forecasting of what will happen to affected components of the environment if the proposal
goes ahead.
The various types of impact will be considered in the analysis of economic impacts.
The assessment framework
Given the DUAP Director’s guidelines and other available material examined it is proposed
that the following approach will be taken to analysis of economic impacts of the fisheries
management strategy. There is no objective economic data that can be ranked and the
following process is used:
i) Describe the fisheries management objectives and the responses with economic impact
under the management strategy and present impacts in a Table form. Identify the impacts
of each strategic response on the fishers and community, and rank impacts into two levels
– High and Low. The ranking will reflect an opinion of the predicted scale of economic
impact from available information or on a qualitative basis. The most highly impacting
issues will be appraised, and low impact economic issues will be discussed generically;
ii) For each of the high impact economic issues, changes and measurable impacts on
sectors will be presented for each issue following the DUAP criteria. These include:
• market trends that effect the fishery (DUAP, 2001: section G2a);
• implications of the strategy on access rights and economic viability (DUAP, 2001:
section G2b), and
• changes in resource allocations within the fishery sector (DUAP, 2001: section
G2c) including multiplier effects, mitigation and also between fishery sectors (CF,
RF and NF), including multiplier effects and mitigation (DUAP, 2001: section
G2d). For each highly impacting management response an overall economic
benefit will be presented where information is available.
iii) Discuss the likely economic implication of maintaining the present resource allocation
rules for all issues identified (DUAP, 2001: section G2e).
iv) Justify the preferred approach under the FMS in terms of the Ecologically Sustainable
Development principles, concluding the assessment (DUAP, 2001: section G2f).

Economic Issues: Estuary General FMS Dominion Consulting Pty Ltd
39
The assessment
(i) Describe the fisheries management objectives and the responses with economic impact
under the management strategy and present them in Table form. Identify the impacts of each
strategic response on the community and fishers and rank it into two levels of impacts – High
and Low.
The management goals from the FMS document (FMS, 2001) and responses with economic
impact are described in Table G17. The responses are ranked into high and low economic
impact categories.
The basis of the ranking in Table G17 is by highest potential economic impact, ranking
prioritising the most significant resource allocative issues affecting the whole fishery, rather
than a sector or individuals. The extent of economic impact is estimated as a function of the
number of businesses/persons affected and the degree of economic change to each business,
potential impact on other sectors and the effect on the fish stock.
For example, the potential use of access arrangements, such as category 2 share management
to reduce fisher effort by adjusting fisher numbers and hence capacity, has a high economic
impact ranking. This is due to every business being affected and impacted financially with
potential community costs and benefits. A low ranked issue is of more limited impact, some
being smaller scale issues for sections of industry, such as altering specifications of a type of
fishing gear regulation. This would impact only those using that gear and if the change per
fisher is small, the total impact is estimated to be low. Ranking also considers the potential
impacts of policies on the fish stocks.
From Table G17 four responses are ranked as highly impacting:
zoning of the fishery; changes to hauling; access right amendment through category II share
management which impacts through minimum shareholding provisions for businesses and
endorsement holders.
Low impact issues are discussed generically and an evaluation of the costs and benefits of the
whole FMS are presented.

Economic Issues: Estuary General FMS Dominion Consulting Pty Ltd
40
From Table G17 and investigation of each economic issue the main economic impacts come
from altering access and effort in the fishery through effort and share entitlement Strategies
(responses 2.2a,b, 2.3a,b and 5.2(a) and 5.3 a. which have implications for viability are as
reported below).
Table G17: The EG Fisheries Management Strategy responses ranked by potential economicimpact of the Fisheries Management Strategy.
ii) Economic impacts
The four major economic impacts identified, the generic low impact issues and the overall
cost benefit appraisal of the FMS are presented in this section.
RESPONSE DESCRIPTION OF RESPONSE GOALS ISSUES RANKING
1.1(e) Reduce haul nets down to 500m & reduce shots per day 2,3,4 effort HIGH
2.2(a) Implementing zoning scheme in EG 4 effort HIGH
2.2(b) Active effort & endorsements, min. shareholding 1,3,4 effort HIGH
2.3(b)Min entry requirements at the fishing business level to prevent
increases in effort 1,3,4,5 effort HIGH
5.2 Promote long terms econonomic viability of EG viability HIGH
5.2(a) Minimum shareholdings to adjust number of businesses viability HIGH
5.3 (a) Provide secure fishing entitlement for EG viability HIGH
5.2(b) Develop and indicator of individual economic viability viability LOW
5.2( c) Develop a cost recovery framework viability LOW
1.1(a) Increase mesh size of 70mm Flathead net 2,4, 5 size LOW
1.1(d) Phase out winter set mesh nets <95mm 2,4 size LOW
2.1(a) Limit size of gear 1,3,4,5 size LOW
2.1(d) Size limits to catch adult fish 5 size LOW
2.1.1(a) Introduce minimum legal length for primary finfish species size LOW
4.2(b)Determine approriate size of first cature for king prawns and school
prawn species1,2,5 size LOW
5.1 Optimise the biological yield of fish and max. economic return size LOW
1.2(a)- 7th pt Equitable resource sharing - EG + other stakeholders 2,3,4,5 allocation LOW
2.1.2(b) Allocate max. quantity of glass eels 4,7 allocation LOW
2.1.3(b) Implement allocation of shares to fish and crab trapping 4,5,6 allocation LOW
2.1.3(c) Consider a tradeable crab trap regime based on shares 4,5 allocation LOW
2.3(a) Implement an owner-operator rule for EG fishing business 1,3,4 allocation LOW
1.2 (a)-5th pt Closures-Fish size, Max. Econ. Return 2,3,4,5 closures LOW
2.1(e) Prohibition on the taking of all female crabs carrying ova closures LOW
1.2(c) - 5th pt Developing codes of conduct (Icing practices/adding value) All market LOW
5.4(a) Development of food safety programs market LOW

Economic Issues: Estuary General FMS Dominion Consulting Pty Ltd
41
1) Economic assessment of zoning (FMS response 2.2(a))
The NSW coast will have seven fishery zones. Stage 1, commenced in June 2001 and
involves allocating one of seven primary regions to each fisher and issuing a permit to operate
in individual estuaries beyond that region for methods where historical use can be
demonstrated. Stage 2 will involve applying tighter rules for zoning, but at the same time
taking into account circumstances where fishers may be unduly impacted.
Fishers are required to operate within one zone, instead of traversing zones which often led to
local disputes. This will “provide a framework for regional management” (FMS, 2000;
2.2(a)). Containing effort to regional zones will increase the likelihood of development of
regional management arrangements with more secure access and less conflict caused through
fishing by “outsiders”.
Changes and measurable impacts
With the proposed zoning there are no envisaged market impacts, but several impacts on
fishing rights. The right to access and traverse between different areas is being reduced and
the right to fish in a given zone now becomes more exclusive. It is likely that access shares
may increase in value if the resource in a region is perceived as productive, sustainable and
well managed, provided that effort and fisher endorsement numbers are contained through the
management strategy.
Conflict will be reduced from “external fishers” not entering another zone and the incentives
for local fishers to steward the fish resources in their zone will increase.
Regional zoning would have differing impacts on the economic viability of fishing
businesses. Businesses that fish in an area that outsiders previously accessed may experience
an increase in commercial viability. Alternatively fishers who travelled between different
regions would have segments of their business activity removed being forced to fish in one
zone, or seek an exemption. Dedicated travelling fishers will have an alteration to their fishing
practices and with impacts on their operational viability.

Economic Issues: Estuary General FMS Dominion Consulting Pty Ltd
42
Information and analysis
Two sources of information exist on travelling fishers: the social survey and from the zoning
appeals process.
In the social survey fishers were asked for to define the distance travelled one way from
home, in either kilometers or boat hours of travel, to their main fishing activity. In the EG
only 4% of fishers moved more than 100km one way by road or over 3 hrs by boat.
Approximately 5% moved between 50 to 100km and 2 to 3 hrs by boat, representing
approximately 46 fishers in the active fishing population (social survey data).
The implementation of stage 1 zoning had an appeals process where approximately 150
persons from 944 businesses indicated they had issues to be considered and were possibly
being impacted in some way. Approximately 33% indicated economic impacts from the
policy change, 41% indicated it was restricting their fishing operation and 26% of appeals had
general disagreement with the policy.
Table G18 reports the number of total fishing businesses which want greater access to
estuaries and the number of applications approved to fish in estuaries beyond their primary
region. The extent of impact is indicated by Total Fishing Businesses (TFBs) rejected (17),
and in the type 4 category of applicant who wished to change region and apply for additional
estuary access (43 in total). For example, in region 6 under stage one of zoning there are
numerous fishers who wish to traverse to lakes in region 7, 19 being approved to do so under
stage 1. The second stage of zoning will lead to assessed criteria being applied, at which time
the 67 business approved to fish in other zones may be reduced.
Table G18: Results of the stage 1 zoning appeals process by NSWF (Source: NSWF).
Zones TFBs /region TFBs wanting TFBs approved TFBs rejected Type 4’sgreater access
1 72 7 4 3 22 158 7 7 0 03 106 7 7 0 24 302 19 13 6 85 123 13 13 0 36 126 26 19 7 287 59 5 4 1 0
943 84 67 17 43Key: TFB- Total Fishing Businesses

Economic Issues: Estuary General FMS Dominion Consulting Pty Ltd
43
The FMS changes will restrict the movement and hence impact the fishing operations of
between 17 and 43 fishing businesses. The economic impact will require adjustment of
fishing practices if entry to a second region has not been approved. The most impacted
regions will be fishers in regions 4, 5 and 6.
The impacts of zoning will be immediate and ongoing through stage 1 and stage 2. Mitigation
has been made already through the appeals process for fishers to nominate for permission to
fish in an adjacent zone. There may need to be specific area adjustments in zone 6 given the
multiple region behaviour of numerous fishers in that area. Such concessions may be short
lived as stage 2 of the zoning will be implemented in the future.
The costs of the policy change will be borne by fishers who travelled previously. There is
insufficient information to estimate a monetary value, but the cost will be some portion of
business revenue, presumed to be less than 50% of revenue, for between 17 and 41 fishers.
The benefits are a likely reduction in local conflict, an increase in regional stewardship and in
the ability to contain effort levels across the state through each zone. Costs and benefits
cannot readily be evaluated in dollar terms, but the long term benefit to the whole EG fishery
is presumed to outweigh the short term cost on impacted fishers under the FMS.
Zoning of commercial operators will have benefits for other sectors, such as recreationalists
due to less conflict and more cohesion in commercial harvesting in each zone. This gives the
potential for uniform weekend closures to be implemented among commercial fishers, with
benefits to other interested groups in the community.
2) Economic assessment of hauling net regulations (FMS response 1.1e)
Hauling in certain major estuaries can use nets up to 1,000m in length. Six estuaries (St.
George, Lake Illawarra, Botany Bay, Lake Macquarie, Tuggerah Lakes and Wallis Lakes)
have 1,000m haul nets and 7 estuaries have 725m haul nets also. The reduction of hauling
nets from 1,000m and 725m to 500m in estuaries under the FMS will alter fish hauling
operations, with a restriction of one shot per hauling crew per day.

Economic Issues: Estuary General FMS Dominion Consulting Pty Ltd
44
Discussions with industry suggest a reduction from a 1,000m net to a 725m net would lead to
a greater than 25% reduction in catch revenue, and the reduction of 1,000m and 725m haul
nets to 500m may reduce gross revenue by 33%-50%, though this depends on the fishing area.
The reduction to 500m would raise issues of economic viability for fishers using larger scale
hauling nets. This is estimated to be between 20 and 30 fishers. The regulation may have
indirect impacts with the downsized nets now having to compete with existing 450m haul net
operators. This would alter the economic viability of operators who based business operations
on the advantages given by use of a larger net.
The costs to an operators for a typical larger scale hauling operation which grosses revenue of
$120,000 per year (source: NSWF/Sydney index - sample of 5 potentially impacted haul net
fishers) would be a reduction of between $30,000 and $60,000 per fishing operation (25%-
50% of average gross revenue). This impact would require significant adjustment in the
operations of fishers.
The policy benefits would be to reduce the catch and hence potentially increase the fish
stocks, which is difficult to value in monetary terms. There is insufficient information to
appraise these benefits and there are doubts in industry that they are tangible (pers. comm.,
EGMAC).
Other smaller haul netters may increase catches in the wake of the policy changes. If this is
the case, concerns about hauling causing of environmental damage and taking excessive
numbers of fish may not be allayed among recreational and community members. These
benefits are impossible to quantify and are presumed by the FMS to exceed the financial loss
to the impacted fishers. Potentially impacted fishers believe they will be financially
disadvantaged by the policy (pers. comm., EG MAC). Reduction in the size of large hauling
nets is perceived as benefiting both the commercial fishery and recreational fishery, as more
of the larger fish targeted by the 1,000m net may end up remaining in the fish population.
The change in hauling nets from 1,000m and 725m to 500m could be mitigated by the
reduction being to 725m and then appraising the outcome of such a change. Some industry
members consider the reduction to 500m to be more than required to address management or
community concerns (pers. comm., EG MAC).

Economic Issues: Estuary General FMS Dominion Consulting Pty Ltd
45
3) Minimum shareholdings and effort adjustment (FMS response 2.3b)
The FMS response 2.3b is to “Establish minimum entry requirements for new entrants at the
fishing business level (taking account entitlements held in other fisheries) to prevent increases
in effort by small businesses” (FMS, 2.3(b)). FMS response 5.2(a) is to “use minimum
shareholding provisions, either as a trigger point response or in accordance with the share
management plan, to adjust the number of estuary general fishing businesses to a level which
improves the economic viability of the fishery and its participants” (FMS, 5.2(a)). As
indicated in the FMS “it is the governments intention to create a full time professional fishing
industry” (2.3(b)). These responses have implications for economic viability and the access of
EG fishers.
Active effort can be measured on the broad level when a fisher submits catch returns in one
month of the year to the fisheries department. In contrast latent effort is when no catch
returns are submitted to the Department as no fishing has taken place.
Addressing active and latent effort through endorsements will involve the use of category 2
share management under the FMS. There is no evidence in the FMS of economic evaluation
of alternatives to this proposed policy, such as cancellation of latent endorsements or other
alternatives. The economic effects of category 2 share management have not been previously
been analysed.
The category II share management scheme allocates shares in access, (on a basis yet
undecided) enabling shares to replace the restricted fishery endorsement scheme and to be
traded. The rights characteristics of the endorsement have been augmented, by the increased
divisibility and duration of the shares, and increasing the transferability which enables parts of
endorsements to be traded. The category 2 share proposed in the FMS is a share of access to
each endorsement type and is different to a share of catch as in the existing category 1 share
management fisheries (eg. Abalone, Rock Lobster). It is not currently proposed to use
category 2 shares as a direct control on effort levels as the share defines general access, rather
than an effort quota. The category 2 share will enable effort at the endorsement number level
to be addressed, while a suite of existing regulations such as gear, area and time restrictions,
seasonality of fish availability, and economic viability, all contain effort.

Economic Issues: Estuary General FMS Dominion Consulting Pty Ltd
46
The use of the minimum shareholding provision at the business and endorsement level is to
contain effort by operators having to hold a minimum number of shares, buying shares from
other fishers.
The trading process is envisaged as adding value to the shares through time, though this has
not been tested. Unlike an effort or catch quota, the shares may not be sufficiently binding on
individual producer behaviour to produce rises in share value.
Minimum shareholding limits for business endorsements and regions that increase over time,
means that some businesses will decide to sell and exit the industry, and the share holdings
will aggregate in each fishery. A minimum shareholding would impact on part time fishers
forcing them trade up, or to exit parts of the fishery, or the industry with a payment from sale
of shares. A total minimum share holding provision is proposed for new entrants to prevent
small or part time businesses from being purchased and worked at higher than historic levels
of effort.
Impacts
Since 1994 entrants to the NSW fishing industry have needed to buy a Recognised Fishing
Operation (RFO) which is a business which qualified through the 1986-90 and 1991-93 catch
history qualifying period. The qualification level was $10,000 of fish or 5 tonnes in any 2 of
the former qualifying years, and any 1 of the latter qualifying years.
In the past few years an entrant must buy an RFO as opposed to a Fishing Operation (FO) to
enter the NSW fishing industry. Consolidation through time has been achieved through the
RFO policy (Murphy, 1999). The intention is to roll the RFO requirement into the share
system with a minimum shareholding across fishery entitlements held by a business. Given
industry restructuring, the proportion of RFOs to FOs has been increasing since the
introduction of the policy. Murphy (1999), illustrates that the adjustment has been impacting
small businesses grossing below $30,000 per annum, more than larger businesses.
In 1990, there were approximately 2,400 licences and this had reduced to 1,650 businesses in
2001. This represents a rate of decline of 68 licences/businesses per year over the 1990-2001
period or a total decline of 31% in 11 years, approximately 3% per year. The intention of the
minimum shareholding scheme is to continue this rate of reduction of business numbers in the
next 5 years, making a decline of 15% leading to 1,400 fishing businesses state-wide by 2006.

Economic Issues: Estuary General FMS Dominion Consulting Pty Ltd
47
A 3% annual rate of reduction in business numbers will form the basis for assessing economic
impacts. In Estuary General this would translate from 944 businesses in 2001, to 802 by 2006.
If the reduction in business numbers were uniform across the EG the impact in each region is
reported in Table G19.
Table G19: Envisaged impact of continued adjustment of business numbers in the EG fisheryin the 2001-2006 period at 3% per annum –ie. 15% (Source: NSWF).
Zones Total FBs per region Estimated FB No.s (2006) Reduction in FBs 1 72 61 11 2 158 134 24 3 106 90 16 4 302 257 45 5 123 105 18 6 126 107 19 7 59 50 9
944 802 141Key: FB= Fishing business
This would require a downward adjustment of 141 businesses from the EG fishery in the
2001-2006 period.
The economic impact under a share trading scheme depends on the method of share
allocation. If shares were allocated at 100 per endorsement, then fishers face having to gain
15% more shares in the 2001-2006 period to stay in the fishery. This would equate to the cost
of 15% of the market value of 100 EG business shares, presumably the value of an existing
EG fishing business.
Assessment scenario 1 –envisaging potential impacts of share management
A reduction of 15% of businesses in 5 years is estimated to equate to 15% of the value of an
EG fishing business that exits. The value of small EG businesses most likely to exit may be
between $15,000 to $30,000. Remaining businesses would have to buy 15% of shares in 5
years. This equates to $2,250 to $4,500 per fishing business left in the fishery, or $500-
$1,000 per year to remain in the fishery in addition to new management fees.
The economic survey suggests that this sum plus new management changes would increase
the fixed costs of operation in the fishery and adversely impact many small operators. Given
the degree of latent effort holdings and number of fishers grossing less than $10,000 per year,
the fixed costs of remaining in the fishery could lead to more than 15% of fishers being
willing to sell shares. The cost of share purchase could be borne by more viable businesses,

Economic Issues: Estuary General FMS Dominion Consulting Pty Ltd
48
but for the 80% of less economically viable businesses, there may be an incentive to increase
effort to cover the new costs of share purchase and higher management charges. It is essential
to monitor latent effort activation and rises in historic effort levels as recommended by the
strategy. An appraisal of the latent effort and its potential impact on the FMS is presented in
Appendix 1.
The move to category 2 share management and minimum business shareholdings would
change allocations within the commercial sector substantially. It is difficult to predict share
trading patterns, but the economic and social impact is likely to be higher on fishers with low
levels of catch and businesses which constitute latent effort, or older fishers. The social
impacts are evaluated in section H.
Cost and benefits
Estimated costs and benefits indicate that 944 businesses will reduce to 802 in five years with
142 businesses exiting. The total cost to those remaining is 142 businesses * the cost of an
EG fishing business ($15-$30k), estimated at between $2.1m-$4.2m over 5 years of the FMS.
The benefits are increased share value reflecting improved management and stock conditions,
and improved efficiency through businesses trading access shares and altering operations.
There is insufficient information to estimate this reliably, though the FMS presumes these
benefits to be higher.
Benefits to other sectors come from rationalisation of fishing capacity in the commercial
sector, though there may be no direct increases in available catch for recreationalists.
Community benefit is through more control of the effort levels in the commercial fishery.
4) Active effort and minimum shareholdings (FMS response 2.2a)
Active fishing effort is not to exceed “historic levels” and containment of “latent effort” is
also a priority. The FMS aims to prevent the activation of latent effort by new entrants
(objective 2.3), and latent effort is described in Appendix 1. For managing the minimum
shareholdings at the endorsement and business level (responses 2.2b and 2.3b) the degree of
impact on the fishing industry would depend on the allocation of shares, the level of the
minimum shareholding, and the time available to meet the minimum shareholding criteria.

Economic Issues: Estuary General FMS Dominion Consulting Pty Ltd
49
For example: If allocation of shares are 100 per endorsement and a minimum shareholding of
120 is envisaged after 4 years of the strategy, the impacts would be different than an
allocation based on catch history which gives fishers up to 100 shares. This basis of share
allocation needs to be modelled and discussed with industry. The allocation method is yet to
be decided.
The minimum shareholding level is set in relation to the degree of endorsement adjustment
required in the fishery. This is related to current fishing behaviour as described below.
• There were 1,003 endorsed file numbers in EG in May 2001;• There were 623 active file numbers fishing in 1999-2000;• Of these 90 had EG endorsements, but chose to fish elsewhere;• Of the remaining 533, 360 fished in EG only and 173 fished in EG plus other fisheries.
EG endorsements and minimum shareholdings
Controlling effort, contains catch from a region at sustainable levels. Managing effort by
endorsement numbers is one step removed from containing the number of days fished.
In managing effort at the aggregate endorsement level we assume that the relationship is
straight line and thus a 10% rise (fall) in endorsement numbers implicitly assumes a 10% rise
(fall) in effort. However, the top 10% of endorsements by number produce 27% of fishery
wide effort measured by days fished and the bottom 40% per cent of endorsements produce
10% of effort measured in days. Given the relationship between fisher numbers and effort, a
10% fall in endorsement numbers could only represent a 2.5% fall in real effort. As reported
in Figure G8.

Economic Issues: Estuary General FMS Dominion Consulting Pty Ltd
50
Figure G8: Cumulative effort (days) and cumulative number of fishers in the EG fishery(1999-2000).
Table G20a reports the number of specific EG endorsements in each region averaged for the
years 1997-2000. The impact of minimum shareholdings is predicted by examining a 15%
reduction in endorsement numbers in each endorsement type in the next five years of the plan
as reported in Table G20b.
Table G20a: EG endorsement numbers by zone as of 2001 (Source: NSWF).Zones
Method 1 2 3 4 5 6 7 Total
Crab trap 22 59 68 119 20 4 4 296Eel trap 8 46 36 66 20 28 22 226Fish trap 5 23 48 120 49 6 9 260Hand gathering 29 4 29 40 2 15 5 124Handlining & HC 58 152 96 300 116 96 62 880Hauling Cat. 1 12 25 11 77 36 28 14 203Hauling Cat. 2 11 32 26 77 17 32 15 210Meshing 54 119 81 264 95 89 53 755Prawning 31 109 47 241 12 77 49 566
Total 230 569 442 1304 367 375 233 3520
1% 2%5%
10%
17%
27%
38%
53%
73%
100%
0%
10%
20%
30%
40%
50%
60%
70%
80%
90%
100%
10% 20% 30% 40% 50% 60% 70% 80% 90% 100%
Cum % of fishers
Cu
m %
of
effo
rt

Economic Issues: Estuary General FMS Dominion Consulting Pty Ltd
51
Table G20b: Reductions in endorsement numbers assuming a 15% reduction over the 2001-2006 period. 15% of endorsement numbers Zones
1 2 3 4 5 6 7 TotalCrab trap 3 9 10 18 3 1 1 44Eel trap 1 7 5 10 3 4 3 34Fish trap 1 3 7 18 7 1 1 39Hand gathering 4 1 4 6 0 2 1 19Handlining & HC 9 23 14 45 17 14 9 132Hauling Cat. 1 2 4 2 12 5 4 2 30Hauling Cat. 2 2 5 4 12 3 5 2 32Meshing 8 18 12 40 14 13 8 113Prawning 5 16 7 36 2 12 7 85
Total 35 85 66 196 55 56 35 528
The impacts of trading in endorsements are reviewed in Assessment scenario 2 below.
Assessment scenario 2 – estimate only for envisaging potential impacts
A reduction of 15% of endorsement numbers in a region in 5 years is predicted to equate to
15% of the value of an EG method endorsement share. The value of a method specific
endorsement is marginal usually being sold as part of a business. They also come as part of
mixed packages complicating the estimation of a potential method endorsement share price
(NMB, pers. comm.).
The value of a crab method share endorsement may be between $5,000 to $8,000 (estimate
only). Those endorsement holders remaining in the fishery would have to buy 15% of shares
in 5 years. This might equate to between $750 to $1,200 per fishing business left in the
fishery, or about $150- $240 per year to remain in the crab fishery under new share
arrangements. As each fisher may have several endorsements the annual cost would be in
proportion to the number of endorsements operated by the fisher eg. Three endorsements
$450-$720 per year.
The benefits will be an increase in share value through more defined ownership. Regional
arrangements should ensure that historic effort levels among fishers are monitored.
The predicted adjustment of endorsements assumes that the adjustment is equal regionally
which is unlikely to be the case. Minimum shareholdings on a regional basis would assist in
reducing endorsement numbers, and effort, providing latent effort is not activated.

Economic Issues: Estuary General FMS Dominion Consulting Pty Ltd
52
For adjustment at both business and endorsement level through share trading it is likely that
several groups of endorsement holders will be more likely to sell shares.
Share purchase costs and management fees would make part time operations and businesses
with low catches more likely to sell. Latent effort fishers with shares and perhaps elderly
fishers, who do not see a future in the fishery, may be more likely to sell shares and exit the
fishery.
Table G20a and b indicated 528 endorsements from a total of 3,520 would transfer in 5 years
of the share system. This is estimated to translate to approximately 150 businesses leaving the
industry. The regional impact is illustrated in Table G20b and is 15% in each area by
assumption, but is unpredictable due to range of factors, the main being the response of
fishers which will likely differ between zones and endorsement method types.
Costs and benefits
The costs of adjusting through minimum shareholdings are difficult estimate and require a
separate adjustment modeling study. Each endorsement has a marginal value which has not
previously been estimated.
The benefits will be an increase in endorsement share value, local stewardship, reduced
capacity and increasing the likelihood of increased stocks in the longer term. There may well
be cumulative impacts coming from application of minimum shareholdings at both business
and endorsement levels and from interactions from FMS plans by other fisheries in which
businesses have an interest. The cumulative impact may be significant.
Benefits to other community sectors are in having a more rationalised industry with local
control, accountability and stewardship through increased access ownership. The introduction
of shareholdings and minimum shareholding provisions will benefit recreational fishers and
community as commercial fishery effort levels are contained and commercial fishing
operation numbers are reduced through time.
Voluntary adjustment or buyback schemes can assist with fishing industry restructure. The
developing Recreational Fishing Area (RFA) process will involve the adjustment of the
commercial fishing businesses, but the extent of adjustment from this source is not yet
apparent and will only be known after this EIS is finalised.

Economic Issues: Estuary General FMS Dominion Consulting Pty Ltd
53
Managers are hoping to contain latent effort while applying the envisaged minimum
shareholding provisions to cap active effort. The use of funds in the concurrent RFA process
will assist in mitigation of financial impacts of commercial fishing adjustment. The basis of
allocation of shares may also be mitigated, by using alternative allocation methods.
The response of fishers is difficult to predict. Business owners with latent endorsements, may
be willing to sell, the supply of shares potentially exceeding demand, leading to both
reductions in price and a lack of trading in the share market. This should be monitored. Part
of mitigation, would be a closer examination of the share system allocation and associated
economic valuation issues to make sure it achieves the desires of the FMS after
implementation. This requires a state-wide modelling exercise across all administered
fisheries.
5) Other low impacting measures
There are a series of less significant economic impacts from changes to net sizes/gear, small
scale sectoral allocation issues, such as crab trapping. Optimising economic return is noted as
an objective of prawn and finfish management and codes of conduct are recommended to
improve added value through icing practices and safe food marketing.
Owner operators are to be preferred to nominated fishers. No new nominations will be
accepted and the issue which led to entities having to nominate a “real person” would be
altered with minimal economic impacts.
Impacts of changes to net mesh sizes and phasing out of 80 mm winter set mesh nets, restricts
access at the gear level, with the intention of improving future fish stock levels with long term
economic benefits. This may potentially increase endorsement share values, though there is
insufficient available data and experimental evidence to empirically appraise the changes. A
change to 95mm mesh will reduce catches of valuable legal size bream in the short term, thus
reducing viability but the reduction in bycatch of undersize fish will lead to better yields once
those fish grow to the selectivity size of the net. Fish market supplies may be reduced in the
short term.

Economic Issues: Estuary General FMS Dominion Consulting Pty Ltd
54
Closures are proposed to improve fish size and optimise economic returns. Minimum fish
size lengths may reduce number of fish caught in the short term. Harvesting strategies based
on optimal size may also change fisher access in order to improve economic outcomes. In the
case of prawns this would need to be modelled in a regional context.
Moving the crab trap fishery to a tradeable share management would alter access and increase
crab share value due under a more accountable management regime.
The EG FMS could potentially be affected by some market trends. The trend in the face of
static catch per unit effort and limited potential for increasing catches is to “add value”
through more selective capture methods, processing and icing practices in order to gain
improvements in price (Ruello and Associates, 2000; SFM, 2000).
A code of conduct for improving icing practices is advocated under the FMS (1.2c). There are
cost and incentive issues for some fishers in using more ice as the marketing system does not
necessarily reward the additional expenditure (Ruello and Associates, pers. comm.). The
adoption of safe food practices seeks to address such issues by having minimum standards in
fish handling and icing (Safe Food, 2001). Meeting new food handling health requirements is
a cost for fishers as payments for audits and annual certification are required (Safe Food,
2001) required. This may be a cost to fishers with no immediate return from the market
(Ruello and Associates, pers. comm.).
The cost implications of food safety may impact small businesses and part time fishers to a
greater extent than full time businesses given their implications of fees and the fixed costs of
additional hygiene equipment. However these changes are not directly attributable to the FMS
being driven by hygiene laws and standards for safe food production.
There may also be a concern of a reduced fish supply to the community from the FMS.
Technical gear restrictions may alter fish supply in the short terms through gear regulations.
Adjustment through the share system should keep the level of fish supply within historical
levels. The impact of the recreational fishing area process is unknown and is not part of the
FMS assessment.

Economic Issues: Estuary General FMS Dominion Consulting Pty Ltd
55
6) Costs and benefits of the FMS
The economics of fisheries management enables an appraisal to be made of the economic
contribution of the fishery to the economy and to analyse the impact of the changes advocated
in the FMS. ESD principles dictate that resources should be valued at their market values and
that subsidies should be taken into account in the form of an environmental management cost
accounting statement, as illustrated below in Box G2 for the EG FMS (NSW Government,
1997).
Under the FMS the costs of management will be increased with new costs to commercial
fishers as reported in Box G2b.
Box G2a: A Management Cost Account for the EG FMS.
For the EG fishery per annum: Year 2001-02 Year 2006-07 Year 2008-09
Gross revenue from catch (i) 20.9m 24.0m 25.5m
Less:
economic cost (of effort)(ii) 24.84m 23.6m 23.1m
Costs of share purchase (iii) 0 0.9m 1.0m
Management charges to industry (iv) 0.46m 0.46m 1.9m
Additional cost of FMS (v) 0 0.76m 0.76m
Operational Economic surplus -4.4m -1.72m -1.26m
less cost subsidies (vi) 1.43m 1.43m 0.0m
Plus rise or fall in fish stocks (vii) 0m 0m 0m
Total economic contribution -5.83m -3.15m -1.26m
(i) This revenue of catch from fishing in the EG (see Box G1) rising at 3% per annum due to cpi.
(ii) Total costs of fishing less management charges currently paid by industry ($25.3m less $0.46m = $24.84m).
Total cost of effort to rise by 3% pa, business numbers reduce by 3% per annum and there is a cost reduction of
1% per year due to efficiency gains from restructuring reducing the cost of effort to take the same catch.
(iii) Share purchase costs in 2002-03 are 944 businesses* estimates of ($500p.a. business share purchase +
$450p.a. endorsement) = $0.9m per annum in share purchase costs to industry. Note these costs are minimal.
Business numbers fall to 800 by 2006-07 with share expenditure per operator rising.
(iv) Costs of management not attributed to fishers under current cost policy are added.
(v) New FMS charges: based on 944 businesses *$800 each (could be less than this), becoming 800 businesses
by 2006-7 ($944 each) = Total $0.76m

Economic Issues: Estuary General FMS Dominion Consulting Pty Ltd
56
(vi) Subsidised costs of management (ie. management, research, compliance, consulting studies etc). The
current commitment of government is to maintain this at $1.43m for existing service with the intention to
industry paying full cost recovery by 2008-09. Generic subsidies to industry from fuel rebates are not included.
(vii) The change in the value of fish stocks are unknown and a methodology of incorporating these needs to be
developed.
Box G2b: Costs per fisher – 2001 to 2006 under the new FMS.
For the EG fishery per annum: Year 2001-02 Year 2002-03 Year 2006-07
Management charges (i) 635 635 750
FRCAC/EIS (ii) 230 230 0
FRDC (iii) 115 115 115
New FMS charges (iii) &(iv) 0 800 944
Share rental (iii) 0 100 100
Share purchase (v) 0 950 1,250
Total costs per fisher $970 $2,830 $3,159
(i) Costs per fisher are $0.6m/944 =$635. By 2006-07 $0.6m/800=$750. (ii) FRCAC expenses are $150 and EIS
$80 per fisher in first 3 year only. (iii) c.p.i. is not included. (iv) New FMS charges are based on 944 business
*$800 each becoming 800 businesses by 2006-07 * $944 each. (v) These costs are minimum estimates and may
be double this, making the total to fishers $3,780 and $4,409 per annum.
The cost per fisher rises to $2,830 per fisher in year 2002-03 and is $3,159 by 2006-07. In the
post 2006-07 period the intention is to change the basis of charges, relating management
charges to business shareholdings. It is not yet possible to accurately model this.
The FMS response 5.2(b) and (c) seeks to develop “a performance measure for economic
viability of the individual business” and “…a cost recover framework…” FMS 5.2(c) by
2006. The intention of the FMS is to move towards making the EG fishery more economically
viable by the end of 5 years (2006-07). Full management cost recovery will be implemented
by 2008-09.
The intention of the FMS would be to return the fishery to an economic surplus, though in
Box G2a in year 2008-09 the fishery is in a net deficit position, which is preferable in
comparison to the current situation. The account shows the need to accurately determine
economic profitability from operations, which will vary from year to year as stock availability
fluctuates.

Economic Issues: Estuary General FMS Dominion Consulting Pty Ltd
57
The analysis here assumes the FMS can deliver the envisaged economic outcomes in the time
available. This remains to be seen, as category 2 share management is new and is based on
access shares which are neither binding on effort, or catch levels. The share management
scheme needs an investigation of its effectiveness on implementation. Mitigation may involve
moving to a limit on effort, if effort levels are not sufficiently contained by the FMS. The
current data on costs and benefits are approximations and elements such as the increase or
decrease in the value of stocks, require further research, a gap identified by this study.
Multipliers
Commercial fishers will be most impacted by the FMS, particularly through the
implementation of minimum shareholdings at the business and endorsement level. In share
trading to meet minimum shareholding requirements, some fishers may exit due to being
latent effort or having low catch in the EG. Other fishers with high opportunity costs may
take the opportunity to exit the industry and work somewhere else. The increased fixed costs
of management fees and costs to buy shares are likely to impact part time operations and
latent effort endorsement holders more than larger fishing operations. Fishers representing
latent effort, small low catching businesses and perhaps elderly fishers who do not see a
future in the industry are more likely to sell shares and exit the fishery.
The assessment of the impact of minimum shareholdings on business numbers estimated a
reduction of 944 to 802 businesses in the 2001-2006 period. Table G21 indicated 528
endorsements from a total of 3,520 would transfer in 5 years of the share system. This may
translate to approximately 150 businesses leaving the industry. It is not clear to what extent
these will have cumulative impacts (Thomas, 1998) as the business adjustment, may naturally
include endorsement adjustments. The regional impact will depend on fisher’s responses to
keeping or selling shareholdings.
Multiplier effects from the adjustment will be low for two reasons. Fishers who are latent
effort and those who catch little, contribute least to output in the industry and thus generate a
small proportion of any multipliers.
Secondly, where consideration is given to a decrease in commercial fishing, it is unlikely that
the multipliers as described in section (g) of this Chapter will apply (Dr Roy Powell, pers.
comm.). Those multipliers apply where the previously employed resources all leave the local

Economic Issues: Estuary General FMS Dominion Consulting Pty Ltd
58
area: a situation that is not likely to occur. The size of the multiplier effects will be smaller
because many resources remain in the local area and continue to generate economic impacts.
For example, many of those previously employed will remain taking alternative employment,
will receive payment from sale of shares (or adjustment assistance), or move to social welfare
programs. Thus, the consumption-induced effects will be limited to the difference between
pre and post event income levels. Likewise, any production impacts will reflect the
possibility of the resources switching to other activities (eg. boats switching into
tourist/recreations uses, transport capacity being used in other industries etc.) Thus, these
effects will reflect the capacity of the local area to enable a switch of resources to other
industries (Dr Roy Powell, pers. comm.).
With shareholding provisions exiting fishers will sell shares and receive payment at market
rates. The remaining fishers face increased debt to stay in the fishery and have a range of
abilities to meet that debt. It is likely that effort levels may increase to pay the debt incurred,
particularly if minimum shareholdings are increased rapidly or by significant amounts.
The FMS will have few implications for multiplier effects for recreational fishers and the
community. Mitigation of conflict is a significant issue under the FMS and also due to the
current Recreational Fishing Area process which will increase the area access for recreational
fishers at the cost of commercial fisher access. The mitigation required under the FMS may
be to evaluate the reduction in conflict in the wake of the RFA process and be able to move
forward under an FMS with strategies in place to address recreational and commercial fisher
conflict. These may need to be generated after the first round of RFA adjustments have taken
place.
(iii) Predict the likely economic implication of maintaining present resource allocation rules,
compared to likely economic implications of implementing the strategy or feasible option in
resource allocation
Currently the number of fishing businesses and fishing endorsements across the NSW fishing
industry are greater than desirable for long term economic viability and sustainability. Both
vessel capacity and unregulated effort levels are much greater than required to take historic
catch levels. This is evident in the significant amount of latent effort among EG fishing

Economic Issues: Estuary General FMS Dominion Consulting Pty Ltd
59
businesses. Reducing and controlling fishery effort is most readily achieved by controlling
business numbers, endorsement numbers and fishing capacity, at a regional level.
Under the present resource allocation rules the mechanisms to reduce endorsement numbers
are limited and rights are less divisible than under the proposed category 2 access shares. This
means there is currently less ability for the industry to adjust than under the proposals in the
FMS. The linking of access shares to regions enables fisher numbers, access and effort to be
discussed, enabling communities to be constructively involved.
The use of shares and minimum shareholdings at the business level will link fishing business
capacity to fishing effort in a given region. This would likely lead to aggregation of business
numbers, in a way similar to the aggregation of fishing businesses seen in the years
subsequent to the introduction of Registered Fishing Operations (RFOs). Fishers entering the
fishery will be required to purchase RFOs and it is likely that those fishers with fishing
operations (FOs) will sell in response to the minimum shareholding provision being
introduced.
Shares are a more flexible trading structure which will allow fishers to change their business
structure with the least financial impact. Fishers may sell shares in endorsement types used
little or not at all, and use that money to purchase shares in the fisheries or subsets of fisheries
which are important economically to the business. The pathway to adjustment will depend on
the envisaged rates of minimum shareholding, the perceived value of the shares and the
amount of latent effort which is activated by the new right to sell.
The current regime enables fishers to move between zones leading to conflict between fishers
and less incentive to manage their primary zone. Lack of alignment between fishers and the
potential to manage their local resource can be overcome through zoning to get more co-
ordination between commercial fishers and responsible fishing in their primary zone. This
move to regional management of effort and fishers will enable communities to be
constructively involved in local fishery management and more responsible fishing.
The adoption of further gear controls, fish size limits and moves towards determining optimal
harvesting regimes for finfish and prawns, have more potential economic benefits than under
current resource allocation rules.

Economic Issues: Estuary General FMS Dominion Consulting Pty Ltd
60
(iv) Justify the preferred approach in terms of ESD principles
The ESD principles for economic assessment are presented in NSW Government (1997;
annex 5) and are the precautionary principle, intergenerational equity, biodiversity principle
and the valuation principle.
The preferred approach seeks to contain latent effort and improve viability of business
operations through adjustment of active effort by category 2 share management. The strategy
uses the zoning in the EG fishery, while realising that ultimately the total effort in the industry
requires adjustment at the fishery business level. This suite of measures holds with the
objectives of ESD, potentially improving the fishery for future generations (intergenerational
equity) by making adjustments now, so as the future can be improved.
The move to share management also is an improvement of the valuation of the resource in the
management measures and moves towards being able to price environmental resources within
a management system (valuation principle). Under the strategies fishers are also payi ng for
goods and servi ces and the higher changes wi ll act as an incent ive t o reduce ef for t in the fishery,
enabling environment al goals to be pursued i n t he most cost eff ect ive way.
This al so includes a more tr anspar ent incorporation of the economi cs of the management of the
fi shery, incorporati ng subsi dies and a proposed pathway towards full cost recovery and
envi ronmental accounting.
Managem ent at the regional level is consistent with ESD in that the link between fishers and
the resource is more defined potentially leading to improved stewardship among fishers. The
current regime enables fishers to move between zones leading to conflict between fishers and
giving less incentive to fishers to practice responsible fishing in their primary zone, than
under the FMS. This move to regional management of effort and fishers will enable
communities to be constructively involved in local fishery management and in more
responsible fishery management.
Shares are a more flexible trading structure which will allow fishers to change their business
structure with the least financial impact. Fishers may sell shares in endorsement types used
little or not at all, and use that money to purchase shares in the fisheries or subsets of fisheries
which are important economically to the business. The pathway to adjustment will depend on

Economic Issues: Estuary General FMS Dominion Consulting Pty Ltd
61
the envisaged rates of minimum shareholding, the perceived value of the shares and the
amount of latent effort. The adjustment of industry capacity through category 2 share
management may run the risk of activating latent effort and increasing effort on the fish stock
to pay new costs. In this element the FMS is precautionary in monitoring effort levels, but
may be vulnerable to rapid changes in industry behaviour at the on set of share trading.
The FMS is a first step in the assessment process and it is a move towards an improved
culture in which the impacts of the FMS are developed and appraised with the principles of
ESD in mind. The achievement of the goals can be monitored in this new process.
(3) Data requirements in relation to the assessment of the impacts on the economic
issues
(a) Provide reference to technical data and other information relied upon to assess impacts;
indicated its reliability and what uncertainties (if any) are associated with the use of the
data in the assessment of the FMS
The data used in the assessment is from several sources.
The catch and effort data is from NSW Fisheries and logbooks joined with NSW Fisheries
licensing data. Both districts and zones are used for spatial analysis and as districts are less
aggregated, there may be occasions that fishery activity in an estuary traverses two or more
zones. Effort data at the days fished level is complicated by the logbook system where
fishing three methods in one day is recorded as one day of effort against each of three
methods. This limits the potential for accurate production modelling or bio-economic
analysis.
A significant issue for fishers is the use of the Sydney index for price imputation on declared
catches. There are several cautionary notes in doing this. Some species such as squid may not
have a representative monthly average price. The imputed price will likely be a minimum
estimate of the price of species which are in demand.
For example, seafood such as larger fish and prawns, are unlikely to be sent to Sydney market
as local demand is strong at higher prices, without commission and freight (pers. comm., EG
MAC). In many cases, fishers in areas outside Sydney receive prices closer to Sydney retail

Economic Issues: Estuary General FMS Dominion Consulting Pty Ltd
62
levels for valuable species. Similarly fish which can achieve better prices through sashimi
grade handling and other techniques, may better the Sydney index. Prices for female mullet in
roe in the north of the state, may be several times the Sydney price on occasions.
In contrast, the estimate of price at first sale does not deduct between 11%-23% of gross
revenue for market, handling and freight expenses (source: RM-ES). A fisher adjacent to
Sydney, landing to the fish market and receiving average price, would actually receive the
Sydney index less 7%-9% marketing fees. The economic survey asked fishers to declare
gross revenue from catch in 1999-2000 and this was compared with the predicted Sydney
index for each fisher to see the inter relationship. The Sydney index may under estimate
actual prices in EG businesses by between 12% and 21% (Source: RM-ES).
There are also uncertainties in the value of EG businesses and endorsement values. Diversity
among business packages mean the true value of access is difficult to determine. The move to
share management will require examination of the structure of business and endorsement
values.
(b) Identify where there are gaps in knowledge important for the assessment of the impacts of
the fishery
Several gaps are apparent. The major one is the lack of an industry wide profile of the
seafood industry in NSW, including processing, wholesaling and the movements and values
of seafood in the marketing chain. This would enable an evaluation of the secondary stages
of the fish catch including processors, exports, imports and employment derived from the
NSW fish resource. It should extend to retailing also.
Economic multipliers could be estimated and contribute to future assessments. The regional
importance of the seafood industry in each zone could be evaluated. The Registered Fish
Receiver annual renewal forms could include more information on processing activity in
relation to the fisheries under management.
Several of the assessment issues involving fishing gear selection require fish length and price
relationships for micro evaluation of gear changes - costs and benefits. This requires
investigation of the finer scale data potentially available.

Economic Issues: Estuary General FMS Dominion Consulting Pty Ltd
63
Price information outside Sydney needs to be collected on a regional and fishery basis. This is
required as several of the future assessment issues such as the optimal harvesting time of
prawns will require bio-value models using biological and size and price information for
different prawn species during their estuary to sea migrations.
Economic viability is part of the objectives of the Fisheries Management Act (1994). Business
values, endorsement values and shares valuation is an area requiring more research. Similarly
longer term planning needs to be able to monitor the cost of operations and this could use
existing survey information to establish a representative “fishing cost index”. This would
monitor cost changes for producers and could parallel the Sydney price index for fish
revenues.
Category 2 share management is a new allocation mechanism and may not be sufficiently
binding on individual producer behaviour as it does not automatically limit effort or catch.
This scheme needs monitoring on implementation.
Economic inter-relationships between fishing communities and within the fishing industry has
been briefly addressed in the current social survey and could be augmented through time.
An environmental and management cost and benefit account system needs to be investigated,
relating value of the stocks to the fishery management regime.
(c) Detail a timetable for developing the data sets important for understanding longer term
resource issues.
Data needs can be addressed in the next five year period through development of a strategy
for improving the following data:
a) Investigation of available fish price data and the accuracy of the Sydney index. This would
include a direct comparison of Sydney and non-Sydney price differentials and comparisons of
domestic and export markets. Price data is required to monitor fishery value and modelling
resource management issues, such as maximising prawn or finfish bio-value through
alteration of harvesting regimes.

Economic Issues: Estuary General FMS Dominion Consulting Pty Ltd
64
b) Examination of the viability of businesses, business values, endorsement and share values
and the basis of share allocation prior to trading. Subsequently, monitoring of share values to
ensure industry viability and the achievement of the FMS objectives.
c) Surveying the economic performance category 2 share management and of businesses after
the implementation of the plan (year 1-2).
d) Consider developing a state-wide fishing industry economic restructuring model for
predicting and appraising fishing business adjustments across fishery administrative divides.
e) Revising the collection of catch and effort data to enable more sensible modelling of catch
per unit effort and productivity data. This would involve changing the fishery data logbook
system and needs to happen within five years in preparation for long term sustainability
issues, including economic modelling and monitoring.
f) Developing an economic profile of the regional fishing and seafood processing industry in
NSW. This could include marketing, economic infrastructure and regional benefits such as
multiplier effects. This needs to be progressed by area and in conjunction with social
community profiling as a basis for longer term planning.
g) Development of an environmental accounting approach to fishery management costs and
benefits should be undertaken in the next 3-5 years.

Economic Issues: Estuary General FMS Dominion Consulting Pty Ltd
65
Appendix 1a: What is the management issue with latent effort?
Current fishery endorsement capacity exceeds the level of effort applied to the fishery. This
leaves “latent effort” which is an administrative construct as described above.
For example, a firm may hold endorsements to fisheries A, B, C, and D, and currently be
fishing in fisheries A, B and C. Endorsement D is regarded as “latent effort” when appraising
fishery D, but fishery D is unlikely to be fished by the firm as it is currently fishing in fishery
A, B and C. Industry seeks the security of having fishery D as an option if some combination
of fisheries A, B and C has a poor period. While this option of sideways movement of effort
is desirable from the firm’s perspective, the potential influx of effort is deemed to be a
problem by managers observing effort levels in fishery D, who may be concerned about
sustainable levels of effort in that fishery.
Holding multiple endorsements, including endorsements for fisheries not currently exploited,
is a sensible diversification of risk on the part of the fishing firm. Although the vessel in the
above example is not exploiting fishery D, its D endorsement has an option value. It provides
the firm with some degree of income insurance if fisheries A, B or C experience a downturn
for any reason.
Latent effort is seen as a problem by administrators because of the size of the potential shifts
of effort among fisheries. Firstly, latent vessels have to have a reason to forgo their current
activity and enter the fishery. However with each vessel that shifts into fishery D, for
example, conditions may improve in fisheries A, B and C and deteriorate in D as a result of
the effort redistribution. In other words, there is a natural brake on the process, although shifts
in effort of this type are not directly managed or coordinated in any way.
Despite the above argument, if there is a very large amount of latent effort and a substantial
reason for it to be activated, enough effort could shift into fishery D to cause significant
effects on stock. This is the central concern of administrators with latent effort in developing
sustainable fishery management plans and is generally a low risk unless there are strong
economic signals, such as fish price increases, for latent effort to be activated. However
latent effort should also be attributed to the excessive number of fishing businesses in the
industry, not to the range of activities of each firm. An efficient policy response is to reduce
the number of businesses, while allowing each firm full opportunity to diversify its activities

Economic Issues: Estuary General FMS Dominion Consulting Pty Ltd
66
among fisheries. It is not desirable for a group of vessels being linked to a single
endorsement type in an ailing fishery, when other viable fishing opportunities exist, but may
be denied by the administrative system.
In summary, it is economically undesirable to limit directly the capacity of fishing businesses
to move between fisheries as this reduces the scope of the businesses and their security of
operation. However, if there is excess capacity there must be mechanisms to reduce total
effort across the industry, through a reduction in the number of businesses (Metzner and
Rawlinson, 1999).
Appendix 1b: Latent effort and the EG fishery
There is a large latent effort associated with the Estuary General fishery. The potential for
activation of latent effort by new entrants is governed by the natural economic brakes of
viability, being engaged in other fishing or work activities and the cost of fishing effort.
Potential activation of latent effort is also contained by a range of regulations in place which
control effort.
Under the FMS latent effort is to be contained. The removal of latent effort is not an explicit
strategy and would have serious ramifications for industry.
The activation and removal of latent effort (Source: NSWF).
We assume each file number is allocated 100 shares. This is an approximation to both
business and endorsement shareholding, giving the dimensions of the potential impact for
assessment purposes. The total number of shares stay in the fishery under each scenario in
Appendix Table G1. Scenario A envisages the removal of latent shareholdings over 5 years.
Scenario B, the removal of latent shareholdings and those shares held by fishers fishing else
where in 5 years. There are 380 fishers associated with latent endorsements and 90 fishing in
other fisheries.
The Index indicates how the fisher’s shareholding would increase relative to the base period
shareholding under each scenario. Scenario A would require a 61% increase in share
holdings and scenario B an 88% increase in shareholdings over five years. It is assumed that
effort has to stay within historical levels (response 2.2b) and that the latent effort is not
activated by new entrants (Obj. 2.3).

Economic Issues: Estuary General FMS Dominion Consulting Pty Ltd
67
This shows the need to prevent latent effort activation under the strategy. Failure to control
latent effort activation would impact on the adjustment of active effort under shareholding
strategies under responses 2.2b and 2.3b.
Appendix Table GA1: Two scenarios estimating the reduction of latent effort in the next 5
years through shares being transferred to remaining fishers (see text for explanation).
The removal of latent effort is estimated as costing each remaining shareholder 61% or 88%
of the value of 100 shares, approximately 61% to 88% of the value of an EG business. During
this process there is no guarantee that effort will keep within historic levels. In the FMS Part
4, there are performance indicators and trigger points to detect changes in catch, and these
will also need to include effort levels and measures to address and contain fishing effort.
Fishing effort would tend to increase to enable remaining fishers to fund the additional share
purchases in order to remain in the fishery.
In summary, Appendix Table G1 gives the dimensions of latent effort. Activation of latent
will encroach on the potential of the fisheries management strategy to address active effort
levels through strategies 2.2b and 2.3b.
Scenario A
2002 2003 2004 2005 2006 2007EG shares 100,300 100,300 100,300 100,300 100,300 100,300made up ofLatent 38,000 30,400 22,800 15,200 7,600 -Fished other 9,000 10,098 11,196 12,294 13,392 14,490Mixed fishing 17,300 19,410 21,521 23,631 25,742 27,852EG only 36,000 40,392 44,783 49,175 53,567 57,958
Index 1 1.12 1.24 1.37 1.49 1.61
Scenario B
2002 2003 2004 2005 2006 2007EG shares 100,300 100,300 100,300 100,300 100,300 100,300made up ofLatent 38,000 30,400 22,800 15,200 7,600 -Fished other 9,000 7,200 5,400 3,600 1,800 -Mixed fishing 17,300 20,351 23,402 26,453 29,504 32,555EG only 36,000 42,349 48,698 55,047 61,396 67,745
Index 1 1.18 1.35 1.53 1.71 1.88
Latent effort and fished other reduced to zero in 5 years
Latent effort reduced to zero in five years

Economic Issues: Estuary General FMS Dominion Consulting Pty Ltd
68
Appendix 2: The NSW fishery economic survey and the EG fishery
This appendix summarises the methods and results of an economic survey of operators in the
EG fishery. A state-wide economic survey was distributed by Roy Morgan Research Ltd
(Roy Morgan, 2001a) and analysed for the EG fishery as part of the current study. The
purpose of the survey was to determine the operational surplus of a range of fishing operators
in the EG fishery.
The resource rent is an economic surplus which is part of the difference between the Total
Revenue of effort and the Total Cost of effort across the fishery. Resource rent is made up of
different elements and is the surplus attributable to the marginal fisher’s last unit of effort,
times the units of effort applied to the fishery (Reid and Campbell, 1998). This reflects the
value of access to the resource. The balance of total rent and resource rent are intra-marginal
rents, attributable to the skills of fishers and reflect innovation and skills in a healthy industry.
Estimation of rent also requires incorporation of effort and species considerations and is made
more difficult by the multiple fishery behaviour of different fishers. Any profitability
estimates in fisheries need to be related to the resource through bio-economic modelling to
see if they are economically sustainable. This is not possible with information and data
currently available.
Fishing operator survey
Fishing businesses and owner operators act as firms fishing among the portfolio of
administered fisheries available to them. An economic survey can measure the performance
of the firm across all its fishing activities, but to gain a economic rate of return from a single
fishery is more difficult. We need to examine the scope of production of the firms, examining
the combinations of fisheries the firms access. An estimate of the returns from the estuary
general would be somewhat arbitrary, depending on the allocation of capital costs and catch
between fisheries.
The state-wide survey had 259 responses from 1,640 fishers contacted. In the EG fishery 147
of 674 active fishers responded (21.8%). The representativeness of the state-wide survey
response is reported is in Figure GA1 below. The sample of fishing businesses with EG

Economic Issues: Estuary General FMS Dominion Consulting Pty Ltd
69
fishing had a higher response rate and is proposed as being reasonably representative of
operators in the EG Fishery.
Appendix Figure GA1: The sample of fishers that responded to the NSW Economic survey,
presented against the estimated Sydney index revenue for fishers.
Sustainability and fishing firms
In the NSW fishing industry we have fishing businesses and fishers contracted to those
entities. The issues for sustainable management of the fishery resources is the overall level of
effort exerted by industry on the fishery resources in NSW, and the distribution of that effort
among the various fish stocks. Under current management measures, effort is contained by
regulations, endorsements, limits on fishing times, areas, gears and by the economics of
operations. We wish to find if it pays to go fishing. However, the ongoing containment of
effort requires a downward adjustment in the number of firms in the industry due to technical
advancement, and rises in costs of fishing operations (Metzner and Rawlinson, 1999).
Total effort in the industry can be reduced by direct retirement of fishing businesses where
money for voluntary adjustment is available, or by other industry self funded adjustment
arrangements. After adjustment, remaining businesses may have improved economic
performance for the same or less effort levels, due to more available catch being available in a
region, and experience less congestion and competition between fishing operations. In any
economically efficient change to the policy regime the winners’ gains exceed the losers’
losses, and a transfer payment may be possible through a levy on those fishers remaining. A
-
50,000
100,000
150,000
200,000
250,000
300,000
1 101 201 301 401 501 601 701 801 901 1001 1101
No of vessels
Revenue -$perannum
SPISurveyed SPI

Economic Issues: Estuary General FMS Dominion Consulting Pty Ltd
70
central issue is the exit decision of firms from the industry. Where a firm fishes one fishery,
this exit decision may be estimated more readily than if a firm has divided its fishing between
two or more administered fisheries.
Current fishery endorsement capacity exceeds the level of effort applied to the EG fishery.
This then leaves “latent effort” which is primarily an administrative construct (see Appendix
1), except where fishers are genuinely not able to fish their endorsement due to ill health as
previous discussed.
What should be the measure of economic health of the fishing industry?
A healthy fishing industry is one that derives enough sustainable revenue to cover its annual
operating, fixed and capital costs which are determined through survey methods. They include
wages, including an imputed wage to the owner/operator, running costs, maintenance and
repairs, insurance, and levies which reflect fishery management costs. Capital costs are harder
to measure, but in principle they represent the annual interest and depreciation on the vessel
and gear. Interest cost is the rate of return which the capital could earn in another use: it is
calculated as a percentage of the capital value where the percentage is the risk adjusted cost of
capital. Depreciation is an annual cost which recognises the finite life of a fishing vessel. In
principle, the annual depreciation compounded forward at the market rate of interest should
provide a sum large enough to replace the vessel at the end of its economic life.
There are three main measures of the value of the capital of a fishing firm. These are the value
of the vessel and gear:
• at historic cost – what was originally paid for the asset;
• at indemnity value –the insured value which is taken to be an estimate of current market
value; and
• at replacement cost – what a new vessel and gear would cost.
The replacement cost is the basis for measuring the long-run health of the industry. If firms
are able to earn the required risk adjusted rate of return and set aside sufficient funds to
purchase a new vessel when the existing vessel is fully depreciated, then it is viable in the
long-run. If revenue fell short of that amount then we would expect to see the market value of
vessels falling, and perhaps some highly geared firms having trouble meeting loan interest
and repayment schedules.

Economic Issues: Estuary General FMS Dominion Consulting Pty Ltd
71
An important proviso to the above discussion is that the calculations are based on sustainable
revenue. It is a characteristic of the fishing industry that when stock conditions are bad,
vessels are sometimes able to maintain their revenue to some extent by increasing effort;
surviving by running down a different form of capital -the fish stock.
Appraising economic viability
Fishing enterprise viability can be estimated through accounting data collected in a survey.
This gives an accounting view of a firm’s individual performance, but is not good for
measuring performance across different businesses in the fishing industry, or between
industries. Economists adjust accounting data to gain more useful industry economic
performance measures.
The residual of Total Revenue less Operating Costs is Operating Profit. Depreciation and the
opportunity cost of capital are deducted to give economic profit or loss (Campbell and
Nicholl, 1994). In the study a 7% opportunity cost of capital was included in economic costs
after ABARE, (2000) which is 3% less than applied in Reid and Campbell, (1998) and
Hassall and Associates (1999). Fisheries management charges and licence fees are included in
operational costs, even though they are not technically a factor of production being a transfer
payment from industry to government in respect of access and management services.
Labour costs are imputed from questions in the survey regarding days fished and unpaid days
worked by the fishers and his family in the fishing industry. Wages rates for non-managerial
private sector employment (trades and unskilled labour) were used to calculate an imputed
value of labour (ABS, 2001). The basis of imputation was for an annual average wage of
$34,320, ($660 per week) imputed on a daily basis. Imputation was made for paid an unpaid
days and at a lesser fractional rate for staff and family members.
The discounted annualised sum was calculated in respect of meeting the replacement cost of
the assets at the end of their lifespan from current income flows. The great variety in size and
ages of vessels and capital equipment in the EG fishery pose interesting questions in the
analysis. When capital is valued at its opportunity cost, some small scale fishing operations
with fully depreciated capital equipment lead to traditional measures of profitability, such as
return to capital, being less applicable than for an industrial fishing fleet. Rates of return may
be apparently high or low due to minimal apparent capital value.

Economic Issues: Estuary General FMS Dominion Consulting Pty Ltd
72
Estuary General profitability results(Note: this material is in draft form and is supplied under the normal caveat in respect of information supplied byfishers).
There were a total of 170 economic surveys from EG endorsement holders. Of this a
significant number had not earned revenue in the period and several were duplicate surveys.
The surveys were divided into three groups for analysis: EG fishing only; EG plus other
fisheries where gross revenue was > than $60,000 per year; and EG plus other fisheries where
gross revenue was < than $60,000 per year.
This division was made on the basis of recognising the diversity in business structures, gross
earnings and not wishing to put high and low revenue businesses within one category.
The sample of businesses and range of gross revenues are reported in Appendix Table GA2.
Appendix Table GA2: Respondent numbers, mean business revenue and range of revenues
for the three fisher business groups in the NSW Estuary General Fishery (Source: RM-ES).
The variety in business categories and activity levels among fishers are evident. These are
now explored further through accounting and economic measures.
Accounting measures
The survey results are reported in Appendix Table GA3.
Vessel category ObservationsMean
RevenueMinimum Revenue
Maximum Revenue
EG Only 57 42,098$ 15,000$ 165,000$
EG and other (>$60,000 pa) 44 116,779$ 60,000$ 297,000$
EG and other (<$60,000 pa) 45 36,692$ 15,000$ 60,000$
Mean business 146 65,350$ 15,000$ 297,000$
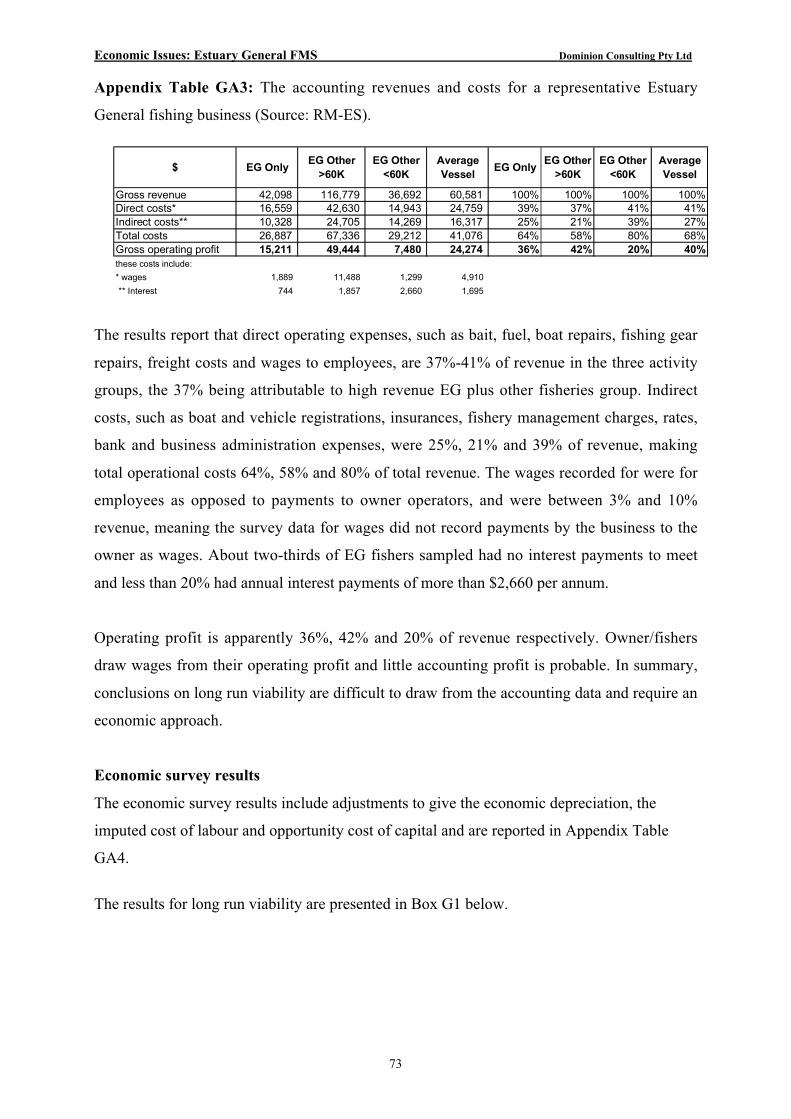
Economic Issues: Estuary General FMS Dominion Consulting Pty Ltd
73
Appendix Table GA3: The accounting revenues and costs for a representative Estuary
General fishing business (Source: RM-ES).
The results report that direct operating expenses, such as bait, fuel, boat repairs, fishing gear
repairs, freight costs and wages to employees, are 37%-41% of revenue in the three activity
groups, the 37% being attributable to high revenue EG plus other fisheries group. Indirect
costs, such as boat and vehicle registrations, insurances, fishery management charges, rates,
bank and business administration expenses, were 25%, 21% and 39% of revenue, making
total operational costs 64%, 58% and 80% of total revenue. The wages recorded for were for
employees as opposed to payments to owner operators, and were between 3% and 10%
revenue, meaning the survey data for wages did not record payments by the business to the
owner as wages. About two-thirds of EG fishers sampled had no interest payments to meet
and less than 20% had annual interest payments of more than $2,660 per annum.
Operating profit is apparently 36%, 42% and 20% of revenue respectively. Owner/fishers
draw wages from their operating profit and little accounting profit is probable. In summary,
conclusions on long run viability are difficult to draw from the accounting data and require an
economic approach.
Economic survey results
The economic survey results include adjustments to give the economic depreciation, the
imputed cost of labour and opportunity cost of capital and are reported in Appendix Table
GA4.
The results for long run viability are presented in Box G1 below.
$ EG OnlyEG Other
>60KEG Other
<60KAverage Vessel
EG OnlyEG Other
>60KEG Other
<60KAverage Vessel
Gross revenue 42,098 116,779 36,692 60,581 100% 100% 100% 100%Direct costs* 16,559 42,630 14,943 24,759 39% 37% 41% 41%Indirect costs** 10,328 24,705 14,269 16,317 25% 21% 39% 27%Total costs 26,887 67,336 29,212 41,076 64% 58% 80% 68%Gross operating profit 15,211 49,444 7,480 24,274 36% 42% 20% 40%these costs include:
* wages 1,889 11,488 1,299 4,910
** Interest 744 1,857 2,660 1,695

Economic Issues: Estuary General FMS Dominion Consulting Pty Ltd
74
Box G1: Long run economic viability – covering economic depreciation.
In the long term the following had positive returns in excess of all costs including economic
depreciation:
7 of the 57 EG only vessels had positive returns, in excess of all economic costs;
3 of the 45 EG plus other fisheries < $60,000;
20 of the 45 EG plus other fisheries > $60,000 pa fishers had positive economic
returns
In total this indicates that 30 from 147 (20%) of fishing businesses were above long run
economic viability, covering opportunity costs of capital, imputed labour and depreciation on
the basis of being able to replace capital at the end of the lifespan of their assets. In the
survey period 30 vessels from 147 would be earning returns in excess of opportunity costs
and represent businesses in economic surplus.
Discussion of economic viability and the EG fishery
The viability of fishing businesses in the EG fishery is investigated by the economic survey.
This was for one financial year only. It should be augmented by a series of annual surveys to
see profitability over a longer time horizon.
The accounting measure does not include any opportunity costs and indicates that for many
fishers payment to the operator will come out of the business after other deductions – “fishing
for wages”. The surplus available varies between the three types of operation examined and
is potentially highest for the EG plus other fisheries grossing > $60,000.
The economic profit enables long term viability to be appraised with 20% of businesses
having economic profit and are thus viable in the long run covering economic depreciation
setting aside enough now to renew capital at a future date. This infers that 80% of operators
are performing below the long run viability benchmark. This does not mean they cannot
operate on a day to day basis, but that they forgo some element counted in economic costs as
presented in Appendix Table GA4.

Economic Issues: Estuary General FMS Dominion Consulting Pty Ltd
75
Appendix Table GA4: Results of the Economic survey of the Estuary General fishingbusinesses in the financial year 1999-2000 (Source: RM-ES).
It is likely that fishers forgo payment for all the time involved with the fishing business. The
high labour commitment to fishing in the EG is reported in Appendix Table GA4 where the
average EG fisher spends 48% of their time on “unpaid” tasks of fishing, delivery time,
repairs, maintenance, management and administration. Appendix Table GA5 indicates labour
is also contributed by family and this was also included in the imputed labour cost.
Appendix Table GA5: The annual average unpaid and paid days fishing by businesses in theEG (RM-ES).
Days EG Only EG + Other >60K EG + Other <60K Total
Fisher days (unpaid) 98 121 107 108Fishing days (paid) 213 241 213 222Fisher unpaid daysas % of paid 46% 50% 50% 48%Family/other unpaid 25 51 40 38
For example if the fisher’s partner or family member works for less than the imputed pay rate,
and the operators earns a satisfactory return, then the imputed wage calculation is possibly
unreasonable (Stanton, 1972; ABARE, 2000). Fishers may take less wages than the imputed
$ EG OnlyEG Other
>60KEG Other
<60KAverage Vessel
Gross revenue 42,098 116,779 36,692 65,350 less costsCooperative expenses 3,700 2,606 1,660 2,715 Bait 327 1,789 907 990 Boat fuel 2,629 9,428 3,452 5,145 Fishing gear 2,506 5,063 2,925 3,486 Vehicle fuel 1,887 4,005 2,005 2,629 Freight 569 1,583 234 805 Other costs 1,704 363 760 970 Imputed Labour 37,622 42,561 39,824 39,937 Total Direct costs 50,944 67,397 51,767 56,678 Boat registration/fees 286 1,599 736 861 Vehicle registration 678 1,595 728 995 Insurance 714 1,843 687 1,082 Fishery Man. Charges 204 1,094 585 617 Com Fish Licence 782 1,426 845 1,016 Accounts 544 1,273 717 839 Phone 552 1,850 490 966 Power 403 945 443 596 Rates 1,699 1,177 901 1,283 Bank expenses 209 760 146 374 Economic depreciation 1,292 2,550 1,186 1,679 Repairs 1,348 6,054 1,700 3,024 Repairs vehicle 1,052 2,152 1,077 1,426 Travel 108 763 128 334 Other costs 54 1,398 2,251 1,169 Opp. Cost of Capital 3,215 8,870 4,034 5,349 Total Indirect costs 13,140 35,349 16,655 21,608 Total Economic costs 64,084 102,746 68,423 78,286 Economic gross profit 21,986- 14,033 31,731- 12,936- Capital asset value 45,925 126,720 57,634 76,413 Ec. Rate of Ret.to Capital -48% 11% -55% -17%

Economic Issues: Estuary General FMS Dominion Consulting Pty Ltd
76
rate to keep the business operational. Opportunity costs of capital can be forgone, as can
depreciation, with fishers hoping to keep current assets operational beyond their envisaged
lifespan, or to locate a second hand vessel if a replacement is required.
In discussing efficiency and farmer welfare in the NSW farming sector, Standen (1972) noted
that replacement cost based measures for depreciation and off-farm imputed earnings may be
invalid measures of opportunity costs of these resources in the rural industry context, tending
to overstate off-farm benefits. For some fishers the opportunity costs for labour outside
fishing may be close to zero, or if pensionable age, social security payments of up to
approximately $10,000 per annum. Commonly fishers indicate they forgo payment for
lifestyle and autonomy. This may even extend to short term periods where fishers forgo
wages, cease fishing or move to other industries until the fishing improves. This substitution
between fishing and other industries may be an efficient strategy for fishers to remain in
fishing in the long term.
There are also impediments to fishers exiting the fishing industry. Lack of marketable fishing
rights with restrictions on transferability limit the sale of fishing licenses. Exiting the industry
also involves outlays on transport, food and lodgings incurred during an industry transfer
period. The prospect of false starts in new employment also restricts exiting and the psychic
costs of changing occupation and place of living. The fishers in the EG fishery maybe identify
with the following: “If higher incomes are available only with a change in employment or
location, then strong attachment to present positions could mean that the individuals would
not be better off in the alternative positions” (Standen, 1972).
Conclusions
For larger businesses fishing EG and other fisheries the economic rate of return to capital is
approximately 11%. It should be noted that 51% of the activity of these vessels was in the
EG fishery and the results here are for business activity as opposed to in the EG fishery alone.
For all fishing businesses sampled with EG endorsements, an economic return to capital is
approximately -17% (negative).
The long term viability of the lowest half of EG fishing businesses is questionable, but has to
be interpreted within the context of small scale and part time nature of fishing operations in
the fishery and the concept of the rural lifestyle and impediments to altering that lifestyle as
previously discussed. The median rate of return is –30% to capital, indicating half the

Economic Issues: Estuary General FMS Dominion Consulting Pty Ltd
77
businesses were below this rate of return in the 1999-2000 financial year. Many of these
fishers indicated that in the survey period refit or breakdown had impaired their fishing
performance leading to costs and limited income.
The current survey results shed light on IPART’s previous finding that “70% of fishers will
encounter problems in their capacity to pay higher management charges”(IPART, 1998 p 63).
Many operators will have difficulty in meeting additional management or additional
restructuring costs. This will be investigated in the EG assessment.

Economic Issues: Estuary General FMS Dominion Consulting Pty Ltd
78
Appendix 3: Comments from regional fishing industry studies with economic
multipliers.
Comments from each study are reported for the southern and northern NSW area.
Southern NSW
In the study by Powell et al. (1989) the flow on effects of potential policy changes are
analysed in 1987-88 when 5,615t of trawl fish, including orange roughy, was landed in Eden
and 1,877t of trawl fish in Ulladulla (Powell et al., 1989). The report has some appended
information on non-trawling fishing activity, which is of interest to the current study in terms
of appraising impacts in the EG fishing community. The study included fishing, processing
and fish handling.
Eden - For the trawl fishing in Eden in 1987-88 Powell et al. (1989) have two comments:
“Overall the industry has a ratio of total to initial effect of about 1.5 which is relatively low. It
would seem to be accounted for by a high capital intensity in handling and processing
operations with corresponding low labour use and low labour income payments. There is also
a low use of locally provided inputs (these show up as low production-induced effects). The
latter is due to the “smallness” of the Eden economy and its limited capacity to provide inputs
to the trawl fishing industry.” Powell et al. (1989; p41).
“ Impacts of the trawl fishing industry on the Eden economy in 1987-88. The total initial
output of the trawl fishing industry of $8.5m generated a further $4.5m, totaling $13.1m in
output in the local economy. This represented 8.8% of the total output in the local economy.
Trawl fishing also generated household income of $2.97m with 189 jobs, which represented
8.04% and 12% of total income and employment in Eden respectively” Powell et al. (1989;
p46).
Ulladulla
The multipliers in Ulladulla were for the trawl fishing industry, trawl handling and total trawl
industry, with no processing. Comments made by the authors were:
“Trawl fishing generated almost $5m of output, provided 94 jobs and $1.6m of income to
households. The ratio of local industry impacts to initial activity in the trawl fishing sector in

Economic Issues: Estuary General FMS Dominion Consulting Pty Ltd
79
terms of income is 1.7. That means for ever $1 paid to trawl workers, all other activities
generate 1.7 times this amount” Powell et al. (1989; p51).
“The total output of the trawl fishing industry of $3.2m generated a further $1.8m, totaling
$5.0m in output in the local economy. This represented 3.2% of the total output in the
economy. The trawl fishing industry also generated a total household income of $1.6m
associated with 94 jobs, representing 3% and 3.8% of total household income and
employment in Ulladulla” Powell et al. (1989; p56).
Northern NSW
The Northern NSW study was part of an agriculture and fishing community study for the area
from Tweed Heads to Tuncurry using data from the 1984-85 period.
Tamblyn and Powell (1988) comment:
“Commercial fishing, local transport to cooperatives, the handling and processing operations
of fish cooperatives and transport from the cooperatives to major markets were included.
Excluded were local wholesale and retails sales of fish, Sydney Fish market operations and
blackmarket sales, which are reported to be sizeable. All amateur and pleasure fishing is
excluded.” (Tamblyn and Powell, 1988; page 45).
On the economic impact they summarise:
“The industry produced products valued at $48.9m, and employed 1,476 people who received
payments of $21m. In employment terms, the impacts are dominated by fishing which
comprise 82 per cent of the total effect. This is high given that all fish are processed in some
way. However, much of that processing adds only a small amount of value through cleaning,
scaling and packing. This also means that the ratio of all effects of fishing is relatively low at
about two.” (Tamblyn and Powell, 1988; page 45).
In estimating output from Fish Cooperatives the authors adjusted for double counting of
output due to fish coops buying fish in. The NSW Government economic appraisal guidelines
warn of the potential errors and inaccuracies in Input-Output studies relating to poor data,
double counting of output impacts, and inappropriate application of multipliers (NSW
Treasury, 1997). After adjustment they indicate that “the ratio of all direct and indirect effects
to the fishing direct effect” is 2.404 (Tamblyn and Powell, 1998; p 47).
Economic Issues: Estuary General FMS Dominion Consulting Pty Ltd
80
Clarence
In the Clarence the McVerry (1996) study indicated that:
“Estimates of the value of output from the commercial fishing industry in the Lower Clarence
for 1992-93 amounted to $14.0 million, with flow-on impacts for businesses supplying goods
and services to those in the direct employment of the fishing industry of $12.3 million. The
total direct and indirect value of output for the commercial fishing industry in the Lower
Clarence region for 1992-93 was, consequently, $26.3 million. Over half of the fisheries
production of Northern NSW is derived from the Lower Clarence region, indicative of the
productive capacity of the Clarence River and the adjacent offshore fishing grounds”
(McVerry, 1996).
“The total number of jobs generated directly by the commercial fishing industry in the Lower
Clarence region for 1992-93 was 382, with the flow-on employment impacts resulting in
another 190 jobs. The fishing industry in the Lower Clarence provides direct and indirect
employment for 572 people, which represents 12.6 percent of the total employment in the
area. Any decline in employment from the fishing industry will impact on the employment
levels and economic activity in the Lower Clarence region due to the limited number of
alternative job opportunities in the area”. (McVerry, 1996).
Social Issues: Estuary General Dominion Consulting Pty Ltd
1 14/11/01
(H) SOCIAL ISSUES
The background to the social assessment of the Estuary General FMS is given in the
introduction to the Economic Issues Chapter (G).
The DUAP guidelines for social issues will be followed below requiring we:
“Assess the likely social impacts of the fishing activity proposed under the management
plan”.
Introduction
The DUAP Directors Guidelines require examination of social information on fishers and
their communities. Two approaches were taken to this. The first was to use Australian
Bureau of Statistics (ABS) data, obtained from the Bureau of Rural Science (BRS) social
science unit, to examine the secondary level information available on the communities and
fishers in the NSW fishing industry. The results of this fisher community profiling are
presented in Appendix H1.
The second approach was a fisher telephone survey of all fishers in NSW to obtain more
specific social information of relevance to appraising issues under the Fisheries Management
Strategy process. An overview of the state-wide social survey is reported in Appendix H2.
The available information is used to address the social issues surrounding the introduction of
the Estuary General Fisheries Management Strategy. Given the lack of previous studies, the
review is not complete against the DUAP guidelines and gaps have been identified. The need
for future research is presented in section 3.
(1) Review of the existing situation
(a) Describe the demographic profile of those employed in the fishery (by regions/sub-
regions/fleets) – including:
(i) direct employment eg boat owners, skippers and crew; identify those with
multiple endorsements and those “part-time” fishers (eg with other sources of

Social Issues: Estuary General Dominion Consulting Pty Ltd
2 14/11/01
employment, or semi retired); and indirect employment (cold stores, traders,
suppliers);
The Estuary General fishers are a diverse fishery group. The distribution of EG fishers North
to South along the NSW coast is reported in Table G4 of the economic section. The profile of
fisher communities in coastal NSW for all commercial fishers is reported in Appendix 1. The
information on EG fishers and their communities has been extracted and are summarised in
Table H1, which reports social indices at the zone and district level from ABS and licensing
data. This can be used in appraising management impacts. Figure 1 is a map of coastal
fishing towns along the NSW coast and can be used in conjunction with district and postcode
Tables.
Table H1: Summary table of social indices for EG fishers in zones and districts of NSW
(Source: ABS/BRS and NSWF licence data).
Key: Postcode population as of 1996; postcode fishers-for all NSW and EG fishers; Unemployed by postcode as of1996 census; SEIFA -Socio-economic index for areas (ABS), Med. Ind. Inc.- median individual income per week as of 1996census; Employed in commercial fishing (or EG) as percentage of labour force; see Appendix 1 for a fuller explanation ofvariables.
Zone Home DistrictP'code
PopulationP'code Fishers
EG P'code Fishers
Unemployed (%)
SEIFA Med. Ind.
Income (wk)
Employed in C.F. as
(%) of labour force
Employed in EG as
(%) of labour force
1 TWEED 41,938 63 26 17 922 250 0.37 0.15 RICHMOND 28,558 87 31 17 930 227 0.85 0.30 Zone 70,496 150 57 17 926 238 0.61 0.23
2 CLARENCE 43,353 259 139 19 919 222 3.12 1.68 3 COFFS HARBOUR 55,625 110 30 19 940 215 0.67 0.18
HASTINGS 61,291 90 45 18 936 227 0.68 0.34
Zone 116,916 200 75 18 938 220 0.68 0.25 4 MANNING 37,878 80 48 18 914 203 0.67 0.40
WALLIS LAKE 22,704 105 76 15 939 250 2.78 2.01 PORT STEPHENS 52,562 101 43 13 967 250 1.33 0.57 HUNTER 52,557 55 26 14 933 233 0.18 0.09 CENTRAL COAST 206,143 102 76 11 977 267 - -
Zone 371,844 443 269 13 951 244 0.68 0.41 5 HAWKESBURY 2,380 30 12 7 1,004 300 - -
SYDNEY 3,276,207 189 72 7 1,047 350 - -
Zone 3,278,587 219 84 7 1019 317 - - 6 ILLAWARRA 65,532 50 25 15 935 215 0.13 0.07
SHOALHAVEN 53,871 75 46 15 945 215 0.81 0.50 Zone 119,403 125 71 15 938 215 0.36 0.20
7 BATEMANS BAY 34,836 105 38 17 958 227 1.18 0.43 MONTAGUE 8,135 53 13 16 955 180 1.54 0.38 FAR SOUTH COAST 3,726 61 6 12 916 250 2.56 0.25
Zone 46,697 219 57 16 949 222 1.53 0.40
Grand Total 4,047,296 1,615 752 15 945 236 0.92 0.43

Social Issues: Estuary General Dominion Consulting Pty Ltd
3 14/11/01
Figure H1: Map of EG fishing towns on the NSW coast.

Social Issues: Estuary General Dominion Consulting Pty Ltd
4 14/11/01
EG fishers inhabit some small towns and in terms of home ports, the social survey identifying
there were 440 fishers, using 54 home estuaries or ports with other fishers, and 63 using home
estuaries or ports by themselves. Table H2 enables EG fishers as part of fishing communities
in NSW1 to be identified by postcode area as available in ABS data. Maps of ABS survey data
are reported in Appendix 4. This is an approximation to towns and fisher communities. The
definition of fisher communities is an area for further work.
In Table H1, EG fishers are approximately 46% of all NSW fishers in the analysis.
Unemployment by region is higher in rural NSW and will be investigated later in this section.
The Socio Economic Index for Areas (SEIFA) is a measure of socio-economic disadvantage,
relative to 1,000 units. In Table H1, most of rural NSW fishing zones are under 950 on the
SEIFA index, while Sydney exceeds 1,000. Median weekly income data for regions in 1996
show a similar situation.
In Table H1, the second last column reports all commercial fishers as a percentage of the local
working population and the last column reports EG fishers as a percentage of local working
population. These are ABS data from the 1996 census. Fishers in the Clarence and Wallis
Lakes area have the highest percentage of EG fishers in the work force indicating economic
and social dependence. In areas of higher population, the fishers as percentage of labour force
method does not reflect the size of the fishing community (for example, Central Coast,
Hawkesbury and Sydney), where the general work force is large relative to the number of
commercial fishers.
Table H2 reports major home post codes within districts and illustrates the diversity in
community structures and in the home locations of EG fishers. EG fishers form a substantial
part of the NSW fishing community ranging from 4%-100% of local fisher numbers. A
significant number of postcode areas with EG fishers fall below 900 on the SEIFA index of
disadvantage and may well be more adversely impacted by changes under the FMS (For
example: Tweedheads, Iluka, Woombah/others, Harrington/Coopernook, Mayfield, Primbee
and Berkeley). Similarly a range of areas record median individual weekly incomes below
$200 in the 1996 census. Several postcode have a high percentage of EG fishers in the work
force (for example, Maclean, Yamba, Iluka, Empire Bay, Mannering Park and Berkeley Vale,
and Moruya). Conversely some postcodes have relatively few EG fishers as a percentage of
1 This is explained in Appendix 1, where the available data is for postcodes with over 10 NSW commercialfishers.

Social Issues: Estuary General Dominion Consulting Pty Ltd
5 14/11/01
the work force (for example, Evans Head, Coffs Harbour, Nelson Bay, Swansea, Mayfield,
Kiama), though this should be interpreted with caution, given the weakness of this method in
areas of high population.
The numbers of employees associated with the EG fishery and the multiple endorsement
structure of the EG fishery is reviewed in the economic section, Chapter (G).
Table H2: ABS social index data on EG fishing communities in NSW at the postcode level
(Source ABS/BRS; NSWF licence data).
Zone Home District P. code Town/Suburb P'code Pop'n
P'code Fishers all NSW
P'code Fishers
(EG)
EG fishers as % of all NSW
Unemployed (%)
SEIFAMed. Ind. Income
(wk)
Employed in C.F. (%) of labour force
Employed in E.G. (%) of labour
force
1 TWEED 2485 TWEED HEADS 8,978 22 5 23% 20.0 893 200-299 1.02 0.23
1 TWEED 2486 TWEED HEADS/BANORA POINT 24,984 22 8 36% 14.4 953 200-299 1.02 0.37
1 TWEED 2487 CHINDERAH/OTHERS 7,976 19 13 68% 16.2 921 200-299 0.52 0.36
1 RICHMOND 2472 BROADWATER/CORAKI 1,761 10 4 40% 19.5 919 200-299 0.3 0.12
1 RICHMOND 2473 EVANS HEAD 2,613 25 5 20% 16.8 900 160-199 0.41 0.08
1 RICHMOND 2478 BALLINA/OTHERS 24,184 52 22 42% 13.7 972 200-299 0.41 0.17
2 CLARENCE 2460 LAWRENCE/OTHERS 29,145 24 17 71% 14.8 951 200-299 1.212 0.86
2 CLARENCE 2463 MACLEAN/OTHERS 6,072 96 64 67% 16.2 946 200-299 4.46 2.97
2 CLARENCE 2464 YAMBA/OTHERS 5,340 64 28 44% 17.1 954 200-299 4.46 1.95
2 CLARENCE 2466 ILUKA 1,863 65 23 35% 18.6 891 160-199 4.46 1.58
2 CLARENCE 2469 WOOMBAH/OTHERS 933 10 7 70% 27.2 854 160-199 1.02 0.71
3 COFFS HARBOUR 2448 NAMBUCCA/OTHERS 8,690 18 16 89% 19.1 927 160-199 0.8 0.71
3 COFFS HARBOUR 2450 COFFS HARBOUR 32,488 52 10 19% 15.8 971 200-299 0.24 0.05
3 COFFS HARBOUR 2456 WOOLGOOLGA/URUNGA 11,848 20 2 10% 20.5 944 200-299 0.46 0.05
3 COFFS HARBOUR 2462 WOOLI/OTHERS 2,599 20 2 10% 20.0 917 160-199 1.19 0.12
3 HASTINGS 2431 SOUTH WEST ROCKS 3,965 33 11 33% 18.6 926 160-199 0.78 0.26
3 HASTINGS 2440 CRESCENT HEADS/OTHERS 23,164 20 13 65% 19.3 916 200-299 0.78 0.51
3 HASTINGS 2444 PORT MACQUARIE 34,162 37 21 57% 15.2 966 200-299 0.48 0.27
4 MANNING 2427 HARRINGTON/COOPERNOOK 1,473 24 5 21% 18.0 883 160-199 0 0.00
4 MANNING 2430 TAREE/OTHERS 28,312 35 20 57% 14.0 950 200-299 0 0.00
4 MANNING 2443 LAURIETON/OTHERS 8,093 21 23 110% 20.6 909 160-199 0 0.00
4 WALLIS LAKE 2423 BUNGWAHL/OTHERS 3,247 17 13 76% 14.5 939 200-299 0 0.00
4 WALLIS LAKE 2428 FORSTER/TUNCURRY/OTHERS 19,457 88 63 72% 15.1 939 200-299 0 0.00
4 PORT STEPHENS 2301 NELSON/SALAMANDER BAYS/OTH 25,046 27 1 4% 11.1 997 200-299 0 0.00
4 PORT STEPHENS 2315 NELSON BAY/OTHERS 8,393 54 18 33% 14.3 966 200-299 0.05 0.02
4 PORT STEPHENS 2324 TEA GARDENS/OTHERS 19,123 20 24 120% 13.6 937 200-299 0.05 0.06
4 HUNTER 2280 BELMONT/OTHERS 22,225 10 7 70% 10.5 989 200-299 0.555 0.39
4 HUNTER 2281 SWANSEA/OTHERS 11,349 15 8 53% 14.3 935 160-199 0.07 0.04
4 HUNTER 2295 STOCKTON/OTHERS 5,058 12 10 83% 12.8 918 200-299 0.71 0.59
4 HUNTER 2304 MAYFIELD/WARABROOK 13,925 18 1 6% 17.6 890 200-299 0.71 0.04
4 CENTRAL COAST 2250 ERINA/OTHERS 57,810 10 6 60% 7.7 1025 300-399 0.595 0.36
4 CENTRAL COAST 2251 AVOCA BEACH/OTHERS 29,370 11 8 73% 8.5 1032 200-299 1.04 0.76
4 CENTRAL COAST 2256 WOY WOY/OTHERS 14,168 12 10 83% 11.1 941 200-299 1.04 0.87
4 CENTRAL COAST 2257 EMPIRE BAY/OTHERS 25,326 10 6 60% 11.6 957 200-299 1.91 1.15
4 CENTRAL COAST 2259 MANNERING PARK/TACOMA/OTHE 46,846 40 37 93% 10.6 972 200-299 2.78 2.57
4 CENTRAL COAST 2261 BERKELEY VALE/OTHERS 32,623 19 9 47% 14.1 935 200-299 2.78 1.32
5 HAWKESBURY 2083 MOONEY MOONEY 1,450 12 7 58% 5.7 1042 300-399 0 0.00
5 HAWKESBURY 2775 SPENCER 930 18 5 28% 9.2 967 200-299 0 0.00
5 SYDNEY SYDNEY NORTH & SOUTH 3,276,207 189 72 38% 7.3 1047 300-399 1.54 0.59
6 ILLAWARRA 2500 WOLLONGONG 32,326 10 1 10% 12.6 998 200-299 0 0.00
6 ILLAWARRA 2502 PRIMBEE/OTHERS 13,000 10 9 90% 18.9 847 160-199 0.1 0.09
6 ILLAWARRA 2506 BERKELEY 6,653 18 13 72% 19.0 827 160-199 0.1 0.07
6 ILLAWARRA 2533 KIAMA 13,553 12 2 17% 7.6 1067 200-299 0.1 0.02
6 SHOALHAVEN 2540 GREENWELL POINT/OTHERS 24,208 59 33 56% 18.2 933 160-199 0.23 0.13
6 SHOALHAVEN 2541 NOWRA/OTHERS 29,663 16 13 81% 12.0 957 200-299 0.81 0.66
7 BATEMANS BAY 2536 BATEMANS BAY/OTHERS 14,335 32 15 47% 15.5 970 200-299 0.81 0.38
7 BATEMANS BAY 2537 MORUYA/OTHERS 9,002 10 9 90% 18.2 960 200-299 1.175 1.06
7 BATEMANS BAY 2539 ULLADULLA/OTHERS 11,499 63 14 22% 17.4 942 160-199 1.54 0.34
7 MONTAGUE 2546 NAROOMA/OTHERS 8,135 53 13 25% 15.9 955 160-199 0.81 0.20
7 FAR SOUTH COAST 2551 EDEN 3,726 61 6 10% 12.1 916 200-299 2.56 0.25
Total 1615 752

Social Issues: Estuary General Dominion Consulting Pty Ltd
6 14/11/01
The social survey enabled a social profile of EG fishers to be developed as reported in Table
H3.
Table H3: The demographics of fishers in Estuary General (Source: RM –SS and NSWFlicence data).
Statewide profile All NSW EG
Mean age of fisher (years)* 54.4 51.5 Age range 16-88 16-88Percent males 99.2% 99.0%
Mean years resident in town 24.2 26.2 Mean years in Fishing Ind. 20.8 21.6 Generations in Fishing Ind. 1.9 2.1Median Hours /week in fishing industry 54.1 53.1 Percent currently employed in other industries 19.1% 20.0%
Housing TenureOwn 49.9% 46.5%Paying off 32.8% 34.6%Renting 15.8% 17.3%Other 1.4% 1.6%
EducationDid not finish PS 2.0% 2.2%Did finish PS 3.6% 3.2%Year 7 4.1% 4.6%Year 8 9.6% 10.9%Year 9 17.4% 19.5%Year 10 32.1% 33.0%Year 11 3.8% 3.2%Year 12 11.4% 10.1%Trade cert. 10.1% 8.2%Ind/ business 1.7% 1.6%Uni 3.3% 2.4%Other 0.9% 1.0%
Marital StatusMarried or relationship 81% 80%Single 11% 11%Other (Divorced, separated, widowed) 8% 9%
Partner employed in Fishing Business 40% 34%Mean number of Children <16 years 1.2 1.1 (Other) Dependants
None 63% 63%Spouse 23% 24%Children - over 16 and other 14% 13%
Employed StatusOwner operator 88% 94%Non fishing owner/other 4% 2%Nominated fisher/skipper 8% 5%
Employees (%) 0 65% 79% 1 or more 35% 21%
Mean Individual net taxable income (all industries) 39,634$ 36,412$ Mean Household net taxable income 42,483$ 39,528$
< 6,000 3% 2%6,000-9,999 2% 2%10,000-19,999 7% 6%20,000-29,999 20% 24%30,000-39,999 20% 22%40,000-49,999 11% 10%50,000-59,999 8% 7%60,000-69,999 8% 9%70,000-79,999 5% 5%80,000-89,999 5% 5%90,000-99,999 1% 0%100,000+ 11% 8%

Social Issues: Estuary General Dominion Consulting Pty Ltd
7 14/11/01
Table H3 reports that the average age of NSW commercial fishers is 54.1 years and is higher
than the 45.3 years recorded for all Queensland fishers (Fenton and Marshall, 2000). The
survey age of EG fishers is 51.5, this sample estimate exceeding data from licence records
which indicates 47.1 years. Participation of females in direct fishing is low (<1%), though
34% of fishers’ partners are employed in EG fishing businesses. Approximately 94% of EG
fishers are owner operators, average over 21 years of fishing experience, work a median of
53.1 hours per week, and 20% of fishers work in other industries. Fishers have high levels of
residency, averaging 26 years and home ownership, with 81% owning or paying off a home.
The 502 EG fishers interviewed had low rates of formal education, with 70% achieving year
10 education or below. Only 10% had a trade or business training. Fishing forms a
significant part of individual fishers income, as described in Table G9 of the economics
chapter. Fisher income from all industries is 92.1% of household income which averaged
$39,528 after tax indicating the overall contribution of fishers to household income.
In examining dependants, it was found that 57% of fishers had no dependent children below
16 yrs of age as reported in Box H1.
Box H1: Dependent children below 16 years of age (RM-SS).
No. of dep. Children Freq. Total dep. Children %0 287 - [57% of 502]1 70 70 16%2 85 170 39%3 41 123 28%4+ 16 69 16%Total 212 432 100%
The balance of 212 fishers, had 432 dependent children under 16 representing families with
an average of 1.1 per fisher (Table H3), or 2.05 children per fisher with dependent children.
About 63% of fishers had no other financial dependants, 25% had dependent spouses (123
persons) and 13% had dependent grandparents, parents and children over 16 yrs (see Table
H3).
Of 502 EG endorsement holders contacted, 449 had been fishing in EG in the previous 12
months. The balance of sampled endorsement holders were fishing elsewhere, with the
exception of others who had not fished in any fishery. The reasons for not fishing in the past
12 months are reported in Box H2.

Social Issues: Estuary General Dominion Consulting Pty Ltd
8 14/11/01
Box H2: Reasons for not fishing in the EG, or any other fishery in the last 12 months (Source: NSWF- SS).
Reason Freq. Reason Freq.Sick/ in hospital 3 Not interested 1Changed occupation 2 Death in family 1Too old 1 Other 8 n=16
(b) Outline the community values associated with commercial fishing, in particular :
(i) fishers’ ways of life; fishing communities and trends associated with changes in fishing
technology, communications and estuary management practices.
Industry working practices
The social survey asked questions to provide information on the fishers way of life. The
fishing life style takes more hours than the conventional 40 hour week, fishers being asked to
estimate their average working week in normal, low and high seasons. The estimates from
the telephone interview are reported in Figure H2. Normal working hours are estimated at
53.1 per week. This is significantly in excess of the 42 hours per week estimated by ABS for
fishers nationally (ABS, 1996). High season estimates exceed 70 hours / week while low
season hours are typically 26-30 hours /wk.
Figure H2: Hours worked in the Normal, Low and High seasons in the EG fishery (Source:RM- SS).
0 1-5 6-10 11-15
16-20
21-25
26-30
31-35
36-40
41-45
46-50
51-60
61-70
71-80
81-90
91-100
101+
Normal
High
0
10
20
30
40
50
60
70
80
Season
Hours per week
Frequency
Normal
Low
High

Social Issues: Estuary General Dominion Consulting Pty Ltd
9 14/11/01
Fishing is a diverse activity, but can also lead to industrial injury. Box H2 indicates that 3%
of the 502 fishers were inactive from the fishing industry in 1999-00 for a variety of reasons.
Injuries from fishing also impacted fishing time as reported in Figure H3. The graph indicates
that 75% of fishers had no fishing injuries in the previous 12 months, but that 16% of fishers
were out of fishing for 2 weeks or more in the year 1999-00 through industrial injury (86
fishers in the sample of 502). This indicates the level of industry related injuries in the EG
fishing industry.
Figure H3: Frequency of non-working time from industrial injury in commercial fishing inthe EG fishery in the last 12 months (Source: RM-SS).
Investigate community/regional aspects of fishers
The regional location of fishers by district is reported in Tables H1 and H2. There is no
accepted definition of “fishing communities” and this requires further analysis of economic
and social interactions and linkages between fishers and between communities (Fenton et al.
2000).
Some part of regional fisher behaviour is captured in the travelling behaviour of EG fishers.
About 42 from 502 fishers in Table H4 show significant travelling behaviour of over 50km
per day ( or 2-3 hours by boat) in their fishing operation.
Table H4a: Travel distance to main fishing site in the EG fishery (Source: RM- SS).Frequency %
<25 km, 1hr by boat 334 69%25-50 km, 1-2hr by boat 96 20%50-100 km, 2-3hr by boat 23 5%>100 km, > 3hr by boat 19 4%Can't say 14 3% n= 486
374
10 923
1021 23 26
6
0
50
100
150
200
250
300
350
400
No time < 3 days 3-6 days 1-2 weeks 2-3 weeks 3-4 weeks 1-3 months > 3 months Can't say
Time injured
Fre
qu
ency

Social Issues: Estuary General Dominion Consulting Pty Ltd
10 14/11/01
Other measures of time of residence are reported in Table H4b. This shows 65% of fishers
remaining in the same postcode for the last 20 or more years and indicates that a substantial
part of the community are long term residents with greater attachment to place and to local
communities. There are likely to be strong social networks and ties, and higher levels of
social capital within the EG fishing community.
Table H4b: Residency at current postcode (Source: RM-SS).
Years Freq. % Years Freq. %<1 10 2% 21-25 49 10%1-5 37 7% 26-30 58 12%6-10 43 9% Over 30 yrs 217 43%11-15 47 9% Can't say 1 1%16-20 40 8% n= 502 100%
Table H4b reports 82% of fishers have been living in the same postcode area for 10 years or
more. Less than 10% have moved their postcode in the last 5 years. Apart from some
operational travelling behaviour, the EG fisher population is reasonably sessile and has a
significant number of fishers who have been resident in a local area for a long time, implying
significant community ties and social capital in the EG fishing community.
(i) social capital issues; age distribution of fishers; skill base and transferability of
skills; consider trends by region or sub –region affecting entry or exiting of fishers,
employees or boat owners in the sector
There is no one accepted measure of social capital (NSW government, 1997b). Fishers are
often a significant part of the social infrastructure in small coastal communities. For example,
an illustration of the potential contribution of fishers to local social capital is reported in Table
H5 from McVerry (1996). Fishers and their club memberships in the Clarence community
are reported. Clubs can be a place for fishers to socialise with other fishers, workers and the
community. There is no other available information on fishers and social capital in NSW.
Table H5: Fishers as a percentage of club memberships in the Clarence region (After
McVerry, 1996).
Type of ClubFishers as % of
club membership
Bowling Club 41Golf Club 27RSL 18Soccer, Football, Coastguard 4Surf, Cricket, Lions Clubs 3Softball, Rowing, Horse, Clarence Catchment Management 2Bik Cl b N l R 1

Social Issues: Estuary General Dominion Consulting Pty Ltd
11 14/11/01
A measure which indicates a sense of fishing industry involvement, community and an
element of social capital, is the years of fisher involvement with the industry. Licence record
information goes back to 1977 for the EG fishers, have been summarised in Figure H4 and
shows that 20% of fishers interviewed were fishing prior to 1977 when current electronic
licence records began.
Figure H4: Number of years EG fishers have been licenced in NSW (NSWF licence data).
5
2218 19
146 5
10 1015
21 2215
26
1220
2820
31
2127
124
146
0
20
40
60
80
100
120
140
160
1 2 3 4 5 6 7 8 9 10 11 12 13 14 15 16 17 18 19 20 21 22 23
Years Fished
Fre
quen
cy
The mean licence duration is 16.8 years with a standard deviation of 6.7 years representing
12,600 person years fishing experience among 750 fishers. Of the 637 for whom records are
available, 50% have over 20 years of experience. Figure H5 reports how many years fishers
had been in the NSW fishing industry as recorded in the social survey (sample = 502 EG
fishers).
Figure H5: Frequency plot of years fished by EG fishers in NSW fishing industry (Source:NSWF, SS).
8
48
42
79 80
68
60 61
38
16
2
0
10
20
30
40
50
60
70
80
90
<1 1-5 6-10 11-15 16-20 21-25 26-30 31-40 41-50 51-60 >60
Years fished
Fre
qu
ency

Social Issues: Estuary General Dominion Consulting Pty Ltd
12 14/11/01
Both private and social capital are potentially seen in family involvement in fishing. Fishers
were asked how many generations their family had been in the NSW Fishing industry and
results are reported in Figure H6.
Figure H6: Frequency plot of number of generations in the EG Fishery (Source: Roy Morgan- SS).
There are 47% of fishers who are first generation fishers, 21% who are second generation and
that 32% of EG fishers were 3rd or more generation. The 47% of first generation fishers,
reflect entrants who may be more capable of adjustment, than multi-generational fishing
family members. There are 53% of fishers with a 2 or more generations of involvement in
fishing, which may indicate longer term social association and integration with communities
and potential to be significant contributors to social capital.
Age profile of licenced EG fishers
The ages obtained from licence records of fishers operating in the 1999-2000 period are
reported in Figure H7. For 630 records the mean age is 47.1yrs, with a standard deviation of
12.7 years. Of these, 19% are aged greater than 60 years and will be entitled to the age
pension within the lifetime of the FMS.
237
107
84
48
169
0
50
100
150
200
250
first second third fourth fifth >five
Generations
Fre
qu
ency

Social Issues: Estuary General Dominion Consulting Pty Ltd
13 14/11/01
Figure H7: Age distribution of all EG fishers (Source: NSWF licence records).
4
16
34
52
81
89 91 89
55
62
29
18
62 2
7
0
10
20
30
40
50
60
70
80
90
100
15-19
20-24
25-29
30-34
35-39
40-44
45-49
50-54
55-59
60-64
65-69
70-74
75-79
80-84
85-89
UNK
Age
Fre
quen
cy
Skill base among fishers
The extent of part-time and full-time fishing is reported in the economic issues Chapter G,
Table G9. The fisher skills base was investigated through questions in the social survey.
Fishers were asked about their current work in other industries and their capacity and
willingness to transfer from fishing to other industries. Of 100 EG fishers (from 502
interviewed) who were undertaking paid work outside the industry:
• 32% would consider earning all their income from that other industry,• 58% would not and• 10% were undecided.
All 502 EG fishers were asked about their capacity to consider alternative employment:
• 14% (70) could get full-time employment outside fishing• 12% (60) could get part-time employment outside fishing and• 71% (354) could not get employed outside fishing – fishing is “all I know”.• 3% (18) Don’t know/ can’t say.
The 354 fishers from 502 who answered “I probably could not get employed outside fishing,
as fishing is all I know” were asked if they would consider retraining. A total of 21% (73)
would consider retraining and 73% (258) would not. The 281 fishers who would not consider
training were asked about their reasons and this information is given in Table H6. Participants
generally gave more than one response.
Age was the major reason for not considering retraining for 30% of the sample, followed by
only having experience in the fishing industry. Both of these are inhibitors to the mobility of
labour.

Social Issues: Estuary General Dominion Consulting Pty Ltd
14 14/11/01
Table H6: Reasons for not considering retraining to industries outside fishing (Source: RM-SS).
Those who indicated a willingness to retrain were asked about their interest in retraining into
other industries. The results are reported in Table H7.
Table H7: Industries which fisher would consider retraining into (Source: RM-SS).
Discussion
The social survey information show the EG fishers to be dependant on the fishing industry
with approximately 70% of fishers indicating they have limited capacity or willingness to
move from fishing to other employment. Approximately 26% would be able to consider
retraining, but of the 70% who would not, experience, age, education and a high level of
fishers self identification, inhibit fishers’ capacity to move to other industries. This “physic
income” from fishing is highly regarded by fishers, who do not feel they would be satisfied by
other work in this way. This reduces fisher mobility in the work force.
There has been little investigation of fisher mobility in the Australian fishing industry, but
some notable social studies such Bell and Nalson’s seminal study in 1974, focus on issues for
NSW dairy farmers facing industry viability and restructuring issues. Farmers were found to
EG %Building 5 6%Landscaping 1 1%Electrical/Plumbing 1 1%Farming 1 1%Charter fishing 6 8%Retailing 3 4%Tourism 6 8%Government 2 3%Other 29 36%Can't say 26 33%Total answers 80 100%n= 73
EG %Fishing is only industry I know 103 23%I'm too old 138 30%I enjoy fishing 92 20%I've invested in equipment 34 7%It’s a family business 33 7%Bad health/injuries 14 3%Risk of unemployment 9 2%Illiterate/Low education 8 2%Language barrier 2 0%Other 22 5%Can't say 2 0%Total answers 457 100%n= 281

Social Issues: Estuary General Dominion Consulting Pty Ltd
15 14/11/01
have strong identification with the land, farming and had low mobility. A range of quote
about the mobility of farmers from Bell and Nalson, (1974) is presented in Box H3 and may
apply to fishers in the EG.
Box H3: Quotes on social mobility issues for dairy farmers in northern NSW (Bell and
Nalson, 1974).
It is not necessarily the worst farmers who leave the industry, but those who recognise other opportunities andare prepared to take the risk of turning to some other occupation. …..those that remain could well be a hard coreof residue of economically and socially depressed farmers.
Farmers with off farm work were less inclined to be in poverty, compared with those without dual occupations.Few respondents had alternative work. Social explanations are that farmers are farmers by tradition and it mayalso reflect lack of available opportunities for alternative work in different areas.
Social reasons for exiting farming may be the long hours involved in the industry, affording little leisure time,the advanced age of respondents and their wives, a potential labour shortage through sons leaving the industry,and reasons such as sickness and disputes around farming issues.
Old farmers with no one following in the business were not prepared to invest in new equipment.
Parents may not be encouraging children into the industry, but encourage education etc.
“Retreat farming” with the farmer holding on until eligible to receive the old age pension. Wife dissatisfaction isa major social influence in the dairy sector.
Many respondents were third generation and value farming as a way of life. With the independence it affords,are loath to leave their local social environment, friends, neighbours and relatives and the voluntary associationsin which they have been active.
Away from farming they will have to compete with others for land based jobs. There may be a shortage of part-time labouring jobs.
Notes the intergenerational nature of occupational mobility with most farmers transferring from one type offarming to another. Socially many farmers stay within 30 miles of place of birth. These ties may preventfarmers taking opportunities outside their area.
Farmers are independent and have a history of shunning government initiatives preferring voluntary adjustment.They also tend to shun the CES (Commonwealth Employment Service) and rely on their own initiative.
A study analogous to the Bell and Nalson study is required across all fishers in NSW to
confirm this material. There are significant social issues for fishers below retirement age
seeking other employment. These will vary from area to area as indicated later in the social
assessment.
Regions fished and regional unemployment statistics.
The regional importance of the EG fishery to the local community is reported in Table H1 and
H2.

Social Issues: Estuary General Dominion Consulting Pty Ltd
16 14/11/01
Unemployment data is available from current ABS statistics (ABS, 2001) only at a more
aggregated level than the 1996 census data, which is available for each postcode. Table H8a
reports recent ABS unemployment data as of February 2001 for rural areas of coastal NSW.
Table H8a: ABS statistical regions and rural coastal area male unemployment (ABS,Feb. 2001).
Labour force Unemployed Feb. 2001('000) ('000) % Male
Richmond-Tweed & Mid-North Coast SRs 106.1 15.8 14.9%Gosford -Wyong SR 71.4 6.2 8.7%Hunter SR 171.8 18.1 10.5%Newcastle SR 149.8 17.4 10.5%Sydney - - 6.0%Illawarra SR 112.2 8.4 7.5%South Eastern SR 152.9 12.2 8.0%NSW Total 7.2%Key: SR- Statistical Region (ABS,2001).
Regional unemployment data indicates higher rates of unemployment in areas away from
Sydney, being higher in the north than in the south. Male unemployment by age group also
varies in NSW as reported in Table H8b.
Table H8b: Percentage male unemployment in NSW (ABS, Feb. 2001).Age 15-19 20-24 25-34 35-44 45-54 55 and over% 21.9 10.6 6.6 5 4.8 4.9
The fishing population in the EG fishery is almost entirely male with approximately 11
female fishers (from 1,003). More detailed statistics for unemployment by regional postcode
are available from ABS 1996 census statistics in Table H2, and are reported on maps in
Appendix H4. This gives a longer term view of regional unemployment in postcodes of
coastal NSW.
Fisher numbers and unemployment at the postcode level are reported in Table H1 and H2.
The range of unemployment is from 7% in Sydney, to 27% in Woombah/Others area in the
Clarence region. As approximately 80% of EG fishers are living north of Sydney, the issue of
unemployment is significant for any EG fishers displaced by the FMS, particularly in the
Richmond and Mid north coast statistical region which includes the fishers in the Clarence
community.
Social Issues: Estuary General Dominion Consulting Pty Ltd
17 14/11/01
(ii) community views and perceptions
Views of community
The EG fishers are a part of the rural coastal NSW community. Many of the public are aware
commercial fishers exist, but given many fishing activities are undertaken at first light, their
fishing activities are not generally visible. Definitive public views are also difficult to obtain
given the differing views on fishing issues within the community.
A public telephone survey was undertaken by Roy Morgan in 1999 investigating general
community attitudes to a recreational fishing licence. There was a general community concern
that the estuary environment should be looked after. The Roy Morgan (1999) survey of 500
persons in NSW indicated that 95% of person felt it was important “that our fish stocks are
well looked after”. In the same survey 44% of responses prioritise “looking after the
environment” as the most important aspect of managing fisheries.
Other opinions from the public, have been part of the Recreational Fishing Area (RFA)
process. The views reflect the context of the RFA debate and are not cited here.
Local Council policies suggest the public are concerned over fish odours and wastes
associated with commercial and recreational fish landing sites and the potential loss of local
amenity. The community expect EG fishers to provide fresh seafood for the majority of the
population who do not catch their own fish.
There is conflict on the perceptions of commercial fishing and the environmental damage it
may cause. Anglers in the community are aware of hauling and netting taking place, and are
concerned that fish are being taken in large numbers reducing recreational amenity and
opportunities. This can lead to conflict between different commercial fishers and between
commercial and recreational fishers. Some concerns are being addressed through the
Recreational Fishing Area process in which some areas will be set aside for recreational
fishers. Further work is needed to gain an on-going independent view of the community’s
views on fishing issues.

Social Issues: Estuary General Dominion Consulting Pty Ltd
18 14/11/01
(c) Identify current interaction of commercial fishing with the community including
(i) other recreational activities – boating, swimming, diving, whale/seal watching
and other eco-tourism activities, discuss the potential for conflicts and synergies on
a regional/subregional basis through interaction with recreational fishers, eco-
tourism and related activities;
Regional marine leisure activity and integrated sea use between competing user groups
Coastal NSW has a great diversity in marine leisure activities. There is no definitive study on
marine leisure activities in NSW coastal regions, but they tend to follow population
distributions, or population movements, such as annual holidays to estuary regions.
Charter fishing usually goes offshore, but uses estuaries for some types of fishing, depending
on the region. There is little formal whale watching activity, but general pleasure cruises
occur in tourist venues close to Sydney (eg. Port Stephens etc). Recreational boating takes
place along the NSW coast, but also in estuaries where many sail schools and water skiing
activities prefer the shelter of the estuary environment. Diving takes place along the coast and
in estuaries, where spear fishing may also take place or be subject to restrictions.
The potential for conflict is minimised by commercial fishers not fishing openly at times of
high tourist activity, or only fishing in areas not frequented by tourists. Tourists enjoy the fish
and prawns cooked at the local fish shop or Coop, as evidenced by seafood sales in tourist
destinations, but are also concerned over loss of environmental amenity (Roy Morgan, 1999).
The high volume of traffic on Sydney Harbour and Botany Bay have led to the issue of
section 37 permits to allow fishers to sink the head gear (floats) of their traps. This is both a
safety and amenity issue.
(ii) the visual and amenity issues
The estuary fishers can both contribute and detract from visual amenity. Tourists expect to
see a few small working boats pulled ashore on the edge of the estuary, but may object to fish
odours, nets drying and fish offal/ frames disposed of in inappropriate ways, such as on shore.
Similarly, processing establishments and recreational fish cleaning areas can attract pelicans
and birds to feed on scraps, which may not be seen as a visual or health amenity. This can be

Social Issues: Estuary General Dominion Consulting Pty Ltd
19 14/11/01
related to fish sorting practices which can leave small numbers of dead fish washed up on
shore. Many of these issues can be addressed at the local council level.

Social Issues: Estuary General Dominion Consulting Pty Ltd
20 14/11/01
(2) Likely social implications of implementing the plan
Introduction
This section evaluates the social impacts of implementing the EG Fisheries Management
Strategy according to the criteria set out in the DUAP Director’s guidelines document. Social
impact assessment (SIA) of fishery management plans has not previously been undertaken in
NSW. This is not a social study of the NSW fishing industry, but an assessment of social
issues under the DUAP Director’s guidelines related to the implementation of the EG FMS.
The analysis is constrained by the available information, the resources available to the study
and the lack of background information in this emerging area.
There is not an accepted fishery specific methodology to assessing social issues and relevant
approaches are available from other natural resource industries. In the NSW Government’s
Guidelines for assessing social impacts (NSW Government 1997b) the following measure of
community well being are recommended:
• Economic and financial measures - income measures, poverty lines, household
expenditure, unemployment rates and indicators of business activity;
• Quality of life measures - leisure time, air and water quality, rates of illness and life
expectancy, educational attainment levels, housing size and density, availability of social
services;
• An assessment of intangible factors- quality of life measures, such as community spirit,
levels of social cohesion, confidence in public institutions and intangible aspects of social
well being including “social capital”.
The NSW Government guidelines indicate there is no one measure of social well being and
that while economic measures dominate many assessments, the quality of life measures and
intangibles should be considered in policy assessment. Governments can use social
assessments to “better anticipate the effects on policies and programs”. When social impacts
are made more transparent, policy trade-offs are highlighted and subsidiary policies to deal
with negative impacts on particular areas and groups may be formulated” (NSW Government,
1997b). The social impact assessment in fisheries management plans in Australia is a new
development.

Social Issues: Estuary General Dominion Consulting Pty Ltd
21 14/11/01
Methods of Social Impact Assessment (SIA)
The NSW Government Guidelines suggest “it is not possible to establish a single SIA
methodology to apply at a state-wide policy and program level because of the nature and
impact of the policies often extend across regions and groups” (NSW Government, 1997b,
p9). The guidelines set a broad perspective or framework for social assessment summarised
in a “quick test summary table” (NSW Government, 1997b, p23) as shown in Box H4.
Box H4: Quick test summary table (adapted from NSW Government, 1997b, p23).
1)Describe the policy objective
2) Identify the social impacts of the proposed policy
3) Measuring change and social impacts
4) Evaluating social impacts and social justice principles
5) Responding to impacts (monitoring, management and mitigation)
Further Government guidelines extend to the Rural Community Impacts Statements (NSW
Government 1997a). In these the economic and social characteristics of rural communities in
NSW are specifically recognised and recommended to be included in government decision
making as summarised in Box H5. It is likely that rural fishing communities in coastal NSW
struggle with similar issues.
Box H5: Summary of Characteristics Rural Communities after NSW Government, (1997a).
Geographic isolation - business being based at a distance from suppliers or markets;
A narrow and variable economic base- being dependant on one industry, coal mining,
forestry, fishing etc, also being influence by public sector employment changes;
Physical isolation and small population size – individual families may live outside
community centres and a greater distance from a more substantial regional service centre.
Isolation limits social interaction, cultural and employment opportunities and access to public
sector services and facilities. Communities may have small populations and express feelings
of vulnerability being at a distance from the central decision making process.
A strong ‘self help’ culture – rural and regional communities are often “typified by values of
self reliance, resourcefulness and independence, often responding to opportunities or threats
with a strong and cohesive communal spirit”.

Social Issues: Estuary General Dominion Consulting Pty Ltd
22 14/11/01
A strong attachment to place – strong emotional/cultural attachments to as geographical
location or place.
Rural industries have a major impact in the environment - rural and regional
communities are custodians of most of the land of the state and intensively use natural
resources.
Economic performance is dependent on environmental conditions – primary industries
depend on environmental resources used as their inputs.
Social impacts and fisheries management
The social impact assessment of Fisheries management strategies in NSW is a new
development and requires some adaptation of accepted analytical frameworks for assessment
to suit the fisheries issues and to fulfil the DUAP Director’s guidelines. In natural resource
studies a four stage procedural framework is proposed by Fenton et al. (2000) as: Assessment
(including scoping and profiling); Prediction; Mitigation; and Monitoring.
These steps concur with the DUAP and NSW Government Social Impact guidelines (NSW
Government 1997b). However, the appraisal of social impacts of management of a natural
resource also needs to incorporate the linkages between the changes in the social system
induced by management and the affect on the resource system, and how changes in the
resource system impact the social system. Fenton et al. (2000) recommend that the direction,
strength, duration and positive and negative effects of the social system/resource system
interactions, also need to be recognised. This can happen at several levels, but has a high
information requirement beyond the scope of the current study and is recommended work in
section 3.
Assessment of the social impacts of the FMS
It is proposed that the following approach will be taken to analysis of social impacts of the
fisheries management strategy against the DUAP Director’s guidelines under section H2.2.
Social issues arising from implementing a new management plan fall into several categories.
Firstly, there are socio-economic impacts arising directly from how the fisheries management
strategy impacts the resource and the social system, including the community. Secondly, a
plan brings change with social issues to be addressed by fishers. The socio-economic impacts
are most readily quantified. Other measures of the capacity and willingness of fishers to

Social Issues: Estuary General Dominion Consulting Pty Ltd
23 14/11/01
respond or incorporate change are more difficult to estimate requiring substantial fisher
consultation and communication.
The current study prioritises the socio-economic impacts from the FMS. Other elements may
be deemed to be important to individual fishers, but there is insufficient baseline information
to independently evaluate fishers’ opinions. The intention in a co-management consultation
process, is that the development of the FMS has taken the fisher’s viewpoint into account
through the management advisory committee system and port meetings, outlining the
intention of the FMS.
The following procedure was used to identify and rank social impacts. The fisheries
management objective, with potential social impact and the response under the management
strategy, are described and presented in Table form.
The generic social impacts of each management strategic response are identified on fishers
and the community and responses ranked into two levels of impacts – Higher and Lower. The
ranking will reflect the predicted scale of social impact. For example, social impact may be
determined as a function of the number of fishers affected by a policy, times the degree of
impact of the policy on each fisher, or on the community. From this, the most highly
impacting social issues are identified. Low impact social issues will be discussed generically.
The assessment
The management goals and the responses in the FMS were examined and those with potential
social impacts are presented Table H9. They were then ranked in order of estimated social
impact. Priority was given to the socio-economic dislocation arising from impacts identified
in the previous economic assessment, given their potential impact greatest numbers of fishers
and families in the fishing community.
Ranked second after socio-economic dislocation, are social impacts with implications for
fisher practices, the community, or which may be socially contentious, or require social
cooperation. There are numerous responses which have social implications for industry
harvesting practices, compliance issues and communication within the fishing community.
The numerous responses are socially impacting in that the failure of codes of conduct of gear,
compliance and communication will adversely impact the co-management process and hence
management of the fishery, to the detriment of the community. These issues are central to the
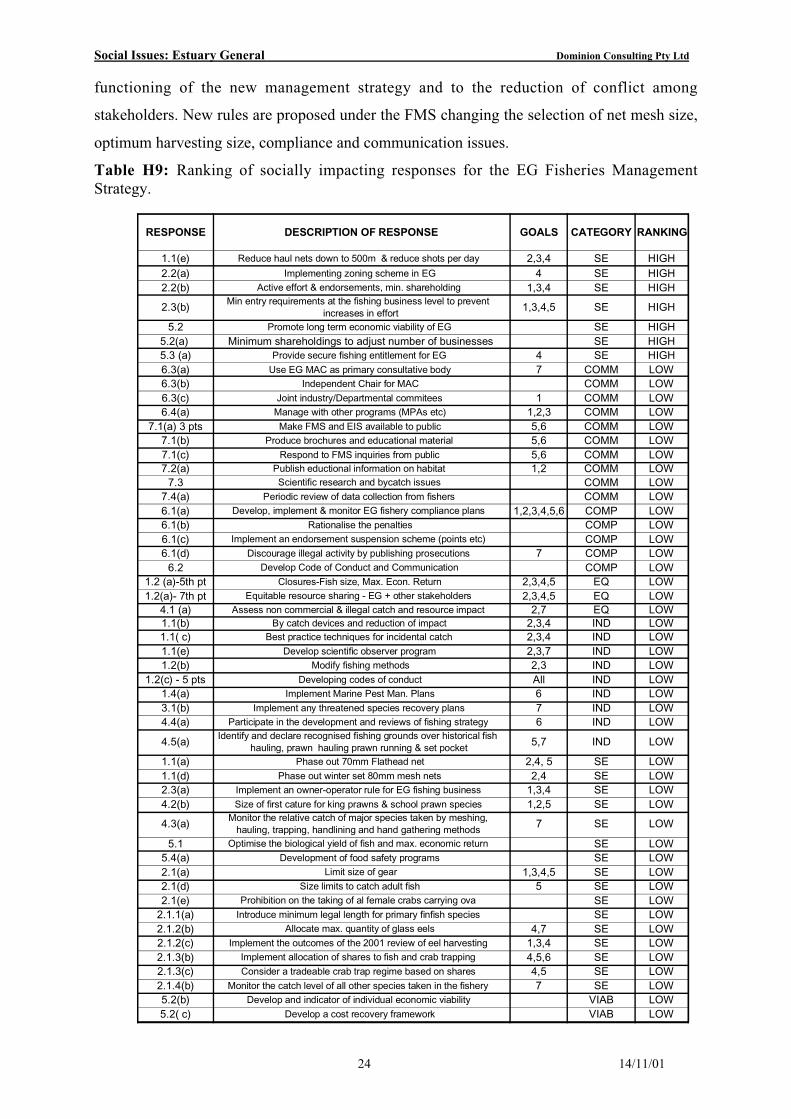
Social Issues: Estuary General Dominion Consulting Pty Ltd
24 14/11/01
functioning of the new management strategy and to the reduction of conflict among
stakeholders. New rules are proposed under the FMS changing the selection of net mesh size,
optimum harvesting size, compliance and communication issues.
Table H9: Ranking of socially impacting responses for the EG Fisheries ManagementStrategy.
RESPONSE DESCRIPTION OF RESPONSE GOALS CATEGORY RANKING
1.1(e) Reduce haul nets down to 500m & reduce shots per day 2,3,4 SE HIGH2.2(a) Implementing zoning scheme in EG 4 SE HIGH2.2(b) Active effort & endorsements, min. shareholding 1,3,4 SE HIGH
2.3(b)Min entry requirements at the fishing business level to prevent
increases in effort 1,3,4,5 SE HIGH
5.2 Promote long term economic viability of EG SE HIGH5.2(a) Minimum shareholdings to adjust number of businesses SE HIGH5.3 (a) Provide secure fishing entitlement for EG 4 SE HIGH6.3(a) Use EG MAC as primary consultative body 7 COMM LOW6.3(b) Independent Chair for MAC COMM LOW6.3(c) Joint industry/Departmental commitees 1 COMM LOW6.4(a) Manage with other programs (MPAs etc) 1,2,3 COMM LOW
7.1(a) 3 pts Make FMS and EIS available to public 5,6 COMM LOW7.1(b) Produce brochures and educational material 5,6 COMM LOW7.1(c) Respond to FMS inquiries from public 5,6 COMM LOW7.2(a) Publish eductional information on habitat 1,2 COMM LOW
7.3 Scientific research and bycatch issues COMM LOW7.4(a) Periodic review of data collection from fishers COMM LOW6.1(a) Develop, implement & monitor EG fishery compliance plans 1,2,3,4,5,6 COMP LOW6.1(b) Rationalise the penalties COMP LOW6.1(c) Implement an endorsement suspension scheme (points etc) COMP LOW6.1(d) Discourage illegal activity by publishing prosecutions 7 COMP LOW
6.2 Develop Code of Conduct and Communication COMP LOW1.2 (a)-5th pt Closures-Fish size, Max. Econ. Return 2,3,4,5 EQ LOW1.2(a)- 7th pt Equitable resource sharing - EG + other stakeholders 2,3,4,5 EQ LOW
4.1 (a) Assess non commercial & illegal catch and resource impact 2,7 EQ LOW1.1(b) By catch devices and reduction of impact 2,3,4 IND LOW1.1( c) Best practice techniques for incidental catch 2,3,4 IND LOW1.1(e) Develop scientific observer program 2,3,7 IND LOW1.2(b) Modify fishing methods 2,3 IND LOW
1.2(c) - 5 pts Developing codes of conduct All IND LOW1.4(a) Implement Marine Pest Man. Plans 6 IND LOW3.1(b) Implement any threatened species recovery plans 7 IND LOW4.4(a) Participate in the development and reviews of fishing strategy 6 IND LOW
4.5(a)Identify and declare recognised fishing grounds over historical fish
hauling, prawn hauling prawn running & set pocket5,7 IND LOW
1.1(a) Phase out 70mm Flathead net 2,4, 5 SE LOW1.1(d) Phase out winter set 80mm mesh nets 2,4 SE LOW2.3(a) Implement an owner-operator rule for EG fishing business 1,3,4 SE LOW4.2(b) Size of first cature for king prawns & school prawn species 1,2,5 SE LOW
4.3(a)Monitor the relative catch of major species taken by meshing,
hauling, trapping, handlining and hand gathering methods7 SE LOW
5.1 Optimise the biological yield of fish and max. economic return SE LOW5.4(a) Development of food safety programs SE LOW2.1(a) Limit size of gear 1,3,4,5 SE LOW2.1(d) Size limits to catch adult fish 5 SE LOW2.1(e) Prohibition on the taking of al female crabs carrying ova SE LOW
2.1.1(a) Introduce minimum legal length for primary finfish species SE LOW2.1.2(b) Allocate max. quantity of glass eels 4,7 SE LOW2.1.2(c) Implement the outcomes of the 2001 review of eel harvesting 1,3,4 SE LOW2.1.3(b) Implement allocation of shares to fish and crab trapping 4,5,6 SE LOW2.1.3(c) Consider a tradeable crab trap regime based on shares 4,5 SE LOW2.1.4(b) Monitor the catch level of all other species taken in the fishery 7 SE LOW5.2(b) Develop and indicator of individual economic viability VIAB LOW5.2( c) Develop a cost recovery framework VIAB LOW

Social Issues: Estuary General Dominion Consulting Pty Ltd
25 14/11/01
Categories: SE socio-economic, COMM Communication, COMP Compliance, EQ Equity, IND Industrypractices; VIAB: viability.
2.1 Health issues - NOT IN TOR
2.2 Social implications for fishers of any changes in resource allocations
(b) predict the likely social implications of maintaining the present resource allocation rules.
The current rules in the EG fishery socially impact fishers in several ways.
The high number of entitlements and low catches among businesses, evidenced by 50% of the
fishers taking 10% of the fishery value, reflects a diverse rural industry where many fishers
are part-time and earn limited income from Estuary General fishing. Many fishers are
dependant on fishing, as both a business, family occupation and as a way of life. This
probably includes fishing to provide food for families, fishers selling most of the catch and
retaining some for private or family consumption. Part-time fishers also access many seasonal
opportunities in the EG fishery for specific species groups, such as prawns.
Maintaining the present rules means that over the next five years there will be many older,
low or non catching commercial fishers who will not readily be able to financially realise the
value of their fishing endorsement or business. The move to shareholdings will enable fishers
to exit the fishery with a payment and to enable another fisher to consolidate their business.
Conflict between fishers and between commercial fishers and with the recreational sector, is
also a concern under current management arrangements. Much of the inter industry conflict
stems from access to fishing areas and the unlimited access of fishers from other areas to local
fishing areas. The plan proposes to address this by zoning fishers into regions, thus also
creating more local involvement in management issues and harvesting.
Social conflict between industry and other sectors, such as recreationalists and the community
would probably increase undercurrent management arrangements. The Recreational Fishing
Area process is in response to this and is a process parallel to, but independent of the FMS.
The FMS seeks to reduce commercial and recreational fishing conflict.

Social Issues: Estuary General Dominion Consulting Pty Ltd
26 14/11/01
(c) outline any implications on fishers, their families or any local communities from any
changes in the resource allocations including the likely social impacts on particular
sectors (eg in certain locations, sub-regions or regions) if changes in the resource
allocations were implemented; outline any possible measures which could be taken to
mitigate any impacts
Implications of FMS changes
Significant social impacts are identified from Table H9 in the FMS. The implications of major
impacts are examined on fishers, families and communities.
Zoning of fishers
The implementation of the two stage zonation process (explained in section G) will reduce
conflict, but will also alter fisher lifestyles and may have socio-economic impacts on up to 80-
90 fishers. Under stage 1, 150 applicants wished their zoning to be reconsidered, of which
33% mentioned economic impacts, 40% alteration of their fishing operations and the balance,
23% indicated their general disapproval (source: NSWF zoning appeals). Under stage 1, 84
fishers have been able to keep access to estuaries beyond their primary region, though under
stage 2 fishers may be limited to one zone, or smaller areas.
The fishers in the social survey who stated they travelled more than 50km per day, were
examined to distinguish their social characteristics and to envisage potential social impacts as
presented in case 1.
Social impact: the case of travelling fishers
The travelling fishers interviewed in the social survey operated in Tweed-Richmond,
Clarence, Hunter, Wallis Lake, Tuggerah Lakes, Lake Illawarra, Bateman’s Bay and
Ulladulla and several other small areas. Of 42 fishers interviewed, queries on the social
survey database revealed these travelling fishers have the following characteristics:
• more than 5 years fishing experience, 62% having fished up to 25 years;
• 60% had gross incomes of over $40,000 per year, only 12% (5) earning outside fishing;
• evidence of recent outboard, nets, boat and ute/car purchases more than $1,000;

Social Issues: Estuary General Dominion Consulting Pty Ltd
27 14/11/01
• Dependants- 14 had no dependent children and the others had 34 dependent children
under 16 years. 28% had a dependant spouse.
• 71% considered they would not be able to get work outside fishing and 33% considered
themselves too old to retrain.
The case profile of travelling fishers indicates a group of predominantly full time fishers who
will be economically and socially impacted by the zoning policy. This policy will require
fishers to adjust. Mitigation has been applied in the form of a two step process, with an
appeals mechanism being available. Fishers should be made aware of their potential position
under stage 2 as soon as possible and if all fishers are reduced to single zone access, further
mitigating steps may be necessary. Fishers are expected to have reductions in income during
the adjustment period.
The areas of operation are in some of the most disadvantaged areas of the NSW coast
according to the SEIFA index as reported in Tables H1: Tweed-Richmond 926; Clarence 919;
Hunter 933; Wallis Lake 939; Tuggerah Lakes 977; Lake Illawarra 935; Bateman’s Bay 958;
and Ulladulla 942.
It is essential that the FMS monitors impacts on these fishers and regions as the FMS is
implemented.
Reduction in haul nets
Reduction in hauling nets sizes from 1,000m and 725m, to 500m, has the capacity to impact
up to as many 20-30 fishers in estuaries where larger scale hauling is permitted. The impacts
on some fishers with higher dependence on estuarine hauling would be a significant alteration
in operational style, with competition from other smaller haulers and a reduction in the gross
value of catch. For a few fishers highly dependant on larger hauling net fishing, the social
impact would be a significant inconvenience and adjustment to smaller hauling net use.
It is unlikely that fishers would be displaced from the fishery, but they will have their income
reduced. The SEIFA index of disadvantage in impacted areas are: St. George 1,047; Lake
Illawarra 935; Botany Bay 1,047; Lake Macquarie 977; Tuggerah Lakes 977; and Wallis
Lakes 939. This with other social index data, illustrates the need to monitor these
communities as the policy is implemented.
Mitigation for this policy may be to implement the reduction from 1,000m to 725m and then
to appraise impacts, before further reduction to 500m. Continuation with the proposal would

Social Issues: Estuary General Dominion Consulting Pty Ltd
28 14/11/01
require the reduction of the welfare of impacted haul netters, to be reduced by a remedial
policy initiative from NSWF who proposed the change.
Managing by minimum shareholdings
The FMS proposes to address industry viability and capacity through the implementation of
category 2 share management and the use of minimum shareholdings at the business and
endorsement level. Estimates of adjustment in the EG fishery in the economic issues section
(Chapter G) indicate that 141 businesses may be removed by share trading in the 2001-2006
period. At the endorsement level, the change to shares will also impact fishers who hold EG
endorsements. A 15% rate of increase in minimum shareholding over five years would lead to
15% of 1,003 endorsed fishers, potentially 150 fishers being displaced. Some of these fishers
would be latent effort holders and some active effort holders.
It is likely that the impact of adjustments at the business and endorsement level will
cumulative. For example, it is likely that some endorsement adjustments would lead to a
business exiting the fishery. A combined impact of 20% is estimated2. It is predicted that the
removed businesses would be a mix of latent effort holders, and fishers who catch below
$10,000 per year. The profile of these groups was investigated via the social survey and
results reported in Appendix 3.
Discussion
Regional impacts can be estimated from the information reported from ABS social data in
Table H1. The impacts of a greater than 15% reduction, say 20% in fisher numbers across the
EG fishing communities is assumed, due to no way to predict who sells businesses or
endorsements. A 20% reduction in EG fisher numbers is reported in Table H10.
2 If business adjustment removes 15% of businesses, this will remove endorsements also. Then the 15%adjustment of endorsement numbers will be more easily reached. The net effect will be greater than 15% andmuch less than 30%. 20% is used as an estimate.

Social Issues: Estuary General Dominion Consulting Pty Ltd
29 14/11/01
Table H10: Summary table of social indices for EG fishers with an estimated reduction of
20% in fisher numbers shown by district and zone
The number of EG fishers in zone 2, (Clarence) and zone 4, (Manning to Central Coast) are
highest.
An estimate of EG fishing community vulnerability to social and economic impacts is
reported in Table H11. This ranks EG fishers as proportion of labour force, ranked highest to
lowest to show dependence, and the SEIFA index, ranked lowest to highest to show relative
disadvantage. They are combined to give a joint ranking of community vulnerability.
Table H11: Joint ranking of community vulnerability for EG fishers, (from ABS and NSWF
data).
Zone Home DistrictP'code
PopulationP'code Fishers
EG P'code Fishers
20% of EG
fishers no's
Unemployed (%)
SEIFA Med. Ind.
Income (wk)
Employed in C.F. as
(%) of labour force
Employed in EG as
(%) of labour force
1 TWEED 41,938 63 26 5.2 16.9 922 250 0.4 0.2RICHMOND 28,558 87 31 6.2 16.6 930 227 0.9 0.3Zone 70,496 150 57 11.4 16.8 926 238 0.6 0.2
2 CLARENCE 43,353 259 139 27.8 18.8 919 222 3.1 1.73 COFFS HARBOUR 55,625 110 30 6 18.8 940 215 0.7 0.2
HASTINGS 61,291 90 45 9 17.7 936 227 0.7 0.3Zone 116,916 200 75 15 18.4 938 220 0.7 0.3
4 MANNING 37,878 80 48 9.6 17.5 914 203 0.7 0.4WALLIS LAKE 22,704 105 76 15.2 14.8 939 250 2.8 2.0PORT STEPHENS 52,562 101 43 8.6 13.0 967 250 1.3 0.6HUNTER 52,557 55 26 5.2 13.8 933 233 0.2 0.1CENTRAL COAST 206,143 102 76 15.2 10.6 977 267 0.0 0.0Zone 371,844 443 269 53.8 13.3 951 244 0.7 0.4
5 HAWKESBURY 2,380 30 12 2.4 7.4 1004 300 0.0 0.0SYDNEY 3,276,207 189 72 14.4 7.3 1047 350 0.0 0.0Zone 3,278,587 219 84 16.8 7.4 1019 317 0.0 0.0
6 ILLAWARRA 65,532 50 25 5 14.5 935 215 0.1 0.1SHOALHAVEN 53,871 75 46 9.2 15.1 945 215 0.8 0.5Zone 119,403 125 71 14.2 14.7 938 215 0.4 0.2
7 BATEMANS BAY 34,836 105 38 7.6 17.0 958 227 1.2 0.4MONTAGUE 8,135 53 13 2.6 15.9 955 180 1.5 0.4FAR SOUTH COAST 3,726 61 6 1.2 12.1 916 250 2.6 0.3Zone 46,697 219 57 11.4 15.8 949 222 1.5 0.4
Grand Total 4,047,296 1615 752 150.4 15.1 945 236 0.9 0.4
District
Employed in EG as
(%) of labour force
Rank labour
SEIFARank SEIFA
Joint rank score
CLARENCE 1.7 2 919 1 2WALLIS LAKE 2.0 1 939 3 3FAR SOUTH COAST 0.3 6 916 1 6COFFS HARBOUR 0.2 3 940 4 12HASTINGS 0.3 4 936 3 12TWEED 0.2 7 922 2 14SHOALHAVEN 0.5 4 945 4 16RICHMOND 0.3 6 930 3 18MANNING 0.4 6 914 3 18PORT STEPHENS 0.6 3 967 6 18HUNTER 0.1 8 933 3 24ILLAWARRA 0.1 8 935 3 24BATEMANS BAY 0.4 5 958 5 25MONTAGUE 0.4 5 955 5 25CENTRAL COAST 0.0 9 977 7 63HAWKESBURY 0.0 9 1004 10 90SYDNEY 0.0 9 1047 10 90

Social Issues: Estuary General Dominion Consulting Pty Ltd
30 14/11/01
Table H10 indicates the potential impact on fishing communities of a 20% reduction in fisher
numbers. Table H11 is an index of the vulnerability of EG fishing communities generated
from ranking of community dependence and the ranked SEIFA index giving each equal
weighting.
This indicates that the EG fishing communities in Clarence, Wallis Lake and the Far South
Coast are most vulnerable to changes from the plan given their higher dependence, lower
SEIFA score, or a combination of both. For these communities, high unemployment, such as
seen in the Clarence, also indicates potential difficultly in fishers finding alternative
employment.
It is apparent in Table H11, that outside of Sydney and the Hawkesbury, EG fisher
communities are more vulnerable to changes in their economic well being. This does not
mean that fishing families in the Sydney/Hawkesbury area are less impacted by the share
trading, but that these communities have more socio-economic alternatives than small rural
isolated communities in coastal NSW. Table H2 presents SEIFA data for areas at the post
code region. Those postcodes within vulnerable districts with low SEIFA indices are
identifiable and illustrate how small numbers of fishers in certain postcodes are vulnerable to
socio-economic impacts. For example, Woombah in the Clarence region with SEIFA 864 and
unemployment of 27.2% in the 1996 census (see Table H2)3.
Under the FMS trading fishers can sell shares and receive a payment. This opportunity to exit
may be taken by fishers over 60 years of age as a “superannuation package”. Licence records
indicate that approximately 125 of 640 fishers (20%) are likely candidates. This indicates that
the desired 20% adjustment in the fishery, could be filled by elderly fishers alone.
The majority of fishers are below 60 years of age and wish to operate in EG fishing as a
business or way of life. The results of the social survey indicate that both business and
lifestyle are important aspects of familial and social identity among fishers. Some fishers are
rural, low income part-time fishers, representing a “cottage industry”, rather than the
3 As noted in Appendix 1, the Tables combining ABS and NSWF licence data are for postcodes with more than10 NSW fishers. In the EG analysis approximately another 20% of fishers live in postcodes with fewer than 10fishers in the NSW fishing industry. The EG analysis does not include these 20% of fishers and theircommunities could be relatively more impacted than those postcodes with more fishers.

Social Issues: Estuary General Dominion Consulting Pty Ltd
31 14/11/01
professional full time industry proposed under the FMS. This requires further study (see
section 3).
The social impacts of displacement of 150-200 fishers over 5 years are estimated in Table
H12 using data from the social survey results in Table H3.
Table H12: The number of dependants impacted by the removal of fishers in the 2002-2007
period (Source: RM-SS).
The numbers of dependants associated with 150-200 typical EG fishers is between 220 and
294. This is an upper estimate, as if older fishers exit the fishery, then the number of
dependent children below 16 reduce substantially.
The impact of fisher displacement on the communities will also depend on catch levels, their
current contribution towards output, and their alternative income source on leaving fishing. A
multiplier of 1.5-2.0 (Dr R. Powell, pers. comm.) would apply to impacts where no other
income, including social security was available. Displacing 20% of fishers under share
management will only reduce catch by a few percent. Many of the fishers will move to other
opportunities, or to the age pension and welfare. Any negative multiplier effects from any the
change would be small in the regional economy. However, there may be local impacts in
small townships were fishers live. Payment received from selling shares may assist the local
economy, depending on the pattern of trade. Debt levels among remaining fishers would
likely rise with economic and social consequences. Should an area have a large number of
low income, elderly fishers, the impact of adjustment might be greater in that area. The
pattern of trading under share management should be monitored.
Other social impacts
Other social impacts are ranked as Low impact. Most social issues identified in Table H9
require good communication among fishers and with the community. Some FMS industry
Numbers Displaced fishers 150 200DependentsMean number of dependent children/ fisher 1.1 165 220no dependents 63% 0 0Spouse 23% 35 46Other dependents 14% 21 28Total dependents 221 294

Social Issues: Estuary General Dominion Consulting Pty Ltd
32 14/11/01
developments require the cooperation of fishers in supporting codes of conduct and food
safety initiatives.
From the social survey, there were 16% of interviewed fishers who refused to complete social
surveys. Such levels of resistance to FMS initiatives, could also impact the acceptance of new
gear rules, or codes of conduct, to the detriment of the fishery and the community. Most of the
low impact social responses in the FMS require the cooperation of fishers and management,
in order to increase compliance. The policy changes have been discussed at the EG
management Advisory Committee and through a series of port meetings about the FMS.
Fishers reactions have been noted by NSW Fisheries staff as part of the FMS consultative
process.
The reduction of conflict is a major need in the EG fishery. This involves all parties and work
needs to be undertaken in terms of social attitude and mechanisms for better cooperation
among fishers and improved interactions between fishers and management through the co-
management process. Managing by zones should help these processes to develop, but
communication and the management advisory committee process are central to reducing
conflict in the EG fishery. Estimates of social cooperation and communication are difficult to
guage in any industry when there is downward adjustment being proposed.
Many social issues are lar ger than can be resol ved by the FMS and wi ll onl y be resol ved in
longer tim e frames. For exam ple, does a “f ul l-t ime prof essional industr y” gi ve a mor e
sust ainabl e fisher y, than one compri sed of part time fi shers? The E SD aspects of this issue needs
to be exam ined nat ional ly and i s r ecomm ended in furt her work.
(d) Compare the social implications of implementing the plan or feasible alternative resource
implications options in the short, mid or longer term (if relevant, consider regional, sub-
regional or fleet issues).
(i) identify any existing or likely conflicts within or between communities
(ii) consider the affects on conflicts of any proposed changes in resource allocations
The plan will impact fishers in several ways. There are specific short and medium term
changes, such as the movement to share management, which will impact fishers directly,
forcing a decision to stay, or exit the fishery. The plan will reduce the number fishers,
impacting older fishers, latent effort endorsement holders, low income businesses and part-

Social Issues: Estuary General Dominion Consulting Pty Ltd
33 14/11/01
time fishers. Fishers with high opportunity costs may also exit. This process should be
monitored to assist in predicting impacts of implementing share management. The plan will
accelerate natural rates of fisher retirement as a payment from sales of shares is now
available.
There are also other implications for fishers in the way they operate, through the development
of codes of conduct and new regulations. This will also require social change among fishers.
Similarly fishers have new levels of cooperation in regional management initiatives with new
communication and social challenges. Many fishers will have to move from competitive
practices to more cooperative thinking in developing local operating systems.
There are conflicts among EG fishers. These will be lessened with zoning, to keep out non-
local fishers. There may be conflict between different groups of commercial fishers within
regions as new dynamics emerge as a result of shares trading. It is envisaged that share
trading will reduce conflict among fishers facilitating fishers to get their desired combination
of fishing access
Commercial and recreational fishers have also significant conflict issues. These stem from
perceptions among recreational fishers of over harvesting by the commercial sector and thus a
reduction in the chance of a recreational fisher catching a fish. The Recreational Fishing Area
process will set aside recreational fishing areas to address these concerns. The FMS seeks to
reduce recreational and commercial conflict through more control of commercial fishing
through zoning and more cooperative regional management.
Other concerns in the community are over commercial fishing methods and their destructive
impacts on the fish habitat (Roy Morgan, 1999). The FMS addresses these through several
gear regulations and a reduction in the number of fishing businesses.
(e) Identify the likely change in attitudes to compliance and the likely changes in the level of
compliance
The implementation of the FMS will bring several challenges for compliance. It is envisaged
that if the FMS responses are followed and communication and compliance are recognised in
the co-management framework, then this will assist with the levels of compliance. The move
to fishers operating in one zone will enable fishers to be more aware of fishers in their region

Social Issues: Estuary General Dominion Consulting Pty Ltd
34 14/11/01
and to mutually monitor each others fishing practices. This should help identify malpractice
for notification to the local fisheries officer.
The increases in the cost of operations and displacement of fishers, may lead to an increase in
illegal fishing. This will have to be monitored, particularly through information from fishers
in a given region. As fishers pay more for access and management, there should be an
increased sense of stewardship among fishers in a given zone. This may take time to develop.
(f) Justify the preferred approach in terms of ESD principles.
Approach will be discussed under ESD criteria.
The ESD principles for economic assessment are presented in NSW Government (1997;
annex 5) and are the precautionary principle, intergenerational equity, biodiversity principle
and the valuation principle.
The EG FMS intends to cont ai n latent ef for t and adjust act ive effort across the fi shery. The
managem ent process has previ ously had insuff ici ent economi c and soci al input and insuff ici ent
mechani sms and incentives for fisher s to adj ust ef fort. Capaci ty, in term s of eff or t and the
number of fi shers has not been suf fi cientl y addressed. The FMS addresses thi s and thus it is
meet ing the int er- gener ati onal obj ective of ESD. Im plementi ng the changes t o busi ness num bers
through mi ni mum shar eholdi ngs is also a posi tive steps in devel opi ng incenti ve and value. As
adjustm ent t akes place, the fish r esour ce shoul d start to devel op more val ue to remaini ng fi shers.
Ther e are major soci al issues that may not be suff iciently addr essed by the EG FMS . The
economi c review has indicated some comm ercially vi able fishers and many low income, par t-
ti me, life styl e fisher s. I n seeking more sust ainable resource use it is unlikely that the desire of
governm ent to create a professi onal ful l tim e fishing indust ry wil l sui t the major it y of fisher s in
the EG fishery. Fundam ent al quest ions on the nature of the est uar ine fish r esources and the most
appr opr iat e style of harvest ing need further di scussion and evaluati on under ES D cri ter ia. The
st rategy, is a fir st st ep in managem ent of t he EG fi shery under ES D pri nci pl es.

Social Issues: Estuary General Dominion Consulting Pty Ltd
35 14/11/01
(2) Data requirements in relation to the assessment of the impacts on the social issues
(a) Provide reference to technical data and other information relied upon to assess impacts; indicated
its reliability and what uncertainties (if any) are associated with the use of the data in the
assessment of the FMS
As there was little social information on commercial fishers in NSW, ABS survey data (ABS,
1996) and a Rapid Social Appraisal questionnaire (Roy Morgan, 2001b) was executed by a
telephone. This is a first step towards the formal incorporation of social information in the
management of fishers in NSW. Given the complexity of the fishery production inter-
relationships, multiple communities and political climate among industry members facing
significant allocation issues, the survey gave an over view of some social issues raised by the
FMS. The survey revealed some inconsistencies in answers involving fisher income and
these have been investigated by matching with the available Sydney index information and
preliminary results from the economic survey.
(b) Identify where there are gaps in knowledge important for the assessment of the impacts of the
fishery
The following areas require research:
• The social profile of EG fishers can be augmented through time by further studies,
preferably by community rather than just fishery.
• Regional analysis of fisher communities is a priority integrating with economic
information on the importance of the fishing activity to the community infrastructure of
towns in NSW. Other approaches examine expenditures by businesses, employees, and
examines employee residential locations and social infrastructure services and existing
social networks (Fenton and Marshall, 2001). Future social survey work should address
community structure and inter-relationships (linkages) at a regional level (Fenton et al.
2000) and articulate with regional economic studies previously recommended in section
G. Community studies would give more understanding of cumulative community impacts
through the series of fishery management strategies now being undertaken. This should be
developed in the next five years.
• Investigation of fisher community structure, part-time and full-time fishers, “professional
industry” and fisher mobility (Bell and Nalson, 1974).
• More information and measures of community views are required.

Social Issues: Estuary General Dominion Consulting Pty Ltd
36 14/11/01
• Investigation of available ABS data, and the potential development, or alteration to ABS
data surveys to gain more information for fisheries assessments.
(c) detail a timetable for developing the data sets important for understanding longer term resource
issues.
Fuller social profiles and regional analysis should be undertaken in the next five years to
assist in monitoring the impacts of adjustment and in preparation for appraisal of future
management strategies. The telephone survey information has a limited shelf life.
More complete regional industry and fishing community studies need to be undertaken
recognising the communities can be impacted through multiple fisheries management
strategies. In the longer term repeating social impact assessments for each fishery FMS, risks
ending up as a piecemeal and duplicative process, if progress is not made in more
fundamental fishery community profiling and monitoring across all fisheries in the next five
years.

Social Issues: Estuary General Dominion Consulting Pty Ltd
37 14/11/01
References
ABARE (2000). Indicators of Economic Performance in Australian Fisheries. A Report to the FisheriesResources Research Fund, October.
ABS (1996). Housing and Population Census Results. Australian Bureau of Statistics.
ABS (2000). Wages and Earnings. Australian Bureau of Statistics, 6302.0.
ABS (2001). Labour Force NSW and ACT, Australian Bureau of Statistics, 6201.1.
Bell, J.H. and J.S. Nalson (1974). Occupational and Residential Mobility of Ex-dairy Farmers on the NorthCoast of New South Wales: a Study of Alternative Occupations. Department of Sociology, University of NewEngland, Armidale.
Campbell, H.F. and R.B. Nicholl (1994). The Economics of the Japanese Tuna Fleet in Ed H.Campbell &A.Owen. The Economics of PNGs tuna fisheries. ACIAR monograph No. 28.
Dominion (2000a). Market Impacts of Estuarine Fishery Adjustment in NSW. Report to NSW Fisheries.
Dominion (2000b). Changing the Management of Fisheries in NSW. Report to NSW Fisheries.
DUAP (1997). Economic Impact Statement Manual. Department of Urban Affairs and Planning.
DUAP (2001). The Directors Guidelines, Department of Urban Affairs and Planning (final version) May 2001.
Fenton, D.M., S. Coakes and N. Marshall (2000). Social Assessment in Natural Resource Management: TheDevelopment and Application of Town Resource Cluster Analysis (TRC Analysis). CRC Reef Research Centre,James Cook University, Townsville, Queensland.
Fenton, M. and N. Marshall (2001). A Guide to the Fishers of Queensland (Draft report). CRC Reef ResearchCentre, James Cook University, Townsville, Queensland.
FMS (2001). Fisheries Management Strategy- Estuary General, NSW Fisheries.
FRDC (2000). Retail Sale and Consumption of Seafood, Fisheries Research and Development Corporation,Canberra.
Harvey, N. (1998). Environmental Impact Assessment: Procedures, Practice and Prospects in Australia. OxfordUniversity Press, Melbourne.
Hassalls and Assoc. (1999). An Economic Assessment of the NSW Abalone and Rock Lobster CommercialFisheries in NSW. A report to NSW Fisheries.
IPART (1998). Pricing Principles for Management Charges in NSW Commercial fisheries. Independent Pricingand Regulatory Tribunal of NSW, April.
Metzner, R. and P. Rawlinson (1999). Fisheries Structural Adjustment: Towards a National Framework,Commonwealth Department of Primary Industries and Energy, 1998.
McVerry, S. (1996). A Socio-economic Evaluation of the Clarence River Commercial Fisheries. Unpublishedundergraduate study, Faculty of Resource Science and Management, Southern Cross University.
Murphy, P. (1999). Licensing. Paper Delivered at the Commercial Fishing Industry Summit. Proceedings byNSW Fisheries, p53-58.
NSW Government (1998). Guidelines for Economic Appraisal, Principles and Procedures simplified. The NSWTreasury.
NSW Government (1997a). Guidelines for the Preparation of Rural Communities Impact Statements, Office ofRural Communities, March.

Social Issues: Estuary General Dominion Consulting Pty Ltd
38 14/11/01
NSW Government (1997b). Guidelines for Assessing Social Impacts, Social Policy Development Unit, TheCabinet Office, December.
NSW Government (1997c). Economic Assessment of Environmental Impacts, Annex 5 in Guidelines forEconomic Appraisal. The NSW Treasury.
NSW Government (1999). New South Wales Treasury Economic Appraisal: Principles and ProceduresSimplified. Policy and Guidelines paper, Office of Financial Management. March.
Newcastle Marine Brokers (2000). Fishing Licence Information from Newcastle Marine Brokers to SafefoodNSW. Unpublished information from Mr Don Moore, Newcastle Marine Brokers (NMB).
NSW-NRAC (1995). Regional Audit of the Upper North east of NSW, Study C, Structural Analysis of theRegional Economy, NSW Natural Resources Audit Council, Sydney.
Powell, R.A., R. Jensen and L. Horwood (1989). The Effects of Policy Change on South-East Trawl FishingCommunities. Report to the Steering Committee on Long- Term Management of the South East Trawl fishery.University of New England and Department of Primary Industries and Energy, Canberra.
Reid, C.R.M. and H.F. Campbell (1998). Bio-economic Analysis of the Queensland Beam Trawl Fishery. Dept.of Economics, University of Queensland and FRDC (94/035).
Roy Morgan (1999). Recreational Fishing Licence Survey of 500 Persons in the Community. ConfidentialDocument Prepared for NSW Fisheries, Roy Morgan Research, Sydney.
Roy Morgan (2001a). Social Survey Results, Unpublished Research, Roy Morgan Research, Sydney.
Roy Morgan (2001b). Economic Survey Results, Unpublished Research, Roy Morgan Research, Sydney.
Ruello and Associates (2000). Retail Sale and Consumption of Seafood. A Study Prepared for the FisheriesResearch and Development Corporation (FRDC), July, 2000.
Safe Food (2001). Proposed Food Production (Seafood Safety Scheme) Regulation; Regulatory ImpactStatement (RIS), June 2001. Safe Food, NSW.
SCFA (2001). Ecologically Sustainable Development and Fisheries. Project funded by the Standing Committeeon Fisheries and Aquaculture (SCFA) and Fisheries Research and Development Corporation (FRDC).
SFM (2001). Seafood Handling Guidelines. Sydney Fish Markets Ltd, Pyrmont.
Standen, B.J. (1972). Evaluation of the Efficiency of Resource Use on Farms and the Welfare of Farm People.Australian Journal of Agricultural Economic, Vol.16(1). p34-44, April.
Tamblyn, C. and R.A. Powell (1988). Input and Output study of the North Coast Agriculture and FisheriesIndustries, NSW Dept. of Agriculture, Wollongbar.
Thomas, I. (1998). Environmental Impact Assessment in Australia: Theory and Practice (second edition), TheFederated Press, Leichhardt, NSW.

Social Issues: Estuary General Dominion Consulting Pty Ltd
39 14/11/01
Appendix H1: Fisher community profile of commercial fishers in NSW. (Source
BRS/ABS data).
There has been no previous attempt to present a fishing community profile of the NSW
Fishing Industry. The relevant social data of fishers in NSW was obtained from the ABS
statistics via the Bureau of Rural Science Social Science unit and the fisher numbers in NSW
from NSW Fisheries. These are reported in Appendix Table HA1. Maps are reported in
Appendix H4.
Appendix Table HA1: Social index data for NSW Fishing communities at the postcode level
(Source: ABS, 1996 /BRS and NSWF).
Zone Home District P. code Town/SuburbNo.
FishersTotal
Population
Unemployed (%)
SEIFAMed. Ind.
Income (wk)
Employed in C.F. (%) of labour
force
1 TWEED 2485 TWEED HEADS 22 8,978 20.0 893 200-299 0.31 TWEED 2486 TWEED HEADS/BANORA POINT 22 24,984 14.4 953 200-299 0.411 TWEED 2487 CHINDERAH/OTHERS 19 7,976 16.2 921 200-299 0.411 RICHMOND 2472 BROADWATER/CORAKI 10 1,761 19.5 919 200-299 1.021 RICHMOND 2473 EVANS HEAD 25 2,613 16.8 900 160-199 1.021 RICHMOND 2478 BALLINA/OTHERS 52 24,184 13.7 972 200-299 0.522 CLARENCE 2460 LAWRENCE/OTHERS 24 29,145 14.8 951 200-299 1.2122 CLARENCE 2463 MACLEAN/OTHERS 96 6,072 16.2 946 200-299 4.462 CLARENCE 2464 YAMBA/OTHERS 64 5,340 17.1 954 200-299 4.462 CLARENCE 2466 ILUKA 65 1,863 18.6 891 160-199 4.462 CLARENCE 2469 WOOMBAH/OTHERS 10 933 27.2 854 160-199 1.023 COFFS HARBOUR 2448 NAMBUCCA/OTHERS 18 8,690 19.1 927 160-199 0.83 COFFS HARBOUR 2450 COFFS HARBOUR 52 32,488 15.8 971 200-299 0.243 COFFS HARBOUR 2456 WOOLGOOLGA/URUNGA 20 11,848 20.5 944 200-299 0.463 COFFS HARBOUR 2462 WOOLI/OTHERS 20 2,599 20.0 917 160-199 1.193 HASTINGS 2431 SOUTH WEST ROCKS 33 3,965 18.6 926 160-199 0.783 HASTINGS 2440 CRESCENT HEADS/OTHERS 20 23,164 19.3 916 200-299 0.783 HASTINGS 2444 PORT MACQUARIE 37 34,162 15.2 966 200-299 0.484 MANNING 2427 HARRINGTON/COOPERNOOK 24 1,473 18.0 883 160-199 0.714 MANNING 2430 TAREE/OTHERS 35 28,312 14.0 950 200-299 0.714 MANNING 2443 LAURIETON/OTHERS 21 8,093 20.6 909 160-199 0.5954 WALLIS LAKE 2423 BUNGWAHL/OTHERS 17 3,247 14.5 939 200-299 2.784 WALLIS LAKE 2428 FORSTER/TUNCURRY/OTHERS 88 19,457 15.1 939 200-299 2.784 PORT STEPHENS 2301 NELSON/SALAMANDER BAYS/OTHERS 27 25,046 11.1 997 200-299 1.044 PORT STEPHENS 2315 NELSON BAY/OTHERS 54 8,393 14.3 966 200-299 1.044 PORT STEPHENS 2324 TEA GARDENS/OTHERS 20 19,123 13.6 937 200-299 1.914 HUNTER 2280 BELMONT/OTHERS 10 22,225 10.5 989 200-299 0.054 HUNTER 2281 SWANSEA/OTHERS 15 11,349 14.3 935 160-199 0.054 HUNTER 2295 STOCKTON/OTHERS 12 5,058 12.8 918 200-299 0.5554 HUNTER 2304 MAYFIELD/WARABROOK 18 13,925 17.6 890 200-299 0.074 CENTRAL COAST 2250 ERINA/OTHERS 10 57,810 7.7 1025 300-399 04 CENTRAL COAST 2251 AVOCA BEACH/OTHERS 11 29,370 8.5 1032 200-299 04 CENTRAL COAST 2256 WOY WOY/OTHERS 12 14,168 11.1 941 200-299 04 CENTRAL COAST 2257 EMPIRE BAY/OTHERS 10 25,326 11.6 957 200-299 04 CENTRAL COAST 2261 BERKELEY VALE/OTHERS 19 32,623 14.1 935 200-299 04 CENTRAL COAST 2259 MANNERING PARK/TACOMA/OTHERS 40 46,846 10.6 972 200-299 05 HAWKESBURY 2083 MOONEY MOONEY 12 1,450 5.7 1042 300-399 05 HAWKESBURY 2775 SPENCER 18 930 9.2 967 200-299 05 SYDNEY 171400 SYDNEY NORTH & SOUTH 189 3,276,207 7.3 1047 300-399 06 ILLAWARRA 2500 WOLLONGONG 10 32,326 12.6 998 200-299 0.16 ILLAWARRA 2502 PRIMBEE/OTHERS 10 13,000 18.9 847 160-199 0.16 ILLAWARRA 2506 BERKELEY 18 6,653 19.0 827 160-199 0.16 ILLAWARRA 2533 KIAMA 12 13,553 7.6 1067 200-299 0.236 SHOALHAVEN 2540 GREENWELL POINT/OTHERS 59 24,208 18.2 933 160-199 0.816 SHOALHAVEN 2541 NOWRA/OTHERS 16 29,663 12.0 957 200-299 0.817 BATEMANS BAY 2536 BATEMANS BAY/OTHERS 32 14,335 15.5 970 200-299 1.1757 BATEMANS BAY 2537 MORUYA/OTHERS 10 9,002 18.2 960 200-299 1.547 BATEMANS BAY 2539 ULLADULLA/OTHERS 63 11,499 17.4 942 160-199 0.817 MONTAGUE 2546 NAROOMA/OTHERS 53 8,135 15.9 955 160-199 1.547 FAR SOUTH COAST 2551 EDEN 61 3,726 12.1 916 200-299 2.56
Total 1615

Social Issues: Estuary General Dominion Consulting Pty Ltd
40 14/11/01
Explanation of Relevant Social Data for NSW Fishing Post Code Areas.
The data contained within Appendix Table HA1 has been acquired from the Australian
Bureau of Statistics (ABS) Housing and Population census 1996. The data on zones, districts,
postcodes and fishers numbers is from NSWF.
Population -The total population is for the postcodes as in the 1996 census data (ABS, 1996).
Unemployment -Unemployment is the proportion of the labour force seeking either part-time
or full-time employment, expressed as a percentage at postcode level from the 1996 census
data (ABS, 1996).
SEIFA Index of Disadvantage - The Australian Bureau of Statistics (ABS) developed the
Socio-Economic Index for Areas (SEIFA) of relative disadvantage from the 1996 population
census. Areas with the greatest disadvantage have high proportions of low income families,
unemployed people, people without educational qualifications, households renting public
housing and people in low-skilled occupations. The SEIFA score for Australia as a whole is
standardised at 1,000. Australia’s non-metropolitan average is 972, so, a SEIFA4 score of 941
(as is the case with Woy Woy/others), which is 31 points lower than Australia’s non-
metropolitan average, would indicate the town’s residents are more disadvantaged than most
of non-metropolitan Australia.
Weekly Median Individual Income - The ABS’ 1996 housing and population census derives
information about individual income from income categories. The median income is that
income category that splits the population, ie. it refers to the category where 50 percent of the
population from an area selected area has income categories either above or of the same
category as the median. For example, in Spencer, 50 percent of the population earned
between $0 and $299 per week and 50 percent earned $200 or more per week. Sydney’s
median individual income ($300 - $399) is one of the highest in this sample, compared to
Wooli’s in the Coffs Harbour district, which is one of the lowest ($160 - $199).
Employment in Fishing -Employment5 in the fishing industry has been expressed as a
percentage of the Total Labour Force (TLF). For example, 2.78 percent of Forster/Tuncurry’s
4 The ABS does not supply SEIFA values at the post code level. Supply options are at the level of the StatisticalLocal Area (SLA) or census Collection District (CD). To present SEIFA values at the postcode level it wasnecessary to calculate a mean score from all SLAs that intersected the post code in question. While this methodresults in an estimated SEIFA value for postcodes, it can be regarded as a fairly accurate estimation becauseSEIFA scores are strongly correlated with local geography.
5 The BRS do not have a NSW data set on employment in commercial fishing at the postcode level. Data is atthe SLA level. For consistency, the data is again presented at the postcode level by calculating a mean scorefrom all SLAs that intersected the post codes. Again, it is considered that this is fairly accurate estimation giventhe circumstances of local geography.

Social Issues: Estuary General Dominion Consulting Pty Ltd
41 14/11/01
labour force is employed in commercial fishing. The commercial fishing category includes
all of the following possible sub-categories: Rock lobster fishing; Prawn fishing; Finfish
fishing; Squid jigging; Line fishing; Marine fishing; Marine fishing undefined; Aquaculture;
and Commercial fishing undefined.
The data in Appendix Table HA1 is for postcodes with more than 10 NSW commercial
fishers. This means that 1,615 fishers from a total of 1,920 are included in the analysis. The
other 305 live in postcodes areas with less than 10 fishers are omitted. This should be borne in
mind in the analysis of results.
Maps of ABS data on unemployment, SEIFA index, employment in commercial fishing and
weekly average income from the national census are reported in Appendix H4.

Social Issues: Estuary General Dominion Consulting Pty Ltd
42 14/11/01
Appendix H2: The telephone Social Survey (Roy Morgan, 2001a).
The available information in NSW was previously limited and relied entirely on the NSWF
licensing system. Recognising this a social survey was undertaken by telephone in May 2001
by Roy Morgan Research (Roy Morgan, 2001a). The social survey had 870 replies from
1,751 businesses contacted in NSW as reported in Appendix Table HA2.
Appendix Table HA2: The response rate for the NSW social telephone survey (Source: RM-SS).
Frequency %Completed questionnaires 870 50%
50%No reply 115 7%Engaged 36 2%Unobtainable 136 8%Appointments 59 3%Repeated calls (6) 78 4%Total unable to contact 424 24%Refusals 278 16%Terminations 179 10%Refusals/terminations 457 26%Total 1751 100%
The response rate across all fishers in NSW was 50%. These figures compare favourably with
the telephone survey of Queensland fishers (Fenton and Marshall, 2000), though there are
26% of refusals/terminations and approximately 24% of fishers were unable to be contacted.
Some 10% of interviews were terminated, usually due to language problems during the
interview (Roy Morgan, 2001a). The completed interview results may not adequately reflect
fishers from non-English speaking backgrounds. Approximately 16% of fishers refused to
participate in the survey. This was due to a variety of reasons which can only be surmised,
but which may indicate significant social discord between fishers and management in relation
to the FMS and the Recreational Fishing Areas process and perceptions of management
among fishers.
Of the 870 state-wide replies, 502 replies (57%) were from Estuary General endorsement
holders who constitute 52% of all licence holders state-wide. Of 502 EG endorsement holders
contacted, 449 interviewed in the social survey had been fishing in the EG in the previous 12
months. Given there are 1,003 licence holders in the EG and 623 of these went fishing in
1999-00, the surveyed fishers are more active than the endorsed population. Given the total

Social Issues: Estuary General Dominion Consulting Pty Ltd
43 14/11/01
number of licences is twice the number of interviews, this means that doubling the responses
of the social survey may considerably overestimate the fishing population.

Social Issues: Estuary General Dominion Consulting Pty Ltd
44 14/11/01
Appendix H3: Social profiling of fishers likely to exit the EG fishery under the FMS
Two categories of fishers are examined. Those who are currently constitute latent effort and
fishers grossing under $10,000 from the EG fishery.
The social profile of latent effort share holders.
There are EG endorsed fishers who are latent in all fisheries. This means they did not catch
fish in any commercial fishery administered by NSW Fisheries in 1999-00, but have
previously fished in NSW. Appendix Table HA3 reports the regional dispersion of EG fishers
considered as latent effort and the proportion who responded to the social survey. Their
characteristics can then be identified from the survey results.
Comparisons of latent effort holders and total endorsement numbers by zone are also
presented in Appendix Table HA3. The average zone has 34% of total endorsements latent.
Adjustment of endorsements by zoning will mean that a generic state-wide minimum
shareholding rate would impact zones differently. If considering social impacts by numbers of
latent fishers, then zone 4 has the largest number of latent effort fishers who may be
potentially impacted by the FMS, whereas zone 7 has the highest percentage of latent
endorsements.
Appendix Table HA3: The social survey coverage of latent EG endorsed fishers ( Yes is aSS response).
Zone Yes No Total latent Total end. Latent as % of Total 1 7 13 20 72 27% 2 11 14 25 158 16% 3 12 17 29 106 27% 4 52 58 110 302 36% 5 13 38 51 123 41% 6 15 34 49 126 38% 7 15 22 37 59 62%Total 125 196 321 946 34%
The following information is available on latent endorsement holders from the social survey:
• The median age bracket is 40-44 years old, with 46% being 35-60 years old.
Approximately 57% have fished 16-40 years (median bracket was 16-20 years).
• Less than 40% of fishers responded to the “how many generations in the fishing industry”
question. Of those who did, the median response (over 40% of the remainder) was one
generation.

Social Issues: Estuary General Dominion Consulting Pty Ltd
45 14/11/01
• Gross income: 34% of the interviewed fishers chose not to reply and 10% apparently
earned $100,000 pa. Over 75% of those interviewed said that 90-100% of their income is
from fishing. The median income bracket is $30,000 - $35,000 (8% of fishers), with only
11% claiming less than $20,000 in gross income. Most (76%) had no employees, while a
further 15% had one or two employees. A minority (22%) claimed to have employment in
other industries.
• Of 125 interviewees, 27 could get full time employment in other industries, 10, possibly
could and 85 indicated fishing was all they knew. Only 15 would consider retraining, 26
being too old.
• These 125 fishers (latent effort) have 225 dependent children and 25 dependent spouses.
The survey has thrown some light on the characteristics of latent effort holders in the EG
fishery. Their apparent lack of revenue from fishing in NSW means their fishing income was
either not within NSW, was in the processing sector or from welfare or other sources.
Observation of the survey responses suggests that many of the fishers may have been
reluctant to give full details of their alternate work, or overstated income from all sources.
In summary latent effort is held by fishers who have fished in the past, are not necessarily old
and are probably undertaking some alternative employment. They have a mix of fishing
experience and family connections with the fishing industry and have a limited capacity to
retrain, approximately 20% considering themselves to be too old for retraining.
The social profile of EG endorsement holders grossing less than $10,000 per year.
Social impacts also are likely to arise from low earning EG fishers with catch revenue
estimated by the Sydney index at below $10,000 across their fishing activities. It is likely that
these fishers may sell shares rather than trading up to the minimum shareholding. For the EG
endorsement holders there were 149 fishers in 1999-00 who grossed less than $10,000 in all
their fishing in NSW. Appendix Table HA4 reports the regional location of low earning
fishers in the EG fishery and the proportion sampled in the social survey.
Appendix Table HA4 reports small business (< $10,000 per annum) numbers as percentages
of total active fishing businesses in each area. On average it is 24% state-wide with least

Social Issues: Estuary General Dominion Consulting Pty Ltd
46 14/11/01
small businesses by percentage in zone 2 and most by number in zone 4. Zone 7 has the
highest percentage of small businesses.
Appendix Table HA4: Survey Coverage of EG Endorsed Fishers earning less than $10,000in the fishing industry ( Yes is a SS response).
Zone Yes No Total No. of active FBs Small Bus as % of active FBs 1 4 9 13 52 25% 2 7 10 17 133 13% 3 13 11 24 77 31% 4 25 19 44 192 23% 5 9 12 21 72 29% 6 7 9 16 77 21% 7 9 5 14 22 64%Total 74 75 149 625 24%
The characteristics of the fishers involved with fishing businesses grossing less than $10,000
of fish in 1999-00 are:
• aged from 21 to 86 years old, with over 50% of these being between 35 and 55 years old.
Most of these fishers (62%) have been in the industry for between 6 and 25 years.
• Over half (53%) were first generation fishers, with an additional 34% being second or
third generation fishers. Only 14% had one or two employees.
• Gross income: 36% of the fishers interviewed declined to respond to the income from all
industries question. 70% of interviewees said that 90- 100% of their income was from
fishing. The median income bracket from all industries is $20,000 - $25,000 (15% of
fishers) for catch values at under $10,000 by the Sydney index. This means their fishing
income was either not within NSW, was in processing or from fishing, welfare or other
industries. A minority (32%) claimed to have employment in other industries.
• Of 75 interviewees, 9 could get employment in other industries, 13, possibly could and 47
indicated fishing was all they knew and only 6 would consider retraining, 11 being too
old.
• These 75 fishers have 53 dependent children and 15 dependent spouses.
Fishers earning less than $10,000 a year in 1999-00 have a range of ages and a longer family
connection with fishing than the fishers who are latent effort holders. A significant number
chose not to answer the income question and 70% indicated they were full time fishers. As
with latent effort, approximately 30% could get employment in other industries and 20%
considered themselves too old to retrain.

Social Issues: Estuary General Dominion Consulting Pty Ltd
47 14/11/01
Appendix 4: Socio-economic maps for NSW fishers.
Maps of ABS data on unemployment, SEIFA index, employment in commercial fishing and
weekly average income, from the national census (ABS, 1996). Thanks to BRS social science
unit for this material.

18.9 to 27.216.2 to 18.914.4 to 16.211.6 to 14.45.7 to 11.6
Unemployment (%)
Maps 1a, 1b & 1c: Unemployment across Selected Post Code Areas (NSW), 1996
Map 1a: Tweed to Hastings Map 1b: Manning to Sydney Map 1c: Illawarra to Far South

1000 to 1067960 to 1000940 to 960910 to 940827 to 910
SEIFA (disadvantage)
Maps 2a, 2b & 2c: SEIFA (Disadvantage) Scores across Selected Post Code Areas (NSW), 1996
Map 2a: Tweed to Hastings Map 2b: Manning to Sydney Map 2c: Illawarra to Far South

1.54 to 4.461.02 to 1.540.78 to 1.020.41 to 0.780.05 to 0.41Insufficient data
Workforce (%)
Maps 3a, 3b & 3c: Employment in Commercial Fishing across Selected Post Code Areas (NSW), 1996
Map 3a: Tweed to Hastings Map 3b: Manning to Sydney Map 3c: Illawarra to Far South

300 to 399200 to 299160 to 199
Week Individual Income ($)
Maps 4a, 4b & 4c: Weekly Individual Income ($) across Selected Post Code Area (NSW), 1996
Map 4a: Tweed to Hastings Map 4b: Manning to Sydney Map 4c: Illawarra to Far South

NSW FISHERIES
Prepared by:
Umwelt (Australia) Pty LimitedEnvironmental and Catchment Management Consultants
September 2001
1479/R01/V2
NSW ESTUARY GENERAL FISHERYMANAGEMENT STRATEGY
ASSESSMENT OF IMPACTS ONHERITAGE AND INDIGENOUS ISSUES

Report No. 1479/R01/V1
Prepared for:
NSW FISHERIES
NSW ESTUARY GENERAL FISHERY MANAGEMENT STRATEGYASSESSMENT OF IMPACTS ON HERITAGE AND INDIGENOUS ISSUES
Umwelt (Australia) Pty LimitedEnvironmental and Catchment Management Consultants
PO Box 838Toronto NSW 2283
Ph. (02) 4950 5322
Fax (02) 4950 5737

Umwelt (Australia) Pty Limited
TABLE OF CONTENTS
1.0 INTRODUCTION .........................................................................1
1.1 DIRECTOR GENERAL’S REQUIREMENTS............................................... 1
1.2 SCOPE OF STUDY AND ASSESSMENT................................................... 2
2.0 HISTORIC HERITAGE................................................................3
2.1 TRANSPORT HERITAGE .......................................................................... 3
2.1.1 Methodology .................................................................................... 3
2.1.2 Results ............................................................................................ 5
2.2 STRUCTURAL HERITAGE ........................................................................ 5
2.2.1 Methodology .................................................................................... 5
2.2.2 Results ............................................................................................ 6
2.3 THE CONCEPT OF SIGNIFICANCE .......................................................... 7
2.4 ISSUES FOR FUTURE MANAGEMENT....................................................10
2.4.1 National Constraints........................................................................10
2.4.2 State Constraints ............................................................................11
2.4.3 Regional and Local Constraints.......................................................12
2.4.4 The Interaction of Commercial Fishing with Historic HeritageResources ......................................................................................12
2.5 RECOMMENDATIONS..............................................................................12
3.0 ABORIGINAL HERITAGE ........................................................14
3.1 STATUTORY CONTEXT ...........................................................................14
3.2 ARCHAEOLOGICAL AND ETHNOGRAPHIC EVIDENCE FORABORIGINAL USE OF ESTUARY FISHERY RESOURCES IN NSW ........15
3.2.1 Ethnographic evidence....................................................................15
3.2.2 Types and distribution of archaeological sites..................................19
3.2.3 Implications of other types of archaeological evidence andAboriginal places.............................................................................21
3.3 INTERACTIONS BETWEEN ESTUARY GENERAL FISHERY ANDABORIGINAL HERITAGE SITES ..............................................................21
3.4 PROTOCOLS TO REDUCE THE RISK OF HARM TO SITES....................23
4.0 INDIGENOUS ISSUES..............................................................23
4.1 THE ROLE OF FISHING IN COASTAL ABORIGINAL COMMUNITIES.....23
4.1.1 Historical and contemporary fishing by coastal Aboriginalcommunities ...................................................................................23

Umwelt (Australia) Pty Limited
4.1.2 The economic and social value of fishing in coastal Aboriginalcommunities ...................................................................................27
4.2 CURRENT ACCESS OF ABORIGINAL COMMUNITIES TO ESTUARYFISHERY RESOURCES............................................................................28
4.3 IMPACT OF CHANGING REGULATIONS - SPECIES AND LOCATIONS.30
4.3.1 Pipis and beach worms ...................................................................30
4.3.2 Fish species....................................................................................31
4.4 NATIVE TITLE AND LAND CLAIMS .........................................................32
4.5 MANAGEMENT OF INDIGENOUS FISHERY AND ESTUARY GENERALFISHING INTERACTIONS.........................................................................33
4.5.1 Outstanding issues of concern to coastal Aboriginal communities....33
4.5.2 Actions to address Aboriginal concerns in the draft EGFMS ............34
4.5.3 Towards a NSW Indigenous Fishery Strategy..................................34
4.5.4 Interaction of the EGFMS and the Indigenous fishery strategy .........35
4.5.5 Further strategic actions to mitigate impacts on Indigenous fishers ..35
5.0 SUMMARY OF ACTIONS TO MINIMISE THE RISK OFIMPACT OF ESTUARY GENERAL FISHERY ACTIVITIES ONABORIGINAL SITES AND INDIGENOUS ISSUES .................37
6.0 REFERENCES ..........................................................................37
APPENDICES
1 Principal Commercial Fishery Estuaries
2 Shipwreck Sites associated with New South Wales Estuaries
3 Other European Heritage Sites in New South Wales Estuaries

Umwelt (Australia) Pty Limited1479/R01/V2 September 2001 1
1.0 INTRODUCTION
The draft Estuary General Fishery Management Strategy (May 2001) has been prepared by NSWFisheries to fulfil the requirements of the Fishery Management Act 1994. The strategy sets out theobjectives of this sector of the NSW commercial fishery, together with a vision for the futuresustainable management of the fishery. It also documents how the fishery will be managed,including rules for access and operation, performance indicators, monitoring regimes and triggersfor review.
Prior to the finalisation of the Estuary General Fishery Management Strategy (EGFMS), anenvironmental impact assessment under the provisions of the Environmental Planning andAssessment Act 1979 (EP&A Act) is required. The Department of Urban Affairs and Planning(DUAP) has provided Director General’s Requirements for the preparation of an EnvironmentalImpact Statement and a Planning Focus Meeting has been held to clarify the issues of concern tokey stakeholders, that must be addressed in the EIS.
In the case of the EGFMS, the activity for which approval is sought under Part 5 of the EP&A Actis the commercial taking of species such as yellowfin bream, dusky flathead, sand whiting,longfinned eels and sea mullet from estuarine waterways using handline, trap, mesh and gill netsand hand collection. The estuary fishery is also defined to include commercial hand collection ofpipis and beach worms from ocean beaches. The commercial fishery operates in more than 80estuaries along the NSW coast, but NSW Fisheries statistics indicate that approximately 95% of thecommercial catch is obtained from 24 estuaries. These estuaries are listed in Appendix 1.
The activity that is being assessed in this EIS includes the actual fish catching and collectingactivities in estuaries and on beaches. Land based activities that are peripheral to the variousmethods of catching fish are not included in this environmental impact assessment. These landbased activities include boat launching, storage and maintenance areas, and net and trap storage andmaintenance areas. In general, these activities are likely to be covered by a range of existingdevelopment consents under the planning regulations applying in the local government area inwhich they are located.
The core study area for this environmental assessment is therefore the bed and internal banks ofestuarine waterways (upstream as far as the tidal limit and to the elevation of mean high water), andthe intertidal zone of beaches from which pipis and worms are collected.
This document addresses the issues that have been noted in the Director General’s Requirements inrelation to heritage and Indigenous matters.
1.1 DIRECTOR GENERAL’S REQUIREMENTS
The issues that must be assessed in relation to heritage matters are noted in Section 2.3 of Part H(Social Issues) of the Director General’s Requirements:
(a) Identify shipwreck sites or other sites of historic heritage that are likely to be affected byfishing activities and outline measures to minimise risk of harm to these sites.
(b) Identify any important Aboriginal heritage sites/places used by fishers and outlineprotocols/measures to be developed in consultation with representatives of the Aboriginalcommunity to minimise risk of harm to these sites.
The issues that must be assessed in relation to Indigenous issues are noted in Section 3 of Part H ofthe Director General’s Requirements:

Umwelt (Australia) Pty Limited1479/R01/V2 September 2001 2
(a) Identify the interests of Indigenous people in the resources harvested by the fishery and inhabitats that may be impacted by the proposed activity.
(b) Assess the impacts of the activities proposed to be authorised by the management strategy onIndigenous interests. In particular, assess the impacts of implementing the strategy on:
1 . traditional fishing, including access, participation and culture (such as places ofsignificance - middens, totemic symbols etc);
2. Indigenous communities’ well being, including economics, employment and communityviability;
3 . government policies on Indigenous fisheries issues, including the NSW IndigenousFisheries Strategy.
(c) Mitigation and management measures.
1.2 SCOPE OF STUDY AND ASSESSMENT
This assessment is presented in three main parts.
Section 2 of the document deals with European heritage issues. European heritage sites, reflectingthe importance of maritime activities in the past development of NSW, are located in manyestuaries. This assessment considers potential impacts of estuary general fishing activities on thoseEuropean heritage sites that are listed in inventories maintained by The NSW HeritageCommission, the National Estate, and the Australian Shipwreck register. It is considered that thereis a low risk that estuary general fishing activities will impact on these sites, although someshipwreck sites may present safety risks to estuary fishers. In this context, the assessment does notexplore the historical details for European heritage sites.
The Director-General’s Requirements in relation to Aboriginal heritage sites relate to theidentification of Aboriginal sites or places that are used by (estuary general) fishers, and preparingprotocols to minimise the risk of harm to these sites by estuary general fishery activities.
There is abundant ethnographic and archaeological evidence for past use of estuaries and beachesby Aboriginal people, and of the importance of resources from these environments to Aboriginaleconomies and lifestyles. This evidence is described in Sections 3.2.1 to 3.2.4.
Known Aboriginal sites are recorded in the NPWS Aboriginal Sites Register, and there arethousands of known sites located on the banks of estuaries or along beaches. Sites are known fromthe banks of virtually every estuary in NSW, and middens are reported from many beaches(although the distribution of midden sites is heavily influenced by the nature of the beach and dunesystem). In addition to the known sites in these landscape contexts, there is potential forarchaeological evidence to be present that is not yet recorded in the NPWS Register. Some of thisevidence may be known to local Aboriginal people, and some is sub-surface evidence that has nosurface expression unless disturbed by processes such as excavation and land clearing. Very fewknown Aboriginal sites are located within the channel of estuaries that are used for commercialfishing activity.
In assessing the existing and potential impacts of activities that would be authorised under theEGFMS on known Aboriginal sites, a strategic approach has been taken.
There are more than 80 estuaries in NSW that are within the estuary general fishery. A search ofthe NPWS Aboriginal Site Register for each of these estuaries would require consultation with eachcoastal Land Council, to obtain permission to gain access to large amounts of culturally sensitive

Umwelt (Australia) Pty Limited1479/R01/V2 September 2001 3
data. This is not practical within the scope of this EIS process. In addition, the extent of theimpact of estuary general fishing on physical evidence of past Aboriginal occupation does notjustify the mapping of every known site along the banks of estuaries. Neither is it appropriate thatthe locations of such a large number of coastal Aboriginal sites be made public in one publication.
Instead, Sections 3.2.1 to 3.2.4 synthesise the information that is available about the ways thatAboriginal people used and valued estuary resources in the past, and discuss the types of risks tosites that could be associated with estuary general fishery activity. Section 3.3 discusses optionsfor minimising the risk to Aboriginal sites and places.
The extent of Aboriginal cultural heritage and contemporary Indigenous issues related to theestuary fishery is not directly related to the size of the commercial fishery in any one estuary.Approximately 95% of the commercial estuary fish catch is obtained from only 24 estuaries, butissues about Indigenous access to the estuary fishery are reported by the Aboriginal communityfrom many other estuaries. The issues are frequently associated with the regulatory framework forthe fishery, rather than the scale of individual enterprises in each estuary. This matter is discussedfurther in Section 4.
It is important to note that there are several other concurrent policy development initiatives byNSW Fisheries that will affect the interaction of Aboriginal fishers with the commercial estuaryfishery. In particular, NSW Fisheries is currently working with the Aboriginal community todevelop an Indigenous Fishery Strategy, that will provide a new framework for the management ofIndigenous and commercial fisheries. The information presented in this assessment draws on thework in progress towards the Indigenous fishery strategy, and outlines a process for ongoingreview of regulatory relationships, but in no way pre-empts the outcomes of that strategy.
2.0 HISTORIC HERITAGE
This section reports the results of a review of the historic heritage that is located within theprecincts of NSW estuaries. The review of historic heritage has defined those elements of theresource that are, or appear to be, located in such a position that either estuarine commercial fishingoperation might have some impact on an element or vice versa.
For the purposes of this report, historic heritage has been differentiated between the transport andstructural contexts. This differentiation is essentially dictated by the base source(s) or recordingdatabase(s) from which data has been derived. The transport context is specifically represented inthe record of shipwrecks. The structural environment includes such resources as boatsheds,landing ramps, seawalls, breakwaters, wharves and boat harbours, but also includes suchdevelopments as structures for oyster culture, groynes and piles. This latter group of structuresmay have no physical connection to the shoreline.
2.1 TRANSPORT HERITAGE
This section addresses shipwrecks that have been recorded in estuaries. It is heavily based on datacontained in the Australian National Shipwreck Database (ANSD), which is maintained by theAustralian Institute for Marine Archaeology.
2.1.1 Methodology
For this component of the study, the sources of data were the ANSD with additional sourcematerial obtained from:

Umwelt (Australia) Pty Limited1479/R01/V2 September 2001 4
• The Register of British Shipping;
• Annual reports of government departments, particularly in the latter quarter of the 19th Century;
• The Register of the National Estate, maintained by Environment Australia;
• The (NSW) State Heritage Register, maintained by the NSW Heritage Council;
• The (NSW) State Heritage Inventory, maintained by the NSW Heritage Council;
• Bar Dangerous: A Maritime History of Newcastle (Callan 1986) and Bar Safe (Callan 1994);
• Index of shipwrecks on the NSW Coast Between the Hawkesbury and Manning Rivers, 1788-1970 (Fletcher nd);
• Australian Shipwrecks (Loney 1980);
• Shipwreck Atlas of New South Wales (NSW Heritage Office 1996);
• Centenary: NSW Steamship Wrecks (Parsons 1995);
• Scuttled and Abandoned Ships in Australian Waters (Parsons & Plunkett 1998);
• Navigational charts of the coastline and estuaries; and
• Information from state-wide and local newspapers.
The sources of data are collectively referred to as ‘the marine archaeological record’ and areappropriately referenced in the following material and particularly in appendices.
Search of the marine archaeological record indicated that nearly 1500 shipwrecks have beenrecorded along the New South Wales coastline, of which 393 could be related to the entrances andbodies of estuaries. One of the difficulties posed by the ANSD, and by the marine archaeologicalrecord generally, was that the location of many shipwrecks could not be specified with any degreeof accuracy, particularly regarding shipwrecks of the 19th Century. The judgment involved indifferentiating estuarine from open-water shipwrecks was guided by the following criteria:
1 . Detail of the geographical location of the wreck and/or precision in description ofgeographical features relevant to the wreck. For example, while a wreck described aslocated in Sydney Harbour is relatively definitive, one that refers to the wreck location asbeing simply ‘Port Stephens’ may refer to the estuary or to the stretch of coastline, but areference to ‘Hannah ([sic: Anna] Bay’ will place the wreck in open water;
2. The nature of the vessel’s voyage, eg. international, inter-colonial, coastal intra-state, orport service. Thus, a vessel in transit from Valparaiso to Newcastle will have beenunlikely to enter Port Stephens;
3. For other than port services, the origin and destination of the voyage: for instance, a vesselengaged on a late 19th Century voyage from Port Macquarie to Sydney, wrecked on theHastings bar will be deemed to be outbound and the wreck will be included in the PortMacquarie estuary;

Umwelt (Australia) Pty Limited1479/R01/V2 September 2001 5
4. For a port service, whether a vessel was in-bound or out-bound. For example, a vesseltowing another vessel into open water to be scuttled, and wrecked at the port entrance as aresult of the tow will be included as an estuary wreck; and
5. The circumstances of the loss, eg. navigation error, failure of equipment, condition of windand/or weather. The examples of such causes are boundless and need to be read inconjunction with criteria 3 and 4 above.
Greater precision in describing the disposition of shipwrecks could only be achieved by research ofprimary sources.
2.1.2 Results
By an application of the judgment criteria to the raw results of researching the marinearchaeological record, 393 shipwrecks appear to be located within New South Wales coastalestuaries.
The particulars of these shipwrecks are contained in a table included Appendix 2. The table setsout:
• the name of the vessel;
• the best estimate of date-of-loss;
• the best estimate available of the location of the wreck, sorted by estuary from north to south;
• the primary and other sources of data about the loss;
• the reference of the shipwreck in the ANSD; and
• any comments that appear relevant.
2.2 STRUCTURAL HERITAGE
This section is concerned, essentially, with all historic heritage resources, other than shipwrecks,that have been recorded in estuary precincts and is based on data contained in National, State,regional and local heritage reviews.
2.2.1 Methodology
For this component of the study, research was directed mainly to the following base records:
• The Register of the National Estate (RNE), maintained by Environment Australia;
• The (NSW) State Heritage Register, maintained by the NSW Heritage Council; and
• The (NSW) State Heritage Inventory, maintained by the NSW Heritage Council.
Other sources considered for some specific sites were:
• Statutory studies and reports at local and regional level of historic heritage resources;
• Studies relating to coastline and estuary management strategies;

Umwelt (Australia) Pty Limited1479/R01/V2 September 2001 6
• The studies and reports by archaeologists, of specific historic heritage resources;
• Navigational charts of the coastline and estuaries; and
• Information from state-wide and local newspapers.
The sources of data are collectively described as ‘the archaeological record’ and are appropriatelyreferenced in the following material (see also Appendices 2 and 3).
Search of the archaeological record revealed that, as related to the entrances and bodies ofestuaries:
• a total of 35 sites have been entered in the Register of the National Estate (RNE), as either‘Registered’ or ‘Indicative Place’. The status entry ‘Indicative Place’ confirms that the site hasbeen proposed for registration but that the registration process is not yet complete.Accordingly, the submission of the site may be either accepted or rejected for registration;
• a total of 26 sites have been entered on the (NSW) State Heritage Register (SHR), as either‘Registered’ or ‘Interim Heritage Order’. The status entry ‘Interim Heritage Order’ confirmsthat the site has been proposed for registration but that the registration process is not yetcomplete. Accordingly, the submission of the site may be either accepted or rejected forregistration; and
• the (NSW) State Heritage Inventory (SHI) indicates that 293 sites have been recorded onRegional Environment Plans (REP) and Local Environment Plans (LEP) pursuant to the(NSW) Environmental Planning and Assessment Act 1979.
The level at which a site is recorded, on the RNE, the SHR, or in a REP or LEP, is a basicindication of the level of cultural significance attached to the site. An abstract of the concept ofcultural significance is contained in Section 2.3.
Some questions regarding the relationship of individual resources to estuaries were raised by theheritage records. In general, the location of resources in the RNE and SHR were specific but thoseof REPs and LEPs were less so. In cases of doubt, the following criteria were applied:
1. the probable limit of tidal influence and navigability within an estuary by reference to mapsand charts;
2. concurrent with 1. above, the probable capacity of tidal reaches within estuaries to supportcommercial fishing; and
3. more precise location of sites by the use of peripheral or explanatory data. For example,reference to a bridge on a named highway over a named river could be identified on a mapof the area and its location taken into account with criteria 1. and 2. above.
2.2.2 Results
By an application of the judgement criteria to the raw results of research of the archaeologicalrecord, 354 sites appear to be located within New South Wales estuaries. Of these sites, 35 areentered on the RNE, 26 are entered on the SHR and 293 are recorded in the SHI as being recordedon either REPs or LEPs.
The particulars of these sites are contained in a table attached to this report as Appendix 3. Thetable deals separately with the results of research of the RNE on one hand (Part 1) and of the SHRand SHI jointly, on the other (Part 2). Part 1 of the Table sets out:

Umwelt (Australia) Pty Limited1479/R01/V2 September 2001 7
• the name of the site, item or resource;
• the status of the site, item or resource in the RNE process;
• the estuary to which the resource relates;
• the date of construction or an indication of the age of the resource;
• the location of the resource; and
• the reference to the database entry of the resource in the RNE (the RNEDB).
Part 2 of the table sets out:
• the name of the site, item or resource;
• the location of the resource;
• the estuary to which the resource relates;
• the date of construction or age of the resource, where this is evident from the registrationrecords;
• appropriate comments regarding the resource;
• the reference to the database entry of the resource in the SHR and/or SHI; and
• the level of heritage listing, which indicates the level of significance that has been accorded tothe resource.
2.3 THE CONCEPT OF SIGNIFICANCE
The extent to which an item of historic heritage is a constraint to future development dependslargely on the assessment of its significance. This section explains the concept of culturalsignificance and the following section notes the significance that has been attributed to variousheritage resources. The protection afforded by Commonwealth and State heritage and planninglegislation is also noted.
The Heritage Act, 1977 (NSW) defines items of environmental heritage to be:
Those buildings, works, relics or places of historic, scientific, cultural, social,archaeological, architectural, natural or aesthetic significance for the state of NewSouth Wales.
In the context of this report, significance is the measure of the value and importanceof elements of the archaeological record to cultural heritage. While the fabric of thearchaeological record is the subject of the assessment of heritage significance, theassessment itself is conditioned by the environmental and historic context of the site.Furthermore, an evaluation of heritage significance is not static but evolutionary, asa function of evolving community perspectives and cultural values.

Umwelt (Australia) Pty Limited1479/R01/V2 September 2001 8
The Australia ICOMOS Charter for the Conservation of Places of Cultural Significance (the BurraCharter) classifies the nature of cultural significance in terms of historical, aesthetic, scientific andsocial criteria. The implications of these classifications are as follows:
• Aesthetic significance addresses the scenic and architectural values of an item and/or thecreative achievement that it evidences. Thus, an item achieves aesthetic significance if it hasvisual or sensory appeal and/or landmark qualities and/or creative or technical excellence;
• Historical significance considers the evolutionary or associative qualities of an item withaesthetics, science and society, identifying significance in the connection between an item andcultural development and change;
• Scientific significance involves the evaluation of an item in technical and/or research terms,considering the archaeological, industrial, educational and/or research potential. Within thisclassification, items have significance value in terms of their ability to contribute to the betterunderstanding of cultural history or environment and their ability to communicate, particularlyto a broad audience within a community; and
• Social significance is perhaps the most overtly evolutionary of all classifications in that it restsupon the contemporary community appreciation of the cultural record. Evaluation within thisclassification depends upon the social spiritual or cultural relationship of the item with arecognisable community. (Marquis-Kyle & Walker 1992, 21-23).
Historical study looks to the documentary record of human development and achievement, asinterpreted by the authors of the documents that comprise the primary and secondary resources. Inparallel, historical archaeology is concerned not only with the documentary record but also withmaterial evidence. The archaeological record may provide information not available fromhistorical sources. An archaeological study focuses on the identification and interpretation ofmaterial evidence to explain how and where people lived, what they did and the events thatinfluenced their lives. Considerations material to archaeological study include:
• Whether a site, or the fabric contained within a site, contributes knowledge or has the potentialto do so (perhaps, whether the archaeological record validates or contradicts the historical). Ifa site can contribute knowledge within the nature criteria above, the availability of comparativesites and the extent of the historical record should be considered in assessing the strategies thatare appropriate for the management of the site; and
• The level at which material evidence contributes knowledge in terms of current researchthemes in historical archaeology and related disciplines.
The ‘level of contribution’ is thus a critical determinant and is assessed according to the sameprotocols as is cultural significance, that is, in terms of representativeness/rarity andlocal/regional/state associations.
In relation to “research themes and historical archaeology and related disciplines”, the direction ofhistorical archaeology implies, and is conditioned by, consideration of historic, scientific, cultural,social, architectural, aesthetic and natural values. It is a convenient method of classifying thevalues of material evidence, within the Nature criteria above, in terms of the following broadmodel:
• Historical value lies at the root of many of the other values by providing a temporal contextand continuity, thereby providing an integrating medium for the assessment of social, culturaland archaeological significance;

Umwelt (Australia) Pty Limited1479/R01/V2 September 2001 9
• Scientific value depends upon the ability of an item to provide knowledge contributing toresearch in a particular subject or a range of different subjects;
• Cultural value attaches to artefacts which embody or reflect the beliefs, customs and values ofa society or a component of a society and/or have the potential to contribute to anunderstanding of the nature and process of change and its motivation;
• Social value derives from the way people work(ed) and live(d) and from an ability tounderstand the nature, process of change and its motivation. Social significance is closelyrelated to cultural significance, in its concern with the practicalities of socio-culturalidentification;
• Architectural value depends on considerations of technical design (architectural style, age,layout, interior design and detail), the personal consideration (ie. the work of a particulararchitect, engineer, designer or builder) and technical achievement (construction material,construction technique, finish);
• Aesthetic value addresses the manner in which an item comprises or represents creativeachievement, epitomising or challenging accepted concepts or standards; and
• Natural value attaches to items that either support or manifest existing natural processes and/orsystems or which provide insights into natural processes and/or systems.
Within this general framework, the assessment of significance is made in the light of two distinctmeasures : the degree of significance and the level of significance.
• The degree of significance of heritage material is evaluated as being either representative orrare. Representative items are those which are fine distinctive, characteristic and/or illustrativeexamples of an important class of significant item or a significant aspect of the environment.Rare items are those which singularly represent or represent an endangered, discrete, oruncommon aspect of, history or cultural environment. By derivation, items considered withinthe context of broader investigation as being insignificant may be dismissed by an evaluationof little or none;
• The level of significance of heritage material is assessable in five classifications dependingupon the breadth of its identifiable contemporary community or historical or geographicalcontext. Thus –
� a l o c a l classification recognises an item as being significant within a localhistorical/geographical context or to an identifiable contemporary local community;
� a regional level of significance recognises the item as significant within a similar regionalhistorical/geographical context or identifiable contemporary regional community; and
� a state level of significance identifies that item as significant in a state-widehistorical/geographical context or to an identifiable contemporary state-wide community(Heritage Office 1996, 4-7).
and by derivation:
� a national level of significance attaches to an item that is significant in a nationwidehistorical/geographical context or to an identifiable contemporary nationwide community;and

Umwelt (Australia) Pty Limited1479/R01/V2 September 2001 10
� an international level of significance has the appropriate connection to internationalcontext or the international community.
2.4 ISSUES FOR FUTURE MANAGEMENT
This section identifies issues that are material to the management of heritage resources in thecontext of the use of estuaries for commercial fishing.
2.4.1 National Constraints
Appendix 2 tabulates the shipwrecks that are recorded in the marine archaeological record. Apartfrom general heritage and planning legislation at Commonwealth and State levels, these shipwrecksmay be protected under the Historic Shipwrecks Act 1976. The Act applies within Commonwealthwaters and, upon the declaration by a State that the Commonwealth act so applies, to the waters ofa State. New South Wales has made such a declaration. The Historic Shipwrecks Act, s4A, sets outthe base criteria for consideration of a shipwreck as historic as being that the shipwreck be:
(a) situated in Australian waters, or waters above the continental shelf of Australia,adjacent to the coast of a Territory; and
(b) at least 75 years old.
The Act further provides that:
• the Minister may declare historic the remains of disturbed or fragmented shipwrecks andartefacts related to shipwrecks (s4A(5), –(6), –(7));
• whether or not within the base criteria, the Minister may declare historic individualshipwrecks, the individual remains of disturbed or fragmented shipwrecks and individualartefacts related to shipwrecks (s5);
• whether or not within the base criteria, the Minister may make a provisional declaration ofa shipwreck or of artefacts associated with a shipwreck pending determination (s6);
• the Minister may declare a ‘protected zone’ not exceeding 200 hectares as the curtilage of ashipwreck (s7);
• upon publication in the Gazette of a notice declaration a shipwreck and/or site and/orarticle historic, a person holding an artefact related to the declaration must give it to theMinister (s9) and the minister is empowered to demand the surrender of such an article bynotice (s10);
• the Minister may give directions as to the custody of material the subject of declaration(s11);
• It is an offence to destroy, damage, disturb or interfere with an historic shipwreck orartefact or to attempt to dispose of any material to which a declaration applies (s13);
• It is an offence to enter a protected zone with tools, explosives, equipment for divingand/or conducting any prohibited activities; to trawl, dive or undertake any otherunderwater activity; or to moor (s14);
• the Minister is empowered to issue permits to allow the exploration or recovery of ashipwreck or artefacts associated with a shipwreck (s15); and
Umwelt (Australia) Pty Limited1479/R01/V2 September 2001 11
• Any person discovering a shipwreck or artefacts from a shipwreck must report the find tothe Minister (s17).
and provides penalties for offenders against its provisions.
In addition to the above, Appendix 3 Part 1 tabulates 35 resources that have been assessed asbeing of National significance. For these items/places the requirements of the Australian HeritageCommission Act 1975 must be taken into account in management planning that affects thoseresources. The Australian Heritage Commission Act contains few constraints other than againstCommonwealth agencies and against the removal of resources from Australia. However, theCommonwealth Government currently proposes to extend substantial protection to resourcesregistered in the RNE by devolution of heritage administration to the Environment Protection andBiodiversity Conservation Act 1999 from the Australian Heritage Commission Act 1975. It isanticipated that the levels of protection afforded by this amendment will be at least as stringent asthat provided by the (NSW) Heritage Act 1977.
2.4.2 State Constraints
Appendix 3 Part 2 tabulates 26 resources that have been assessed as being of State significance.The requirements of the (NSW) Heritage Act 1977 must therefore be taken into account by anymanagement planning that affects those resources. The Heritage Act established measures for theprotection of heritage resources. Heritage sensitivity may be indicated by historical research and/orby various on-site archaeological surface surveys. The discovery of relics is highly likely once soilis disturbed in circumstances where either historical research or archaeological surface surveyindicates sensitivity. The Heritage Act defines a relic as:
Any deposit, object or material evidence –
(a) which relates to the settlement of the area that comprises NSW, not beingAboriginal settlements; and
(b) which is 50 or more years old.
The Act further provides that:
• Sites and relics in a range of descriptions are protected from disturbance and damage (ss.24-34, 35A-55B, 130, 136-7, 139);
• Relics may be the subject of conservation orders (ss. 26(2)(b), 35A,36,37, 44);
• Relics are protected on the ground on all sites (ss. 26(2)(a), 35A36, 37, 44);
• Approval of excavation is required if a development site is listed on the NSW HeritageRegister (s. 60);
• No disturbance or excavation may proceed for the discovery of relics (not subject to aconservation instrument) except with an Excavation Permit (s. 139);
• An excavation permit is required if a site is not the subject of an order under the HeritageAct (s. 140);
• Location of sites must be reported to the Heritage Council (s. 146); and
• Recovery of relics from excavation must be reported to the Heritage Council (s. 146A).

Umwelt (Australia) Pty Limited1479/R01/V2 September 2001 12
and provides penalties for offenders against its provisions (s. 157).
2.4.3 Regional and Local Constraints
Appendix 3 Part 2 also tabulates 293 resources that have been assessed as being of Regional orLocal significance. The requirements of the (NSW) Environmental Planning and Assessment Act1979 must be taken into account by any management planning relating to those resources. TheEnvironmental Planning and Assessment Act established measures for the protection of heritageresources, substantially the equivalent of the protection provided by the Heritage Act. TheEnvironmental Planning and Assessment Act provides for sites to be scheduled as:
• Heritage items in terms of local, regional and State significance (ss. 24-72);
• Sites in development control plans or subject to development controls (ss. 37-9, 76); and
• Subject to planning controls or additional conservation provisions (ss. 37-9, 76);
and provides further that relics fixed to land may be scheduled, as may relics associated withheritage items in schedules (ss. 24-74). The Act also specifies penalties for offences.
2.4.4 The Interaction of Commercial Fishing with Historic HeritageResources
The activities associated with commercial fishing are limited to associated boating, foreshoreaccess and the use of a variety of netting styles including trawled nets, traps and static and mobilehandlines, as well as the manual recovery of some species.
The physical and spatial presence of heritage resources within estuaries is likely to have only amarginal effect on commercial fishing operations. With regard to shipwrecks, it appears likely thatcommercial fishing will have no impact on residual material evidence, having regard to the likelynature, bulk and mass of any residual material and the potential for sub-surface material to becovered by silt/sand. Nonetheless, in the reverse situation, it is possible for residual wreckage topose a hazard, as a potential snag for nets or trailed lines.
Similarly, structures such as oyster racks, pile and submerged material evidence, pose a greaterthreat to fishers than the reverse, and land-based resources have survived, usually, because theyhave been constructed of relatively impervious materials. Some timber jetties and wharves mayhave deteriorated or will progressively deteriorate to the point of fragility, such that impact from avessel would be capable of causing damage or destruction.
Otherwise, it is appropriate to observe that the greater potential for impact on historic heritageresources will arise from the construction, maintenance and repair and/or extension of shore-basedinfrastructure, peripheral or complementary to commercial fishing activity. Some such activitymay be directly subject to external regulation, but it is pertinent to draw attention to the need forcare in the management and/or repair of shore-based facilities. For example, fishers on Lake Innesobtain access to the lake shoreline along a partly-corduroyed track across an area of naturalreclamation of peat and silt on a (sub-surface) rock-ledge base. The road is close to the site of theformer (1830s) boathouse and sensitivity is called for in any proposal to vary, maintain or managethis access.
2.5 RECOMMENDATIONS

Umwelt (Australia) Pty Limited1479/R01/V2 September 2001 13
These recommendations are made on the basis of:
• the limited review of historical context of the estuary precincts contained in this report;
• the review of the archaeological context of the estuary precincts contained in this report;
• the limited descriptions of the fabric and the precise locations of some of the material evidenceof estuaries, particularly relating to shipwrecks;
• synthesis of the archaeological and historical contexts that is available from the reviews;
• the appreciation of the significance of the heritage resources;
• consideration of the management issues and potential impacts of the proposed use;
• discernment of the potential affects of commercial fishing styles; and
• recognition that the greater potential for impact on historic heritage resources is likely to arisefrom activities peripheral to commercial fishing.
It is recommended that:
1. In general in connection with the development, the attention of all authorities and agencieshas been, and that of all commercial fishers, their contractors and employees will be, directedto the provisions of the NSW Heritage Act 1977 and in particular to:
(i) the definition of relic under that Act;
(ii) the provisions of sections 24-34, 35A-55B, 130, 136-7, 139 and 140 of that Act;
(iii) if any is activity is proposed that will, or may, cause the disturbance of a resource thatis registered on the SHR, the requirement for grant of an Approval under s.60 of theAct;
(iv) if any is activity is proposed that will, or may, cause the disturbance of a resource thatis not registered on the SHR, the requirement for grant of an Excavation Permit unders.140 of the Act;
(v) the basic requirements that, in relation to any development, if:
- a relic (whether transport or structural within the definition of this report) issuspected, or there are reasonable grounds to suspect a relic in ground, that islikely to be disturbed damaged or destroyed by excavation;
- any relic is discovered in the course of excavation that will be disturbed,damaged or destroyed by further excavation;
the developer must notify the Heritage Office of New South Wales and suspend work thatmight have the effect of disturbing, damaging or destroying such relic until the requirementsof Heritage Office have been satisfied (a requirement capable of being obviated by the priorissue of an Excavation Permit).
2. In relation to any proposed development of ancillary facilities associated with commercialfishing activities in an estuary, potential to impact on heritage resource(s) must beconsidered. The developer shall commission a study and report by an appropriately qualified

Umwelt (Australia) Pty Limited1479/R01/V2 September 2001 14
person of the heritage values of the area potentially to be affected by the proposeddevelopment. Presumably any such report would form part of the process of thedevelopment application to the relevant approval authority.
3.0 ABORIGINAL HERITAGE
3.1 STATUTORY CONTEXT
All evidence of past Aboriginal occupation in NSW is protected under the provisions of theNational Parks and Wildlife Act 1974 (NPW Act), regardless of its significance or the tenure of theland on which it is located. Each individual item of physical evidence of past Aboriginal culturalactivity in the landscape is defined by the NPW Act as a “relic”. Aboriginal sites are localities thatinclude or display one or more pieces of this evidence. For instance, a site may be identified by theobservation, on or below the ground surface, of a single piece of flaked stone (isolated artefact), orby an accumulation of many (often thousands) of pieces of flaked stone (open campsite or openartefact scatter). Aboriginal sites also include middens, rock shelters with cultural deposit or art,stone arrangements and structures, scarred and carved trees, and burials. Open campsites orartefact scatters are the most common type of occupation evidence in NSW generally; however,along the coast, midden sites are very common, reflecting the importance of shellfish and fish inthe coastal diet and the robustness of shell fish remains in the landscape.
Aboriginal places that have been declared by the Minister for the Environment and duly gazetted,are also protected by the NPW Act. An Aboriginal place is a place in the landscape that hasspiritual significance for Aboriginal people, but where there is not necessarily any physicalevidence of past Aboriginal occupation.
It is an offence under the NPW Act to knowingly deface, damage or destroy an Aboriginal “relic”(as defined by the Act) or Aboriginal place without the prior written consent of the Director-General of National Parks and Wildlife Service (NPWS). This consent is obtained through anapplication under Section 90 of the Act for Consent to Destroy. It is NPWS policy that applicationsfor Consent to Destroy must be accompanied by written evidence of consultation with therepresentatives of the local Aboriginal community, and it is unlikely that NPWS would grant aConsent to Destroy in cases where the local Aboriginal community had not supported theapplication.
The NPW Act does not define “knowingly”. However, NPWS does provide guidance as to whatconstitutes a “known” site in relation to development that is assessed as integrated development.An Aboriginal site is considered to be known if:
• It is registered in the NPWS Aboriginal sites register; and/or
• It is an Aboriginal site known to the Aboriginal community; and/or
• It is located during surveys or test excavation conducted prior to the lodgement of adevelopment application.
This definition makes it clear that it is incumbent on a proponent to consult with the localAboriginal community and to conduct appropriate research into records of archaeological evidence,prior to commencing a development that will disturb the land surface.
In this environmental assessment, the risks to specific individual Aboriginal sites have not beenidentified. Risk has been assessed at a strategic level, in terms of the types of evidence that can beexpected to be located along the banks of estuaries and on beaches, and the aspects of the proposedactivity that have the potential to have an impact on those types of archaeological evidence.

Umwelt (Australia) Pty Limited1479/R01/V2 September 2001 15
3.2 ARCHAEOLOGICAL AND ETHNOGRAPHIC EVIDENCE FORABORIGINAL USE OF ESTUARY FISHERY RESOURCES IN NSW
In general, the archaeological and ethnographic evidence clearly indicates that fishing and shell fishgathering were of great importance to Aboriginal people in pre-European times, right along theNSW coast, and the evidence suggests an increasing use of the full diversity of coastal resourcesover time. The evidence also suggests distinct differences in the styles of accessing the estuaryand coastal fishery resources on the north and south coasts (eg. In terms of seasonality and targetedspecies). Sullivan (1982) attributes these differences in the first instance to significant geomorphicdifferences between the north and south coasts. The north coast is dominated by long sandybeaches, and large river estuaries, lakes and bays. The south coast is much more a rocky coastlinewith numerous headlands and rock platforms, smaller estuarine waterways, and shorter beachesthat have a geomorphic history of shoreline retreat.
This section reviews and synthesises the ethnohistorical and archaeological evidence for Aboriginaluse of and occupation of estuarine and beach habitats. This evidence provides the cultural contextfor ongoing Indigenous, recreational and commercial use of estuarine fishing resources. Thearchaeological evidence also provides the background to contemporary Indigenous fishing activityin estuaries and on beaches. The analysis shows quite clearly that the modern commercial estuaryfishery operates within the same habitats and involves very similar resources to those that weretargeted by Aboriginal people in the past.
3.2.1 Ethnographic evidence
3.2.1.1 Descriptions of fishing method and equipment
There are many nineteenth century ethnographic references to Aboriginal people fishing in northand south coast estuaries, at estuary mouths and around headlands. Whilst these descriptionswould have been affected by the cultural values of the European settlers at the time, they doprovide a clear indication of the ways in which Aboriginal people accessed the resources of coastestuaries.
Examples of the observations of nineteenth century settlers are provided below:
Ainsworth (1922) - “the seasons were known to them by the foliage and flowers. Theycould tell by the natural signs of flowers and fruit when the salmon and mullet weredue on the beaches and in the rivers, and also when certain game was likely to be inevidence in particular localities.”
Hodgkinson (1845) - “fish formed a never failing article of food for (Aboriginalpeople).”
Henderson (1851) describes Aboriginal people diving for oysters, slowly workingtheir way upstream in estuarine creeks.
Beaglehole (1955) (quoting from Captain Cook) “on the sand and mud banks areoysters, muscles (sic) cockles etc which I believe are the chief support of theinhabitants, who go into the shoald(sic) water with the canoes and pick them out of thesand and mud with their hands and sometimes roast them and eat them in the canoe,having a fire for that purpose as I suppose.”

Umwelt (Australia) Pty Limited1479/R01/V2 September 2001 16
Hodgkinson (1845) claims “the (Aboriginal people) at the Macleay and NambuccaRivers spear in a few minutes sufficient fish for the whole tribe, on the shallow sandbanks and mud flats on that part of the river which rises and falls with the tide.”
Crown Lands Commissioner (Fry 1843:653) - “the subsistence of the natives of thisportion of the colony being determined in a great manner from fishing, the localitieswhich they inhabit are consequently the immediate banks of the rivers Clarence andRichmond”. Of the coastal Aborigines, Fry says “their diet is composed almostentirely of fish and honey.”
Ainsworth (1922) provides detailed descriptions of the fishing methods used byAboriginal people near Ballina:
“They were exceedingly expert hunters and fishermen and in these pursuitsbrought to their aid many ingenious weapons and contrivances. In catchingfish they used what they called a ‘tow-row’ - that is a finely meshed net attachedto a stick of bamboo bent in the shape of a bow about eight feet across betweenthe two ends. This gave a bag effect to the net and with a tow-row in each handthe blacks could surround the fish schools in narrow and shallow waters andcatch them by the hundreds. The cordage of these nets which were very strongand beautifully woven, was made from the inside fibre of the stinging tree andfrom the bark of the kurrajong. They used a similar net in hunting.
The tribe usually camped in divisions at different places excepting during theoyster season, when they assembled unitedly at Chickiaba, on North Creek,where the large oyster banks on the foreshores to this day mark the old feedingground.” (Ainsworth 1922:28-31)
In addition, Ainsworth describes groups of people moving to the coast inSeptember to take advantage of the huge shoals of salmon in the surf at thattime of year. These fish were caught by spearing.
Macfarlane “As the swamps reached the waterless stage an abundance of eelspresented a plethora of the needful for the sustenance of the aboriginal, and there aslittle trouble capturing the slimy wrigglers in the shallow water. Some of theseattained a large size, but the average weight was considered the best for eating. Itwas strange how the swamps produced so numerous a quantity of the eel species, as indrought periods they were cleared of the fish, but breeding was renewed when refilledwith water from a flood.”
Macfarlane notes that the eels were cooked on a grill made of green sticks, suspendedabout 60 to 90cm above the cooking fire.
Perry (1839) - May - referred to a group of Aboriginal people living in huts in a sort oftemporary village at the head of a deep estuary (Clarence): “which appears to giveconsiderable command of fishing ground, such a position being essential to theirsubsistence…., The canoes of these (Aboriginal people) were formed with more carethan those in the neighbourhood of Port Macquarie and other places that had beenvisited, and were moored in a line in front of their villages. The (Aboriginal people)appear to possess, to a certain extent, habits of industry; their fishing nets, baskets,water vessels and cooking utensils being constructed with peculiar care and neatness.These people were delighted with being presented with some fish hooks.”
Scott, quoted in Brayshaw (1966) - “the schools used to travel from west to east closeinshore on the northern side of the harbour, at high water…. The fishermen, generally

Umwelt (Australia) Pty Limited1479/R01/V2 September 2001 17
about half a dozen at once, would rush into the water up to their middles…, then whenthe school was within striking distance, the spears would all be landed at once.”
Mackaness (1941) noted that Aboriginal people in the Twofold Bay region builtlightweight bark canoes with folder ends. When fishing the Aboriginal people werenoted to “occupy a kneeling position in their Mudjerre or canoes and may be seen likefloating specks off the coast spearing salmon; they are expert fishers.”
Mackaness (1941) - “fish are abundant and the Aborigines may be termedIcthyophagist…. Their mode of taking fish is by net, spearing and line and hook, thelatter ingeniously made from bone. Their canoe a sheet of bark from the straight partof a tree folded at the end.” (far south coast)
Anderson (1890) also describes canoes and wooden implements used by Aboriginalpeople on the south coast. The canoes were made of bark strips and were found alongbeaches as well as estuaries.
These descriptions provide an insight into the equipment that was used by Aboriginal people andalso alludes to the community nature of fishing activity. This theme is strongly supported byAboriginal people today.
Equipment used for obtaining resources from estuaries included:
• Spears. There are references to spear fishing from the shore, from canoes and within theshallow water. Spears had four or five prongs, and were sometimes tipped with barbs ‘ofkangaroo teeth’. Spears were also used to catch fish in the surf.
• Fish traps. Traps were sometimes made of stone (such as the structures at Arrawarra, PointPlomer and on Broughton Island), but were frequently made of plant materials, such as mattedfences across tidal channels (Enright 1935, Bundock 1898, Burns 1844, Rudder 1925). Theseauthors suggest that very large quantities of fish could be easily caught in these structures,especially during major fish runs (eg. mullet).
• Nets. There is some suggestion that nets on the north coast were made by women. A varietyof nets were used in estuaries, including the “tow-row” described by Ainsworth. Nets couldalso be used in much the same way as fence type fish traps in the shallow (or narrow) upperreaches of estuaries.
• Hook and line. Hooks and lines were in use by Aboriginal people at Sydney Harbour whenEuropeans first arrived there. There is some archaeological debate as to whether line fishingwas a post European adaptation in some parts of the north coast, but shell fish hooks andslightly conical, ground edge items recorded as fish hook files, are widespread in midden siteson the central and mid north coasts.
• Canoe. Aboriginal people were clearly skilled at the navigation of light weight craft insometimes dangerous currents. There are references from the north and central coasts ofpeople cooking fish and shellfish in their canoes.
• Look out trees. There are several references to people climbing trees (using footholds andropes made from bark and vines) to act as a lookout for schools of fish. One of these treesexisted in the Worimi Local Aboriginal Land Council area on the shore of Port Stephens untilvery recently.
• Hand trapping or collection. This was the principal method for gathering shellfish, althoughbaskets or other containers may also have been used to facilitate transport. In the case of

Umwelt (Australia) Pty Limited1479/R01/V2 September 2001 18
deeper water shellfish (ie. not pipi or rock platform species), there are references to peoplediving (examples are oyster and more recently abalone on the south coast).
• Poisoning - there are references to the use of a “smart weed” to stun fish in waterholes orestuarine backwaters.
Several of these Aboriginal fishing strategies will not be archaeologically visible.
3.2.1.2 Species targeted and seasonal preferences
The species identified in various ethnographic references as being targeted by Aboriginal peopleare summarised in Table 3.1.
Table 3.1 - Summary of Ethnographic References to Species (North Coast)
Habitat SpeciesEstuary • Fish including black bream, garfish, whiting, flathead, tailor and trevally
• Prawns• Oysters, whelks. Oyster diving and collection involved the whole tribe (see also
McBryde (1982) re the Wombah middens)• Birds including swan, wild geese, wild duck, redbill and pelican
Tidal creeks andswamps
• Birds - quail and brolga• Eels• Crabs and crayfish, lobster• Mussels, cockles (Anadara), oyster• Tortoise• Food plants including rush (typha), cunjevoi, orchid, blue water lily, blechnum
fern• “cobra”
Beach and coast • Fish - sea mullet, groper, kingfish, leatherjacket, bullseye, salmon, snapper,stingray
• Crabs and crayfish• Shellfish - pipi, rock platform species, anadara and mussel (brought from the
estuary)• Pandanus, pigface• Terrestrial species such as macropods• Mutton birds• Whales (possible strandings)
There is a widespread view amongst the ethnographic reports, in part substantiated byexcavation of midden sites, that people were generally on the coast through late spring,summer and autumn, but lived in the hinterland through the winter. However, some fishthat are known to have been targeted by Aboriginal fishers were also far more common (inschools) in the winter months, and it is possible that early observers did not note shortvisits to the coast at these times to obtain particular resources.
For example, Ainsworth (1922) notes that in September there were the salmon (Arripistrutta) runs. Sea mullet were also important. Mullet can be obtained almost continuouslythroughout the year, except possibly for early summer. From about late April to earlySeptember, sea mullet migrate in enormous shoals northwards along the beaches andwould have been easily obtained by netting and spearing.
By way of contrast, Sullivan (1982) refers to observations by Robinson (1844) of theapparently healthy appearance of Aboriginal people both on the uplands (of the Monaro)and right along the south coast between Goalan Head and Gippsland Lakes in mid winter,

Umwelt (Australia) Pty Limited1479/R01/V2 September 2001 19
during June and July. These descriptions do not suggest a strongly seasonal pattern ofcoast and hinterland occupation. Sullivan suggests that wintering on the south coast mayhave been more common than on the north coast.
Sullivan 1978 notes the size of the population in the north coast valleys at contact, and therapid demise of traditional life and customs (within 30 years of European settlement).Large groups of people met and camped at one spot for quite lengthy periods; eg. 200-300at Ballina in 1853 for the “oyster season”, 300 at Woodburn, and 600 at Tintenbar. Thereare also several references to village like settlements (eg at the mouth of the Clarenceestuary), suggesting relatively permanent settlement, at least on a seasonal basis.
Villages are also described from the south coast around 1840 (eg near Pambula, Brierly1843), but there is a strong suggestion that even by this time, Aboriginal occupationpatterns on the south coast had been severely impacted by European settlement (egwhaling) and that the villages were not representative of pre European times.
3.2.2 Types and distribution of archaeological sites
Sullivan (1982) provides an overview of the archaeology of shell midden sites along the NSWCoast. Although a number of middens have been further investigated since that time, most ofSullivan’s conclusions remain unchallenged. Key features of the archaeological evidence frommiddens are noted below. These features provide abundant evidence of the importance of theestuary fishery resource to Aboriginal people, and also point to changing technological and socialorganisation over time to enhance the return from the fishery. The structure of the NSW coastline,amongst other reasons, underpins some variations from north to south along the coast.
Colley (1987) highlights the difficulties of interpreting Aboriginal economic activity from theremains that are preserved in midden sites, particularly in relation to catch composition andseasonality. Factors include differential preservation of various materials (both plant andfish/shellfish), and the broad seasonal spectrum of some species.
Key features of NSW coastal midden sites include:
• In excess of 1500 midden sites have been recorded along the coast, primarily as open sites. Inthe Sydney region, a relatively high proportion of middens are situated in rock shelters,reflecting the relative abundance of cavernous overhangs close to the shoreline.
• The largest estuarine middens in NSW are located in the Macleay Valley (Clybucca and StuartsPoint). These mounded midden sites are estimated to contain 150000 to 200000 cubic metresof material. Similarly large middens are also known from the Richmond and Clarence valleys.
McBryde (1982) describes the results of excavations in large middens along the estuaries of theRichmond, Clarence and Macleay rivers. The shell middens of the Richmond estuary nearBallina include mounds up to 400 metres in length and standing 4 metres high, whilst on theMacleay, middens stretch almost continuously near Clybucca for several miles. On theClarence, middens stretch almost continuously from near Wombah (13 km inland) to the coast.These deposits are located about 100 metres from the present bank of the main channel. Insome cases they are situated on two terraces.
Oyster the dominant shell fish throughout the deposit at Wombah (97% in some levels).Maximum carbon dates range from around 3500BP at the base of the deposit, up to 1500BP inlevel 2A of the middens. Despite the large volume of oyster shell in these sites, McBryde(1982) estimates that the oyster component in the big middens on the north coast is considered

Umwelt (Australia) Pty Limited1479/R01/V2 September 2001 20
to have provided only 0.1% of the dietary requirements of expected groups visiting the siteover the dated period of occupation. McBryde concludes:
- The diet was likely to have been a mixed one and the archaeological evidenceoveremphasises the shellfish component;
- The period of occupation in any one year was likely to be short, and as hunting andfishing were still practised, the nineteenth century observers could well have missedthe significance of shell fish gathering;
- The evidence indicating that occupation was brief and periodic strongly suggestsseasonal occupation, ie a segment of an economy exploiting different resources atdifferent times of the year;
- The shell fish gathering, fishing and hunting economy documented for the site couldbe an important element in the total annual diet, a refreshing change in activities andfood components. Shell fish could be important in this change, even though notproviding a high return in terms of energy.
• Mounded middens are also found on the south coast, for instance at Pambula (these arerelatively well preserved), at Wagonga Inlet, Wallaga Lake and Sussex Inlet. Smaller middensare widespread from the mouths of estuaries to the upper reaches.
• Estuarine shell fish species comprise approximately 50% of the shell in middens along thecoast. On the south coast, rock platform species are more common, reflecting the higherincidence of headlands. Beach pipi middens are common on the north coast, but many of thesehave been destroyed.
• The mounding of midden sites may have been for cultural reasons rather than for anyenvironmental reason. Sullivan (1982) refers to midden mounds as markers of good places toreturn to in the landscape, plus a concept that keeping the waste shell together would encouragemore shellfish at that location.
• Middens on the south coast tend to be sheltered by headlands and also tend to face to the northand east. In the Clarence Region of the north coast, sheltered middens tend to be located on thewestern side of dunes. (note the relatively low frequency of headlands on the north coast, whencompared with the south coast). The aspect of sites also reflects winter wind directions andpossible seasonality of occupation.
• Midden sites are often located close to supplies of fresh water, such as tributary creeks, springs,fresh ponds in coastal deflation basins and wetlands. Sullivan suggests that 80 to 90% of allmidden sites are within 200 metes of a water supply, although occasional very large middens,containing entirely shell, are more than 500 metes from fresh water.
• Coastal sites provide evidence that they were clearly used in summer, but the evidence forwinter use is less definitive. Species that are present in midden sites could have been availableall year round.
• There is a tendency towards increasing variety of fish species and sizes in the upper layers ofsites. Several authors suggest that this is due to the introduction of new fishing technologies(particularly line fishing) over time. Dates for fish hooks are all less than 1000 years. On thesouth coast, there is a clear change towards hairy mussel and edible mussel in the last 1000years.

Umwelt (Australia) Pty Limited1479/R01/V2 September 2001 21
• Fish species that are reported from midden sites include snapper, bream (black and silver),leatherjacket, redfish, wrasse, mullet, flathead, and mulloway.
• Many midden sites have been destroyed by European land uses, with substantial destruction inthe early years of colonisation when middens were exploited as a source of lime. Pipi middensalong the coast may also be relatively underrepresented in the archaeological record, becausemany have been destroyed by mining and by coastal erosion and dune transgression processes.
• Human burials have been reported from midden sites right along the coast. Sullivan suggeststhat many of these burials, which include males and females (adults) and children, arerelatively recent (last 200 years). Wherever they occur, and whatever their age, the presence ofa burial in a midden deposit is highly significant to the Aboriginal community.
3.2.3 Implications of other types of archaeological evidence and Aboriginalplaces
Gungil Jindabah Centre (1996), (in NSW NRAC 1996) describes the cultural value of the coastaland estuarine landscape to Aboriginal people on the north coast of NSW, with particular referenceto the importance of “country”. They note that the coastal component of the region was, and stillis, a central component in the culture of many Indigenous communities. The coastal area has thehighest population density in the region and the seacoast provides a rich source of fisheriesresources. Coastal land, estuarine and marine resources were and still are of major economic,spiritual and cultural importance.
“Aboriginal people have continued their associations with their sites and still adhereto the spiritual laws associated with them. This is despite the historical conflict andinbuilt preconceptions adhered to by non aboriginals since the British invasion.”
One example of a significant site that is well known is the Goanna Headland site at Evans Head.This area contains sacred places as well as archaeological sites that are considered significant. Thissite physically consists of the Evans Headland, Pelican Island, the land associated with the top endof Bundjalung National Park, and formations of the headland including fresh water sites, thevegetation, the animals and the ocean. The site follows the Evans River upstream to Woodburnand then follows the Richmond River up as far as Coraki. The Gungil Jindabah Centre notes thatthere are various spots along the Evans and Richmond Rivers where parts of the story are indicatedby natural formations. The actual headland cannot be separated from the surrounding areas. Tosay that the headland alone is significant, is to separate it from all other physical features of the siteand diminishes its true extent, nature and cultural integrity.
The Gungil Jindabah Centre (1996) also refers to totemic spiritual associations, observing thatthese relate to every plant or animal within the natural environment. Every family has a totemwhich connects them to their existence. These totems bind people together in a spiritual essence totheir ancestors and their clan groups. Totems may also relate to the wind, water, or other climaticcondition. These places are sacred and should not be interfered with. However, Aboriginal peoplewould not generally discuss these spiritual concerns in the wider community.
3.3 INTERACTIONS BETWEEN ESTUARY GENERAL FISHERY ANDABORIGINAL HERITAGE SITES
The EGFMS provides a framework for commercial use of estuarine fish species, and also forcommercial harvesting of beach pipis and worms.

Umwelt (Australia) Pty Limited1479/R01/V2 September 2001 22
There are many Aboriginal sites along the banks of estuaries that provide abundant evidence of thevalue of estuarine resources to Aboriginal people, and in fact these sites underestimate the values ofestuaries because no plant materials are preserved, and only a portion of the more robust animalparts remain.
Estuary general fishing techniques involve the placement and inspection of traps and nets. Thetraps and nets are operated from small boats. These fishery activities are most unlikely to impacton the stability of estuary banks or beds. The nature of estuary fishing means that although thebanks of estuaries are lined with known Aboriginal sites, there is a low risk that sites will beimpacted by general estuary fishing activity.
There is potential for fishery related activities to impact on Aboriginal sites at restricted locationsalong estuarine waterways, for instance at boat ramps, and localities that are used for storage andmaintenance of equipment. The extent of the risk associated with these activities will vary fromone estuary to another, and definition of the risk for an individual estuary will depend heavily onthe availability of local knowledge (eg provided by discussions with local Aboriginal people andlocal NPWS officers).
Where potential impacts on Aboriginal sites are known to exist, it is important that they areaddressed by liaison and management actions at the local level. This will ensure compliance withthe requirements of the NPW Act, and will also enhance co-operation and understanding of culturalconcerns.
In general, the physical evidence of past Aboriginal occupation of estuary banks is most severelythreatened by land uses and activities other than estuary general fishing. Large midden sites in theHunter estuary and north coast estuaries were exploited for lime in the nineteenth century, andsometimes also for road base. Many sites have also been destroyed by agricultural land uses, urbanand tourist development, and some have been destroyed by bank erosion (that may have natural oranthropogenic causes).
Aboriginal sites along the sandy coastline are at some risk of impacts by commercial collectors ofpipi and worms, principally because of access to these areas by four wheel drive vehicles. It shouldbe noted, however, that commercial collectors of pipi and beach worm (ie. those whose activitiesare regulated by the estuary general fishing strategy) comprise only a small proportion of the fourwheel drive users of those ocean beaches that were traditional fishing and shell fishing locations forAboriginal people. Beach midden sites in many areas are also threatened by natural processes suchas storm wave erosion of frontal dunes and the mobility of transgressive dune fields (eg see Hughesand Sullivan 1974, Dean-Jones 1990, Umwelt (Australia) Pty Limited 2000). Significantdestruction of coastal dune sites also occurred during several decades of beach and dune mining forheavy mineral sands.
In the cases of both Aboriginal sites along the banks of estuaries, and Aboriginal sites along thedunes of ocean beaches, the overall risk that activities authorised by the EGFMS will detrimentallyimpact on cultural heritage evidence is considered to be small.

Umwelt (Australia) Pty Limited1479/R01/V2 September 2001 23
3.4 PROTOCOLS TO REDUCE THE RISK OF HARM TO SITES
The discussion presented in Section 3.3 suggests that overall, the risk that activities that areauthorised by the EGFMS will impact on Aboriginal sites (ie. physical evidence of pastoccupation), is low. Notwithstanding this, several management actions are proposed to ensure thatrisks to archaeologically and culturally sensitive areas are minimised. These include:
• Consultation with local Aboriginal community representatives in relation to any proposedcommercial fishery facility that would be located on an estuary bank or foreshore. This wouldinclude maintenance of existing ramps, new launching ramps, wharves and regional boatstorage or maintenance sites. In general, such facilities will require separate environmentalassessment and development consent including assessment of potential impacts on Aboriginalcultural heritage;
• Preparation of cultural awareness information for holders of beach pipi and wormauthorisations. In particular, these operators should be aware of the nature of pipi and othermidden sites along ocean beaches, and that such sites are protected by the NPW Act; and
• Ongoing consultation with local Aboriginal communities about developments in thecommercial sector. This will occur, for instance, through Aboriginal representation on regionalmanagement advisory committees (MACs).
4.0 INDIGENOUS ISSUES
4.1 THE ROLE OF FISHING IN COASTAL ABORIGINAL COMMUNITIES
This section describes the role of estuary fishing and collection of pipis and beach worms inAboriginal communities today. The discussion demonstrates the continuity of fishing as animportant Aboriginal cultural activity, and highlights the species and habitats that are targeted byAboriginal people. The discussion also explores, at a general level, the ways in which existing andproposed strategies to manage the estuarine general fishery interact with and impact on the interestsof Aboriginal communities. As noted in Section 4, this interaction is being explored more fully inthe development of an Indigenous Fishery Strategy.
4.1.1 Historical and contemporary fishing by coastal Aboriginalcommunities
Section 3 described the evidence for pre European Aboriginal use of the estuary fishery, and theethnographic evidence from the first years of competition for the resources of NSW estuaries withcommercial and recreational fishers.
The State Aboriginal Land Council has noted the strong historical dependency of coastalAboriginal communities on fishing. They provide an Aboriginal perspective of the locations ofmissions that were established to accommodate Aboriginal people in the late nineteenth century,observing that many missions were located on estuaries or coastal headlands. Aboriginal peoplewho were relocated to these missions would have been expected to provide a substantial proportionof their food supply by fishing and shellfish gathering.
A few publications provide evidence of the continuity of fishing as a lifestyle for Aboriginalpeople, and illustrate with specific case studies, the general principle described by the StateAboriginal Land Council. An example is the description of the Wreck Bay community on the

Umwelt (Australia) Pty Limited1479/R01/V2 September 2001 24
NSW south coast (Egloff 1981). Schnierer and Robinson (1996) review environmental uses andissues for Aboriginal people on the NSW north coast.
4.1.1.1 The Wreck Bay fishing community - a south coast example of historical Aboriginalestuarine fishing
Egloff (1981) refers to abundant archaeological evidence of Aboriginal fishing and shell fishgathering along the shorelines at Wreck Bay, with extensive middens containing shell fish, fishhooks (using shell) edge ground axes, bone points and flaked stone implements. Axe grindinggrooves, open campsites, bora rings and burial sites are also reported from the peninsula. Egloffdescribes fishing by men using spears that had hard wood prongs tipped with bone points. Thesespears were used in the bay and in shallow waters over rock reefs. Women also fished, using hookand line. Species represented in the midden sits include snapper and bream, as well as pipi andcockle.
The Aboriginal population in this part of the south coast was decimated after European settlement.Eventually the remaining Aboriginal people were settled at reserves at Roseby Park and Jervis Bay(Beecroft Peninsula), although a few people had continued to live in these areas throughout thenineteenth century. Egloff (1981) reports that the Office of the Protector of Aborigines provided aboat and fishing gear to Aborigines at Broughton Creek in 1882, and that a boat was also providedto the Jervis Bay people (at Currambene Creek) the following year.
When the Commonwealth took over administration of Jervis Bay in 1922, there were 25 Aboriginalpeople living in a fishing village at Wreck Bay and Aboriginal crews had fished this part of thecoast throughout the latter part of the nineteenth century.
Egloff’s (1981) description of fishing at Wreck Bay in the first half of the twentieth centuryhighlights the following features:
• Net fishing from small boats for mullet, blackfish, jewfish, kingfish, whiting and bream. 200to 300 cases of fish could be caught at a single shot;
• Snapper caught off the reefs with hand lines;
• Spotters stationed at vantage points (including high trees on the beach);
• Fish were carted to the railway at Bomaderry for transport to markets;
• Each catch was divided into five parts - one part for each crew member and one for the boatand gear which needed constant repair;
• In the 1940s and 1950s there were seven to eight crews of Aboriginal fishermen operating atWreck Bay, and a rotation system was used to provide equitable access. Each crew had rightsfor 24 hours in turn;
• Most fishing was done between Christmas and Easter, and at other times men worked at localtimber mills or picking vegetables;
• Catches declined in the late 1950s and 60s, and so did prices fetched for fish; and
• During the depression, families camped on the southern beaches of the bays and collectedpipis, mussels and oysters. People also gathered abalone at this time. It was sun-dried on wireracks and sold to traders from Sydney.

Umwelt (Australia) Pty Limited1479/R01/V2 September 2001 25
Egloff (1981) also notes that the Office of the Protector of Aborigines also provided fishing boatsto reserves and camps along the far south coast:
“In the Bodalla district, Aborigines were considered by ME Mort to be destitutewithout a boat. These Aborigines had sold fish for a living until their boat waswrecked while going to the assistance of a sinking vessel. Another image shattered;most white Australians do not realise the extent to which coastal Aborigines quicklyadopted European maritime technology and became net fishermen capable of makingtheir own gear and surprisingly enough, also pursued large whales. Recently buried atWreck Bay is one of the great whalers of Twofold Bay, Aden Thomas. Before himwere Hadigadi and Adgeree, two coastal Aborigines famous for their whalingexploits.” (p 23)
4.1.1.2 Contemporary Aboriginal community participation in estuary fishing
The number of Aboriginal people fishing in estuaries today is not well documented. FewAboriginal people now hold commercial licences that provide access to the estuary general sectorof the industry (Hector Saunders pers comm, Karuah Local Aboriginal Land Council).
However, a project funded by the Natural Heritage Trust and undertaken by the Centre forIndigenous Environmental Research at the Southern Cross University is seeking to shed some lighton Indigenous fisheries in NSW (Schnierer pers.com.).
Under current licensing arrangements, most Aboriginal fishers are included in the recreationalsector of the fishery.
NSW Fisheries is currently coordinating a national survey of recreational fishing activity. Theproject is a joint initiative of Commonwealth, State and Territory governments. A sample of 45000Australian households was selected from Australian Bureau of Statistics subdivisions. Thesehouseholds were contacted by telephone and information collected about participation in fishing,household structure, demographic profile (including ethnicity), and fishing intentions in the comingyear.
Fishing households were encouraged to participate in a diary program where monthly informationwas collected about fish catches, fishing effort and fishing expenditure. Although data processingis continuing, NSW Fisheries has provided preliminary information for the first ten months of thesurvey.
Preliminary results are noted below (Gary Henry pers comm):
10300 households were selected in NSW.About 8300 households provided a full response to fishing participation questions.These households contained about 19600 people.1.4% of the sample were Indigenous people.
1836 fishing households in NSW agreed to participate in the diary survey.23 (1.3%) of these households were Indigenous.3590 fishing people in NSW took part in the survey.63 (1.7%) of these were Indigenous people.
Clearly, the sample of 63 Indigenous fishers is only small and also includes both inland and coastalfishers. Nevertheless, the sample provides a preliminary indication of some of the characteristicsof Aboriginal fishing activity, which perhaps distinguish it from fishing by other groups.

Umwelt (Australia) Pty Limited1479/R01/V2 September 2001 26
The sample of 63 Aboriginal fishers has gone fishing on 266 separate occasions in the past tenmonths and the number and species diversity of their catch is shown in Table 4.1. Estuarine andmarine species are shown in italics. The fishing effort by these fishers over the period of thesurvey is greater than the average across the state, hinting at the broader Aboriginal communityconsumption of the catches of Aboriginal fishers. The currently available data does not provide anindication of other types of fishing activity, or of other estuarine resources that are of importance toAboriginal people.
A more detailed survey and analysis of Aboriginal fishing practices would be needed to draw firmconclusions about the nature of participation of Aboriginal fishers in the estuary fishery.
Table 4.1 - Results of Recreational fishing survey, Indigenous households
Species Common name Kept Released Total
Bream – unspecified 32 66 98
Carp 37 1 38
Catfish – freshwater 1 2 3
Catfish – unspecified 6 6
Cod - Murray/ Murray perch 4 20 24
Cod - red rock/ red scorpion/ coral perch 2 2
Cod – unspecified 1 1
Fish – other 12 12
Flathead – unspecified 43 79 122
Flounder/ sole/ flatfish – unspecified 6 6
Garfish – unspecified 30 30
Gurnard 3 3
Leatherjacket 6 6
Lobster – unspecified 12 11 23
Morwong – blue 0 0
Mullet – unspecified 4 7 11
Mulloway/ jewfish/ kingfish 3 3
Non-Fish – other 1 1
Perch - golden/ yellowbelly/ callop 42 42
Perch – pearl 1 1
Perch - redfin/ English 1 1
Pike – unspecified 1 1
Salmon - Australian east/ west/ kahawai 1 1
Shark – unspecified 1 1
Snapper - pink/ southern/ squire 2 13 15
Tailor/ chopper/ jumbo 9 7 15
Trout – brown 1 1
Trout – rainbow 10 10
Whiting -unspecified 10 39 49
Yabbies 7 7
Yabbies/ nippers/ bass yabbies 40 40
Grand Total 298 276 574

Umwelt (Australia) Pty Limited1479/R01/V2 September 2001 27
4.1.1.3 Fishing method on the north coast
Faulkner (2000) provides general information about Indigenous fishing in northern NSW today.He notes that target species include both freshwater and saltwater species, with fish, crayfish,freshwater mussels, marine/estuarine shellfish, aquatic woodworms and freshwater turtle beingmentioned.
Fishing technology includes hand lines (82%), rods and reels (57%), nets and spears, together withspecialised traditional environmental knowledge. Faulkner (2000) notes particularly theconcentrated effort of Aboriginal fishing practice, where a group of fishers is fishing not only forthemselves, but to provide food, medicines and other resources for others in their community. Thescale of fishing effort by these Aboriginal fishers is greater than if they were occupied withrecreational fishing activity as individuals, but the catch is generally not intended for sale.Notwithstanding this, the catch has significant value to the Aboriginal community, as a supply offood, to meet social obligations within the community, and to provide materials for barter. Moredetailed analysis of north coast fishing participation, practices and cultural values is provided inFaulkner (2001, in prep) (not currently available).
4.1.2 The economic and social value of fishing in coastal Aboriginalcommunities
Most Aboriginal people who fish in estuaries and collect shellfish from beaches are currentlyclassified as recreational fishers. Many recreational fishers of all ethnic backgrounds fish for bothlifestyle and dietary supplementation reasons. However, the way fishing is reported to be practisedby the Aboriginal community reflects strong cultural, lifestyle and economic factors.
Aboriginal people persistently describe fishing activity as something that is done at the communityscale, rather than the individual scale. Many members of the community join together to fish andcollect shellfish and to share other information about the environment. Sharing and barter of fishcatches is part of the way people within a community meet their social and cultural obligations toothers. The fishing outing also provides opportunities for the passing of traditional ecologicalknowledge and cultural knowledge from one generation to the next.
The economic value of this type of fishing activity to individuals and to whole Aboriginalcommunities is difficult to quantify. There are a number of constraints that need to be taken intoconsideration when assessing the economic value of estuary fishing in Aboriginal communityeconomies, and therefore the impact that regulation of the fishery has had and will have on theeconomy of Aboriginal communities. These matters are noted below, on the basis of anecdotalinformation from the State Aboriginal Land Council and some Local Aboriginal Land Councils.Although it would be possible to document and verify these general statements, a detailed socialand anthropological study would be necessary. Such a study is beyond the scope of the present EISprocess. The time frame necessary to achieve the level of trust between the Aboriginal communityand researchers, and for transfer of effective information about the economic value of variousactivities, is also outside the scope of this EIS process. Some of these matters are currently beingaddressed through the consultation for the preparation of an Indigenous Fishery Strategy for NSW(see Section 4.5.3).
Key points that have emerged from the consultation during the preparation of this EIS include:
• In general, many people who live in coastal Aboriginal communities are relativelydisadvantaged in terms of education, and access to the broader job market. This affects therelative economic importance of non-market food sources to individuals and to the community.
• On the south coast, employment based around a series of seasonal jobs is described. Theseinclude work in sawmills, bean and potato picking and fishing (particularly during the

Umwelt (Australia) Pty Limited1479/R01/V2 September 2001 28
summer). Fishing is described as a community subsistence activity, with most of the catchconsumed within the community, and a portion traditionally traded for other commodities, orsold locally (not through the Commercial Cooperative). This type of fishing and trading isdescribed as being of great importance to community welfare, although the overall cashexchange may be very small, and very poorly documented.
• On the north coast, small scale marketing of fish or shellfish at the local level provides animportant economic supplement to the incomes of individuals and is also considered to provideimportant social benefits to communities with a high level of unemployment amongst youngpeople.
• Community based fishing and use of other estuary resources is described as having indirecteconomic value to Aboriginal communities; for instance, because fishing parties also collecttraditional medicines from the estuary, because the fish resources provide a healthy componentof the diet (reducing the risk of certain illnesses), and because the fishing activity may provideoutlets for other social issues that have economic implications. None of these aspects aredocumented quantitatively.
• Aboriginal people state that they have a strong interest in the sustainable use and managementof estuary fishery resources, so that the full range of resources of value to the community isavailable for future generations.
4.2 CURRENT ACCESS OF ABORIGINAL COMMUNITIES TO ESTUARYFISHERY RESOURCES
Commercial fishing has existed in NSW estuaries since the mid nineteenth century, and byhistorical accounts from the late nineteenth century, it existed initially as a locally based activitybecause of the lack of effective refrigerated transport to bring catches to the Sydney or exportmarkets. Commercial fishing operations moved to more remote estuaries early in the twentiethcentury. Thus, the interaction of traditional Aboriginal fishing activity in estuaries (and shellfishing on beaches) with the commercial estuary sector spans approximately 150 years in theSydney area, and 100 years elsewhere on the NSW coast. In many Aboriginal communities, atleast some members held general commercial fishing licences, and participated in the commercialsector, as well as fishing to support family and friends (see Section 4.1).
From the late nineteenth century, a number of estuaries (or parts of estuaries) were closed tocommercial fishing, generally to conserve or to allow the regeneration of fish stocks. TraditionalAboriginal fishers would have continued to have access to the aquatic resources of these waterwaysduring periods of commercial closure.
Since the mid 1980s, a number of new regulations have been introduced by NSW Fisheries (seeTable 4.2). The broad objective of these regulations was to enhance the efficiency of thecommercial fishery, and introduce greater control over fishing effort and impact. Until this time,many nominal participants in the industry had held licences that were used only rarely in terms ofthe historical importance of the commercial fishing activity to the licence holder’s income.However, with many “sleeper” licences issued, there was a potential for major impacts on thefishery resource, if for instance, all licence holders decided to increase their effort and use the fullextent of the licence. The new provisions forced amalgamation of many smaller businesses andlow-activity licences.
Today, 50% of licensed estuary fishers account for 90% of the revenue from the fishery, and thelargest 10% of operations are responsible for 38% of the revenue from the fishery. The number ofAboriginal people who are licensed as commercial fishers in the estuary general sector and therelative scale of their fishing effort, is not known.

Umwelt (Australia) Pty Limited1479/R01/V2 September 2001 29
The introduction of greater regulation in the estuary general fishery from the mid 1980s had severalunintended consequences in relation to the access of Aboriginal communities to the estuary fishery.The impacts of the regulations continue to be of concern to Aboriginal fishers, and are discussedfurther in Section 4.2.1.
Table 4.2 summarises the changes to the regulations, and the ways in which these changes are seenby the Aboriginal community to have disadvantaged their access to the fishery. The informationpresented here about the views of the Aboriginal community is based on discussions with the NSWAboriginal Land Council, NPWS Aboriginal sites officers/liaison officers along the NSW coast anda small number of individual Aboriginal fishers.
Table 4.2 - Increasing Regulation of Estuary General Fishing
Date Regulation Effects on Aboriginal fishers (advice from Aboriginal communityrepresentatives)
1980 Access to the abalonefishery limited
Commercial access to abalone is available only to those holdingcommercial licences. Two licences are held by the Cruise family atEden, but no other Aboriginal fishers now participate legally incommercial abalone fishing. Aboriginal communities feel that thescale of their past involvement in abalone fishing was greater than theindividual recreational fisher, and was not recognised in the allocationof abalone licences, in what is now a very lucrative industry.Aboriginal people feel that they were not consulted adequately abouttheir interests in this industry at the time. Note that abalone is not partof the estuary general fishery.
1984 Freeze on the issue ofnew boat licences
This was the first time that access to the general fishery had beenlimited. Although existing boats were not affected, limits wereintroduced on new commercial boat licences, and additional boats hadto be justified.
1986 Access limited too f f s h o r e p r a w ntrawling
No specific information available.
1987 Freeze on the issue ofnew commercialfishing licences
The aim of this regulation was to ensure that new participants in thefishing industry replaced existing fishing effort rather than adding to it.Aboriginal communities note that they tend to fish in communitygroups, so that more than one generation would be represented in afishing group. During fishing activities, not only fishing skills butother cultural information might be shared with younger members ofthe community, so that sale or transfer of the licence from onegeneration to another is not as straightforward as in some other parts ofthe general community. Coastal Aboriginal communities feel that theywere disadvantaged by this change to the legislation
1993 Access to the lobsterindustry limited
No specific information available.
1994 Licensing policyintroduced, catchvalidation required
The 1994 legislation was the first part of the changes that continueduntil 1997 when the restricted fishery concept was introduced.Although NSW Fisheries required only small commercial returns to bedocumented, some Aboriginal families who had held generalcommercial licences were not able to meet this requirement. In thisperiod, requirements that all participating fishers hold a licence wereintroduced. Aboriginal fishers feel that the small scale, group fishingstrategy of Indigenous people is disadvantaged by this requirement.

Umwelt (Australia) Pty Limited1479/R01/V2 September 2001 30
Table 4.2 - Increasing Regulation of Estuary General Fishing (cont)
Date Regulation Effects on Aboriginal fishers (advice from Aboriginal communityrepresentatives)
1997 Restricted fisheriesintroduced for majormarine fisheries
This legislation ended the period that licensed fishers couldautomatically access multiple fisheries. Aboriginal people feel thatNSW Fisheries did not consult adequately with them about theimplications of this legislation. Entry to the restricted fishery requireddemonstration of a minimum level of catch history. Aboriginal peoplefeel that basing licence renewals on returns lodged with NSW Fisherieswas not consistent with the “circular seasonal” fishing practised byAboriginal communities, and the family support/barter economy ofAboriginal communities. The restricted fishery licences also meant thatseparate licences now needed to be held to access the estuary general,beach haul and prawn haul components of the fishery, which were allpart of the seasonal round of small scale Indigenous fishers.Aboriginal fishers also report that the zoning of the coast for licensingpurposes is not consistent with their seasonal activities, which wouldonce have involved considerable movement along the coast (eg fromNowra to Lakes Entrance).
Closure of certainbeaches and estuariest o c o m m e r c i a la c t i v i t y d u r i n gholiday periods
Several NSW estuaries are closed to commercial fishing overweekends and during holiday periods when recreational demand isgreatest, or to protect habitat/resources (total of 200 closures current).Aboriginal people do not generally regard themselves as recreationalfishers. These closures further restricted community scale fishingactivities (eg pipi gathering).
4.3 IMPACT OF CHANGING REGULATIONS - SPECIES AND LOCATIONS
4.3.1 Pipis and beach worms
Pipis are a bivalve mollusc that is common on sandy beaches, particularly along the central andnorth coasts of NSW. The past importance of pipis in the diet of Aboriginal people is attested to bythe presence of large numbers of extensive middens comprising almost exclusively pipi shell, in thedune fields behind central and north coast beaches. These middens mostly appear to date to the last3000 years (see Section 3.2.2). There is no doubt that pipi continues to be an important part of thediet of coastal Aboriginal communities today, and pipi gathering is an important social as well asdietary activity.
Pipis are also now a growing commercial resource, with pipis sold as bait and for consumption insoups and chowders. The pipi market grew rapidly from a low base to a peak of approximately70000 tonnes (value $125000) in 1996-97, but dropped dramatically following concerns aboutcontamination by biotoxins from algae. NSW Fisheries predict that this sector of the commercialmarket will recover and grow. Commercial pipi gathering is almost exclusively by hand.
There are few, if any, Aboriginal people involved in the commercial harvesting of pipis (ie. holdingestuary general licences with endorsements for pipis). Aboriginal people therefore currentlyharvest pipis as part of the recreational sector where strict bag limits now apply. Recreationallicences are also now required to be held by each individual participating in pipi gathering, unlessthey are party to a registered Native Title claim.
On the north coast, changing regulations about access to pipi resources has lead to some conflictsabout small scale marketing of pipi (generally for bait) by Aboriginal communities, such as theBundjalung community at Yamba. In this community, Aboriginal people report that they have hadlong standing arrangements with local fishing tackle and bait suppliers to provide pipis for baitduring the peak tourist season. Aboriginal people note that the money earned from this activity

Umwelt (Australia) Pty Limited1479/R01/V2 September 2001 31
supplements income from other part time jobs and social security payments, particularly for youngAboriginal people (verbal paper presented by the community at the NSW Coastal Conference,Yamba 2000).
4.3.2 Fish species
Table 4.3 shows the species that are commonly reported to be caught by Indigenous fishers, orhave been reported as a significant component of bone from Aboriginal sites along the NSW coast.It also shows the most commonly caught commercial species, and the extent to which some ofthese species are currently exploited by the commercial fishery.
Table 4.3 - Species valued by commercial and Indigenous fishers
Species Commercial fishery Indigenous fisherySea mullet Important resource, likely to be
fully fishedFrequent ethnographic referencesright along the coast; reported inrecreational survey of Indigenousfishers; reported from south coastIndigenous fishers in 1950s
Luderick Moderately fished Widely f ished, anecdotalinformation
Yellowfin bream Fully fished Black bream (not yellow finbream) reported ethnographicallyand in midden sites; reported fromthe Wreck Bay community in1950s
School prawns Fully fished Widely f ished, anecdotalinformation
Dusky flathead Fully fished Reported ethnographically and inmidden sites; reported inrecreational survey of Indigenousfishers
Blue swimmer crab To be determined Widely f ished, anecdotalinformation
Sand whiting Moderately fished Reported ethnographically and inmidden sites; reported inrecreational survey of Indigenousfishers; reported from the WreckBay community in the 1950s
Longfinned eels Moderately to fully fished Ethnographic reports of eeltrapping in upper estuaries andwetlands
Pipi To be determined Most common species in oceanbeach middens; pipi gathering astrong contemporary Indigenousfishery activity, both recreationaland small scale commercial
Flat-tail mullet To be determined No information availableSilver trevally Fully fished to overfished Reported ethnographically and in
midden sitesMulloway To be determined Reported from archaeological
sites; reported from the WreckBay community in 1950s
Tarwhine To be determined No information availableLeatherjacket To be determined Reported from archaeological
sites

Umwelt (Australia) Pty Limited1479/R01/V2 September 2001 32
Table 4.3 - Species valued by commercial and Indigenous fishers (cont)
Species Commercial fishery Indigenous fisheryGarfish To be determined Reported in recreational survey of
Indigenous fishersTailor To be determined Reported ethnographically;
reported in recreational survey ofIndigenous fishers
Snapper Fully fished to overfished Reported from archaeologicalsites; reported in recreationalsurvey of Indigenous fishers
Yellowtail Fully fished No information availableTrumpeter whiting To be determined No information available –
probably widely fishedAustralian salmon To be determined Commonly reported in
ethnographic descriptionsRock oyster Abundant in estuarine middens
(especially north coast)Mud/sand oyster Common in estuarine middens
along entire coastHairy and edible mussel Abundant in upper levels of south
coast middens (last 1000 years)Blood cockles (Anadara cockles) To be determined Contemporary Indigenous fishery,
very common in estuarinemiddens right along the coast
Rock platform shellfish Common in coastal middens,particularly on the south coast,where headlands more frequent
Mud whelk Common in archaeological sites
This very preliminary level of analysis indicates, as might be expected, that there has been andcontinues to be a strong overlap between the fish species targeted by commercial fishers and thosethat have been targeted by Aboriginal people in past and contemporary fishing activities. There ismuch less overlap between commercial and Indigenous shell fish harvesting, although a number ofthe shell fish species preferred by Aboriginal people are also now collected by other ethnic groupsin NSW.
Of particular note is the reported extent to which some species, of long standing importance toIndigenous fishers, are considered to be fully fished to overfished in the commercial sector,although NSW Fisheries also note that the status of some species requires further analysis.
4.4 NATIVE TITLE AND LAND CLAIMS
Local Aboriginal Land Councils in NSW may make claims with respect to Crown Land under theNSW Aboriginal Land Rights Act. In general, land claims to date have included parcels of landalong the banks of estuaries, and on beaches. For instance, the government announced in March2001 the granting of a Land Claim by the Worimi Local Aboriginal Land Council over substantialsections of Stockton Beach. Although part of the claim is proposed to be leased back to NPWS tobecome part of a new national park in the vegetated dunes of Stockton Bight, the granting of theLand Claim will provide the Land Council with opportunities to exercise a high level of controlover the use and management of the beach and dunes, including the management of a large numberof midden sites.
The Commonwealth Native Title legislation was introduced in 1993. Up until the end ofJune 2001, a total of 335 Native Title claims had been made by Aboriginal people in NSW. Very

Umwelt (Australia) Pty Limited1479/R01/V2 September 2001 33
few of these have yet been determined, and only 52 have reached the acceptance or registrationstage. Of the 335 claims, 147 have subsequently been withdrawn.
Where it is demonstrated to exist, Native Title provides the Aboriginal community withopportunities to negotiate in relation to allocations of the resources of the land (or water) inquestion, and also to negotiate compensation for loss of access to traditional sites and practices.
Of the Native Title claims that have been lodged to date in NSW (and the Jervis Bay territory), 50relate to land around estuaries and along the coast. Two claims on the south coast (by theWalbunja people and the Djiringanj people) extend both along the coastline and out to the 200nautical mile limit. Other examples of claims that cover estuarine and coastal waters include thoseby the Bherri Werri people (Jervis Bay), Eloura people (south of Wollongong), Gundungurrapeople (Moruya) and Banjalang people (north of Yamba and at Byron Bay).
In some cases, Native Title claims have been made and subsequently withdrawn, although this isnot necessarily an indication that local Aboriginal people consider that the claim has a weak case.In all cases, the effort required to demonstrate the necessary connections to the land, and to achievesuccessful outcomes from Court cases, is high. It can be expected that resolution of Native Titleissues will take many years.
The issue of Native Title is noted in the draft Estuary General Fishery Management Strategy as areason that Aboriginal people are stakeholders in the development and implementation of thestrategy. The draft strategy also alludes to the potential for Native Title to lead to the exclusion ofother groups of estuary fishers from some waterways. As no Native Title claim that would providefor exclusive use or partial curtailment of other users has yet been granted in coastal NSW, thedraft strategy does not specifically address the process for dealing with future interactions betweenIndigenous fishers and commercial fishers in this context.
The draft Strategy does discuss contingency plans “in the case of emergencies or unpredictableevents” and also has a trigger point for review that relates to significant shifts in the balancebetween catches taken by various sectors (commercial, Indigenous and recreational) in any estuary.
These broad strategies will allow the Estuary General Management Strategy to be reviewed andamended over time, as the issues related to tenure of waterways and the seabed are further resolved.
4.5 MANAGEMENT OF INDIGENOUS FISHERY AND ESTUARY GENERALFISHING INTERACTIONS
4.5.1 Outstanding issues of concern to coastal Aboriginal communities
The level of Aboriginal participation in the commercial fishery sector appears to have declinedsubstantially over the last twenty years. There are now perhaps less than fifteen active fishinglicences (estuary general and beach haul) held by Aboriginal families along the coast. However,the lack of commercial participation is not an indication of declining Indigenous participation infishing generally. There are four main categories of outstanding issues of concern to theAboriginal community in relation to their participation in the management of fisheries in NSW(NSW Fisheries 2000) and each of these is also relevant to the impact of estuary generalcommercial fishery strategy on Aboriginal communities:
• lack of recognition and accommodation of traditional Indigenous fishing practices;
• declining participation of Aboriginal people in commercial, recreational and aquaculturefisheries;

Umwelt (Australia) Pty Limited1479/R01/V2 September 2001 34
• insufficient meaningful presence and participation of Aboriginal people in the process formanaging and conserving fisheries resources; and
• need for better communication and consultation with Aboriginal people.
4.5.2 Actions to address Aboriginal concerns in the draft EGFMS
The draft estuary general fishery management strategy identifies Indigenous people as stakeholdersin the estuary general fishery, noting that these interests arise from:
• direct participation in the fishery as commercial fishers;
• traditional fishing practices, whereby people catch fish on behalf of themselves and theircommunity; and
• lodgement of Native Title claims over estuarine areas that are used for commercial fishing.(see Section 4.4).
NSW Fisheries legislation does not currently recognise Indigenous fishers as a separate sector ofthe fisher population, and this is the main reason why none of the legislative reviews to date havegiven extensive consideration to Aboriginal community concerns.
The draft EGFMS does not specifically address the Aboriginal community’s view that theevolution of the fisheries legislation in NSW has gradually but consistently undervalued theinterests of Aboriginal people in the estuary fishery. The draft strategy does, however, foreshadowfuture amendments to the strategy to better accommodate Aboriginal community interests.
For instance:
Objective 4.1 To monitor and provide an appropriate allocation of the fisheriesresource between fishing sector groups, acknowledging the need for seafoodconsumers to access fresh quality fish.
Action: (a) assess, as far as is practicable, the size of the non commercial andillegal catch and the relative impact of such harvesting on the resource, taking intoaccount the results of the National Recreational and Indigenous Fishing Survey.
Part 4 of the Estuary General Fishery Management Strategy relates to performance monitoring andreview. The performance indicator listed for appropriate sharing of the estuary general fisheryresource is the catch level (including estimates) of the commercial, recreational and Indigenousfishing sectors. A trigger point for review is noted as a shift of relative catch levels of 25%between sectors over the term of the strategy.
It is important to note that such a shift in relative catch is unlikely to occur without significantchanges to policies affecting access to the resource.
4.5.3 Towards a NSW Indigenous Fishery Strategy
NSW Fisheries has recognised that coastal Aboriginal communities have long standing andlegitimate interests in the fishery resources of estuaries, as well as in pipis and beach worms. TheNSW Government now also acknowledges that Indigenous community interests in the estuaryfishery are contemporary and do not only relate to past history. The traditional access ofAboriginal communities to natural resources has been restricted by existing fisheries managementpolicies and legislation.

Umwelt (Australia) Pty Limited1479/R01/V2 September 2001 35
A recent working paper prepared by NSW Fisheries (2000) indicates that consultation isprogressing about how best to recognise and accommodate the rights and interests of Aboriginalpeople in the estuary fishery and other commercial fisheries. The working paper is part of theprocess for the development of an Indigenous Fisheries Strategy for NSW.
The working paper does not provide a specific definition of Indigenous fishery activities, butseveral important characteristics can be deduced.
A number of actions have already been implemented to recognise the interests of Indigenousstakeholders. These include:
• NSW Fisheries accessed funds from the Federal Government as a result of the Coastal ZoneInquiry to employ an officer to begin the development of an Aboriginal fisheries strategy(1996/7);
• A series of workshops with Indigenous communities across NSW in 1998. These workshopsidentified many issues, which were summarised in the working paper into fifteen principalissues of concern to Aboriginal people that should be addressed by the Indigenous FisheriesStrategy;
• In October 2000, the NSW recreational fishing fees policy was released. The policy exemptsAboriginal people fishing in saltwater from the recreational fishing fee, provided that they areparty to a registered native title claim and traditional cultural fishing under the IndigenousFisheries Strategy. Until the strategy is released an interim arrangement has been implemented.Local Aboriginal land council (LALC) members and any Indigenous persons fishing with themare exempt from the fee if fishing in the LALC area. A practical process for issuing certificatesof fee exemption is now being considered; and
• Principles for the Indigenous Fisheries Strategy have been proposed.
4.5.4 Interaction of the EGFMS and the Indigenous fishery strategy
The time frame for the finalisation of the Indigenous Fisheries Strategy is not clear, and there aremany complex issues to be resolved before a sustainable strategy is agreed to by the stakeholders.It is most probable that the Estuary General Fishery Management Strategy will be assessed and willcommence implementation before negotiations about the Indigenous Fisheries Strategy arecomplete.
The preliminary indications are that the Indigenous Fisheries Strategy will, subject to Governmentfunding address many of the issues that remain as outstanding concerns to the Aboriginalcommunity in relation to the estuary general fishery. It is also possible that the strategy willinclude a staged series of actions to gradually improve Indigenous access to the natural resources ofestuaries and other fisheries, ensuring that any necessary changes to the EGFMS will also begradual.
Ongoing review of the Estuary General Fishery Management Strategy will be essential to ensurethat any changes in the policy approach to Indigenous fisheries are adopted within the EGFMS. Itis proposed that the EGFMS will be reviewed in two years, with particular attention to ensuringconsistency between any Indigenous Fishery Strategy that exists at that time, and the managementprotocols contained in the EGFMS.
4.5.5 Further strategic actions to mitigate impacts on Indigenous fishers
It is anticipated that the consultation leading to the adoption of a new NSW policy by theIndigenous fishers will address many of the outstanding concerns of the Aboriginal community.

Umwelt (Australia) Pty Limited1479/R01/V2 September 2001 36
The key actions, in relation to estuaries, that are being considered for inclusion in an IndigenousFishery Strategy (NSW Fisheries Working Paper, 2000) are noted below. There is as yet noindication as to which of these options may be included in the strategy that is agreed between theNSW Government and Aboriginal people, but discussions are continuing. Options being discussedinclude:
• Issue permits or change regulations to allow exemptions for the use of certain low impactfishing gear (for instance small nets, spears and traps).
• Establish closures or management rules on sites that are recognised as significant to protecttraditional Indigenous fisheries.
• Establishing closures on particular species for harvest by Indigenous people only, such asbimbulas (blood cockles).
• Issuing permits to allow possession and bag limits to be exceeded for certain species, areas orperiods, for individual and communities.
• Bimbulas are currently under utilised and are of low interest to commercial fishers. Thesecould form the basis of a sustainable Indigenous fishery.
• Some under utilised species such as Australian salmon could become a useful base forboutique-style, value-added processing in a small artisan style fishery and processing venturethat used local community labour and resources.
• Expansion of the fishery for gathering beach worms and pipis from north coast beaches for baitfor recreational fishing could be a viable and sustainable scheme.
• Extensive aquaculture (ranching) of black bream, snapper and prawns in intermittent southcoast lagoons could be a viable scheme.
• Establish a program (like a Fishcare Volunteer Program) with Indigenous communities, to useand pass on Indigenous knowledge about fish habitat and conservation.
• Cross-cultural training for fisheries officers, and employment of Aboriginal Fisheries officersto enhance the accessibility of fisheries information to Aboriginal communities.
• Establish an Indigenous fisheries committee (to advise the current advisory council onIndigenous issues).
NSW Fisheries is advancing new policies in relation to marine conservation areas, recreationalfishery areas and aquaculture at the same time as strategies for various commercial sectors arebeing developed and assessed. Within this far reaching review of fishery management, innovativeopportunities for responding to Aboriginal cultural values in relation to the estuary general fishery(and other fisheries) may emerge. The critical action in this regard is to provide meaningfulopportunities for communication and discussion of all aspects of fisheries management withAboriginal community representatives. A secondary action is that close co-ordination ismaintained between all aspects of fishery management policy as it evolves.

Umwelt (Australia) Pty Limited1479/R01/V2 September 2001 37
5.0 SUMMARY OF ACTIONS TO MINIMISE THE RISK OFIMPACT OF ESTUARY GENERAL FISHERY ACTIVITIES ONABORIGINAL SITES AND INDIGENOUS ISSUES
As noted above, the risk of impacts on Aboriginal sites from estuary general fishery activities isconsidered to be low at the whole of industry level, although specific local issues will need carefulmanagement.
Many of the concerns of Aboriginal communities about the impact of current commercial fisheryregulations on their livelihoods and lifestyles are being addressed through the partnership withNSW Fisheries to develop an Indigenous Fishery Strategy. However, this process may take sometime, both to finalise to the satisfaction of all stakeholders, and to implement through changes toother strategies and legislation.
In the shorter term, several actions are recommended to minimise the risks of adverse interactionsbetween estuary general fishery activity, Aboriginal heritage and contemporary Indigenouscommunity issues. These include:
• Focus on enhancing communication between NSW Fisheries and Aboriginal communities at alllevels. This would include:
- cultural awareness training for NSW Fisheries staff;
- Aboriginal membership of local area fishery management committees;
- Employ Aboriginal liaison officers to enhance transfer of information to Aboriginalcommunities, and to assist with the management of culturally sensitive information;
- Consultation with Aboriginal community representatives about proposed new fisheryinfrastructure along the banks of estuaries that could impact on sites of cultural heritagevalue; and
- Consultation with NPWS about potential impacts on known Aboriginal sites for any newinfrastructure development.
• Prepare cultural awareness material for commercial fishers in the estuary general sector (andother sectors) highlighting risks to Aboriginal sites and how these can be minimised. This isparticularly important for beach pipi and worm collectors who access beaches in 4WDvehicles;
• Ensure close co-ordination of the preparation of new fishery management strategies forcommercial, conservation, recreational and Indigenous sectors, to enhance opportunities foridentifying innovative cross sectoral management options;
• Explore opportunities for further Indigenous fishing or recreational fishing development inestuaries that are currently subject to a low level of commercial fishing activity; and
• The EGFMS should be reviewed after two years, so that changes to Indigenous fishery policiescan be accommodated.
6.0 REFERENCES
Umwelt (Australia) Pty Limited1479/R01/V2 September 2001 38
HISTORICAL REFERENCES
Australian Heritage Commission. Register of the National Estate Database.www.environment.gov.au/heritage/
Australian Institute for Marine Archaeology. Australian National Shipwreck Database.www.aima.iinet.net.au.
Baker, R, 1999. NSW State Heritage Inventory Form.
Bateson, C, 1972 et seq. Australian Shipwrecks, 5 Vols, Reed, Sydney.
Blainey, G, 1968. The Tyranny of Distance, how distance shaped Australia's history, Macillan,Melbourne.
British Register of Shipping, London, UK, all years.
British Register of Shipping, Sydney, New South Wales, all years.
Brooks, Graham, and Associates Pty Ltd, 1996. Sydney Water Heritage Study, report to SydneyWater, unpub.
Callen, T. Bar Dangerous: A Maritime History of Newcastle. Newcastle Regional MaritimeMuseum, Newcastle, 1986.
Callen, T. Bar Safe. Newcastle Regional Maritime Museum, Newcastle, 1994.
Camden Haven Historical Society, various references.
Clarence River Historical Society Newsletter, various issues.
Connah, G (ed), 1997. The Archaeology of Lake Innes House: Investigating the Visible Evidence,Connah, Canberra.
Connah, G (ed), 2000. Excavations at Lake Innes House, 1999. Report to the NPWS and NSWHeritage Office, unpub.
Dept of Navigation Register of Wrecks, NSW Government, all years.
Dunn, G, 1997. Shipbuilders of Brisbane Water¸ Author, Gosford
EJE Architecture, 2000. Wangi Power Station Conservation Management Plan. unpub.
Fletcher, Capt James. Index of shipwrecks on the NSW Coast Between the Hawkesbury andManning Rivers, 1788-1970, unpub
Gill, GH, 1957. Australia in the War of 1939-1945, Australian War Memorial, Canberra.
Hastings District Historical Society (oral report).
Higginbotham, E, 1993. Report on historical archaeological sites, Sutherland Heritage study,report to Sutherland council, unpub.
Historical Society Wauchope, Chapter file notes.

Umwelt (Australia) Pty Limited1479/R01/V2 September 2001 39
Jeffries, C. Survey plan of Hunter River and harbour, 1816, unpub.
Kerr, JS, 1984. Design for Convicts, National Trust of Australia and Australian Society forHistorical Archaeology, Sydney
Knaggs et al. Navigational Charts, Port of Newcastle, all years
Loney, JJ, 1980 et seq. Australian Shipwrecks, 5 Vols, Reed, Sydney.
Lucas, Clive & Partners, 1987. Lake Innes House Conservation Analysis and Draft ConservationPolicy, prepared for the NPWS (NSW), unpub.
Macleay Chronicle Newspaper, various issues
Mid North Coast Maritime Museum Association, Information and photographs from Dick Glen andLaurie Hoare (oral report), Port Macquarie.
National Trust of Australia (NSW), 2000. Heritage Register, National Trust, Sydney.
National Parks and Wildlife Service, 1989. Lake Innes House Ruins, NPWS, Port Macquarie.
National Parks and Wildlife Service, 1994. Lake Innes House Port Macquarie, Brochure,University of New England, Armidale.
National Parks and Wildlife Service, 1995. Davidson Whaling Station Historic Site Plan ofManagement, unpub.
National Parks and Wildlife Service (NSW), Section 170 Register.
NSW Fisheries, Heritage and Conservation (s.170) Register.
NSW Heritage Office. Shipwreck Atlas of New South Wales, Sydney, 1996.NSW Heritage Register. www.heritage.nsw.gov.au.
Pacific Power (NSW), Section 170 Register.
Parsons, R, 1982. Ships Registered at Newcastle NSW Before 1900, Author, Adelaide.
Parsons, R, 1995. Centenary: NSW Steamship Wrecks. Reed, Sydney.
Parsons, R and G Plunkett, 1998. Scuttled and Abandoned Ships in Australian Waters. Reed,Sydney.
Port Macquarie News Newspaper, 1989. Various issues.
Rheinberger, P, 1999. ‘The boathouse at Lake Innes House: when landform and coral trees are allyou have’. Inter ALIA, Vol.2 No.2.
Smith, T, 1993. Wreck Inspection Report PS Manning, report to NSW Heritage Council, unpub.
State Rail Authority (NSW), Section 170 Register.
State Records, NSW, formerly Archives Office of NSW (AAONSW), various references.

Umwelt (Australia) Pty Limited1479/R01/V2 September 2001 40
Stokes, Capt, 1846. Navigational chart of Newcastle Harbour and entrance. (NLH: LH,B623.894/22].
Suters Architects Snell, 1991. Hastings Heritage Study 1991, report to Hastings Council, unpub.
Umwelt (Australia) Pty Limited, 2001. Newcastle Coastline Management Study [EuropeanHeritage, Rheinberger], report to Newcastle City Council, unpub.
Umwelt (Australia) Pty Limited, 2001. Pelican Point Heritage Assessment [Rheinberger], report toNSW Fisheries, unpub.
ABORIGINAL HERITAGE REFERENCES
Ainsworth, J. [n.d.] Reminiscences 1847-1922. MS, Richmond River Historical Society Archives.
Anderson, W. (1890). Notes on the shell-heaps, or kitchen-middens accumulated by the Aboriginesof the southern coastal district. Records of the Geological Survey of New South Wales, 2,52-60.
Beaglehole, J. (ed) (1955). The journals of Captain James Cook on his voyages of discovery: thevoyage of the Endeavour 1768-1771. Hakluyt Soc., Cambridge.
Brayshaw, H. (1966). Some aspects of the material culture of the Aborigines of the Hunter Valleyat the time of first white settlement. BA (Hons) thesis, University of New England.
Brierly, O.W. (1843). Journal of a visit to Twofold Bay; Maneroo and districts beyond the SnowyRiver. December 1842 to January 1843. Mitchell Library MS A535.
Bundock, M. (1898). Notes on the Richmond River Blacks. Typed copy of original MS (made byR.L. Dawson 1940), Mitchell Library, Sydney.
Burns, D. (1844). Macleay, description of river and its native inhabitants. Manuscript in MitchellLibrary, Sydney in three exercise books. Third book.
Colley, S.M. (1987). Fishing for facts: Can we reconstruct fishing methods from archaeologicalevidence? Aust. Arch., 24, 16-35.
Dean-Jones, P. (1990). Newcastle Bight Aboriginal sites study. Report to the NSW National Parks& Wildlife Service and National Estate Grants Committee.
Egloff, B.J. (1981). Wreck Bay: an Aboriginal fishing community. Australian Institute ofAboriginal Studies: Canberra.
Enright, W.J. (1935). Australia: material culture distribution of Merewether Chert. Mankind, 1:12,8.
Faulkner, A. (2000). Aboriginal fisheries in NSW. Paper presented to the 10th NSW CoastalManagement Conference, November, 2000.
Gungil Jindabah Centre. (1996). Aboriginal sites of significance. Regional report of upperNortheast NSW, Vol. 6, heritage, Aboriginal and social issues. Resource andConservation Assessment Council, Sydney.

Umwelt (Australia) Pty Limited1479/R01/V2 September 2001 41
Henderson, J. (1851). Excursions and adventures in New South Wales with pictures of squattingand of life in the bush, 2 vols. W. Shoberl, London.
Hodgkinson, C. (1845). Australia from Port Macquarie to Moreton Bay with descriptions of thenatives, their manners and customs; the geology, natural productions, fertility, andresources of that region… T & W Boone, London.
Hughes, P. & Sullivan, M.E. (1974). The redeposition of midden material by storm waves. J. Proc.Roy. Soc. NSW, 107, 6-10.
Mackaness, G. (1941). George Augustus Robinson’s journey into south-eastern Australia, 1844,with George Henry Haydon’s narrative of part of the same journey. Australian HistoricalMonographs 19. Ford, Sydney.
Marquis-Kyle, P. & Walker, M. (1992). The illustrated Burra Charter: making good decisionsabout the care of important places. Published with the assistance of the AustralianHeritage Commission. Australia ICOMOS, Sydney.
McBryde, I. (1982). Coast and estuary: Archaeological investigations on the north coast of NewSouth Wales at Wombah and Schnapper Point. Australian Institute of Aboriginal Studies,Canberra.
NSW Fisheries. (2000). Indigenous fisheries strategy, working paper.
NSW Fisheries. (2001). Draft estuary general fishery management strategy, May 2001.
NSW Standing Committee on State Development. (1997). Quoted from NSW Fisheries (2000)Indigenous fisheries strategy, working paper.
Robinson, G.A. (1844). Journals, Vol. 19. Mitchell Library, Sydney.
Rudder, E.F. (1925). Customs and habits of the Aboriginals of the Macleay. In Back to the MacleayCelebrations, Kempsey: 8-12.
Sullivan, M.E. (1982). Aboriginal shell middens in the coastal landscape of New South Wales.Thesis submitted for PhD, Australian National University.
Sullivan, S. (1978). Aboriginal diet and food gathering methods in the Richmond and Tweed Rivervalleys, as seen in the early settler records. In Records of times past: Ethnohistoricalessays on the culture and ecology of the New England tribes, (Ethnohistorical Series: 3),ed. I. McBryde. Australian Institute of Aboriginal Studies, Canberra.
Umwelt (Australia) Pty Ltd. (2000). Extension of rutile and zircon mining ‘Fullerton Project’Environmental Impact Statement, April 2000. Prepared for Mineral Deposits(Operations) Pty Ltd.

APPENDIX 1
Principal Commercial FisheryEstuaries

1479/R01/V2-Appendix1
Average production of estuaries that make up 95% of the estuary generalcatch in NSW, 1997-98 and 1998-99
Estuary Production (kg)
Clarence River 979,373
Myall Lakes / Port Stephens 520,205
Wallis Lake 443,152
Lake Macquarie 278,441
Tuggerah Lakes 270,471
Hawkesbury River 221,853
Richmond River 219,065
Tweed River 178,184
Camden Haven River 165,101
Lake Illawarra 164,666
Manning River 164,244
Hunter River 153,355
Botany Bay 122,030
Shoalhaven River 107,151
St Georges Basin 100,562
Port Jackson 86,739
Macleay River 86,605
Hastings River 78,828
Nambucca River 69,845
Turros Lake 41,419
Jervis Bay 28,973
Smiths Lake 27,031
Bellinger River 26,386
Coila Lake 20,752

APPENDIX 2
Shipwreck Sites associated withNew South Wales Estuaries

Ship / Item Date of loss Estuary Location Source Database ref. Comments
Annie 07/1903 TWEED RIVER Tweed River Heads SMH 4/7/1903; RBS AIMA North Riv 270
Arrow 03/07/1859 Tweed River Bar SMH 14/7, 4/8, 6/8/1859; RBS AIMA North Riv 46
Atalanta 28/02/1868 Tweed River bar SMH 2/3/1868; RBS AIMA North Riv 1054
Bellinger 30/07/1873 Tweed River, north head RBS; Sydney Register of Wrecks off NSW in 1873 AIMA North Riv 994
Chindera 09/12/1896 Tweed River bar RBS; SMH 29/9/1896, 12/1/1897 AIMA North Riv 264
Comet 30/03/1851 Tweed River, nth side of entrance RBS; SMH 12/4/1851; Parsons, R Pre-1850 Registers AIMA North Riv 1169
Dollar Bird 26/11/1884 Tweed River, north head RBS; SMH 27/11, 28/11/1884; Dundon, G, The Shipbuilders of Brisbane Water NSW, 1997. AIMA North Riv 226 Struck bar while under tow.
Ebenezer 01/08/1859 Tweed River bar RBS; SMH 6/8/1859; Loney, J Vol 2 AIMA North Riv 122 4 lives lost.
Emma Pyers 02/1930 Tweed River RBS AIMA North Riv 1872
Fanny 18/10/1862 Tweed River Bar 20611
Fanny Morris 20/06/1848 Tweed River bar, nth spit RBS; SMH 1/6/1848 AIMA North Riv 128
Favorite 01/02/1857 Tweed River bar 20606
Flirt 01/01/1875 Tweed River Bar 20674
Flirt 17/07/1860 Tweed River, on bank at mouth RBS; Syd 39/1853; SMH 7/3, 11/3/1857 AIMA North Riv 175
Friendship 28/11/1912 Tweed River Heads, rocks at end of south wall
RBS; SMH 30/11, 2/12, 3/12/1912 AIMA North Riv 983
Jane 07/1848 Tweed River RBS AIMA North Riv 137
Koh I Noor 05/09/1858 Tweed River bar SMH 11/8, 4/10/1859; RBS AIMA North Riv 140
Minerva 26/11/1865 Tweed River bar SMH 21/12/1865; RBS AIMA North Riv 149
Murwillumbah 01/1909 Tweed Heads RBS; Dundon, G, The Shipbuilders of Brisbane Water NSW, 1997 AIMA North Riv 282
Ocean Queen 1851 Tweed River, bar RBS 26/1845; SMH 29/8/1851, 9/9/1851; The Empire 2/9/1851 AIMA North Riv 152
Panic of 66 20/05/1870 Tweed River, rocks at the north head SMH 30/5, 3/6//1870; RBS AIMA North Riv 153
Pastime 1916 Tweed River Loney, J 'Australian Shipwrecks Vo 4 1901-1986' Marine History Publications, 1987 AIMA North Riv 291
Perseverance 14/04/1870 Tweed River, bch below north head, on rocks
SMH 3/4, 26/4, 29/4, 30/4/1870; RBS AIMA North Riv 1488
Pioneer 13/01/1877 Tweed River entrance on rocks RBS; Marine Board register of NSW wrecks 1877 AIMA North Riv 600
Rose 01/01/1847 Tweed River RBS 15/1841 & 77/1842 AIMA North Riv 160
Settlers Friend 17/08/1877 Tweed River entrance SMH 20/3/1878; Marine Board register of NSW wrecks in 1878; RBS AIMA North Riv 1060
Terranora 22/02/1933 Tweed River, north breakwater SMH 23/2/1933, 24/2/1933, 25/2/1933; RBS AIMA North Riv 2052
True Blue 9-10/1881 Tweed River bar, rocks on north head RBS AIMA North Riv 219
Tweed 19/04/1888 Tweed River Heads RBS AIMA North Riv 239
Tweed 06/1849 Tweed, on beach near River mouth, capsized
SMH 14/6/1849 AIMA North Riv 1065
Annie C Lynn 1891 BRUNSWICK RIVER Brunswick River, north head SMH 2/5/1891; RBS AIMA North Riv 252
Shipwrecks in NSW Estuaries, from the Australian National Shipwreck Database (ANSD)
1479/R01/V2-App2_V2 1

Ship / Item Date of loss Estuary Location Source Database ref. CommentsShipwrecks in NSW Estuaries, from the Australian National Shipwreck Database (ANSD)
Centurion 03/02/1875 Brunswick River, bar RBS; Marine Board Register of ships lost, from 1875; SMH 6/2, 18/3/875 AIMA North Riv 989
Clara 04/1850 Brunswick River, north head, ashore RBS; SMH 30/4/1850 AIMA North Riv 1159
Dolphin 19/02/1887 Brunswick River, bar RBS; SMH 21/2/1887 AIMA North Riv 2
Endeavour 14/02/1892 Brunswick River, bar RBS; SMH 15/2, 16/2, 1/3, 8/3/1892 AIMA North Riv 922
Lizzie Frost 28/12/1887 Brunswick River Heads, north beach SMH 29/12, 30/12/1887 SMH 24/7/1889; RBS AIMA North Riv 238
Louisa 03/1849 Brunswick River SMH 14/6/1849; RBS AIMA North Riv 143
Miranda 29/12/1874 Brunswick River, ashore on south side
SMH 31/12/1874; RBS 7/1874; Brisbane Lloyd's Register AIMA North Riv 1108
Nambuccra 13/03/1880 Brunswick River, ashore SMH 16/3/1880; Marine Board register of wrecks for 1880; RBS AIMA North Riv 973
Star of The Sea 22/02/1878 Brunswick River bar, south spit SMH 27/7/1878; Marine Board register of NSW wrecks - 1878; RBS AIMA North Riv 207
Titania 06-07/1879 Brunswick River, entrance SMH 6/7/1879, 15/3/1880; Marine Board register of NSW wrecks 1879; RBS 41/1871 and 31/1855 Sydney
AIMA North Riv 213
West Hartley No 1 11/02/1874 Brunswick River, entrance SMH 23/3/1864, 24/2/1874; Marine Board register of NSW wrecks - 1874; RBS AIMA North Riv 1659
Adventure 1855? RICHMOND RIVER Richmond River RBS AIMA North Riv 865
Alert 06/1854 Richmond River, north spit SMH 1/8/1854; RBS AIMA North Riv 39
Australasian League 05/09/1857 Richmond River, north head SMH 19/9/1857; RBS, Sydney AIMA North Riv 74
Australia 11/02/1874 Richmond River bar SMH 20/2/1874; RBS; Sydney Dept of Navigation - Register of Wrecks for 1874 AIMA North Riv 197
Britannia 1945-50 Richmond River, Ballina RBS, Sydney AIMA North Riv 1822
Callender 06/06/1871 Richmond River bar, rocks to nth of entrance
SMH 15/6/1866, 20/6/1871; RBS, Sydney AIMA North Riv 188
Champion 27/11/1860 Richmond River RBS; SMH 8/12/1860 AIMA North Riv 1140
Colleen Dhas 04/1883 Richmond River bar RBS; SMH 3/4/1883 AIMA North Riv 221
Columbine 01/02/1851 Richmond River, inside RBS; SMH 4/3/1851; Parsons, R Pre-1850 Registers AIMA North Riv 1166
Comet 28/07/1887 Richmond River, btwn channel and Nth Head
SMH 29/7/1887 AIMA North Riv 247
Comet 19/03/1890 Richmond River, south spit RBS; SMH 21/3/1890 AIMA North Riv 563
Culloden 28/04/1872 Richmond River north spit RBS; SMH 1/5, 14/5, 15/6/1872 AIMA North Riv 190 File includes map of Richmond River and location of supposed wreck of Culloden.
Dragon 06/04/1869 Richmond River Heads RBS 4/1862; Sydney SMH 13/4, 14/4, 16/4, 17/4 19/4/1869 AIMA North Riv 120
Ellesmere 26/02/1873 Richmond River Heads, ashore RBS; SMH 3/3, 3/4/1873; Marine Board Register of ships lost 1873 AIMA North Riv 195
Enterprise 04/07/1847 Richmond River bar RBS; SMH 27/7, 30/7/1847 AIMA North Riv 124 Grounded on bar, 2 deaths.
Falcon 18/12/1866 Richmond River bar RBS AIMA North Riv 127
Favourite 03/1857 RICHMOND RIVER Richmond River bar RBS; SMH 13/3/1857, 3/5/1857 AIMA North Riv 129
1479/R01/V2-App2_V2 2

Ship / Item Date of loss Estuary Location Source Database ref. CommentsShipwrecks in NSW Estuaries, from the Australian National Shipwreck Database (ANSD)
Fox 07/01/1871 Richmond River bar RBS; SMH 16/1/1871 AIMA North Riv 975
Francis Hixson 12/01/1883 Richmond River bar, 100yds inside beacons line
RBS; SMH 1/9, 15/9/1894 AIMA North Riv 223
Golden Fleece 04/1847 Richmond River bar, south spit RBS; SMH 14/4, 15/4, 11/5/1847 AIMA North Riv 131
Goldseeker 02/1861 Richmond River bar SMH 22/2/1861; Maitland Mercury 26/2/1861 p4a; RBS AIMA North Riv 132
Goodiron 1895 Richmond River entrance RBS AIMA North Riv 262
Grace Lynn 03/06/1892 Richmond River bar RBS; SMH 14/6/1892 AIMA North Riv 256
Harp 1863 Richmond River bar RBS; Syd 23/1853; 149/1853 AIMA North Riv 141
Harriett 1851 Richmond River bar SMH 19/5, 26/5/1851 RBS AIMA North Riv 133
Henry 06/03/1861 Richmond River bar, north spit RBS 160/1854 Syd AIMA North Riv 134
Hilander 07/10/1872 Richmond River Heads, north spit RBS AIMA North Riv 980
Hope 06/1845 Richmond River bar, south spit Sydney Gazette & General Trade List 28/6/1845 p 163; RBS AIMA North Riv 1732
J and T Fenwick 01/04/1883 Richmond River entrance SMH 3/4, 8/5/1883; RBS AIMA North Riv 224
Jane 1862 Richmond River RBS AIMA North Riv 138
John Bullock 02/09/1871 Richmond River, north head on rocks SMH 5/9, 6/9/1871; RBS 18/1871 Sydney AIMA North Riv 1035
Josephine 25/11/1865 Richmond River Heads, on Middle Spit
SMH 5/12, 7/12, 21/12/1865; RBS 69/1854 Sydney AIMA North Riv 139
Lady Musgrave 27/03/1904 Richmond River bar NMH & Miners' Advocate 29/31904; SMH 115/2/1905; RBS AIMA North Riv 272
Lismore 10/05/1885 Richmond River entrance SMH 12/5, 13/5, 27/7/1885; RBS AIMA North Riv 229
Lizzie Blair 01/05/1869 Richmond River bar, south spit SMH 8/5, 13/5/1869; RBS AIMA North Riv 142
Madge Wildfire 28/03/1851 Richmond River, near bar SMH 7/5/1851; RBS AIMA North Riv 145 5 deaths.
Margaret and Mary 06/10/1871 Richmond River bar SMH 10/10/1871; RBS AIMA North Riv 1029
Mary Ann 13/08/1851 Richmond River, sand spit at entrance SMH 3/9/1851; The Empire 2/9/1851; RBS AIMA North Riv 146
Mary Jane 1852 Richmond River bar SMH 15/4, 23/4/1852; RBS AIMA North Riv 883
Matilda 05/1849 Richmond River, north bar SMH 15/5/1849; RBS 73/1849 AIMA North Riv 1112
Matilda Ann 06/1849 Richmond River, north head SMH 14/6/1849 RBS AIMA North Riv 148
Nautilus 03/03/1844 Richmond River bar, south spit RBS; Dunn, Gwen 'Shipbuilders of Brisbane Water, NSW' 1997 AIMA North Riv 35
Northumberland 07/01/1845 Richmond River bar, on south spit SMH 6/2, 1/5/1845; RBS AIMA North Riv 151
Ocean Bride 20/05/1881 Richmond River, Ballina, north side of channel
SMH 21/5, 24/5, 1/6, 23/8/1881; RBS AIMA North Riv 1746
Oscar S 30/09/1930 Richmond River, Ballina SMH 1/10/30 AIMA North Riv 1990
Petrel 08/03/1866 Richmond River bar SMH 21/03/1866; RBS AIMA North Riv 156
Pianet 24/12/1854 Richmond River RBS AIMA North Riv 1492
Platypus 1883/84 Richmond River, south arm SMH 13/1/1883; RBS AIMA North Riv 227
Protector 01/07/1901 Richmond River bar NMH & Miners' Advocate 2/7/1901; RBS AIMA North Riv 269
1479/R01/V2-App2_V2 3

Ship / Item Date of loss Estuary Location Source Database ref. CommentsShipwrecks in NSW Estuaries, from the Australian National Shipwreck Database (ANSD)
Ranger 07/11/1865 Richmond River Heads SMH 25/11, 7/12/1865; RBS AIMA North Riv 158
Rescue 09/04/1908 Richmond River entrance, inner south spit
NMH & Miners' Advocate 29/7/1908; RBS AIMA North Riv 280
River Chief 25/11/1865 Richmond River Heads The Perth Gazette 25/4/1845; 14/3, 31/10, 19/12/1846; 16/1, 27/2, 14/3/1847; Western Australian Journal 5/7/1845; RBS
AIMA North Riv 159
Samuel Merritt 13/01/1877 Richmond River, ashore at north spit SMH 16/1/1877; RBS; Marine Board register of NSW wrecks - 1877 AIMA North Riv 1063
Sarah 22/05/1848 Richmond River, on rocks at north head
SMH 1/6/1848; RBS AIMA North Riv 161
Sarah Ann 08/10/1871 Richmond River bar, north spit SMH 10/10, 12/10, 23/10/1871; RBS 49/1869 Sydney AIMA North Riv 1062
Sarah Fenwick 27/03/1900 Richmond River Heads, nth end of breakwater
NMH & Miner's Advocate 17/6/1900; RBS Sydney 37/1892; 3/1895 AIMA North Riv 267
Sarsfield 10/02/1887 Richmond River bar, south spit SMH 15/2, 23/2/1887; NMH & Miners' Advocate 15/2/1887; RBS AIMA North Riv 237
Scotia 01/10/1869 Richmond River bar, on south beach SMH 11/10/1869 RBS AIMA North Riv 162
Sisters 05/05/1880 Richmond River bar, north spit SMH 6/5, 12/5, 7/5/1880; Marine Board register of NSW wrecks 1880; RBS AIMA North Riv 1759
Sophia Ann 09/04/1908 Richmond River entrance, southern sand spit
NMH & Miners' Advocate 17/4/1908 AIMA North Riv 281
Spitfire 21/01/1857 Richmond River bar SMH 17/3/1857; RBS AIMA North Riv 163
Susannah Booth 23/04/1876 Richmond River bar SMH 10/5/1876; RBS (Syd) 10/1863 and 5/1876 AIMA North Riv 200
Sylvanus 13/04/1871 Richmond River, on rocks at the north head
SMH 22/4, 1/5/1871; RBS AIMA North Riv 1021
Tayfield 01/12/1859 Richmond River bar SMH 1 or 12 December 1859 PRO, Kew, RBS, BT107/432 Dundee 1837/29. Re-reg 20/12/1850 Dundee No.66. Hofc Acc. & Papers 1845 XLVII.287 Return of steam vessels reg. at 31/12/1844. H of C 1851 LII.197 Ret of sv reg. as at 1/1/1851. H of C 1839 XLVII.1 RBS 3/1859 Newcastle
AIMA North Riv 1067
Tidal Wave 01/06/1879 Richmond River bar SMH 15/3, 8/7/1879 Marine Board register of NSW wrecks - 1879 RBS AIMA North Riv 212
Tomki 13/09/1907 Richmond River, near north wall NMH & Miners' Advocate 14/9/1907; RBS 52/1891 Syd AIMA North Riv 278
Union 28/04/1892 Richmond River bar SMH 29/4/1892; RBS AIMA North Riv 257
Vesta 26/03/1873 Richmond River Heads, south spit SMH 231/3, 3/5/1873; Marine Board register of NSW wrecks 1873; RBS AIMA North Riv 196
Waimea 10/01/1872 Richmond River Heads, north side SMH 13/1, 16/1, 22/1, 2/4/11972; RBS AIMA North Riv 192
Wallaby 14/05/1874 Richmond River, north spit SMH 6/6, 2/7/1874; RBS; Marine Board Register of Wrecks for 1874 AIMA North Riv 1015
Walrus 07/01/1871 Richmond River bar SMH 16/1/1871; RBS AIMA North Riv 1091
William and James 15/07/1856 Richmond River RBS AIMA North Riv 958
William Langford 15/11/1894 Richmond River bar SMH 17/9, 26/9/1894; RBS AIMA North Riv 261
Winnie 1887 Richmond River bar RBS AIMA North Riv 1764
Alexander Macleay 01/1841 CLARENCE RIVER Clarence River bar RBS AIMA North Riv 42
Banzai 02/05/1909 Clarence River, Tucabia, near Ulmarra
RBS; SMH 5/5/1909 AIMA North Riv 328 Burnt at moorings at Upper Coldstream
1479/R01/V2-App2_V2 4

Ship / Item Date of loss Estuary Location Source Database ref. CommentsShipwrecks in NSW Estuaries, from the Australian National Shipwreck Database (ANSD)
Cakobau 1914c Clarence River, opposite Harwood Mill
RBS; Parsons, R & Plunkett, G, 'Scuttled and Abandoned Ships in Australian Waters', 1998. AIMA North Riv 326
City of Sydney 09/11/1868 Clarence River Heads on nth shore RBS; SMH 10/11, 11/11, 19/11, 19/11, 27/11/1868; Parsons, R Pre-1850 Registers AIMA North Riv 1157
Clarence 08/1877 Clarence River, ashore in river RBS; Clarence & Richmond Examiner 4/9, 11/91877 AIMA North Riv 250
Coldstream 11/12/1937 Clarence River, Ulmarra Listed in RANZS list of lost, missing or taken from active service, 1949 edition. No newspaper reference but Register annotation provides details of loss.
AIMA North Riv 1842
Coquette 31/12/1873 Clarence River Heads, west spit Clarence & Richmond Examiner Tues 7 Jan 1873; SMH Mon 6 Jan 1873; RBS 72/1869 AIMA North Riv 194
Cornstalk 1921 Clarence River RBS Syd 50/1877 12/1889 56/1891; Parsons, R & Plunkett, G 'Scuttled and Abandoned Ships in Australian Waters', 1998.
AIMA North Riv 380 A river 'drogher'. After being left lying across the Pacific Highway in the 1921 flood, the vessel was cut up and dumped in the Clarence River.
Daring 14/02/1861 Clarence River bar, South Head SMH 22 /2/1861, 4 /3/1861; Clarence and Richmond Examiner 2/4/1861; Maitland Mercury 26/Feb 1861, p4a; Daily Examiner 22/08/1936 (report on CD Rowley lectures); RBS 38/1860
AIMA North Riv 121
F W Tucker 07/1878 Clarence River bar, north beach Clarence & Richmond Examiner 9/7/1878; SMH 9/7/878; RBS 17/1875; Register of Marine Board Register of Ships lost, 1878.
AIMA North Riv 205
Favourite 10/06/1896 Clarence River bar, north spit SMH 11/6/1896, 12/1/1897; Clarence & Richmond Examiner 13/6/1896. AIMA North Riv 263
Grafton Punt 11/12/1943 Clarence River, Grafton NMH 13/12/43 P. 3 AIMA North Riv 1892
Helen Macgregor 1875 Clarence River, on reef at South Head Argus 15 March 1875; SMH 18 March 1876; Marine Board Register of Wrecks for 1875; RBS 71/1867.
AIMA North Riv 198
Induna 1932 Clarence River, south bank, 200m upstream from Grafton bridge
Daily Examiner 8 Oct 1975, 31 Aug 1990; Daily Telegraph Mirror 18 Oct 1994, p35; 'The Main Line Fleet of Burns Philip' by Wilkinson and Willson; Grafton Heritage Inventory Listing Sheet (No. 6.31).
AIMA North Riv 2122 Memorial plaque includes: " Operated by Burns Philip & Co Ltd 1904 to 1920 in the Pacific Islands serving Lord Howe Is, Norfolf Is, New Hebrides, Gilbert Is, Marshall Is, Caroline Is. Later used as a train ferry then a wharf in the Clarence River. The vessel's history includes the escape of Sir Winston Churchill from the Boers during the Boer War and its capture in the Marshall Islands by the Germans during WWI."
1479/R01/V2-App2_V2 5

Ship / Item Date of loss Estuary Location Source Database ref. CommentsShipwrecks in NSW Estuaries, from the Australian National Shipwreck Database (ANSD)
Josephine 24 or 21/03/1879
Clarence River, Yamba, Hickey Island
SMH 15/3, 2/4/1879; RBS; Marine Board listing of shipwrecks for 1879; Richards, Mike, 'Shipwreck Heritage of the Clarence River', 1996; Australasian Shipping News 29.3.1879.
AIMA North Riv/Mid N 211
Kalipso 07/05/1939 Clarence River, Cowper RANZ 1937; RBS AIMA North Riv 1923
Lennie 01/1893 Clarence River, entrance C & R 21/11, 25/11/1893 AIMA North Riv 80 Note: The 'Lennie' has been spelt 'Leonie' elsewhere.
Lillie 01/1887 Clarence River, near 'Factory Sawmill'
Clarence & Richmond River Examiner 29 Jan 1887; RBS 62/1878 AIMA North Riv 235 Struck by a tree while moored alongside the riverbank.
Mary Ann 13/01/1874 Clarence Heads, north spit SMH ?/1, 6/1/1874; Clarence & Richmond Examiner 6/1/1874; Marine Board register of NSW wrecks - 1874; RBS Syd 5/1863.
AIMA North Riv 1025
Mary Ann Christina 06/06/1876 Clarence Heads, north beach Clarence & Richmond Examiner 3/6, 13/6/1874; SMH 29/5, 15/6/1876; Marine Board register of NSW wrecks - 1876; RBS Syd 9/1872, 29/1875; Index to NZ section RBS 1840-1950 - M Watt.
AIMA North Riv 965 Previously beached at Manning River, in 1874. Registered originally in NZ as 'Marie Ann Christie'. In Sydney, registered as 'Mary Ann Christina' also used in all contemporary newspapers.
Mary Bannatyne 13/01/1886 Clarence Heads, on spit inside the bar SMH 16/1/1886; Clarence & Richmond Examiner 16/1/1886; RBS. AIMA North Riv 232
New England 12/1882 Clarence River bar, north spit SMH 28/12, 29/12, 30/12/1882, 2/2/1883,10/6/1886; NMH & Miners' Advocate 5/1, 8/1, 16/1/1883.
AIMA North Riv 220
Nina Meg 1920c Clarence River, below Harwood Mill SMH 24/2/1917; Richards, Mike, 'Shipwreck heritage of the Clarence River', 1996. AIMA North Riv 292 Ran aground at Turners Beach 22/2/1917, salvaged, tied up below Harwood Mill on Clarence River for some years and eventually sank.
Perseverance 18/04/1864 Clarence River Heads, ashore on sand bank
SMH 20/5, 25/4, 2/5/1864; Clarence & Richmond River Examiner 19/4, 26/4/1864; RBS 1/1861 Newcastle.
AIMA North Riv 154
1479/R01/V2-App2_V2 6

Ship / Item Date of loss Estuary Location Source Database ref. CommentsShipwrecks in NSW Estuaries, from the Australian National Shipwreck Database (ANSD)
Phoenix 14/04/1852 Clarence River entrance, north side SMH 22/8/1845, 26/4, 3/5, 4/5, 5/5, 15/6/1852; Daily Examiner 10/3/1947; RBS; 'The Bawden Lectures', from the records of the Clarence River Historical Society.
AIMA North Riv 157 Police constables were sent to protect cargo and personal property that washed ashore but newspapers record that by the time they arrived, Europeans and Aborigines had taken advantage of the windfall and removed much of the material.
Ramornie 1968c Clarence River, near Mountain View RBS; Parsons, R & Plunkett, G, 'Scuttled and Abandoned Ships in Australian Waters' 1998; Clarence River Historical Society records (date of scuttling).
AIMA North Riv 310 Converted into a pontoon landing at Grafton in 1950s for use by flying boat service.
Susan 08/1850 Clarence River, inside the bar SMH 28/8/1850; RBS AIMA North Riv 1069
Urara 02/05/1866 Clarence River Heads Clarence & Richmond Examiner 2/5/1866; SMH 4/5, 8/5/1866; RBS. AIMA North Riv 166
Euroka 03/1875 SANDON RIVER Solitary Islands, Sandon River, inside mouth
RBS; SMH Marine Board Register of Ships lost 1875 AIMA North Riv 985
Lucynder 29/12/1867 Solitary Islands, Sandon River, inside SMH 11/1/1868 AIMA North Riv 1031
Doris 03/11/1919 BELLINGER RIVER Bellinger River, north spit RBS; RANZ 1917-1918; SMH 5/11, 6/11/19 AIMA Holiday 1862
Ellerslie 22/05/1913 Bellinger River, across end of south wall
RBS; SMH 24/5, 26/5/1913 AIMA Holiday 330
Elliston 02/1904 Bellinger Heads, south spit RBS; SMH 15/2, 20/2, 22/2/1904 AIMA Holiday 320
Emily T 1884 Bellinger River, inside point of the nth beach
RBS; SMH 24/4, 1/5, 2/5/1884 AIMA Holiday 174
Emu 24/04/1884 Bellinger River, nth spit Parsons (personal files);RBS 17/1853 Syd; SMH 24/4, 26/4, 1/5, 2/5/1884 AIMA Holiday 297
Harrington 20/03/1896 Bellinger River entrance RBS; SMH 23/3, 24/3, 5/5/1896, 12/1/1897 AIMA Holiday 312
Hope 25/11/1865 Bellinger River bar, north spit RBS; SMH 5/12/1865 AIMA Holiday 979
Kate 13/06/1880 Bellinger River, north beach Marine Board Register of Wrecks for 1880; RBS; SMH 15/6/1880 AIMA Holiday 411
Lucy Ann 12/1857 Bellinger River, ashore Dunn, 1997; RBS Syd 15/1851, 172/1853; SMH 16/12/1857 AIMA Holiday 1032
Mary 25/02/1866 Bellinger River RBS, Syd 20/1859 AIMA Holiday 518
Matilda 24/06/1844 Bellinger River, north spit RBS 52/1843; SMH 18/07/1844 AIMA Holiday 930
Petrel 20/03/1896 Bellinger River entrance RBS 12/1/1897; SMH 23/3, 24/3/1896 AIMA Holiday 314
Princess Alexandra 10/04/1874 Bellinger River bar Marine Board Register of Wrecks 1874; RBS 49/1867 Syd; SMH 18/4, 16/4, 30/4/1874 AIMA Mid Nth 1079
Prosper Coulon 14/05/1884 Bellinger River Bar Marine Board Register of NSW Wrecks, 1879; RBS; SMH 15/3/1880; 17/6, 5/7/1884 AIMA Holiday 299 Struck bar under tow
Repton 26/01/1933 Bellingen Heads, breakwater RANZ 1932-33; RBS; SMH 28/1/1933 AIMA Holiday 2012
1479/R01/V2-App2_V2 7
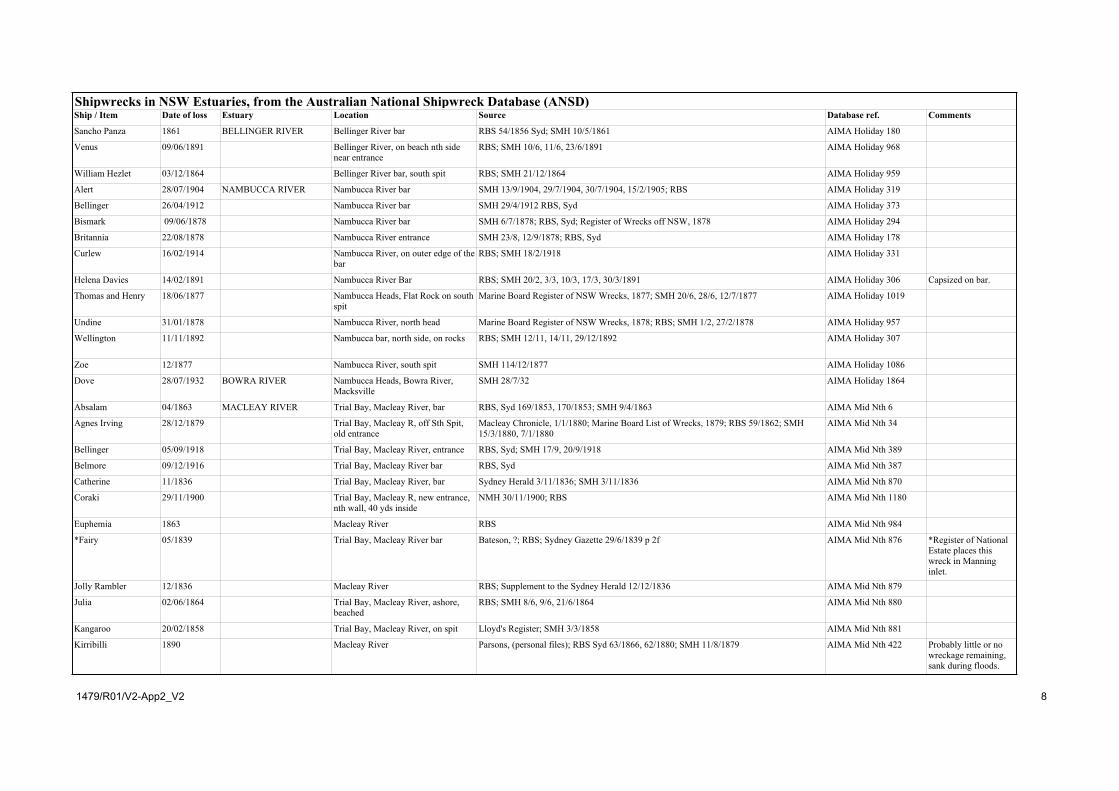
Ship / Item Date of loss Estuary Location Source Database ref. CommentsShipwrecks in NSW Estuaries, from the Australian National Shipwreck Database (ANSD)
Sancho Panza 1861 BELLINGER RIVER Bellinger River bar RBS 54/1856 Syd; SMH 10/5/1861 AIMA Holiday 180
Venus 09/06/1891 Bellinger River, on beach nth side near entrance
RBS; SMH 10/6, 11/6, 23/6/1891 AIMA Holiday 968
William Hezlet 03/12/1864 Bellinger River bar, south spit RBS; SMH 21/12/1864 AIMA Holiday 959
Alert 28/07/1904 NAMBUCCA RIVER Nambucca River bar SMH 13/9/1904, 29/7/1904, 30/7/1904, 15/2/1905; RBS AIMA Holiday 319
Bellinger 26/04/1912 Nambucca River bar SMH 29/4/1912 RBS, Syd AIMA Holiday 373
Bismark 09/06/1878 Nambucca River bar SMH 6/7/1878; RBS, Syd; Register of Wrecks off NSW, 1878 AIMA Holiday 294
Britannia 22/08/1878 Nambucca River entrance SMH 23/8, 12/9/1878; RBS, Syd AIMA Holiday 178
Curlew 16/02/1914 Nambucca River, on outer edge of the bar
RBS; SMH 18/2/1918 AIMA Holiday 331
Helena Davies 14/02/1891 Nambucca River Bar RBS; SMH 20/2, 3/3, 10/3, 17/3, 30/3/1891 AIMA Holiday 306 Capsized on bar.
Thomas and Henry 18/06/1877 Nambucca Heads, Flat Rock on south spit
Marine Board Register of NSW Wrecks, 1877; SMH 20/6, 28/6, 12/7/1877 AIMA Holiday 1019
Undine 31/01/1878 Nambucca River, north head Marine Board Register of NSW Wrecks, 1878; RBS; SMH 1/2, 27/2/1878 AIMA Holiday 957
Wellington 11/11/1892 Nambucca bar, north side, on rocks RBS; SMH 12/11, 14/11, 29/12/1892 AIMA Holiday 307
Zoe 12/1877 Nambucca River, south spit SMH 114/12/1877 AIMA Holiday 1086
Dove 28/07/1932 BOWRA RIVER Nambucca Heads, Bowra River, Macksville
SMH 28/7/32 AIMA Holiday 1864
Absalam 04/1863 MACLEAY RIVER Trial Bay, Macleay River, bar RBS, Syd 169/1853, 170/1853; SMH 9/4/1863 AIMA Mid Nth 6
Agnes Irving 28/12/1879 Trial Bay, Macleay R, off Sth Spit, old entrance
Macleay Chronicle, 1/1/1880; Marine Board List of Wrecks, 1879; RBS 59/1862; SMH 15/3/1880, 7/1/1880
AIMA Mid Nth 34
Bellinger 05/09/1918 Trial Bay, Macleay River, entrance RBS, Syd; SMH 17/9, 20/9/1918 AIMA Mid Nth 389
Belmore 09/12/1916 Trial Bay, Macleay River bar RBS, Syd AIMA Mid Nth 387
Catherine 11/1836 Trial Bay, Macleay River, bar Sydney Herald 3/11/1836; SMH 3/11/1836 AIMA Mid Nth 870
Coraki 29/11/1900 Trial Bay, Macleay R, new entrance, nth wall, 40 yds inside
NMH 30/11/1900; RBS AIMA Mid Nth 1180
Euphemia 1863 Macleay River RBS AIMA Mid Nth 984
*Fairy 05/1839 Trial Bay, Macleay River bar Bateson, ?; RBS; Sydney Gazette 29/6/1839 p 2f AIMA Mid Nth 876 *Register of National Estate places this wreck in Manning inlet.
Jolly Rambler 12/1836 Macleay River RBS; Supplement to the Sydney Herald 12/12/1836 AIMA Mid Nth 879
Julia 02/06/1864 Trial Bay, Macleay River, ashore, beached
RBS; SMH 8/6, 9/6, 21/6/1864 AIMA Mid Nth 880
Kangaroo 20/02/1858 Trial Bay, Macleay River, on spit Lloyd's Register; SMH 3/3/1858 AIMA Mid Nth 881
Kirribilli 1890 Macleay River Parsons, (personal files); RBS Syd 63/1866, 62/1880; SMH 11/8/1879 AIMA Mid Nth 422 Probably little or no wreckage remaining, sank during floods.
1479/R01/V2-App2_V2 8

Ship / Item Date of loss Estuary Location Source Database ref. CommentsShipwrecks in NSW Estuaries, from the Australian National Shipwreck Database (ANSD)
Margaret Jane 31/01/1895 Trial Bay, Macleay River, entrance, ashore
RBS; SMH 1/2, 31/1, 2/2, 12/2, 19/2/1895 AIMA Mid Nth 360
Milton Badger 23/05/1877 Trial Bay, Macleay River, entrance, north spit
Marine Board Register of NSW Wrecks, 1877; RBS; SMH 26/5/1877 AIMA Mid Nth 1744
Rocket 28/05/1882 Trial Bay, Macleay River, entrance, inside bar
RBS 57/1878 Syd; SMH 29/5/1882 AIMA Mid Nth 349
Twins 1865 Macleay River Loney, 1980? AIMA Mid Nth 893
Undaunted 22/06/1873 Trial Bay, Macleay River bar RBS AIMA Mid Nth 971
Advance 17/06/1933 MANNING RIVER Manning River, Taree SMH 19/6/33 p10h, (?) AIMA Mid Nth 1792
Amy 13/10/1879 Manning River bar Parsons, ?; RBS; SMH 15/10/1879, 15/3/1880 AIMA Mid Nth 421
Atalanta 1882 Manning River, north beach RBS AIMA Mid Nth 428
Black Swan 04/06/1868 Manning River bar Parsons (pers com); Richards, 1997; RBS Syd; SMH 9/6, 11/6, 18/6, 25/6/1868 AIMA Mid Nth 95
Bortonius 1885 Manning inlet / entrance RNE entry
Brunswick 18/12/1886 Manning River bar NMH 21/12/1886; RBS Syd AIMA Mid Nth 437
Bunyip 18/11/1889 Manning River, inside Old Bar RBS Syd; SMH 21/11/1889 AIMA Mid Nth 449
Burrawong 27/03/1909 Manning River breakwater (near northern training wall)
Brit Reg Syd 9/1890; RBS Syd; SMH 8/5, 28/5/1907 AIMA Mid Nth 118
Challenger 08/1845 Manning River RBS; Bateson Australian Shipwrecks 1845 AIMA Mid Nth 1139
Chance 12/06/1874 Manning River Marine Board Register of Ships Lost, 1874; RBS; SMH 18/6/1874 AIMA Mid Nth 397
Cooloon 28/02/1917 Manning River, Coopernook SMH says Cooloon sunk at Richmond River AIMA Mid Nth 1179
Coomba 1876 Manning inlet / entrance RNE entry
Diamantina 1881 Manning inlet / entrance RNE entry
Emma 1853 Manning River RBS; SMH 2/2/1852 AIMA Mid Nth 1243
*Fairy 1839 Manning inlet / entrance *RNE entry - but SW DB record in Macleay River
Fanny 03/1835 Manning River bar Plantation Registry; State Records NSW; Sydney Herald 26/3/1835 AIMA Mid Nth 927
Fire King 30/04/1873 Manning River bar, drifted onto north beach
Marine Board Register of Ships Lost, 1873; RBS; SMH 3/5, 7/5/1873 AIMA Mid Nth 982
Florrie Ellison 04/05/1902 Manning River Heads, Harrington Inlet
RBS; SMH AIMA Mid Nth 477
Fly 10/10/1845 Manning River bar RBS; SMH 27/10, 28/10/1845 AIMA Mid Nth 1266
Gipsy 24/04/1856 Manning River bar, nth spit RBS; SMH 30/4, 5/5/1856 AIMA Mid Nth 1294
Go Ahead 19/03/1875 Manning River bar Marine Board Register of Ships Lost, 1875; SMH 18/03, 23/03/1875 AIMA Mid Nth 16
Gorilla 30/09/1872 Manning River bar, north beach RBS; SMH 4/10, 12/10/1872 AIMA Mid Nth 1040
Jane 1835 Manning River bar Sydney Herald 22/1/1835 AIMA Mid Nth 1734
Kincumber 22/10/1908 Manning River Heads NMH & Miners' Advocate 16/7, 23/10/24/10/1908; RBS AIMA Mid Nth 493
Manning 1942 Manning River, Taree, on riverbank, north side
RANZ 1937; RBS AIMA Mid Nth 1951
1479/R01/V2-App2_V2 9

Ship / Item Date of loss Estuary Location Source Database ref. CommentsShipwrecks in NSW Estuaries, from the Australian National Shipwreck Database (ANSD)
Mary Ann 26/07/1849 Manning River, north spit RBS 39/1843 Syd; SMH 11/8/1849 AIMA Mid Nth 1026
May Queen 1868 Manning inlet / entrance RNE entry
Minimbah 13/04/1910 MANNING RIVER Manning River, Coopernook (National Estate database: near northern training wall)
RBS; SMH 14/4, 19/4, 14/7/1910 AIMA Mid Nth 1440
Oceana 07/10/1903 Manning River bar RBS; SMH 21/9/1903 AIMA Mid Nth 481
*Peacock 1876 Manning inlet / entrance *RNE entry - but SW DB record in Camden Haven
Pomona 19/10/1878 Manning River bar, north spit Marine Board Register of NSW Wrecks, 1878; RBS 5/1863; SMH 16/8/1878, 13/11/1878 AIMA Mid Nth 420
Providence 04/1836 Manning River, south spit Sydney Herald 25/4/1836 AIMA Mid Nth 2104
Sea Nymph 1885 Manning inlet / entrance RNE entry
Tam O'Shanter 22/02/1846 Manning River entrance RBS; SMH 3/3/1846 AIMA Mid Nth 1597
Trusty 06/05/1885 Manning River RBS; SMH 9/5/1885 AIMA Mid Nth 435
Ulmarra 10/10/1872 Manning River Heads, north beach RBS; SMH 14/10/1872 AIMA Mid Nth 394
Urana 31/08/1937 Manning River Lloyd's Register 1932-33; RANZ 1937; RBS; SMH 1/9, 2/9/1937, 6/1/1938 AIMA Mid Nth 2067
Ballina 13/02/1879 HASTINGS RIVER Port Macquarie, entrance Dept of Navigation Register of Wrecks for 1879; Illustrated Sydney News 21/7/1877; Port Macquarie News 2/6/1995; RBS Syd; SMH 19/6/1877, 5/3/1879, 15/3/1880, 15/7/1890
AIMA Mid Nth 77
Barrangarry 04/04/1891 Port Macquarie, north spit RBS; SMH 6/4, 7/4, 14/4, 21/4/1891 AIMA Mid Nth 358
Dart 13/03/1832 Port Macquarie bar SMH 18/9/1832 mentions the cutter 'Dart' being bought (by Hughes & Hosking) to be used as a trader between Newcastle & Sydney. Not possible to say if this is the same 'Dart'.
AIMA Mid Nth 872
Hastings 29/07/1937 Port Macquarie bar Maritime Services Board 1938 list of wrecks for the year 1937. AIMA Mid Nth 1899
Jessie Sinclair 31/07/1898 Port Macquarie bar NMH & Miners' Advocate 2/8/1898; RBS; SMH 6/7, 8/7/1891 AIMA Mid Nth 362
Josephine 02/06/1885 Port Macquarie bar, near gaol SMH 4/6/1885; RBS AIMA Mid Nth 354
Narani 31/08/1933 Port Macquarie Breakwater NMH 4/9/1933 AIMA Mid Nth 1980
Port Macquarie Packet 07/1835 Port Macquarie, ashore Sydney Herald 9/4, 9/7/1835 AIMA Mid Nth 1750
Possum 1911 Hastings River RBS AIMA Mid Nth 382
Richmond 21/01/1884 Port Macquarie, inside the bar SMH 22/1, 23/1, 12/2/1884; RBS 60/1878 Sydney AIMA Mid Nth 352
Sally 13/04/1825 Port Macquarie, entrance Sydney Gazette 5/5/1825; Col Sec letters received 1825 NSW Archives reel 2188 (4/1816); Letter from H Gillman & 2 letters from Port Macquarie Pilot/Harbour Master Richard Neave; Plantation Register abstract
AIMA Mid Nth 1545
Somaki 12/12/1946 Port Macquarie RBS; RANZ 1946 AIMA Mid Nth 2031
Trilby 16/10/1907 Port Macquarie bar, north side NMH 5/11/1907; RBS AIMA Mid Nth 379
Vixen 22/08/1866 Port Macquarie bar, rocks near Pilot Station
SMH 8/8, 23/8/1866; RBS 16/1863 Sydney AIMA Mid Nth 894
Wanderer 1906 Port Macquarie bar Loney, J, 'Australian Shipwrecks', Vol4 1901-1986', Marine History Publications, 1987 AIMA Mid Nth 375
1479/R01/V2-App2_V2 10

Ship / Item Date of loss Estuary Location Source Database ref. CommentsShipwrecks in NSW Estuaries, from the Australian National Shipwreck Database (ANSD)
Wanderer 15/11/1851 Port Macquarie, Gaol Point SMH 16/11, 25/11/1851 AIMA Mid Nth 1649
Alice 05/07/1877 CAMDEN HAVEN RIVER Camden Haven bar, north spit SMH 1/8/1877; RBS AIMA Mid Nth 340
Idant 13/03/1940 Camden Haven River, northern breakwater
SMH 14/3/1940; RBS AIMA Mid Nth 1910
Shamrock 19/02/1911 Camden Haven British Register (Syd) 22/1904 AIMA Mid Nth 451
*Peacock 22/01/1876 Camden Haven entrance SMH 9/2/1876; Marine Board register of NSW wrecks - 1876 RBS AIMA Mid Nth 338 *RNE places this wreck in Manning Inlet
Princess Marie 11/05/1876 Camden Haven, north spit SMH 4/5/1876; RBS Marine Board register of NSW wrecks - 1876 AIMA Mid Nth 339
Tottie 23/11/1896 Camden Haven Bar SMH 24/11, 8/12/1896, 12/1/1897; RBS Syd 44/1890 AIMA Mid Nth 951
Unique 29/11/1901 Camden Haven bar, aground NMH & Miners' Advocate 21/12/1901; RBS AIMA Mid Nth 365 Probably refloated.
Waldenses 10/10/1878 Camden Haven, entrance SMH 14/10, 7/11/1878; RBS AIMA Mid Nth 1092
Bell Bird 31/05/1897 FORSTER Cape Hawke, bar NMH 2/6/1897; RBS, Sydney AIMA Mid Nth 462
Oberon 25/07/1876 Hawke River, ashore SMH 16/8/1876; RBS AIMA Mid Nth 258
Empress of India 23/07/1900 Cape Hawke, Forster on outer bar RBS; NMH 25/7, 21/8/1900, 17/8/1901 AIMA Mid Nth 473
Forster Punt 05/01/1938 Forster SMH 6/1/1938; NMH 6/1/1938 AIMA Mid Nth 1882
Thistle 12/02/1907 PORT STEPHENS Forster bar SMH 14/2/1907 AIMA Mid Nth 492
Ann 1876 Port Stephens, entrance SMH 27/7/1876 AIMA Hunter 405
Brighton 1916 Port Stephens, Duck Hole RBS; Sydney Parsons, R & Plunkett, G, 'Scuttled and Abandoned Ships in Australian Waters' 1998
AIMA Hunter 106
Corra Lynn 17/11/1914 Port Stephens, entrance, on beach NMH 10/12/1914; RBS 46/1902 Sydney Lloyds Register AIMA Hunter 505 Report of a salvage.
Cyclone 10/04/1867 Port Stephens, north head SMH 15/4, 22/4, 23/4/1867 AIMA Mid Nth 1191
Cynthia 15/09/1900 Port Stephens, north head RBS; NMH 17/9/1900 AIMA Mid Nth 472
Dart 19/03/1876 Port Stephens, north head RBS; SMH 21/3, 30/3/1876; Marine Board Register of ships lost, 1879 AIMA Mid Nth 408
Dolly Wamsley 16/05/1894 Port Stephens, Stoney Point RBS; NMH 24/5/1894 AIMA Hunter 556
Dove 05/06/1828 Port Stephens, north head Sydney Gazette 13/6/1828 AIMA Mid Nth 1207
Dove 12/10/1857 Port Stephens, Long Island, ashore RBS; SMH 2/11/1857 AIMA Hunter 1208
Duroby after 1923 Port Stephens, Duckhole RBS Parsons, R & Plunkett, G 'Scuttled and Abandoned Ships in Australian Waters', 1998. AIMA Mid Nth 438
Echo 21/09/1894 Port Stephens, north head RBS; SMH 26/9, 27/9/1894 AIMA Mid Nth 915
Eldriss 26/02/1932 Port Stephens, Narrow Gut SMH 29/2/32 AIMA Hunter 1870
Emperor 30/03/1886 Port Stephens, north head, ashore RBS; SMH 1/4/1886 AIMA Mid Nth 440
Endeavour 25/07/1852 Port Stephens, ashore Sydney Mail 11/8/1852 AIMA Hunter 1249 Set on fire by Aborigines. Aboriginal contact site.
Ethel 11/10/1884 Port Stephens, north head RBS; SMH 13/10/1884 AIMA Mid Nth 430
Fanny 17/04/1885 PORT STEPHENS Port Stephens RBS 141/1884 Sydney AIMA Hunter 433
1479/R01/V2-App2_V2 11

Ship / Item Date of loss Estuary Location Source Database ref. CommentsShipwrecks in NSW Estuaries, from the Australian National Shipwreck Database (ANSD)
Fire Queen 1896c Port Stephens, hull on beach RBS AIMA Mid Nth 976
Flying Fish 05/03/1870 Port Stephens, ashore SMH 7/3, 8/3/1870 SMH 2/12/1864; RBS AIMA Hunter 1268 This appears to be the same vessel that went ashore on the Manning River bar in a southerly gale that claimed a number of ships in November 1864.
Forest Queen 23/06/1902 Port Stephens, near inner light SMH 26/6/1902; RBS 41/1894 Sydney AIMA Hunter 1730
Francis Freeling 06/1839 Port Stephens, inside, grounded SMH 17/6/1839; British Register, Syd, 28/1839 AIMA Hunter 1275
Freak 07/10/1864 Port Stephens, middle bank RBS; SMH 21/10/1864 AIMA Hunter 1276
Governor Musgrave 1925> Port Stephens, Duckhole Parsons, R & Plunkett, G 'Scuttled and Abandoned Ships in Australian Waters', 1998. AIMA Central 502
Hawke 11/09/1876 Port Stephens, north head SMH 14/9/1876; RBS 22/1876 Sydney AIMA Mid Nth 1039
Hope 06/1817? Port Stephens Sydney Gazette 6/9/1817 AIMA Hunter 1323 Bateson (1972) in Australian Shipwrecks.p.57 says the crew may have been killed by Aboriginies.
Huntley Castle 04/03/1883 Port Stephens, rocks near entrance SMH 6/3/1883; RBS AIMA Hunter 429
Ida 19/06/1911 Port Stephens, Nelsons Bay, ashore SMH 20/6/1911 AIMA Hunter 500
Iluka after 1911 Port Stephens RBS; Parsons, R & Plunkett, G 'Scuttled and Abandoned Ships in Australian Waters', 1998. AIMA Central 519 Originally a paddle steamer, converted into a lighter after 1911. Reportedly later transformed into a screw propelled drogher for use in the Port Stephens timber export industry. Abandoned in that area at an unknown date.
Isle of Thanet 05/03/1870 Port Stephens, ashore SMH 7/3/1870; RBS AIMA Hunter 1338
Jane 8/06/1900 Port Stephens, Shoal Bay near Nelsons Head
NMH & Miner's Advocate 24/7/1900; RBS AIMA Hunter 230
Jessie Kelly 20/11/1886 Port Stephens, north head NMH & Miner's Advocate 25/11/1886; RBS AIMA Mid Nth 441
Kate Thompson before 1972 Port Stephens, Tea Gardens RBS; Parsons, R, 'Ships Registered at Newcastle NSW before 1900', 1982. AIMA Central 89
1479/R01/V2-App2_V2 12

Ship / Item Date of loss Estuary Location Source Database ref. CommentsShipwrecks in NSW Estuaries, from the Australian National Shipwreck Database (ANSD)
Lord 06/1874 Port Stephens, Nelsons Beach SMH 30/6/1874; RBS 43/1871 AIMA Hunter 399
Lurline 10/09/1869 Port Stephens SMH 15/9/1869; RBS AIMA Hunter 1400
Pandora 01/1836 Port Stephens, north head Sydney Herald 18/1/1836; RBS Syd 19/1831 AIMA Mid Nth 1480
Perseverance 05/1877 Port Stephens, north head RBS; Marine Board register of NSW wrecks 1877 AIMA Mid Nth 662
Psyche 1940 Port Stephens, Salamander Bay Bastock, J 'Ships on the Australia Station' p. 120 . Parsons, R & Plunkett, G, 'Scuttled and Abandoned Ships in Australian Waters' 1998
AIMA Hunter 2007 Ex third class cruiser RAN. Hulked 1922. Used at Port Stephens as a timber lighter. remains used in Clearnance Diving team excercises from 1950-1973. Remains now scattered.
Reliance 22/10/1928 Port Stephens, Tea Gardens SMH 23/10/28; RANZ 1927-28 RBS AIMA Mid Nth 2010
Rose 07/10/1916 Port Stephens, Tea Gardens SMH 10/10/1916; RBS AIMA Mid Nth 538
S A Hayward 13/03/1913 Port Stephens, on rocks inside north head
SMH 15/3/1913; NMH & Miners' Advocate 15/3/1913; RBS , Syd 14/1885 AIMA Mid Nth 504
Sally 18/04/1925 Port Stephens Loney, 'Australian Shipwrecks' vol. 4 p.120 AIMA Hunter 2022
Sea Foam 29/01/1894 Port Stephens, Shoal Bay SMH 31/1, 2/2, 6/2/1894; RBS 69/1878 AIMA Hunter 459
Sea Ripple 13/05/1875 Port Stephens, north head SMH 15/3, 26/3/1875; 18/3/1876; RBS AIMA Mid Nth 403
Secret 09/05/1869 Port Stephens, Providence Bay, ashore
SMH 13/5/1869; RBS AIMA Hunter 1560
Stag 27/01/1885 Port Stephens, north head, southside, ashore
SMH 29/1/1885; Mercury 3/2/1885;Launceton Examiner 7/8, 8/8, 10/8, 12/8, 18/8/1882; 229/1/1885; RBS
AIMA Mid Nth 434
Terara 1930c Port Stephens, Witt Island Richards, Mike ' Pig & Whistle Run' 1997; Parsons, R & Plunkett, G, 'Scuttled and Abandoned Ships in Australian Waters' 1998.
AIMA Mid Nth 451 Remains still visible.
Thordis 04/03/1906 Port Stephens, Nth Head NMH & Miners' Advocate 5/3, 5/3, 6/3/1906; Lloyd's Register 1904-05 AIMA Mid Nth 1604
Traveller 03/05/1874 Port Stephens, Nelsons Bay, Myall Beach, off
SMH 6/5, 8/5, 14/5/1874; Marine Board register of NSW wrecks - 1874 AIMA Hunter 400
Trial 18/05/1861 Port Stephens, north head SMH 21/5/1861; RBS AIMA Mid Nth 1612
Tybee 1865 Port Stephens, ashore Loney, J, 'Shipwrecks of the NSW North Coast' AIMA Hunter 1623 Tybee lost in PS 2/10/64 after taking shelter.
Active 18/02/1852 HUNTER RIVER Newcastle, Hunter River entrance RBS AIMA Hunter 11
Ajax 1928 Newcastle, nth of Stockton Bridge - West side
SMH 28/4, 1/5, 3/5/1897 (acquisition); Register of Australian and NZ Shipping; Parsons, R & Plunkett, G, 'Scuttled and Abandoned Ships in Australian Waters' 1998.
AIMA Hunter 1793
Alexander and John 1861 Newcastle, Nobbys Head SMH 29/8/1861; RBS AIMA Hunter 30
1479/R01/V2-App2_V2 13

Ship / Item Date of loss Estuary Location Source Database ref. CommentsShipwrecks in NSW Estuaries, from the Australian National Shipwreck Database (ANSD)
Alice 02/04/1861 Newcastle, Nobbys Head SMH 4/4/1861, 12/4/1861; RBS AIMA Hunter 48
Boatman 30/05/1901 Newcastle Harbour, near No. 12 Crane
NMH 31/5/1901 AIMA Sydney 1721
Champion 10/05/1877 Newcastle, Hunter River entrance SMH 1/5/1887 AIMA Hunter 537
Delight 12/04/1838 Newcastle, Hunter River, entrance RBS; SMH 16/4/1838 AIMA Hunter 1201
Doorebang 31/07/1873 Newcastle, on rocks btwn Stoney Pt & Nobbys
RBS; SMH 1/8, 2/8/1873 AIMA Hunter 517
Elaine 1914 Newcastle, Stockton, River Bank RBS AIMA Hunter 637
Elamang 02/1905 Newcastle Harbour, nothern arm of breakwall
RBS; NMH 4/2/1905 AIMA Hunter 1225
Gazelle 07/1860 Newcastle, ashore near lighthouse SMH 24/7, 25/7/1860; RBS 30/1857 Melbourne AIMA Hunter 1286 Outbound
Gilbert Jamieson 1859 Newcastle, nth side of Nobbys RBS AIMA Hunter 1293
Goolwa 1919 Hunter River, entrance to South Arm RBS; Parsons, R & Plunkett, G, 'Scuttled and Abandoned Ships in Australian Waters' 1998. AIMA Hunter 1890
Heather Bell before 1972 Hunter River RBS; Parsons, R, 'Ships Registered at Newcastle NSW before 1900', 1982. AIMA Hunter 73
Jesse 12/03/1831 Hunter River, near Hog Island Sydney Gazette 24/3, 7/4/1831; RBS Syd 8/1829 AIMA Hunter 1349
Kate Tatham 04/11/1907 Newcastle, North Stockton, on River Bank
SMH 5/11/1907; RBS AIMA Hunter 1362
Katoomba 02/1905 HUNTER RIVER Newcastle, nth breakwater RBS AIMA Hunter 1364
King William IV 02/07/1839 Newcastle, ashore on Nobbys Island Sydney Herald 22/1/1838; 5/7/1839; RBS AIMA Hunter 1671 Outbound
Kuring Gai 1930 Hunter River, Hexham RANZ 1929-30; Lloyd's Register 1927-28; RBS AIMA Hunter 1932
Marie 06/05/1914 Hunter River, Paterson NMH 7/5/1914; RBS AIMA Hunter 1014
Mary Lloyd 05/05/1874 Newcastle, Nobbys Head SMH 5/5/1874; Marine Board register of NSW wrecks - 1874 AIMA Hunter 526 Outbound
Norfolk 10/1800 Newcastle, Pirate Point HRA I, ii, p564; HRA I, iii, p14, 38, 759, 760; Parsons, R (personal files) AIMA Hunter 1464 Ship was rescued and wrecked in Tahiti, 1802.
Otago 31/07/1867 Newcastle SMH 1/7/11867; RBS AIMA Hunter 1477
Rob Roy 07/1838 Newcastle, Nobbys Head, ashore Sydney Herald 16/7/1638; RBS AIMA Hunter 888
Swansea 02/12/1915 Newcastle Harbour Newcastle Morning Herald 8 March 1916; RBS AIMA Hunter 645
Sylvan 12/1924 Newcastle, near Stockton Hospital RBS Parsons, R & Plunkett, G, 'Scuttled and Abandoned Ships in Australian Waters' 1998. AIMA Hunter 2046
Topsey before 1972 Hunter River RBS; Parsons, R, 'Ships Registered at Newcastle NSW before 1900', 1982. AIMA Hunter 49
Toronto 14/09/1944 Newcastle, Stockton NMH 15/9/1941 P.1 AIMA Hunter 2055
Vulcan 24/12/1837 Newcastle, entrance to Hunter River Sydney Herald 28/12/1837; 8/1/1838 RBS AIMA Hunter 1645
Yarra 01/1908 Newcastle Harbour, opposite Pilot Station
SMH 3/1/1908 AIMA Hunter 623 Likely to have been refloated.
Alpha before 1862 WILLIAMS RIVER Williams River, near Newcastle Australasian Shipping Record Jul 1975 RBS Melbourne 9/1841; 12/1843 AIMA Hunter 901
1479/R01/V2-App2_V2 14

Ship / Item Date of loss Estuary Location Source Database ref. CommentsShipwrecks in NSW Estuaries, from the Australian National Shipwreck Database (ANSD)
Cooreei 03/08/1906 Clarencetown, opp Williams River SNC whvs
British Register (Newcastle) 5/1886 AIMA Hunter 617
Currumbene 09/01/1934 Williams River, near Seaham (Hunter R trib.)
RBS Lloyds Register - Steamers & motorships under 300 tons; RANZ 1933-34 AIMA Hunter 1855
Garnet 03/1930 Williams River, Seaham (Hunter R tributary)
British Register (Syd) 45/1900 , but re-registered in Newcastle in 1904. 1904 register not yet acquired.
AIMA Hunter 1886
Blue Gum* 19?? LAKE MACQUARIE Swansea channel MSB unsourced list of vessels wrecked off NSW coast AIMA Hunter 97
Crescent I 1916 Swansea RBS AIMA Hunter 643
Frederick 1831 Lake Macquarie, Reids Mistake, near, Sydney Gazette 25/6, 30/6/1831 AIMA Hunter 1278
Free Trade 29/04/1884 Lake Macquarie Heads SMH 1/5/1884; RBS AIMA Hunter 557
Maggie Johnson 26/06/1902 Lake Macquarie, Young Wallsend, Cockle Ck
NMH & Miners' Advocate 27/6/1902; RBS 31/1888 Sydney AIMA Hunter 629
Paris 09/02/1912 Lake Macquarie, breakwater SMH 14/2, 16/2/1912; NMH & Miners' Advocate 19/2, 28/3/1912; RBS AIMA Hunter 635
Portable 1910 Swansea, Belmont SMH 14/5/1910, p14 AIMA Hunter 631
Sally 16/07/1812 Lake Macquarie, Reid's Mistake Sydney Gazette 1/8/1812 AIMA Central 1544
Scottish Queen 21/12/1919 Lake Macquarie NMH 22/12/1919, 30/12/19 AIMA Central 2024 Hit bar, engine failed. 7 deaths.
Sea Sovereign 01/01/1938 Lake Macquarie, northern breakwater SMH 3/1/1938; NMH & Miners' Advocate 3/1/1938 AIMA Hunter 2026
Uncle Tom 21/12/1875 Lake Macquarie bar Marine Board register of NSW wrecks - 1875; RBS AIMA Hunter 532
Village Maid 06/09/1876 Lake Macquarie entrance RBS AIMA Hunter 521
West Hartley No. 2 07/1866 Lake Macquarie entrance Reids Mistake Wreck probably recovered.
Anne Maria 21/07/1857 HAWKESBURY RIVER / BROKEN BAY
Broken Bay, 'Bungarees Noragh' SMH 10/8/1857 AIMA Central 61
Argument 03/1809 Broken Bay, East & West Reef SG 2/4/1809, 26/3/1809 AIMA Central 69
Ariel 30/07/1857 Broken Bay, Barranjoey Head, ashore SMH 31/7, 1/8/1857 AIMA Central 70 Probably refloated.
Bella Coulter 06/10/1872 Hawkesbury River mouth, Flint & Steel Point
SMH 22/10/1872 AIMA Central 461
Brothers 10/1845 Broken Bay, entrance in 2 fathoms SMH 13/10/1845; RBS, Sydney AIMA Central 112
Brothers 1870 Sydney, Pittwater RBS, Sydney AIMA Sydney 113
Caroline 12/02/1869 Brisbane Water, bar, west spit RBS, Sydney; SMH 17/2, 26/2/1869 AIMA Central 1123
Charlotte Fenwick 29/04/1920 Hawkesbury River RBS; RANZ (18 - 19) AIMA Central 1834
Denmark Hill 26/04/1839 HAWKESBURY RIVER / BROKEN BAY
Sydney, Pittwater RBS; SMH 26/7/1822 p3c; SG 7/10/1824 p2a; 29/4/1839 AIMA Sydney 1202
Dora 30/9/1871 Broken Bay Bar (Brisbane Waters) RBS 30/1870 Sydney AIMA Central 2116
Elizabeth 1876 Hawkesbury River RBS AIMA Central 918
Endeavour 1850 Hawkesbury River RBS AIMA Central 1248
1479/R01/V2-App2_V2 15

Ship / Item Date of loss Estuary Location Source Database ref. CommentsShipwrecks in NSW Estuaries, from the Australian National Shipwreck Database (ANSD)
Experiment 12/03/1818 Broken Bay, sth east arm Sydney Gazette 1/1/1809, 21/3/1818 AIMA Sydney 1254
Happy Days 05/05/1931 Hawkesbury River, Brooklyn, 'The Gunya'
SMH 6/5/31 AIMA Central 1898
Hawkesbury 11/1916 Hawkesbury River Lloyd's Register 1916-17; RBS Syd 51/1886, 40/1892 AIMA Central 760 Previously burnt and scuttled at Sadeville, Hawkesbury River in 1891, but refloated and rebuilt.
Industry 10/09/1876 Broken Bay, under Mt Elliot, (Lion Is), ashore
SMH 13/9, 29/9/1876; RBS Syd 114/1854, 34/1858 AIMA Central 558
John 22/05/1803 Broken Bay, at Flint and Steel Bay Sydney Gazette 29/5/1803 AIMA Central 1353
Kellermont 16/02/1868 Hawkesbury River, Flint & Steel Bay SMH 19/2/1868; RBS AIMA Central 1365
L.H.E. 04/10/1947 Hawkesbury River, Jerusalem Bay RBS AIMA Central 1935
Lady Alicia 28/07/1934 Broken Bay, Patonga SMH 30/7/34 AIMA Central 1936
Linnett 04/1834 Broken Bay SMH 28/4/1834 AIMA Central 1388
Maitland 06/05/1898 Broken Bay, Maitland Bay SMH 9/5, 10/511/5, 12/521/5, 25/5, 6/10/1898; 10/1/1899; State Archives Office Vice Admiralty Court of NSW 1787-1911: 32/1888, 2/8584, 7/3866; RBS
AIMA Central 1408 Lost in the 'Maitland Gale'. 21 deaths.
Mako 16/01/1935 Sydney, Broken Bay, Lion Island SMH 17/1/35 p.16 report of wreckage of launch - no name AIMA Central 1946
Marian 18/10/1936 Hawkesbury River, Croppy Point SMH 20/10/1936, 26/10/1936 AIMA Central 1956
Marion 1856 HAWKESBURY RIVER / BROKEN BAY
Broken Bay SMH 14/11/1856; RBS AIMA Central 1419
Mariposa 1870 Broken Bay, near Juno Head, ashore SMH 15/3/1870; RBS AIMA Central 1420
Mary 04/10/1864 Broken Bay, near Sth Head SMH 8/10, 21/10/1864 AIMA Sydney 1426
Midshipman 09/09/1857 Broken Bay, Brisbane Water entrance Empire 14/9/1857; RBS Sydney 116/1853 AIMA Central 182
Minmi 1889 ~ Hawkesbury Bridge RBS AIMA Central 944
Mischief 01/01/1928 Broken Bay, Pearl Beach SMH 3/1, 4/1/1828; RBS AIMA Central 1965
Morewa 1948 Broken Bay, Pittwater RANZ 1941; Loney, 'Australian Shipwrecks' vol. 4, p.199. AIMA Sydney 1969
Narooma 04/02/1909 Broken Bay, Boat Harbour, ashore NMH & Miners' Advocate 6/2/1909; RBS Syd 23/1904 AIMA Central 372
Nauwai 21/12/1941 Broken Bay, Pittwater RBS; RANZ 1937 AIMA Sydney 1981
Notion 28/04/1870 Broken Bay SMH 29/4, 30/4, 4/5, 2/5/1870; RBS AIMA Central 1468
Pea Hen 10/07/1878 Broken Bay, ashore, middle of Brisk Bay (Patonga)
SMH 15/07, 28/8/1878; RBS; Marine Board register of NSW wrecks - 1878 AIMA Central 666
Phantom 03/05/1872 Broken Bay, Mount Elliott SMH 6/5/1872 AIMA Central 1084
Phoenix 25/05/1931 Hawkesbury River RBS; RANZ 1930-31 AIMA Central 1999
Rapid 1857 Broken Bay, West Head, near SMH 31/7/1857; RBS 15/1856 Melbourne AIMA Central 1518
Rover 03/11/1842 Broken Bay, Pittwater Sydney Herald 7/11/1842; RBS AIMA Sydney 1539
1479/R01/V2-App2_V2 16

Ship / Item Date of loss Estuary Location Source Database ref. CommentsShipwrecks in NSW Estuaries, from the Australian National Shipwreck Database (ANSD)
Songariti 09/01/1938 Broken Bay, Pittwater, Palm Beach SMH 10/1/1938 p.9; RBS AIMA Sydney 2032
Southern Light 27/11/1864 Broken Bay, near Mt Ettalong (Ettalong Head)
SMH 2/12, 21/12/1864; Dunn, Gwen 'Shipbuilders of Brisbane Water' 1997 AIMA Central 1572
Speedwell 04/1814 Hawkesbury River, ashore near Sydney Gazette 23/4/1814; Loney, J, 'Wrecks of the NSW North Coast' AIMA Central 1578 May have been recovered.
Star 08/1857 Broken Bay, Back Beach, ashore SMH 17/8, 18/8/1857 AIMA Central 1580
Swan Ex-H.M.A.S. 02/02/1934 Hawkesbury River Bastock 'The Great War - Torpedo Boat Destroyers' p40 AIMA Central 2043
Trusan 19/05/1949 Broken Bay, Saltpan Cove, Pittwater SMH 20/5/1949; RBS; RANZ 1949 AIMA Sydney 2057
Valiant 1981 Broken Bay, Barranjoey Parsons, R & Plunkett, G, 'Scuttled and Abandoned Ships in Australian Waters' 1998. AIMA Central 1633
A21 Japanese Submarine
31/05/1942 SYDNEY HARBOUR Sydney Harbour, in or near none AIMA Sydney 1787
Agnes 27/01/1906 Sydney Harbour SMH 29/1/1906, 28/4/1906; NMH 28/4/1906 AIMA Sydney 897 Ferry service, collision, 2 deaths.
Alice 1938 Sydney Harbour Not in SMH; Loney, update, p. 100 AIMA Sydney 1794
Annie 30/06/1858 Sydney Harbour, Nth Hd SMH 1/7/1858 AIMA Sydney 63
Arabian 1857 Sydney Harbour, Balmain, Waterview Bay
RBS AIMA Sydney 67 Scuttled for wharf.
Aryfield 1972 Sydney, Parramatta River, Homebush Bay
RBS; Sydney Parsons, R & Plunkett, G, 'Scuttled and Abandoned Ships in Australian Waters' 1998.
AIMA Sydney 65
Brisk 10/06/1865 Sydney Harbour, North Head SMH 21/6/1865; RBS, Sydney AIMA Sydney 108
Cadet 02/1912 Sydney Harbour RBS 40/1905 Sydney AIMA Sydney 748
Capella 23/12/1925 Sydney, North Head 600m inside SMH 24/12/1925; RBS, Sydney AIMA Sydney 1827 Thieves suspected of stealing the yacht from its moorings at Rushcutter Bay, prior to its recreational departure for Tasmania. The yacht had been blown onto rocks and the thieves fled.
Cateaux Wattel 04/05/1860 Sydney Harbour, Walsh Bay SMH 5/5, 11/5, 12/5, 14/5, 15/5, 21/7/1860; Bureau Veritas 1860 AIMA Sydney 1130
Catherine Adamson 24/10/1857 Sydney Harbour, North Head, Old Man's Hat
Lloyd's Building Survey Report Lloyds Register SMH 26 - 29/10/1857; The Argus 31/10, 9/11, 11/11, 30/12/1856; Shipping Gazette 26/10/1857
AIMA Sydney 1128 21 deaths.
Centennial 23/08/1889 Sydney Harbour, Taylors Bay RBS; SMH 24/8, 26/8/1889 AIMA Sydney 1134
Centurion 16/01/1887 Sydney Harbour, North Head Lloyds Survey Report 1869; SMH 17/1/1887 AIMA Sydney 1136
Claude 07/11/1908 Sydney Harbour, Waterview Bay, Balmain
SMH 9/11/1908 pp 1a & 7f; RBS Syd 25/1889 (For account of collision with 'White Heather' and 'Newcastle')
AIMA Sydney 1763 Most likely refloated.
Cobaki 1946c Sydney, Middle Harbour, Salt Pan Creek
RBS Parsons, R & Plunkett, G, 'Scuttled and Abandoned Ships in Australian Waters', 1998. AIMA Sydney 353
1479/R01/V2-App2_V2 17
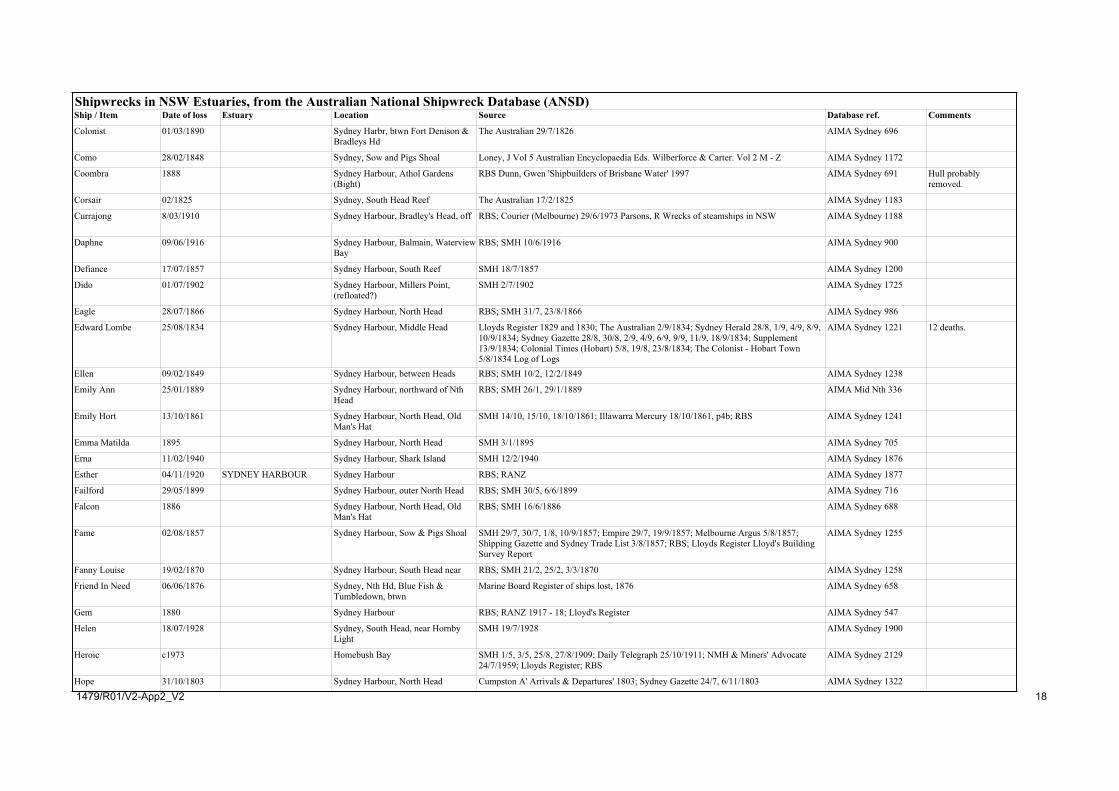
Ship / Item Date of loss Estuary Location Source Database ref. CommentsShipwrecks in NSW Estuaries, from the Australian National Shipwreck Database (ANSD)
Colonist 01/03/1890 Sydney Harbr, btwn Fort Denison & Bradleys Hd
The Australian 29/7/1826 AIMA Sydney 696
Como 28/02/1848 Sydney, Sow and Pigs Shoal Loney, J Vol 5 Australian Encyclopaedia Eds. Wilberforce & Carter. Vol 2 M - Z AIMA Sydney 1172
Coombra 1888 Sydney Harbour, Athol Gardens (Bight)
RBS Dunn, Gwen 'Shipbuilders of Brisbane Water' 1997 AIMA Sydney 691 Hull probably removed.
Corsair 02/1825 Sydney, South Head Reef The Australian 17/2/1825 AIMA Sydney 1183
Currajong 8/03/1910 Sydney Harbour, Bradley's Head, off RBS; Courier (Melbourne) 29/6/1973 Parsons, R Wrecks of steamships in NSW AIMA Sydney 1188
Daphne 09/06/1916 Sydney Harbour, Balmain, Waterview Bay
RBS; SMH 10/6/1916 AIMA Sydney 900
Defiance 17/07/1857 Sydney Harbour, South Reef SMH 18/7/1857 AIMA Sydney 1200
Dido 01/07/1902 Sydney Harbour, Millers Point, (refloated?)
SMH 2/7/1902 AIMA Sydney 1725
Eagle 28/07/1866 Sydney Harbour, North Head RBS; SMH 31/7, 23/8/1866 AIMA Sydney 986
Edward Lombe 25/08/1834 Sydney Harbour, Middle Head Lloyds Register 1829 and 1830; The Australian 2/9/1834; Sydney Herald 28/8, 1/9, 4/9, 8/9, 10/9/1834; Sydney Gazette 28/8, 30/8, 2/9, 4/9, 6/9, 9/9, 11/9, 18/9/1834; Supplement 13/9/1834; Colonial Times (Hobart) 5/8, 19/8, 23/8/1834; The Colonist - Hobart Town 5/8/1834 Log of Logs
AIMA Sydney 1221 12 deaths.
Ellen 09/02/1849 Sydney Harbour, between Heads RBS; SMH 10/2, 12/2/1849 AIMA Sydney 1238
Emily Ann 25/01/1889 Sydney Harbour, northward of Nth Head
RBS; SMH 26/1, 29/1/1889 AIMA Mid Nth 336
Emily Hort 13/10/1861 Sydney Harbour, North Head, Old Man's Hat
SMH 14/10, 15/10, 18/10/1861; Illawarra Mercury 18/10/1861, p4b; RBS AIMA Sydney 1241
Emma Matilda 1895 Sydney Harbour, North Head SMH 3/1/1895 AIMA Sydney 705
Erna 11/02/1940 Sydney Harbour, Shark Island SMH 12/2/1940 AIMA Sydney 1876
Esther 04/11/1920 SYDNEY HARBOUR Sydney Harbour RBS; RANZ AIMA Sydney 1877
Failford 29/05/1899 Sydney Harbour, outer North Head RBS; SMH 30/5, 6/6/1899 AIMA Sydney 716
Falcon 1886 Sydney Harbour, North Head, Old Man's Hat
RBS; SMH 16/6/1886 AIMA Sydney 688
Fame 02/08/1857 Sydney Harbour, Sow & Pigs Shoal SMH 29/7, 30/7, 1/8, 10/9/1857; Empire 29/7, 19/9/1857; Melbourne Argus 5/8/1857; Shipping Gazette and Sydney Trade List 3/8/1857; RBS; Lloyds Register Lloyd's Building Survey Report
AIMA Sydney 1255
Fanny Louise 19/02/1870 Sydney Harbour, South Head near RBS; SMH 21/2, 25/2, 3/3/1870 AIMA Sydney 1258
Friend In Need 06/06/1876 Sydney, Nth Hd, Blue Fish & Tumbledown, btwn
Marine Board Register of ships lost, 1876 AIMA Sydney 658
Gem 1880 Sydney Harbour RBS; RANZ 1917 - 18; Lloyd's Register AIMA Sydney 547
Helen 18/07/1928 Sydney, South Head, near Hornby Light
SMH 19/7/1928 AIMA Sydney 1900
Heroic c1973 Homebush Bay SMH 1/5, 3/5, 25/8, 27/8/1909; Daily Telegraph 25/10/1911; NMH & Miners' Advocate 24/7/1959; Lloyds Register; RBS
AIMA Sydney 2129
Hope 31/10/1803 Sydney Harbour, North Head Cumpston A' Arrivals & Departures' 1803; Sydney Gazette 24/7, 6/11/1803 AIMA Sydney 1322
1479/R01/V2-App2_V2 18

Ship / Item Date of loss Estuary Location Source Database ref. CommentsShipwrecks in NSW Estuaries, from the Australian National Shipwreck Database (ANSD)
Inflexible 26/08/1889 Sydney Harbour, The Sisters, off SMH 28/8/1889; RBS AIMA Sydney 792
Iserbrook 09/10/1880 Sydney Harbour, Mrs Macquarie's Chair
RBS AIMA Sydney 668
Itata 12/01/1906 Sydney Harbour, Middle Hbr, Salt Pan Ck
Sydney Mail 17/1/1906; NMH 25/1/1906; Lloyd's Register AIMA Sydney 1339
Jane 1866c Sydney Harbour, Balmain RBS AIMA Sydney 1343
Jessie 19/05/1905 Sydney Harbour, NE or NNE of South Reef
NMH & Miners Advocate 22/5/1905; SMH 22/5/1905; RBS AIMA Sydney 733
Julia 10/08/1873 Sydney Harbour, North Head, Old Man's Hat
SMH 13/8/1873; Marine Board register of wrecks for 1873; RBS AIMA Sydney 650
Kaludah 22/03/1911 Sydney, Parramatta R, Tarban Ck, near Head of
SMH 23/3/1911; RBS AIMA Sydney 746
Karangi H.M.A.S. 1970c Sydney, Parramatta River, Homebush Bay
Bower, R 'Historical Research of three abandoned hulks in Homebush Bay' 1993. AIMA Sydney 1006
Kate 02/04/1914 Sydney Harbour, Middle Harbour, Dobroyd
NMH 3/4/1914; RBS 21/1884 Sydney AIMA Sydney 752
Kate 22/08/1898 Sydney Harbour, Garden Island, near SMH 23/8/1898 AIMA Sydney 1736
Lady Emma 30/04/1880 Sydney Harbour, North Head SMH 1/5/1880; Marine Board list of wrecks for 1880; RBS Syd 44/1869; Marine Board register of wrecks for 1880
AIMA Sydney 669
Lah Loo 09/12/1920 Sydney Harbour, Manly RBS AIMA Sydney 2096
Lalla Rookh 1898 Sydney Harbour, broken up at Kerosene Bay
SMH 18/3/1862; RBS AIMA Sydney 1375
Leichhardt 09/06/1916 Sydney Harbour, Balmain, Waterview Bay
SMH 10/6/1916; RBS AIMA Sydney 999
Leila 01/11/1898 Sydney Harbour, just outside of Circular Quay
NMH & Miners' Advocate 24/11/1898 AIMA Sydney 1738
Leveret 28/12/1895 Sydney Harbour, South Reef, near NMH & Miners' Advocate 30/122/1895; RBS AIMA Sydney 707
Liberty 20/01/1830 Sydney Harbour, North Head Sydney Gazette 15/1, 21/10/1824; The Australian 22/1/1830 'Applications for Registration of vessels - letters of 28 Oct and 1 Nov 1824', State Records of NSW Microfilm reel 2775; Abstract of all Registers of vessels from the "Plantation Registry", State Records NSW Ref 4/1710, pp141-142.
AIMA Sydney 1385
Lilian 28/02/1914 Sydney Harbour, Watsons Bay RBS AIMA Sydney 416
Lucretia 26/06/1839 Sydney Harbour, Kirribilli Point, ashore
Sydney Gazette 25/6, 28/6/1839 AIMA Sydney 1397
Marlean H.M.A.S. 12/11/1944 Sydney Harbour SMH 13/11/1944; Loney, vol. 4, p.189 AIMA Sydney 1957
Mary Ann 25/09/1867 Sydney Heads? SMH 26/9/1867; Parsons, R (personal files) AIMA Sydney 815
May Byrnes 02/02/1901 Sydney Harbour, North Head NMH & Miners' Advocate 4/2/1901; RBS AIMA Sydney 719
Missie 30/12/1870 Sydney Harbour Heads, ashore South Reef
SMH 31/12/1870; 27/1/1871; RBS 7/1865 Sydney AIMA Sydney 1442
1479/R01/V2-App2_V2 19

Ship / Item Date of loss Estuary Location Source Database ref. CommentsShipwrecks in NSW Estuaries, from the Australian National Shipwreck Database (ANSD)
Mortlake Bank 1972 Sydney, Parramatta River, Homebush Bay
RBS Parsons, R & Plunkett, G, 'Scuttled and Abandoned Ships in Australian Waters' 1998. AIMA Sydney 1011
Mureegar 27/06/1927 Sydney Harbour, Middle Harbour SMH 28/6/1927 AIMA Sydney 1971
Nereus H.M.A.S 02/07/1942 Sydney Harbour SMH 3/7/1942 p5; Loney, vol. 4, p.179 AIMA Sydney 3
Northern Light 16/03/1878 Sydney Harbour, Bradley's Head SMH 18/3, 23/3/1878; Marine Board register of NSW wrecks - 1878; RBS AIMA Sydney 665
Omeo 04/06/1899 Sydney Harbour, Darling Harbour, Bathurst St
SMH 5/6/1899; RBS AIMA Sydney 717
Orphan Girl 20/01/1880 Sydney Harbour, Darling Harbour SMH 22/1, 3/2/1880 AIMA Sydney 885
Osprey 06/06/1882 Sydney Harbour, Point Macquarie, Farm Cove
SMH 9/6, 10/6/1882 AIMA Sydney 1748 Passenger ferry. Likely to have been salvaged but no report found to date.
Perseverance 05/1843 Sydney Harbour, South Reef SMH, Mon 8/5/1843; RBS AIMA Sydney 2126
Pinnace, H M Penguin 09/07/1914 Sydney Harbour, near Dawes Point SMH 10/7/1914; NMH & Miners' Advocate 10/6/1914 AIMA Sydney 755
Police Launch 16/01/1938 Sydney, Parramatta River NMH 17/1/38 AIMA Sydney 2002
Pomme de Terre 19/05/1887 Sydney Heads, between SMH 20/5, 21/5/1887; RBS AIMA Sydney 948
Potts & Paul 1941 Kerosene Bay, Sydney Harbour RBS 70/1885 Sydney AIMA Sydney 737
Prince Patrick 17/12/1869 Sydney Harbour, North Head, just inside
SMH 31/12/1869; RBS Melb 196/1853, 45/1866, Syd 33/1867 AIMA Sydney 1505
Prosperous 30/11/1856 Sydney Harbour, between Heads RBS; Dunn, Gwen 'Shipbuilders of Brisbane Water' 1997 AIMA Sydney 1511
Ranger 05/12/1842 Sydney Heads, between RBS AIMA Sydney 1517
Ranger 24/11/1881 Sydney Harbour SMH 26/11/1881 AIMA Sydney 1754
Robert R Hind 11/02/1929 Sydney, Kerosene Bay Parsons, R & Plunkett, G 'Scuttled and Abandoned Ships in Australian Waters', 1998. AIMA Sydney 685 Parsons & Plunkett note that some records indicate that this vessel was scuttled.
Robert Syers 05/11/1854 Sydney Harbour RBS 5/1854 Sydney AIMA Sydney 1530
Rodney 13/02/1938 Sydney Harbour NMH 14/2/1938; SMH 15/2/1938 AIMA Sydney 2019
Rose 04/04/1927 Sydney Harbour, Fivedock Bay SMH 5/4/1927; RBS; RANZ 1924-25 AIMA Sydney 2020
Sarah 06/1839 Sydney Harbour, between the Heads Sydney Herald 12/6, 16/12/1839; RBS AIMA Sydney 1068
Siesta H.M.A.S. 23/09/1942 SYDNEY HARBOUR Sydney Harbour Loney, 'Australian Shipwrecks' vol 4. p 179 AIMA Sydney 2028
Silver Cloud H M A S
23/09/1942 Sydney Harbour Loney, 'Australian Shipwrecks' Vol. 4, P.179 AIMA Sydney 2029
Snowdon 28/01/1863 Sydney Harbour, North Head SMH 29/1/1863; RBS 27/1861 Melbourne AIMA Sydney 1568
Sophia 10/07/1881 Sydney, North Head, at Old Man's Hat
SMH 11/7/1881; RBS AIMA Sydney 672
Souvenir 28/11/1860 Sydney Harbour Heads, South Reef SMH 29/11, 5/12, 7/12/1860 AIMA Sydney 1574
1479/R01/V2-App2_V2 20

Ship / Item Date of loss Estuary Location Source Database ref. CommentsShipwrecks in NSW Estuaries, from the Australian National Shipwreck Database (ANSD)
St Albans 17/05/1882 Sydney, Long Bay, on North Head SMH 18/5, 23/5, 2/6/1882; RBS 40/1881 AIMA Sydney 677
Suki 13/06/1938 Sydney Harbour, Clifton Gardens SMH 14/6/1938 p11 AIMA Sydney 2040
Thelma 08/03/1913 Sydney Harbour, Dobroyd Point SMH 10/3/1913 AIMA Sydney 750
Three Bees 20/05/1814 Sydney Harbour, Bennelong Point Sydney Gazetts 7/5, 14/5, 21/5/1814; Historic Records of Australia (HRA) I viii Cumpston 'Arrivals and Departures' 1814
AIMA Sydney 1605
Torch 25/03/1917 Sydney Harbour, Fort Denison, near SMH 7/5/1917 AIMA Sydney 762
Tramp 01/1915 Sydney Harbour, North Head SMH 1/2, 2/2/1915; NMH & Miners' Advocate 8/3/1916; RBS AIMA Sydney 758
Turtle 1881/03/27 Sydney Harbour Heads SMH 15/3/1880; RBS AIMA Sydney 673
Two Friends 1851 Sydney, off Sth Reef, nearly mid channel
SMH 29/11, 1/12, 5/12, 13/12/1851; RBS AIMA Sydney 1621 Thought to have carried over to Dobroyd Head.
Una 04/04/1927 Sydney Harbour, Five Dock Bay SMH 5/4/1927; RBS; RANZ 1924-25 AIMA Sydney 2061
Undine 28/12/1936 Sydney Harbour, Walsh Bay SMH 29/12/1936; RANZ 1934; RBS AIMA Sydney 2062
Voyager 07/03/1937 Sydney Harbour, North Head - Blue Fish Point
SMH 8/3/1937, 29/4/1937 AIMA Sydney 2071
W H Lincoln 04/01/1892 Sydney Hbr, Woolloomooloo B, Cowper Wharf
SMH 6/1, 3/2, 14/1/1892; Lloyd's Register 1891-92 AIMA Sydney 700
Wanderer 09/07/1848 Sydney Harbour, Middle Hd, drifted 0.25ml sth
SMH 10/7, 11/7, 12/7, 14/7, 15/7, 31/7/1848; Morten Bay Courier 22/7/1848; Australian Encyclopaedia 1926, p 712 RBS
AIMA Sydney 1650
William Cossar 14/02/1825? Sydney Harbour, Sow and Pigs Shoal Sydney Gazette 19/7/1817, 1/5/1819, 17/2/1825; Cumpston 'Arrivals and departures - 1817' AIMA Sydney 1666
William Hill 28/11/1865 Sydney Harbour, North Head SMH 29/11/1865; RBS 1/1861 Geelong AIMA Sydney 1667
William Woolley 09/05/1854 Sydney Harbour, Darling Harbour SMH 10/5/1854; Lloyd's Register 1845 AIMA Sydney 1669
Young Charlie 21/04/1900 Sydney Harbour, Woolloomooloo Bay
SMH 23/4/1900 AIMA Sydney 718
Advance 11/02/1884 BOTANY BAY Sydney, Botany Bay, inside Nth Hd, Henry Hd Bight
SMH 12/2/1884; RBS AIMA Sydney 682
Advance 12/06/1902 Sydney, Botany Bay, Henrys Head SMH 13/6/1902; NMH & Miners' Advocate 16/7/1902; RBS AIMA Sydney 844
Aorangi 13/12/1928 Sydney, Kogorah Bay SMH 14/12/28 AIMA Sydney 1801
Eileen 25/12/1934 Sydney, Kurnell SMH 26/12/34 AIMA Sydney 1869
Fanny 07/1870 Sydney, Botany Bay, North Head RBS AIMA Sydney 981
Kelloe 13/05/1902 Sydney, Botany Bay (Off Little Bay) SMH 14/5, 28/6/1902; Daily Commercial News & Shipping List 14/5/1902; RBS; Lloyd's Register 1900-1901
AIMA Sydney 1366
Minmi 13/05/1937 Sydney, Botany Bay, Cape Banks SMH 14/5, 15/5, 27/5, 3/7/1837; RBS; Lloyd's Register 1937-38; RANZ 1934 AIMA Sydney 1963
Minnie Wamsley 1903 Sydney, Botany Bay RBS AIMA Sydney 727
Olive 01/06/1930 Sydney, Botany Bay, Frenchman's Bch
SMH 2/6/, 3/6/1930 AIMA Sydney 1989 Possibly salvaged.
1479/R01/V2-App2_V2 21

Ship / Item Date of loss Estuary Location Source Database ref. CommentsShipwrecks in NSW Estuaries, from the Australian National Shipwreck Database (ANSD)
Peri 21/06/1874 Sydney, Botany Bay, Herrings Head SMH 22/6/1874; Marine Board register of NSW wrecks 1874; RBS AIMA Sydney 654
Pioneer 27/06/1875 Sydney, Botany Bay, South Head, ashore
SMH 13/3/1876; RBS 14/1873 Adelaide AIMA Sydney 770
Prompt 30/01/1881 Botany Bay, ashore near govt wharf SMH 1/2/1881 AIMA Sydney 2103
Sea Breeze 15/05/1883 Sydney, Botany Bay, north head SMH 117/11/1879, 6/5/1883; RBS 82/1877 AIMA Sydney 679
Albion 16/04/1867 PORT HACKING Port Hacking, south head SMH 23/4/1867, 1/4/1867, 2/4/1867; RBS (Syd) 36/1857 AIMA Sydney 36
Cambrian Packet 20/06/1861 Port Hacking (Aiken), Cape Solander RBS; SMH 18/6, 20/6, 22/6/1861; Lloyd's Register AIMA Sydney 1116
Dauntless 26/04/1870 Port Hacking, South Head SMH 26/4, 29/4, 3/5/1870; RBS; Lloyds Register AIMA Sydney 1195
Hilda 20/06/1893 Port Hacking, north head, near shore RBS 42/1879; Australian Shipping News 22/7, 19/8/1893; Court of Marine Enquiry 2/10547, NSW Arch.
AIMA Sydney 1319
James Afflick 11/07/1877 Port Hacking, south spit SMH 18/7/1877; RBS; Marine Board list of wrecks for 1877 AIMA Sydney 775
Lady Ellen 1936 Port Hacking Loney update p. 98 AIMA Sydney 1937
Malua 06/06/1886 Port Hacking, Wata Mooli Ck, under Sth Head
SMH 11/6/1886; RBS AIMA Sydney 790
Adele 07/05/1943 PORT KEMBLA Port Kembla RANZ 1927-28; RBS 3/1907 AIMA Illawarra 1791
Clio 15/11/1927 Port Kembla, northern breakwater SMH 16 - 17/11/1927; RANZ 1924 - 1925 - cannot determine which Clio is which AIMA Illawarra 1840
Hawkesbury Packet 08/1817? MINNAMURRA Minnamurra entrance (Gomorramorrah), reef
Sydney Gazette 6/7, 20/7/1816, 1/2, 6/9/1817; Cumpsten, Arrivals & Departures, 1817 AIMA Illawarra 1310 Owner, Solomon Wiseman's vessels/crews seem to have been in regular conflict with the Aboriginal people around Port Stephens. See 6/71816, 1/2/1817 and 6/9/1817 references. See also Bateson, C., Australian Shipwrecks. 1972, p.54.
Rangoon 22/03/1870 Minnamurra, E side of small island at mouth
SMH 23/3, 27/3, 29/3, 2/5/1870; RBS AIMA Illawarra 933
Budgaree 23/06/1891 BATEMANS BAY /CLYDE RIVER
Batemans Bay, Beagle Bay SMH 27/6, 2/7/1891; RBS, Sydney AIMA Eurobo 829
*Conjola 21/07/1927 *St Georges Basin? Batemans Bay or *Sussex Inlet RBS; RANZ - 1924 - 25 AIMA Shoalhav 1848 Location information is unclear.
1479/R01/V2-App2_V2 22

Ship / Item Date of loss Estuary Location Source Database ref. CommentsShipwrecks in NSW Estuaries, from the Australian National Shipwreck Database (ANSD)
DMR Ferry No. 41 Clyde River, 1km upstream from Nelligen
Press article - from Chris Breen AIMA Shoalhav 71 In 9m of water, ~12-13m from shore. Press Release - detailing information relating to local scuba club's discovery and summary of the condition of the wreck. Owner Department of Main Roads.
Dureenbee 03/08/1942 Batemans Bay, north head RBS; SMH 5/8/1942; RANZ 1937 AIMA Eurobo 1865
Elizabeth 07/11/1839 Batemans Bay, ashore Sydney Gazette 19/11/1868 AIMA Eurobo 1232
Benandra 25/03/1924 MORUYA RIVER Moruya Heads, sandspit near the bar. NMH 8/4/1924; RBS; Sydney. Parsons, R, ' Steamships to the Illawarra' 1991. AIMA Eurobo 1813
Moses Fletcher 30/06/1891 MORUYA RIVER Moruya breakwater SMH 1/2, 2/7, 3/7, 8/7, 14/7/1891; RBS 1/1873 Sydney AIMA Eurobo 830
Mary Ann 27/03/1870 TUROSS RIVER Tuross River mouth SMH 29/3/1870; RBS AIMA Eurobo 1429
Revenge 25/03/1862 Tuross River RBS; Dunn, Gwen 'Shipbuilders of Brisbane Water' 1977 AIMA Eurobo 8
Porpoise 16/05/1866 WAGONGA INLET Wagonga Heads SMH 24/5, 23/5, 15/6/1866; RBS AIMA Eurobo 1500
Catherine 15/05/1851 BERMAGUI RIVER Bermagui River, ashore SMH 29/5, 2/6/1851; RBS AIMA Eurobo 1127 Gale sprang up, forcing the Catherine to anchor. Parted moorings and dropped second anchor. Several large trees washed downstream caught in bows. Abandoned on captain's orders.
1479/R01/V2-App2_V2 23

APPENDIX 3
Other European Heritage Sitesin New South Wales Estuaries

Item Location Estuary Date Comments / References Heritage Database no.
Heritage Listing
BELLINGER RIVERBridge, Wharf, associated structures (former)
Ford Street, Bellingen, NSW 2454
Bellinger River 1315 Heritage Act - s.130 Order ; Gazette Apr 93
MACLEAY RIVER
Kempsey rail bridge over Macleay River
North Coast railway, Kempsey, NSW 2440
Macleay River 1917 The Boundary of the bridge is an area for 20 metres around the bridge and viaduct approaches, including abutments and embankments at the end of Kemp St and the end Railway St to the south and the bridge itself crossing the river. SRA, 1997 (No SRA240).
5012062 Heritage Act - State Heritage Register 01041, Gazette Apr99; Heritage Act - s.170 NSW State agency heritage register.
LAKE INNES
Lake Innes House ruins and environs
The Ruins Way, Port Macquarie, NSW
Lake Innes pre 1850 A corduroy road towards the beach, another corduroy road to the lake, a boathouse by the lake. Connah, 2000; Connah, 1997; Lucas & Partners, 1987; NPWS, 1994; Rheinberger, 1999.
5045031 Heritage Act - State Heritage Register 00997, Gazette Apr99; Heritage Act - s.170 NSW State agency heritage register; REP Gazette Dec94; National Trust of Australia register.
MANNING RIVER
Taree rail bridge over Manning River
North Coast railway, Taree, NSW 2430
Manning River The listing boundary is the area on which the bridge is located including embankments, abutments, supports and track formation for a distance of 20 metres in all directions. note: Assess. Of Signif. Refers to PS Manning, not the bridge. SRA, 1997 (No SRA242).
5012241 Heritage Act - State Heritage Register 01059, Gazette Apr99; Heritage Act - s.170 NSW State agency heritage register.
HUNTER RIVER
Boat Harbour Pilot Station
Wharf Road, Newcastle, NSW 2300
Hunter 11451 Heritage Act - s.130 Order, Gazette Jan 81
Morpeth Bridge over the Hunter River
Northumberland Street, Morpeth, NSW 2321
Hunter 5051380 Heritage Act - State Heritage Register 01476, Gazette 20 Jun 2000; REP Gazette 3 Nov 89; LEP 1993, Gazette 3 Sep 93
Nobbys Lighthouse & Breakwater
Port Hunter, Newcastle, NSW 2300
Hunter 11466 Heritage Act - s.130 Order Gazette Jan 81; REP Gazette Nov 89
LAKE MACQUARIE
Wangi Power Station Complex
Wangi Wangi, NSW 2267
Lake Macquarie officially opened on 7th November 1958
Highest level State heritage Significance for its association with leading the evolution of coalfields. EJE Architecture, 2000; Pacific Power, 1998.
5014146 Heritage Act - State Heritage Register 01014, Gazette Apr99; Heritage Act - s.170 NSW State agency heritage register 79, Gazette Mar98.
HAWKESBURY RIVER
NSW Heritage Office: State Heritage Register and Inventory
Heritage Register
1479/R01/V2-App3(2) 1

Item Location Estuary Date Comments / References Heritage Database no.
Heritage Listing
Hawkesbury River rail bridge
Main Northern railway, Brooklyn, NSW 2083
Hawkesbury River
1889 The listing boundary is the area on which the bridges are located, including the causeway, and includes the supports, abutments, earthworks, abandoned tunnel and cutting, construction site for the bridge and foreshore area on each bank. It also includes the remains of the 1889 bridge piers and abutments.
5012052 Heritage Act - State Heritage Register 01040, Gazette Apr99; Heritage Act - s.170 NSW State agency heritage register.
SYDNEY HARBOUR
Bantry Bay Explosives Depot
Killarney Heights, NSW 2087
Sydney Harbour 5014103 Heritage Act - State Heritage Register 00977
Cable Ferry - Mortlake/Putney
Pellisier Road, Putney, NSW 2112
Sydney Harbour 14052 Heritage Act - s.170 NSW State agency heritage register
Fort Denison Port Jackson, NSW Sydney Harbour 1840-62 Fort Dension was built in stages between 1840 to 1862 and is evidence of the design and changes to harbour defence works and tactics of the colony from 1836 to 1866. It reflects the impact of events and changes to personnel associated with the place including George Barney (the designer), George Gipps, James Gordon and William Denison. Fort Denison is mounted on a rock entirely surrounded by the waters of one of the finest harbours in the world. Its tower, battery and terrace afford a superb urban and marine panorama. It is evidence of the use of techniques of masonry fort construction. It is the only one of its type in Australia. Martello towers are normally freestanding and the combination of tower and bettery is rare. (Kerr 1986:46-48)
5045472 National Trust of Australia register, Register of the National Estate; Heritage Act - State Heritage Register
Goat Island Port Jackson Sydney Harbour 5045143 Register of the National Estate; Heritage Act - State Heritage Register 00989
Manly Wharf West Esplanade, Manly, NSW 2095
Sydney Harbour 1856 first wharf
Together with Circular Quay, the wharf is the only substantial older style ferry wharf surviving in Port Jackson
5051365 State Heritage Reg. 01434
Man O'War Steps Farm Cove Crescent, Sydney, NSW 2000
Sydney Harbour built 1810 The only known remains of Macquarie-era harbour works still in existence in Sydney Harbour, in what appears to be its original configuration, and still in daily use. A valuable relic of the "Old Navy" days when men of war anchored in Farm Cove and when waterman plied on the harbour. Also the source of one of the longest-running bureaucratic correspondences in the history of NSW. (Tranter 1990)
5051356 Heritage Act - State Heritage Register 1432, Gazette 18 Apr 00; Heritage Act - s.170 NSW State agency heritage register 4920021; REP 23, Gazette 5 Jun 90; National Trust of Australia register, Gazette 31 Oct 90; Within a National Trust conservation area, Sydney Harbour LCA , Gazette 24 Jan 83.
Meadowbank rail bridges over Parramatta River
Main Northern railway, Meadowbank/Rhodes, NSW 2114
Sydney Harbour The original Meadowbank bridge is one of the 12 lattice girder bridges built by Whitton in the first major construction phase on NSW railways with Albury it is one of only two such double line structures. It is highly visible and an important part of the history of the Parramatta River.
5012099 State Heritage 01189
Fenwick & Co Boat Store 2-8 Weston Street, Balmain, NSW 2041
Sydney Harbour The site contains the J. Fenwick & Co. Boat Store, retaining walls, sea wall and J Fenwick & Co. Administration Building.
5051346 Heritage Act - State Heritage Register
STA Ferry Maintenance Depot
Waterview Street, Balmain, NSW 2041
Sydney Harbour 8341 Heritage Act - s.170 NSW State agency heritage register
Thames Street Ferry Wharf & Shelter
Thames Street, Balmain, NSW 2041
Sydney Harbour 8753 Register of the National Estate; Heritage Act - s.170 NSW State agency heritage register
1479/R01/V2-App3(2) 2

Item Location Estuary Date Comments / References Heritage Database no.
Heritage Listing
Walsh Bay Wharves 1 to 9 & buildings & bridges
Sydney Harbour The wharves have a strong distinctive character created by the logical use of heavy timber construction and the regular grid layout of piles, columns, beams and infill cladding. (Little, Clarke, Whittaker 1979)
5045067 Heritage Act - State Heritage Register 00559; Gazette 2 Apr 99; Heritage Act - Permanent Conservation Order - former 00559, Gazette 25 Feb 88; REP Gazette 1 Jun 89; National Trust of Australia register, Gazette 15 Sep 76; Within a National Trust conservation area; Register of the National Estate
Waterview Wharf Workshops (Adelaide Steamship Company wharf)
37 Nicholson Street, Balmain, NSW 2041
Sydney Harbour 5045695 National Trust of Australia register; Heritage Act - State Heritage Register
Woolloomooloo Finger Wharf - Berths 6, 7, 8 & 9
Cowper Wharf Road, Woolloomooloo, NSW 2011
Sydney Harbour Woolloomooloo Finger Wharf is off cultural significance for its rarity, scale, construction methods, artefacts of industrial archaeology and diverse history of uses and events. It contains the largest and most distinguished timber wharf building in Sydney Harbour and reflects in its form and contents the history of Woolloomooloo and the principal role of the wool industry in Australia during the nineteenth and early 20th century. (CSHI 3041) The Wharf is important as an example of a timber engineering structure on a scale unparalleled in Australia and exceptional in world terms. It also represents the use of Australian timbers in sizes and quantities which would never be matched in the future and in a situation in which their durability and other properties can be assessed.
5051359 State Heritage Reg. 01437
PORT HACKINGFisheries Research Institute
202 Nicholson Parade, Cronulla, NSW 2230
Port Hacking 1904 FORMER HATCHERY BUILDING: An L-shaped brick building with two wings, located on a flat (benched) area slightly above a boat shed and fish ponds at the western side of Hungry Point. Also Aboriginal Middens. NSW Fisheries, 1997.
5045100 Heritage Act - State Heritage Register 01011, Gazette Apr99; Heritage Act - s.170 NSW State agency heritage register; LEP Dec00.
LAKE WAPENGONess Property (Aboriginal and Chinese Significance)
Reserve Road, Wapengo, NSW 2550
Lake Wapengo The property Ness at Lake Wapengo , located between Bermagui and Tathra on the NSW South Coast, is an area of 160 hectares (396 acres) with major frontage to the South Pacific Ocean, Bithry Inlet, Lake Wapengo and the northern section of Mimosa Rocks National Park.
5045716 Heritage Act - State Heritage Register 00519, Gazette Apr99; Heritage Act - Permanent Conservation Order - former 00519, Gazette Oct87.
PAMBULA LAKE / RIVERYowaka Bridge near Eden
Princes Highway, Eden, NSW 2551
Pambula River and Lake
5051390 Heritage Act - State Heritage Register 01486, Gazette Jun00.
TOWAMBA RIVERDavidson Whaling Station
35km south of, Eden Towamba River 1896 Davidson Whaling Station is located on the southern shore of Twofold Bay, 35km by road south of Eden on Kiah Inlet at the mouth of the Towamba River. NPWS, 1995; (NPWS, Register).
5000659 Heritage Act - State Heritage Register 00984, Gazette Apr99; Heritage Act - s.170 NSW State agency heritage register.
CLARENCE RIVER
Bridge over South Arm (McFarlane Bridge)
Tullymorgan, NSW Clarence R 1990081 LEP, Gazette May 01
Heritage Inventory
1479/R01/V2-App3(2) 3

Item Location Estuary Date Comments / References Heritage Database no.
Heritage Listing
BONVILLE CKRock Pool Bonville Headland,
Sawtell, NSW Bonville Creek Swimming Pool - tidal 1360037 Coffs Harbour City LEP 2000 -
Sch 5 HASTINGS RIVERBallina paddlesteamer wreck; PS Ballina
110m N of eastern end of southern breakwall of Port Macquarie - The Ballina remains inside the entrance channel near the northern breakwall.
Hastings River constructed 1879, sank 109 yrs ago
The paddle wheel and engines are believed to have the potential for providing valuable information on the maritime technology in the 1860s. The site is likely to retain artefacts from the late 19th century, despite the use of explosives shortly after the sinking. Further specialised investigation is required. Loney, 1980; Port Macquarie News, 1989.
1730020 LEP 1993, Register of the National Estate - Interim
Former Pilots boatshed building
79 Clarence St, Port Macquarie 2444
Hastings River Rare surviving example of a government boatshed. Representative of historical boatshed design and style. One of a number of items that collectively illustrates early maritime activities in Port Macquarie. North Coast Regional Heritage Study, 1990: Originally located on the "Village Green" at the end of Horton St, near The Royal Hotel, c 1900. Moved to its current location about 40 years ago. Currently being acquired by the Mid North Coast Maritime Museum Association. Mid North Coast Maritime Museum Association (oral report Dick Glen).
1730022 LEP 1993
Hibbard Slipway Boundary St, Port Macquarie 2444, cnr Narimba Close, Hibbard
Hastings River constructed 1884
(Shipyard consisting of timber slipway to the water.) Formed part of a large sawmilling and industrial complex of the late 19th Century. Reflects the high level of industrial development possible within the economies of the Northern River. Has historical association with this complex and John Hibbard, a prominent citizen. The site has the potential to contribute to the study of industry and communication on the Northern Rivers. Mid North Coast Maritime Museum Association (oral report Glen Dick and Laurie Hoare); National Trust.
1730019 LEP 1993, National Trust of Australia register
Hibbard slipway, comprising timber slipway, engine house
Boundary Street, Hibbard, NSW 2444
Hastings River 5233 Regional Environmental Plan 1994
Pedestrian Suspension Bridge
Rawdon Island 2446 Hastings 1930 Rawdon Island pedestrian suspension bridge is an unusual type of bridge construction using a simple light weight design. Illustrates the significance of river crossings to settlement in the lower Hastings. Together with the school and post office forms a significant group of items that demonstrate aspects of life in the area. Forms part of Rawdon Island school group HS0144. See also Items HS0146.
1730145 LEP 1993
Camden Head Pilot Station
Camden Head Hastings 1907 The pilot station is a rare surviving and intact group of related buildings providing physical evidence of the living and working conditions of the pilot and boatmen. The group illustrates the importance of maintenance activities to the local community. Camden Head Pilot Station comprises the following structures: 1. Pilot's Residence. Weatherboard and corrugated fibro roof, single storey brick footings. 2. Double garage or boathouse, weatherboard 3. Garage or boathouse, corrugated. 4. Shed, weatherboard, corrugated iron. 5. Concrete shelter, partly sunk into hillslope. Plantings include Norfolk Island Pines. Part of the Camden Haven Maritime Group. See HS0112. See also Items HS0113, HS0115. Suters, 1991 (HS0114).
1730114 LEP 1993
Pilots Boatshed (former) 79 Clarence Street, Port Macquarie, NSW 2444
Hastings 5352 REP 1994
1479/R01/V2-App3(2) 4

Item Location Estuary Date Comments / References Heritage Database no.
Heritage Listing
Hastings River Railway Bridge
Wauchope 2446 Hastings River 1915 The Hastings River Railway Bridge is representative of the light engineering practice and technology of the North Coast Railway. It makes a contribution to the understanding of the development of communications within the Northern Rivers Region. Part of Wauchope Railway Station Group. HS0099 See also items HS0103 and HS0104. In conjunction with other items associated with the railway it reflects a theme which was important to the emergence of Wauchope as an important service centre. Port Macquarie News, 1916; Suters, 1991 (HS0089).
1730089 LEP 1993
The Cross navigational marker
Port Macquarie 2444 Hastings River This area has been known as the Cross for many years, however, the age of the current marker is not known
The site has included navigational markers from an early date and illustrates early navigational technology. It is an important and well known local landmark Reinforces interpretation of the importance of maritime activities in the evaluation of Port Macquarie. Port Macquarie News, 1989; Suters, 1991 (HS0082).
1730082 LEP 1993
Training walls and breakwalls
Mouth of Hastings River at PM, Port Macquarie 2444
Hastings River 1897 These training walls are representative of the large government investment in improving coastal and riverine navigation on most of the major Northern Rivers, and indicate the technological difficulties of navigation as well as massive harbour works. Hastings District Historical Society (oral report); Suters, 1991 (HS0060).
1730060 LEP 1993
CAMDEN HAVEN RIVERCamden Haven River Rail Bridge
Off Graham Street, Kendall
ACROSS CAMDEN HAVEN RIVER
1915 The Camden Haven River Railway Bridge is representative of the light engineering practice and technology of the North Coast Railway. It makes a contribution to the understanding of the development of communications within the Northern Rivers Region. It illustrates the importance of the railway to the economy of Kendall. Suters, 1991 (HS0120).
1730120 LEP 1993
Camden Haven River Training Walls or Breakwaters
Camden Head, North Haven
Camden Haven River
1898 These training walls are representative of the large investment in improving coastal and riverine navigation on most of the major Northern Rivers, and indicates the technological difficulties of navigation as well as massive harbour works. Part of Camden Haven Maritime Group. HS0112. See also items HS0114, HS0115. Camden Haven Historical Society; Suters, 1991 (HS0113).
1730113 LEP 1993
MANNING RIVER
Dairy Factory & Wharf (former)
Mitchells Island, NSW 2430
Manning 4959 LEP 1995, Gazette Aug 95.
Lime Kiln Wharf (former) Nelson Street, Taree, NSW 2430
Manning 4990 & 5012 LEP 1995, Gazette Aug 95.
Martin Bridge Pacific Highway, Taree, NSW 2430
Manning 4978 LEP 1995, Gazette Aug 95.
Wharf and Punt sites Croki Road, Croki, NSW 2430
Manning 4979 LEP 1995, Gazette Aug 95.
1479/R01/V2-App3(2) 5

Item Location Estuary Date Comments / References Heritage Database no.
Heritage Listing
Wreck of vessel Manning (PS Manning)
River Street, Taree, NSW 2430
Manning constructed 1878
The side paddle steamer Manning (official number 74962) was constructed of iron (riveted) with timber upper works. No masts. The vessel was 109.5 feet long, 18.9 feet wide and 5.9 feet deep. It had a tonnage of 89 tonnes and 56 tonnes net. The vessel was powered with a high pressure steam engine generating 30 hp. (Heritage Branch Dept of Planning, Sydney, 1993). Baker, 1999; Smith, 1993.
4989 LEP 1995, Gazette Aug 95.
PORT STEPHENS
Allworth Wharf remains Allworth, NSW 2425 Upper Port Stephens (Karuah River)
4592 LEP 1996
Booral Wharf Karuah River
Booral, NSW 2425 Upper Port Stephens (Karuah River)
4587 REP 1989, LEP 1996
Carrington Boat Harbour & Lime Kiln
Cock Renoyo Point, Carrington, NSW 2324
Port Stephens (Great Lakes)
4610 REP 1989, LEP 1996
HUNTER RIVER
Boat Harbour Wharf Road, Newcastle, NSW 2300
Hunter 11934 REP Gazette NOV 89
Hexham Bridge Pacific Highway, Hexham, NSW 2322
Hunter 11526 REP Gazette NOV 89; LEP 1987
Lee Wharf No 1 - Building A
Lee Wharf Road, Newcastle, NSW 2300
Hunter 11768 REP Gazette NOV 89; LEP 1987
Lee Wharf No 2 - Building C
Lee Wharf Road, Newcastle, NSW 2300
Hunter 11931 REP Gazette NOV 89; LEP Gazette Jul 92
Nobbys Lighthouse, headland, breakwater
41 Nobbys Road, Newcastle East, NSW 2300
Hunter 11645 LEP 1987
Original Timber Wharves Ingall Street, Mayfield North, NSW 2304
Hunter 11549 LEP 1987
Stone Boat Harbour 49 Wharf Road, Newcastle East, NSW 2300
Hunter 11613 LEP 1987
Hinton Bridge - Hunter River
Patterson Street, Hinton, NSW
Upper Hunter 2280010 LEP Sch2, Gazette Dec 00.
LAKE MACQUARIE
Power Station on Lake Macquarie
Vales Point Lake Macquarie 20377 LEP 1991
HAWESBURY RIVER
HMAS Parramatta wreck Cascade Gully, Hawkesbury River
Hawkesbury 4443 REP Gazette Oct 97; LEP 00020
Pylons, Old Hawkesbury River Railway Bridge
Hawkesbury 4438 LEP 00020
1479/R01/V2-App3(2) 6

Item Location Estuary Date Comments / References Heritage Database no.
Heritage Listing
Cable Ferry - Wisemans Ferry
Wisemans Ferry, NSW 2775
Hawkesbury 4436 REP Gazette Oct 97; LEP 00020
Ballast heap - Berowra Creek & Murramurra Creek
River Settlements Upper Hawkesbury
6743 LEP 1994, Gazette Sep 89; LEP Gazette Jul 94; LEP 1994, Gazette Jul 94.
Bennets Bay - Jetty River Settlements Upper Hawkesbury
6744 LEP 1994, Gazette Jul 94
Boat shed Berowra Waters Road, Berowra Waters, NSW 2082
Hawkesbury 6307 LEP 1994, Gazette Jul 94
Bradleys Beach Grantham Crescent, Dangar Island, NSW 2083
Hawkesbury 6618 LEP 1994, Gazette Jul 94
Brown's boatshed James Road, Brooklyn, NSW 2083
Hawkesbury 6568 LEP 1994, Gazette Jul 94
Cable Ferry & Bay Road Berowra Waters Road, Berowra Waters, NSW 2082
Hawkesbury 6305 LEP 1994, Gazette Jul 94
Cable Ferry & Berowra Waters Road
Bay Road, Berowra Waters, NSW 2082
Hawkesbury 6306 LEP 1994, Gazette Jul 94
Cable Ferry - Berowra Waters
Berowra Waters, NSW 2082
Hawkesbury 6227 LEP 00020, Gazette Sep 89
Cable Ferry waterway River Road, Wisemans Ferry, NSW 2775
6977 LEP 1994, Gazette Jul 94
Northern foreshore, 1889 railway bridge, seawall, wharf, trees
Dangar Island, NSW 2083
Hawkesbury 6608 LEP 1994, Gazette Jul 94
Railway bridge piers, pylon & plaque
Long Island Hawkesbury constructed 1889
6592 LEP 1994, Gazette Jul 94
Railway bridge, memorial & construction dock
Long Island Hawkesbury constructed 1946
6581 LEP 1994, Gazette Jul 94
SYDNEY HARBOUR
Alexandra Street Wharf Alexandra Street, Hunters Hill, NSW 2110
Sydney Harbour 7104 LEP 00014
Athol Gardens Dance Hall and Wharf
Ashton Park, Bradleys Head, NSW 2088
Sydney Harbour 10697 REP 00022
Balmoral Beach Heritage Conservation Area
Balmoral, NSW 2088 Sydney Harbour 10759 LEP 00022
Balmoral Beach, Rocky Point
Balmoral, NSW 2088 Sydney Harbour 10685 LEP 00022
Bay Street Wharf Bay Street, Greenwich, NSW 2065
Sydney Harbour 8493 LEP 1987
1479/R01/V2-App3(2) 7

Item Location Estuary Date Comments / References Heritage Database no.
Heritage Listing
Boat Sheds & slips O'Connell Street, Greenwich, NSW 2065
Sydney Harbour 8331 REP 00023
Boatshed 11a Bayview Street, McMahons Point, NSW 2060
Sydney Harbour 12298 LEP 1989
Boatshed, wharfage & slipway
23a King George Street, McMahons Point, NSW 2060
Sydney Harbour 12414 REP 00023
Boronia Park Walk, Mary St. Wharf remains
Bonnefin Road, Hunters Hill, NSW 2110
Sydney Harbour 7088 LEP 00014
Brandville Wharf William Street, Henley, NSW 2111
Sydney Harbour 7478 LEP 00014
Careening Cove slipway Bradley Avenue, Kirribilli, NSW 2061
Sydney Harbour 12430 REP 00023
Cargo Sheds, land & waterway around wharves
Cowper Wharf Roadway, Woolloomooloo, NSW 2011
Sydney Harbour 16729 REP
Clark Island Port Jackson Sydney Harbour 16734 REP 00023Clifton Gardens Wharf and Pool
Clifton Gardens, NSW 2088
Sydney Harbour 10866 REP 00023
Clyde Carlingford Rail Bridge
1b adj Grand Avenue, Rosehill, NSW 2142
Sydney Harbour While it is a relatively small bridge the brick detailing makes it one of the more elaborate of the early crossings and it forms an attractive historical feature of the river. Possesses the ability to demonstrate bridge building technology of the time.
2240234 LEP 234
Coal Loader, Quarantine Station
Balls Head Bay Sydney Harbour 12088 LEP 1989
Corner Beach Reserve Mosman, NSW 2088 Sydney Harbour 10717 LEP 00022Darling Street Wharf Site Darling Street,
Balmain, NSW 2041Sydney Harbour 8339 REP 00023
De Burghs Bridge Lane Cove Road, Macquarie Park
Sydney Harbour 14050 LEP
Dorman Long Wharf - Luna Park (former)
Milsons Point, NSW 2061
Sydney Harbour 12444 REP 00023
Ermington Wharf 114 Wharf Road, Ermington, NSW 2115
Sydney Harbour Demonstrates the importance of the river as an early transport route Site possesses potential to contribute to an understanding of traditional wharf construction techniques.
2240611 LEP 611
Ferry pier Military Road, Watsons Bay, NSW 2030
Sydney Harbour 19732 REP 00023
Ferry Wharf Bradleys Head Road, Mosman, NSW 2088
Sydney Harbour 10694 LEP 00022
Ferry Wharf (former) The Spit, NSW 2088 Sydney Harbour 10845 LEP 00022
Ferry Wharf, Curruaghbeena Point (former)
Musgrave Street, Mosman, NSW 2088
Sydney Harbour 10818 LEP 00022
1479/R01/V2-App3(2) 8
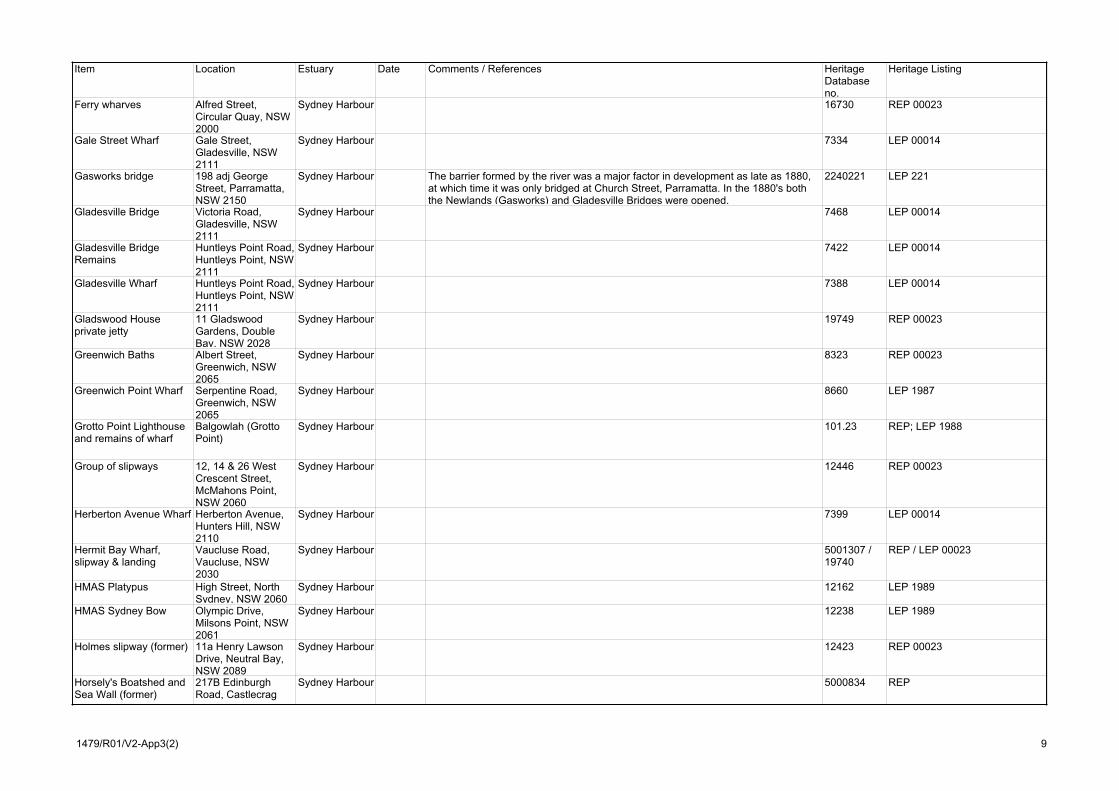
Item Location Estuary Date Comments / References Heritage Database no.
Heritage Listing
Ferry wharves Alfred Street, Circular Quay, NSW 2000
Sydney Harbour 16730 REP 00023
Gale Street Wharf Gale Street, Gladesville, NSW 2111
Sydney Harbour 7334 LEP 00014
Gasworks bridge 198 adj George Street, Parramatta, NSW 2150
Sydney Harbour The barrier formed by the river was a major factor in development as late as 1880, at which time it was only bridged at Church Street, Parramatta. In the 1880's both the Newlands (Gasworks) and Gladesville Bridges were opened.
2240221 LEP 221
Gladesville Bridge Victoria Road, Gladesville, NSW 2111
Sydney Harbour 7468 LEP 00014
Gladesville Bridge Remains
Huntleys Point Road, Huntleys Point, NSW 2111
Sydney Harbour 7422 LEP 00014
Gladesville Wharf Huntleys Point Road, Huntleys Point, NSW 2111
Sydney Harbour 7388 LEP 00014
Gladswood House private jetty
11 Gladswood Gardens, Double Bay, NSW 2028
Sydney Harbour 19749 REP 00023
Greenwich Baths Albert Street, Greenwich, NSW 2065
Sydney Harbour 8323 REP 00023
Greenwich Point Wharf Serpentine Road, Greenwich, NSW 2065
Sydney Harbour 8660 LEP 1987
Grotto Point Lighthouse and remains of wharf
Balgowlah (Grotto Point)
Sydney Harbour 101.23 REP; LEP 1988
Group of slipways 12, 14 & 26 West Crescent Street, McMahons Point, NSW 2060
Sydney Harbour 12446 REP 00023
Herberton Avenue Wharf Herberton Avenue, Hunters Hill, NSW 2110
Sydney Harbour 7399 LEP 00014
Hermit Bay Wharf, slipway & landing
Vaucluse Road, Vaucluse, NSW 2030
Sydney Harbour 5001307 / 19740
REP / LEP 00023
HMAS Platypus High Street, North Sydney, NSW 2060
Sydney Harbour 12162 LEP 1989
HMAS Sydney Bow Olympic Drive, Milsons Point, NSW 2061
Sydney Harbour 12238 LEP 1989
Holmes slipway (former) 11a Henry Lawson Drive, Neutral Bay, NSW 2089
Sydney Harbour 12423 REP 00023
Horsely's Boatshed and Sea Wall (former)
217B Edinburgh Road, Castlecrag
Sydney Harbour 5000834 REP
1479/R01/V2-App3(2) 9

Item Location Estuary Date Comments / References Heritage Database no.
Heritage Listing
House, formerly boatshed
31 Bonnefin Road, Hunters Hill, NSW 2110
Sydney Harbour 7103 LEP 00014
Hunters Hill Wharf and Waiting Shed
Ferry Street, Hunters Hill, NSW 2110
Sydney Harbour 7355 LEP 00014
Huntleys Point Wharf Side
Huntleys Point Road, Huntleys Point, NSW 2111
Sydney Harbour 7425 LEP 00014
Itata and other wrecks Salt Pan Creek, Middle Harbour
Sydney Harbour 5001345 REP
Jubilee Floating Dock Site
Datchett Street, Balmain, NSW 2041
Sydney Harbour 8340 REP 00023
Lavender Bay Ferry Wharf
Railway Avenue, McMahons Point, NSW 2060
Sydney Harbour 12275 REP; LEP 1989
Lavender Bay waterfront relics
Lavender Bay, NSW 2060
Sydney Harbour 12418 REP 00023
Little Manly Cove Pool Stuart Street, Manly, NSW 2095
Sydney Harbour 10199 REP 00023
Longueville Wharf Stuart Street, Longueville, NSW 2066
Sydney Harbour 8652 LEP 1987
Lucretia Baths Dunois Street, Longueville, NSW 2066
Sydney Harbour 8534 LEP 1987
Manly Ferry Wharf The Esplanade, Manly, NSW 2095
Sydney Harbour 5000823 REP
Manly Rowing & Sailing Club
East Esplanade, Manly, NSW 2095
Sydney Harbour 10043 REP 00023; LEP 1988
Marina Boatshed, Mosman Rowing Club
Mosman, NSW 2088 Sydney Harbour 10661 LEP 00022
Mary Street Wharf north end (former)
Park Road, Hunters Hill, NSW 2110
Sydney Harbour 7198 LEP 00014
Middle Harbour submarine syphon
Holmes Avenue, Clontarf, NSW 2093
Sydney Harbour 10197 REP 00023
Morts Dry Dock Woolwich Dock
Clarke Road, Woolwich, NSW 2110
Sydney Harbour 7112 LEP 00014
Mosman Bay sea wall, Mosman Bay
Mosman, NSW 2088 Sydney Harbour 10868 REP 00023
Mosman Rowing Club, Mosman Bay
Mosman, NSW 2088 Sydney Harbour 10865 REP 00023
Mount Street Wharf Mount Street, Hunters Hill, NSW 2110
Sydney Harbour 7206 LEP 00014
Naval Warehouse Wharf, Darling Island Sydney Harbour 5000989 REP 00098Navigation light tower, Eastern Channel
Port Jackson Sydney Harbour 16741 REP 00023
1479/R01/V2-App3(2) 10

Item Location Estuary Date Comments / References Heritage Database no.
Heritage Listing
Navigation light tower, off Shark Island
Port Jackson Sydney Harbour 16732 REP 00023
Navigation Light Tower, Western Channel
Georges Head, NSW 2088
Sydney Harbour 5000825 REP
Neutral Bay Wharf Group
Hayes Street, Neutral Bay, NSW 2089
Sydney Harbour 12447 REP 00023
Nielson Wharf remains (former)
Steel Point, Vaucluse, NSW 2030
Sydney Harbour 19742 REP 00023
Northwood Wharf Northwood Road, Northwood, NSW 2066
Sydney Harbour 8412 LEP 1987
Parsley Bay Ferry Wharf The Crescent, Vaucluse, NSW 2030
Sydney Harbour 19743 REP 00023
Paton's slipways Willoughby Street, Kirribilli, NSW 2061
Sydney Harbour 12441 REP 00023
Pearl Bay Pleasure Grounds
The Spit, NSW 2088 Sydney Harbour 10810 LEP 00022
Pilkington's Bridge at Tarban Creek
Batemans Road, Gladesville, NSW 2111
Sydney Harbour 7069 LEP 00014
Punt Ramp Dick Street, Hunters Hill, NSW 2110
Sydney Harbour 7097 LEP 00014
Punt Road Wharf Bedlam Point Wharf
Punt Road, Gladesville, NSW 2111
Sydney Harbour 7300 LEP 00014
Quarantine Station Boat Depot (former)
Balls Head Drive, Waverton, NSW 2060
Sydney Harbour 12420 REP 00023
Queens Wharf Reserve and stone wall
198 George Street, Parramatta, NSW 2150
Sydney Harbour built 1834 The site of the Queens wharf, and stone walls along the banks of the Parramatta River.
2240219 LEP
Remains of bath house & site of jetty
Darling Point Road, Darling Point, NSW 2027
Sydney Harbour 19746 REP 00023
Remains of Baths Hunters Hill, NSW 2110
Sydney Harbour 7076 LEP 00014
Remains of Ben Boyd Whaling Station
Ben Boyd Road, Neutral Bay, NSW 2089
Sydney Harbour 12432 REP 00023
Remains of Figtree Bridge
Joubert Street, Hunters Hill, NSW 2110
Sydney Harbour 7378 LEP 00014
Remains of former Grant Wharf
Spit Road, Mosman, NSW 2088
Sydney Harbour 10870 REP 00023
Remains of Former Tasmanian Ferry Terminal
Yeend Street, Balmain, NSW 2041
Sydney Harbour 8336 REP 00023
1479/R01/V2-App3(2) 11

Item Location Estuary Date Comments / References Heritage Database no.
Heritage Listing
Remains of Greenwich Point Wharf
21 George Street, Greenwich, NSW 2065
Sydney Harbour 8328 REP 00023
Remains of H.C. Press picnic ground & baths
Cammeray Road, Castle Cove, NSW 2069
Sydney Harbour 17865 LEP 00023
Remains of Manly public baths
East Esplanade, Manly, NSW 2095
Sydney Harbour 10204 REP 00023
Remains of Milsons Point ferry wharf and tram turning circle
Olympic Drive, Milsons Point, NSW 2061
Sydney Harbour 12437 REP 00023
Remains of Morts Dock, foreshore of park
Balmain, NSW 2041 Sydney Harbour 8327 REP 00023
Remains of Municipal Baths
241 Edinburgh Road, Castlecrag, NSW 2068
Sydney Harbour 17866 LEP 00023
Remains of Municipal Baths, structures and access steps
241 Edinburgh Road, Castlecrag
Sydney Harbour 5000837 REP
Remains of Neptune Engineering Slipway
King George Street, McMahons Point, NSW 2060
Sydney Harbour 12445 REP 00023
Remains of old ferry wharf
Musgrave Street, Mosman, NSW 2088
Sydney Harbour 10869 REP 00023
Remains of original Cremorne Point wharf
Cremorne, NSW 2090
Sydney Harbour 12434 REP 00023
Remains of Roseville Baths
99 Babbage Road, Roseville, NSW 2069
Sydney Harbour 7920 REP 00023
Remains of sea wall, former railway marshalling yards
Milsons Point, NSW 2061
Sydney Harbour 12452 REP 00023
Remains of Sydney ferries lay-up wharf
McMahons Point, NSW 2060
Sydney Harbour 12451 REP 00023
Remains of tram terminus & wharf for tram
Avona Crescent, Seaforth, NSW 2092
Sydney Harbour 10195 REP 00023
Remains of Vaucluse Point ferry wharf
83 Fitzwilliam Street, Vaucluse, NSW 2030
Sydney Harbour 19748 REP 00023
Remains of vehicular ferry ramp
Avona Crescent, Seaforth, NSW 2092
Sydney Harbour 10202 REP 00023
Remains of Western Rose Bay ferry wharf
New South Head Road, Rose Bay, NSW 2029
Sydney Harbour 19744 REP 00023
Remains of wharf, baths & waterfront relics
Tivoli Pier, Thorne's Wharf, Clarement Wharf
Sydney Harbour 19747 REP 00023
Remnant natural bushland & baths
Seaforth, NSW 2092 Sydney Harbour 10062 LEP 1988
1479/R01/V2-App3(2) 12

Item Location Estuary Date Comments / References Heritage Database no.
Heritage Listing
Riverglade Sandstone Seawall
Victoria Road, Huntleys Point, NSW 2111
Sydney Harbour 7553 LEP 0018
Riverglade Weir on Tarban Creek
Victoria Road, Huntleys Point, NSW 2111
Sydney Harbour 7550 LEP 0018
Rose Farm Wharf 1 Spurway Street (off), Ermington, NSW 2115
Sydney Harbour Demonstrates the importance of the river as an early transport route Site possesses potential to contribute to an understanding of traditional wharf construction techniques.
2240528 LEP 528
Rowntree's Floating Dock Site
The Avenue cnr Hart St, Balmain, NSW 2041
Sydney Harbour 8332 REP 00023
Ryde Bridge Church Street, Ryde, NSW 2112
Sydney Harbour 14049 LEP
Sailors Bay boatshed Clive Park, Northbridge, NSW 2063
Sydney Harbour 5001305 REP
Sea wall, boundary of Luna Park
Milsons Point, NSW 2061
Sydney Harbour 12443 REP 00023
Shark Island Port Jackson Sydney Harbour 16733 REP 00023
Ship building and repair works
Munro Street, McMahons Point, NSW 2060
Sydney Harbour 12442 REP 00023
Silverwater Bridge Silverwater Road, Ermington, NSW 2115
Sydney Harbour opened 1962
Reinforced concrete box girder three span bridge, built across Parramatta River to carry road traffic. Two lanes of traffic in each direction.
2240490 LEP 490
Site & remains of Blues Point Ferry wharves (Blues Point Vehicular Ferry Dock)
Blues Point Road, McMahons Point, NSW 2060
Sydney Harbour 12449 REP 00023
Site & remains of Brightside cargo wharf
Stuart Street, Manly, NSW 2095
Sydney Harbour 10200 REP 00023
Site & remains of early wharfage
Rockley Street, Castlecrag, NSW 2068
Sydney Harbour 17862 LEP 00023
Site & remains of ferry wharf
Yeend Street, Balmain, NSW 2041
Sydney Harbour 8322 REP 00023
Site & remains of harbourside pool & steps
Stuart Street, Manly, NSW 2095
Sydney Harbour 10198 REP 00023
Site & remains of Manly Steamship Company
Kurraba Road, Neutral Bay, NSW 2089
Sydney Harbour 12413 REP 00023
Site & remains of Port Jackson & Manly Steamship Co. depot
Kurraba Road, Neutral Bay, NSW 2089
Sydney Harbour 12415 REP 00023
Site & remains of wharfage, Fig Tree Point
Hallstrom Close, Northbridge, NSW 2063
Sydney Harbour 17868 / 5000830
LEP 00023 / REP
Site and remains of early wharfage (Castlecrag Marina)
Rockley Street, Castlecrag
Sydney Harbour 5000835 REP
1479/R01/V2-App3(2) 13

Item Location Estuary Date Comments / References Heritage Database no.
Heritage Listing
Site of Cavill's Baths Lavender Bay, NSW 2060
Sydney Harbour 12411 REP 00023
Site of Figtree Wharf and Boatshed
Joubert Street, Hunters Hill, NSW 2110
Sydney Harbour 7386 LEP 00014
Site of former Jeffrey Street Ferry Wharf
Jeffrey Street, Kirribilli, NSW 2061
Sydney Harbour 12424 REP 00023
Site of former Rose Bay Flying Boat Base
Lyne Park, Rose Bay, NSW 2029
Sydney Harbour 19753 REP 00023
Site of Garrick's Wharf Crescent Street, Hunters Hill, NSW 2110
Sydney Harbour 7107 LEP 00014
Site of Ithaca Road ferry wharf
Ithaca Road, Elizabeth Bay, NSW 2011
Sydney Harbour 14757 REP 00023
Site of Manly Fun Pier (Manly Cargo Wharf )
East Esplanade, Manly, NSW 2095
Sydney Harbour DEMOLISHED 10042 REP 00023; LEP 1988
Site of McMahons Point ferry wharf
McMahons Point, NSW 2060
Sydney Harbour 12429 REP 00023
Site of Mosman Ferry Wharf
Avenue Road, Mosman, NSW 2088
Sydney Harbour 10864 REP 00023
Site of Old Cremorne Wharf
Green Street, Cremorne, NSW 2090
Sydney Harbour 12412 REP 00023
Site of Public Baths, Lyne Park
Rose Bay, NSW 2029
Sydney Harbour 19757 REP 00023
Site of Public Wharf now occupied by new
Bay Street, Double Bay, NSW 2028
Sydney Harbour 19737 REP 00023
Site of Village Point Wharf
Wharf Road, Watsons Bay, NSW 2030
Sydney Harbour 19738 REP 00023
Site of wharf Wingadal Place, Point Piper, NSW 2027
Sydney Harbour 19739 REP 00023
Site of Wharf Margaret Street, Woolwich, NSW 2110
Sydney Harbour 7330 LEP 00014
Spurway Street Wharf 1 Spurway Street (end), Ermington, NSW 2115
Sydney Harbour built c. 1877
Wharf constructed of stone walls and earth infill. The upper courses and the earthen infill are missing, and the remaining stones have been disturbed.
2240527 LEP 527
Stannard Bros. Launch Service Depot
19 Wharf Road, Balmain, NSW 2041
Sydney Harbour 8335 REP 00023
Stone Walls near wharf nos. 8,9,10,11
Ferry Street, Hunters Hill, NSW 2110
Sydney Harbour 7335 LEP 00014
Stone Wharf Bradley's Head, Mosman
Sydney Harbour 5000826 REP
Stone wharf - National Park
Bradleys Head Road, Mosman, NSW 2088
Sydney Harbour 10862 REP 00023
1479/R01/V2-App3(2) 14

Item Location Estuary Date Comments / References Heritage Database no.
Heritage Listing
Sydney Amateur Sailing Club
Green Street, Cremorne, NSW 2090
Sydney Harbour 12433 REP 00023
Tambourine Bay Baths Tambourine Bay Road, Riverview, NSW 2066
Sydney Harbour 8704 LEP 1987
Tarban Creek Dam Hunters Hill, NSW 2110
Sydney Harbour 7286 LEP 00014
The Explosives Wharf Spit Road, Mosman, NSW 2088
Sydney Harbour 10871 REP 00023
The Spit Seaforth, NSW 2092 Sydney Harbour 10064 LEP 1988
The Spit Bridge Seaforth, NSW 2092 Sydney Harbour 10065 LEP 1988
Tram loop at end by ferry wharf (former)
Bradleys Head Road, Mosman, NSW 2088
Sydney Harbour 10714 LEP 00022
Valentia Street Wharf & Waiting Shed
Valentia Street, Woolwich, NSW 2110
Sydney Harbour 7258 LEP 00014
Vaucluse Baths 68 Wentworth Road, Vaucluse, NSW 2030
Sydney Harbour 19745 REP 00023
Waterfront Industries Berrys Bay Sydney Harbour 12089 LEP 1989Wharf Ashton Park,
Bradleys Head, NSW 2088
Sydney Harbour 10776 LEP 00022
Wharf Wharf Road, Longueville, NSW 2066
Sydney Harbour 8707 LEP 1987
Wharf remains Bradleys Head Road, Mosman, NSW 2088
Sydney Harbour 10867 REP 00023
Wharf remains Ady Street Nth End, Hunters Hill, NSW 2110
Sydney Harbour 7141 LEP 00014
Wharf Site De Milhau Road, Hunters Hill, NSW 2110
Sydney Harbour 7135 LEP 00014
Wharf Site Princes Street, Hunters Hill, NSW 2110
Sydney Harbour 7302 LEP 00014
Wharf Site and Steps Huntleys Point Road, Huntleys Point, NSW 2111
Sydney Harbour 7426 LEP 00014
Wharf Site north end Mount Street, Hunters Hill, NSW 2110
Sydney Harbour 7204 LEP 00014
1479/R01/V2-App3(2) 15

Item Location Estuary Date Comments / References Heritage Database no.
Heritage Listing
Wharves and Sheds, Wharf 19, 20, 21
Jones Bay Road, Pyrmont, NSW 2009
Sydney Harbour 16669 REP 00099
Willis Road wharf Willis Road, Castle Cove, NSW 2069
Sydney Harbour 17867 / 5000832
LEP 00023 / REP
Wollstonecraft Wharf King Street, Wollstonecraft, NSW 2065
Sydney Harbour 12367 LEP 1989
Woodleys Slipway & Shipyard
Balls Head Road, Waverton, NSW 2060
Sydney Harbour 12410 REP 00023
Wreck of MSB Hopper Barge
Port Jackson Sydney Harbour 16749 REP 00023
BOTANY BAYBotany BayBare Island Fort and Causeway
La Perouse Peninsula, NSW
2310297 Randwick Local Environmental Plan 1998 - Sch3
Bath walls Gunnamatta Road (end of street), Woolooware, NSW 2230
Botany Bay Category: Breakwater 2440043 LEP Gazette Dec 00
Boat shed 72-74 Ilma Avenue, Kangaroo Point, NSW 2224
Botany Bay 2440035 LEP Gazette Dec 00
Boat shed 1 Bermuda Place, Woolooware, NSW 2230
Botany Bay 2440041 LEP Gazette Dec 00
Boat shed 18 Rutherford Avenue, Woolooware, NSW 2230
Botany Bay 2440045 LEP Gazette Dec 00
Boat shed 22 Rutherford Avenue, Woolooware, NSW 2230
Botany Bay 2440046 LEP Gazette Dec 00
Boat shed 224 Woolooware Road South, Woolooware, NSW 2230
Botany Bay 2440047 LEP Gazette Dec 00
Boatshed 41 Mirral Road, Caringbah, NSW
Botany Bay 2440083 LEP Gazette Dec 00
Boatshed 359 Willarong Road South, Caringbah, NSW
Botany Bay 2440087 LEP Gazette Dec 00
Boatshed and Cottages 27 Carina Road, Oyster Bay, NSW 2225
Botany Bay 2440037 LEP Gazette Dec 00
Boatshed and House 9 Ilma Avenue, Kangaroo Point, NSW 2224
Botany Bay 2440031 LEP Gazette Dec 00
1479/R01/V2-App3(2) 16

Item Location Estuary Date Comments / References Heritage Database no.
Heritage Listing
Boatshed And Stone Walls
432 Willarong Road, Caringbah, NSW 2229
Botany Bay 2440005 LEP Gazette Dec 00
Boatshed and Wall 6-8 Ilma Avenue, Kangaroo Point, NSW 2224
Botany Bay 2440034 LEP Gazette Dec 00
Boatshed and Wall (Duplicate)
6-8 Ilma Avenue, Kangaroo Point, NSW 2224
Botany Bay 2440032 LEP Gazette Dec 00
Boatshed, house, wharf and stone waterfront
119-121 Fowler Road, Illawong, NSW 2234
Botany Bay 2440026 LEP Gazette Dec 00
Boatshed/ House (Attwells Boat Brokerage)
321-323 Woolooware Road South, Woolooware, NSW 2230
Botany Bay 2440050 LEP Gazette Dec 00
Boatshed/Dwelling and Swimming enclosure
541 Willarong Road, Caringbah, NSW 2229
Botany Bay 2440006 LEP Gazette Dec 00
Boatshed/house 255a Woolooware Road South, Woolooware, NSW 2230
Botany Bay 2440048 LEP Gazette Dec 00
Boatshed/House 295 Woolooware South Road, Woolooware, NSW 2230
Botany Bay 2440049 LEP Gazette Dec 00
Boatsheds (group) 2, 2c and 11 Hazel Place, Woolooware, NSW 2230
Botany Bay 2440044 LEP Gazette Dec 00
Botany Bay National Park Kurnell Historic Site
Kurnell Peninsula, NSW 2231
Botany Bay The place of the first known landing by Europeans on the East Coast of Australia is within the site. It also has associations with early studies of Australia's flora and
14995 REP L015-S, Gazette Feb 98
Captain Cook Bridge (1965) and southern approach
Taren Point Road, Taren Point, NSW
Botany Bay 2440256 LEP Gazette Dec 00
Como Railway Bridge Como, NSW Railway Bridge/ Viaduct 2440090 LEP Gazette Dec 00
Cottage, Boatshed and Jetty
509 Willarong Road South, Caringbah, NSW
Botany Bay 2440088 LEP Gazette Dec 00
Derwent and Drake Oyster Farm
Wyong Street, Oatley (Neverfail Bay), NSW 2223
5000790 LEP
Foreshore House, Boatshed and Stone
4 Bignell Street, Illawong, NSW 2234
2440020 LEP Gazette Dec 00
House and Boatshed 69 Fowler Road, Illawong, NSW 2234
2440024 & 2440033
LEP Gazette Dec 00
House, Ferry House, Boatshed and Jetty
167 Murralin Lane, Sylvania, NSW
Botany Bay 2440249 LEP Gazette Dec 00
1479/R01/V2-App3(2) 17

Item Location Estuary Date Comments / References Heritage Database no.
Heritage Listing
Houses and Boatsheds 60, 64,66,68 &72 Bignell Street, Illawong, NSW 2234
Botany Bay 2440023 LEP Gazette Dec 00
Jetty and Walling 35 Harrow Street, Sylvania, NSW 2224
Botany Bay 2440040 LEP Gazette Dec 00
Sea wall 77-79 Fowler Road, Illawong, NSW 2234
2440025 LEP Gazette Dec 00
Stone Boatshed 7-13 Bignell Street, Illawong, NSW 2234
2440021 LEP Gazette Dec 00
Stone boatshed and Seawall
105 Prince Edward Park Road, Woronora, NSW 2232
Upper Botany Bay (Woronora R)
2440053 LEP Gazette Dec 00
Stone House, boatshed and carport
201 Prince Edward Park Road, Woronora, NSW 2232
Upper Botany Bay (Woronora R)
2440054 LEP Gazette Dec 00
Stone Jetty Bignell Street, Illawong, NSW 2234
2440019 LEP Gazette Dec 00
Stone Wharf Old Ferry Road, Illawong, NSW 2234
2440029 LEP Gazette Dec 00
Sylvania Waters Canal Development
Sylvania Waters, NSW
Category: Water Supply Canal 2440255 LEP Gazette Dec 00
Tom Ugly's Bridge Georges River, Tom Ugly's Point, NSW 2221
5000748 LEP
Tom Ugly's Bridge (1987)
Princes Highway, Sylvania, NSW
Botany Bay 2440251 LEP Gazette Dec 00
Various Oyster workings remains
Off end of Sproule Road, Illawong, NSW
2440183 LEP Gazette Dec 00
Waterfront Houses / Boatsheds (group)
20, 24, 28, 30 & 32 Ward Crescent, Oyster Bay, NSW
Botany Bay 2440211 LEP Gazette Dec 00
Waterfront houses/boatsheds
24,28,30,32,40 Ward Crescent, Oyster Bay, NSW 2225
Botany Bay 2440039 LEP Gazette Dec 00
Waterfront housing/boatsheds
20-22 Bignell Street, Illawong, NSW 2234
2440022 LEP Gazette Dec 00
Wharf, boardwalk and steps
Gunnamatta Road, Woolooware, NSW 2230
Botany Bay 2440042 LEP Gazette Dec 00
PORT HACKING
Ballast shoal Port Hacking, NSW Port Hacking 2440290 LEP Gazette Dec 00
1479/R01/V2-App3(2) 18

Item Location Estuary Date Comments / References Heritage Database no.
Heritage Listing
Beckton Boatsheds 20-24 Beckton Place, Lilli Pilli, NSW
Port Hacking 2440194 LEP Gazette Dec 00
Boat shed 47 Taloombi Street, Cronulla, NSW 2230
Port Hacking 2440009 LEP Gazette Dec 00
Boat shed 53 Talloombi, Cronulla, NSW 2230
Port Hacking 2440010 LEP Gazette Dec 00
Boat shed 34 Shiprock Road, Dolans Bay, NSW 2229
Port Hacking 2440015 LEP Gazette Dec 00
Boat shed 1C Nottingham Place, Yowie Bay, NSW 2228
Port Hacking 2440066 LEP Gazette Dec 00
Boat shed 359 Willarong Road, Caringbah, NSW 2229
2440004 LEP Gazette Dec 00
Boat shed (Duplicate) 102 Attunga Road, Yowie Bay, NSW 2228
Port Hacking 244057 LEP Gazette Dec 00
Boatshed 296-298 Attunga Road, Yowie Bay, NSW 2228
Port Hacking 2440059 LEP Gazette Dec 00
Boatshed 39-41 Baliga Avenue, Yowie Bay, NSW 2228
Port Hacking 2440060 LEP Gazette Dec 00
Boatshed 4 Glen Ayr Avenue, Yowie Bay, NSW 2228
Port Hacking 2440061 LEP Gazette Dec 00
Boatshed 5-6 Kalang Lane, Yowie Bay, NSW 2228
Port Hacking 2440062 LEP Gazette Dec 00
Boatshed 6 Sherwood Avenue, Yowie Bay, NSW 2228
Port Hacking 2440067 LEP Gazette Dec 00
Boatshed 1 Wonga Road, Yowie Bay, NSW 2228
Port Hacking 2440070 LEP Gazette Dec 00
Boatshed 38 Coopernook Avenue, Gymea bay, NSW
Port Hacking 2440168 LEP Gazette Dec 00
Boatshed 135 Attunga Road, Yowie Bay, NSW
Port Hacking 2440282 LEP Gazette Dec 00
Boatshed 5 Kalang Lane, Yowie Bay, NSW
Port Hacking 2440283 LEP Gazette Dec 00
Boatshed and Baths 102 Attunga Road, Yowie Bay, NSW 2228
Port Hacking 2440056 LEP Gazette Dec 00
Boatshed and House 255 Attunga Road, Yowie Bay, NSW 2228
Port Hacking 2440058 LEP Gazette Dec 00
1479/R01/V2-App3(2) 19

Item Location Estuary Date Comments / References Heritage Database no.
Heritage Listing
Boatshed and Seawall 23A Yellambie Road, Yowie Bay, NSW
Port Hacking 2440287 LEP Gazette Dec 00
Boatshed and Seawall (Duplicate)
23A Yellambie Road, Yowie Bay, NSW 2228
Port Hacking 2440069 LEP Gazette Dec 00
Boatshed, Garage and Walling
9 Darook Park Road, Cronulla, NSW 2230
Port Hacking 2440008 LEP Gazette Dec 00
Boatsheds Warumbul Road (Gogerlys Point), Gundamaian (Royal National Park), NSW
Port Hacking 2440158 LEP Gazette Dec 00
Boatsheds and boatshed/dwellings
42,46,50-56,60 & 62 Matson Crescent, Yowie Bay, NSW 2228
Port Hacking 2440064 LEP Gazette Dec 00
Bundeena Wharf Brighton Street, Bundeena, NSW
Port Hacking 2440078 LEP Gazette Dec 00
Gardens and Foreshore Warumbul Road, Warumbul, NSW
Port Hacking 2440164 LEP Gazette Dec 00
Gymea Baths Gymea Bay, NSW Port Hacking 2440167 LEP Gazette Dec 00
Horderns Beach B/W Crammond Avenue and Brighton Street, Bundeena, NSW
Port Hacking 244077 LEP Gazette Dec 00
House and Boatshed Elanora
21 Bayside Place, Caringbah, NSW 2229
2440003 LEP Gazette Dec 00
House, boatshed and sea wall
129 Peninsula Road, Grays Point, NSW 2232
Port Hacking 2440017 LEP Gazette Dec 00
Stone Steps Waratah Street (Cronulla Wharf), Engadine, NSW 2233
2440013 LEP Gazette Dec 00
Two Storey stone boatshed
4 Munella Place, Yowie Bay, NSW 2228
Port Hacking 2440065 LEP Gazette Dec 00
SHOALHAVEN RIVER
Old Nowra Road Bridge, Shoalhaven River Road Bridge
Princes Highway, Nowra, NSW 2541
Shoalhaven River
14236 REP Gazette Jan 86; Register of the National Estate Gazette Apr 89
DURRAS LAKEBenandarah Area-Coal bunker wharf
Benandarah, NSW 2536
Eurobodalla area closest to Durras Lake
4181 LEP 1987
Benandarah Area-Loading ramp, wharf
Benandarah, NSW 2536
Durras lake 4182 LEP 1987
1479/R01/V2-App3(2) 20

Item Location Estuary Date Comments / References Heritage Database no.
Heritage Listing
Benandarah Area-Paddle Wheel punt remains
Benandarah, NSW 2536
Durras Lake 4184 LEP 1987
BATEMANS BAY / CLYDE RIVERShipbuilding site, Clyde River
Nelligen, NSW 2536 Batemans Bay 4194 LEP 1987
Wrays Wharf site Nelligen, NSW 2536 Batemans Bay 4197 LEP 1987Wreck of sand barge c1905 GR
388228 Eurobodalla area
4200 LEP 1987
TOMAGA RIVERJohn Penn Shipwreck-boat harbour
Broulee, NSW 2537 Tomaga River 4186 LEP 1987
1479/R01/V2-App3(2) 21