eStorage D1.4 New Rotor Design Guidelines for both … · New Rotor Design Guidelines for both ......
32
European Commission – Directorate General for Research SEVENTH FRAMEWORK PROGRAMME THEME 5 - ENERGY Project acronym : eStorage Project full title : Solution for cost-effective integration of renewable intermittent generation by demonstrating the feasibility of flexible large-scale energy storage with innovative market and grid control approach. Grant agreement no.: 295367 Collaborative project / Demonstration Project Number of deliverable: D1.4 Dissemination level (PU, PP, RE, CO, RUE, CUE, SUE) : PU Date of preparation of the deliverable (latest version): 30/10/2016 Date of approval of the deliverable by the Commission: dd/mm/yyyy New Rotor Design Guidelines for both Doubly and Full-Fed Solutions – Publishable Summary
-
Upload
truongthuan -
Category
Documents
-
view
222 -
download
0
Transcript of eStorage D1.4 New Rotor Design Guidelines for both … · New Rotor Design Guidelines for both ......
European Commission – Directorate General for Research
S E V E N T H F R A M E W O R K P R O G R A M M E
T H E M E 5 - E N E R G Y
Project acronym : eStorage
Project full title : Solution for cost-effective integration of renewable intermittent
generation by demonstrating the feasibility of flexible large-scale energy
storage with innovative market and grid control approach.
Grant agreement no.: 295367
Collaborative project / Demonstration Project
Number of deliverable:
D1.4
Dissemination level (PU, PP, RE, CO, RUE, CUE, SUE) : PU
Date of preparation of the deliverable (latest version): 30/10/2016
Date of approval of the deliverable by the Commission: dd/mm/yyyy
New Rotor Design Guidelines for both Doubly
and Full-Fed Solutions –
Publishable Summary
ENERGY.2011.7.3-2- STORAGE AND BALANCING VARIABLE ELECTRICITY SUPPLY AND DEMAND / ESTORAGE
eStorage_D1.4_New Rotor Design Guidelines for both Doubly and Full-Fed Solutions - Publishable Summary fv
03/03/2017 2/32
R E V I S I O N C H A R T A N D H I S T O R Y L O G
V E R S I O N S
Version number When Organisation name Comments
v0.1 31/10/2016 GE (former AHF) First draft
V2.0 24/02/2017 GE (former AHF) Final version including reviewers remarks
V3.0 03/03/2017 ALG Quality check
Final version 06/03/2017 GE (former AHF) Final version sent to PO
D E L I V E R A B L E Q U A L I T Y R E V I E W
Quality check Status Date Comments
Reviewer 1 (AGR) 15/02/2017
Reviewer 2 (ICL) 20/02/2017
Quality Manager 03/03/2017
PC 06/03/2017
ENERGY.2011.7.3-2- STORAGE AND BALANCING VARIABLE ELECTRICITY SUPPLY AND DEMAND / ESTORAGE
eStorage_D1.4_New Rotor Design Guidelines for both Doubly and Full-Fed Solutions - Publishable Summary fv
03/03/2017 3/32
T A B L E O F C O N T E N T S
1 INTRODUCTION ..................................................................................................................................... 7
BACKGROUND OF THE STUDY ........................................................................................................................ 7
OBJECTIVE ................................................................................................................................................. 8
2 VALIDATION OF THE ROTOR WINDING OVERHANG CONCEPT .......................................................................... 10
DESCRIPTION OF THE ROTOR DESIGN ............................................................................................................ 10
DEVELOPMENT NEED ................................................................................................................................. 11
DEVELOPMENT OF MEASUREMENT EQUIPMENT ............................................................................................. 11
LEARNING ................................................................................................................................................ 13
3 VARIABLE SPEED CONTROL SPMAX .......................................................................................................... 14
DEVELOPMENT PROCESS ............................................................................................................................ 14
3.1.1. Development ........................................................................................................................... 14
3.1.2. Three level validation tests with associated platforms ........................................................... 15
RECENT DEVELOPMENTS ............................................................................................................................ 15
3.2.1. Testing of primary frequency capability .................................................................................. 16
3.2.2. Primary frequency control capability – measurements .......................................................... 17
LEARNING ................................................................................................................................................ 18
4 HYDRAULIC DEVELOPMENTS FOR REVERSIBLE FULLY FED SYNCHRONOUS MACHINES .............................................. 19
SPECIFIC REQUIREMENTS FOR FULLY FED REVERSIBLE MACHINES ........................................................................ 19
4.1.1. Benefits of speed variation in pump and turbine mode ......................................................... 19
4.1.2. Specific hydraulic approach for variable speed ....................................................................... 21
DESIGN APPROACH .................................................................................................................................... 22
4.2.1. Overview of design approach .................................................................................................. 22
4.2.2. Improvements needed from the reference case..................................................................... 23
4.2.3. Runner design .......................................................................................................................... 23
4.2.4. Guide Vanes and stay vanes .................................................................................................... 24
ENERGY.2011.7.3-2- STORAGE AND BALANCING VARIABLE ELECTRICITY SUPPLY AND DEMAND / ESTORAGE
eStorage_D1.4_New Rotor Design Guidelines for both Doubly and Full-Fed Solutions - Publishable Summary fv
03/03/2017 4/32
TEST CAMPAIGN ....................................................................................................................................... 25
4.3.1. Overview of test rig facility ...................................................................................................... 25
4.3.2. Test rig description .................................................................................................................. 25
4.3.3. Data Acquisition ....................................................................................................................... 25
RESULT AND ANALYSIS ............................................................................................................................... 26
4.4.1. Pump results ............................................................................................................................ 26
4.4.2. Optimisation of Power variation ............................................................................................. 26
CONCLUSIONS & RECOMMENDATIONS ......................................................................................................... 27
4.5.1. General Conclusions ................................................................................................................ 27
4.5.2. Suggestion for future research ................................................................................................ 28
5 INSULATION SYSTEM OF CONVERTER FED MACHINES ..................................................................................... 29
DEVELOPMENT FOR LARGE DOUBLE-FED MACHINES ........................................................................................ 29
RECENT DEVELOPMENTS ............................................................................................................................ 30
EQUIVALENT CIRCUITS FOR CORONA PROTECTION SYSTEM ............................................................................... 31
RESULTS / LEARNING ................................................................................................................................. 32
ENERGY.2011.7.3-2- STORAGE AND BALANCING VARIABLE ELECTRICITY SUPPLY AND DEMAND / ESTORAGE
eStorage_D1.4_New Rotor Design Guidelines for both Doubly and Full-Fed Solutions - Publishable Summary fv
03/03/2017 5/32
T A B L E O F F I G U R E S
Figure 1: Cylindrical rotor of a double fed asynchronous machine................................................................. 10
Figure 2: Installed rotor winding overhangs .................................................................................................... 11
Figure 3: Measurement track on the winding overhang and on the rotor rim ............................................... 12
Figure 4: Measurement position on the rotor and laser displacement transducer ........................................ 12
Figure 5: Raw signal and evaluated «cold» / «warm» on driven and non-driven end ................................... 13
Figure 6: Structure of the GE variable speed control system ..................................................................... 14
Figure 7: Test rig facility for real time simulation in Grenoble ................................................................... 16
Figure 8: Test for primary control capability v.1.1 – SWISSGRID .................................................................... 16
Figure 9: Head variation with variable speed technology compared to fixed speed (left) and pump input
variation (right) ................................................................................................................................................ 20
Figure 10: Efficiency optimisation in turbine mode with variable speed ........................................................ 20
Figure 11: Link between power variation and cavitation constraint in pump mode ...................................... 22
Figure 12: Hydraulic components of the whole pump-turbine ....................................................................... 23
Figure 13: Flow paths and minimum pressure area (in purple) at the blade inlet in pump ........................... 24
Figure 14: Example of flow visualisation for the design optimization of Stay vanes and Guide vanes .......... 24
Figure 15: Photograph of the test rig used for this project ............................................................................. 25
Figure 16: Cavitation incipient limits : Comparison between CFD and experimental results ......................... 26
Figure 17 : Power variation obtained with DEV02 .......................................................................................... 27
Figure 18: VET testing of single bars at rated and testing of grading system on single bars .......................... 29
Figure 19: Sample bars for VET testing and Pulse voltage patterns ................................................................ 30
Figure 20: - IR-recording to check temperature increase on CPS ................................................................... 32

ENERGY.2011.7.3-2- STORAGE AND BALANCING VARIABLE ELECTRICITY SUPPLY AND DEMAND / ESTORAGE
eStorage_D1.4_New Rotor Design Guidelines for both Doubly and Full-Fed Solutions - Publishable Summary fv
03/03/2017 6/32
P A R T I C I P A N T O R G A N I S A T I O N S
Participant organisation name Short name Country
GENERAL ELECTRICS (former ALSTOM HYDRO FRANCE) GE France
ELECTRICITE DE FRANCE S.A. EDF France
ELIA SYSTEM OPERATOR ELI Belgium
ALSTOM GRID SAS AGR France
IMPERIAL COLLEGE OF SCIENCE, TECHNOLOGY AND MEDICINE ICL United Kingdom
KEMA NEDERLAND BV KEM Netherlands
ALGOE ALG France
ENERGY.2011.7.3-2- STORAGE AND BALANCING VARIABLE ELECTRICITY SUPPLY AND DEMAND / ESTORAGE
eStorage_D1.4_New Rotor Design Guidelines for both Doubly and Full-Fed Solutions - Publishable Summary fv
03/03/2017 7/32
1 INTRODUCTION
Background of the study
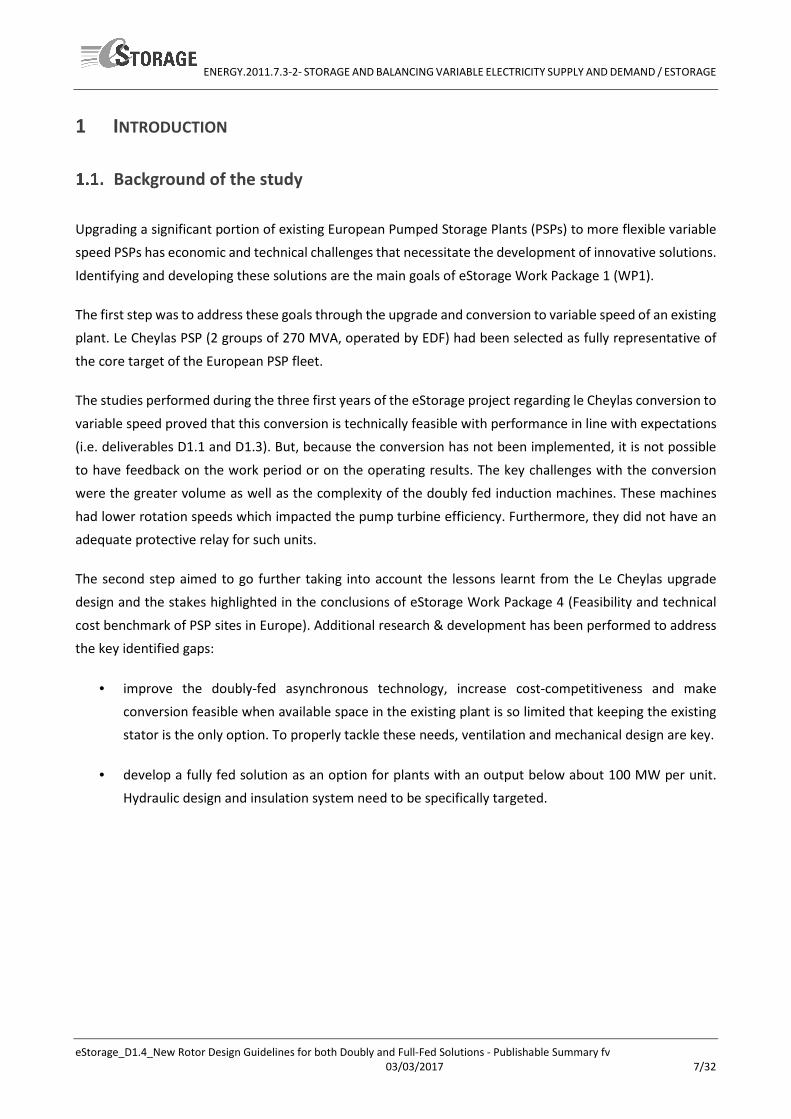
Upgrading a significant portion of existing European Pumped Storage Plants (PSPs) to more flexible variable
speed PSPs has economic and technical challenges that necessitate the development of innovative solutions.
Identifying and developing these solutions are the main goals of eStorage Work Package 1 (WP1).
The first step was to address these goals through the upgrade and conversion to variable speed of an existing
plant. Le Cheylas PSP (2 groups of 270 MVA, operated by EDF) had been selected as fully representative of
the core target of the European PSP fleet.
The studies performed during the three first years of the eStorage project regarding le Cheylas conversion to
variable speed proved that this conversion is technically feasible with performance in line with expectations
(i.e. deliverables D1.1 and D1.3). But, because the conversion has not been implemented, it is not possible
to have feedback on the work period or on the operating results. The key challenges with the conversion
were the greater volume as well as the complexity of the doubly fed induction machines. These machines
had lower rotation speeds which impacted the pump turbine efficiency. Furthermore, they did not have an
adequate protective relay for such units.
The second step aimed to go further taking into account the lessons learnt from the Le Cheylas upgrade
design and the stakes highlighted in the conclusions of eStorage Work Package 4 (Feasibility and technical
cost benchmark of PSP sites in Europe). Additional research & development has been performed to address
the key identified gaps:
• improve the doubly-fed asynchronous technology, increase cost-competitiveness and make
conversion feasible when available space in the existing plant is so limited that keeping the existing
stator is the only option. To properly tackle these needs, ventilation and mechanical design are key.
• develop a fully fed solution as an option for plants with an output below about 100 MW per unit.
Hydraulic design and insulation system need to be specifically targeted.
ENERGY.2011.7.3-2- STORAGE AND BALANCING VARIABLE ELECTRICITY SUPPLY AND DEMAND / ESTORAGE
eStorage_D1.4_New Rotor Design Guidelines for both Doubly and Full-Fed Solutions - Publishable Summary fv
03/03/2017 8/32
Objective
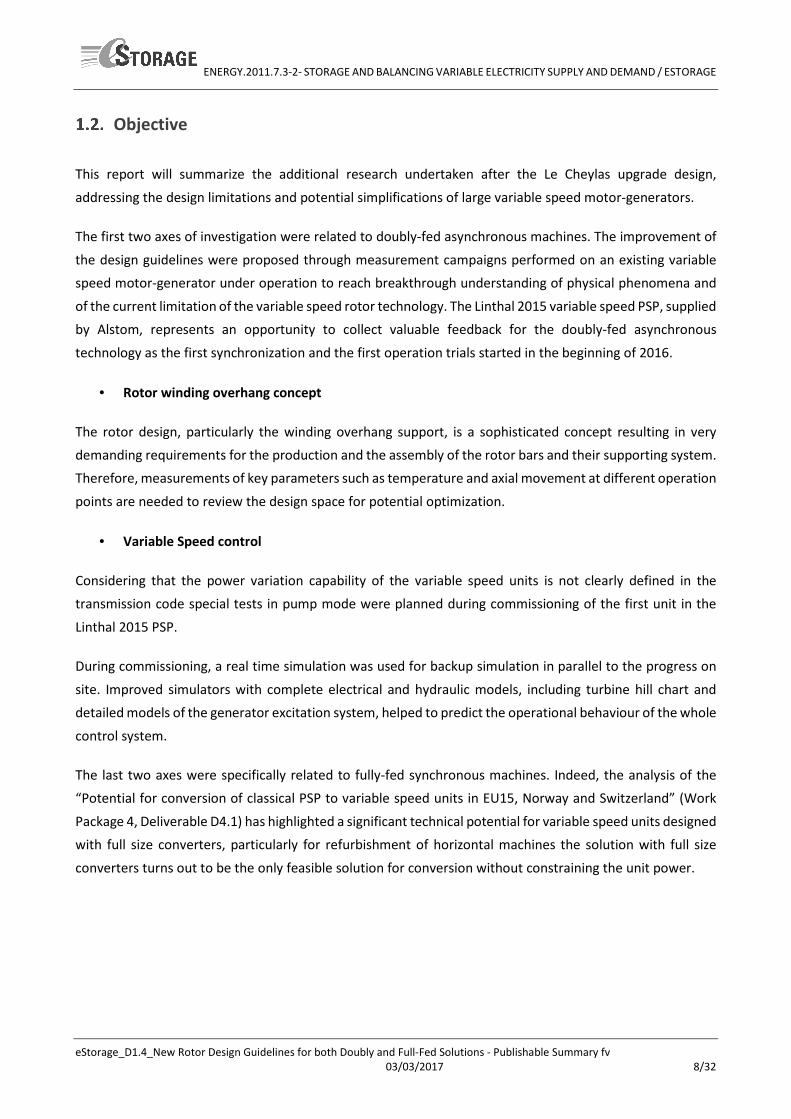
This report will summarize the additional research undertaken after the Le Cheylas upgrade design,
addressing the design limitations and potential simplifications of large variable speed motor-generators.
The first two axes of investigation were related to doubly-fed asynchronous machines. The improvement of
the design guidelines were proposed through measurement campaigns performed on an existing variable
speed motor-generator under operation to reach breakthrough understanding of physical phenomena and
of the current limitation of the variable speed rotor technology. The Linthal 2015 variable speed PSP, supplied
by Alstom, represents an opportunity to collect valuable feedback for the doubly-fed asynchronous
technology as the first synchronization and the first operation trials started in the beginning of 2016.
• Rotor winding overhang concept
The rotor design, particularly the winding overhang support, is a sophisticated concept resulting in very
demanding requirements for the production and the assembly of the rotor bars and their supporting system.
Therefore, measurements of key parameters such as temperature and axial movement at different operation
points are needed to review the design space for potential optimization.
• Variable Speed control
Considering that the power variation capability of the variable speed units is not clearly defined in the
transmission code special tests in pump mode were planned during commissioning of the first unit in the
Linthal 2015 PSP.
During commissioning, a real time simulation was used for backup simulation in parallel to the progress on
site. Improved simulators with complete electrical and hydraulic models, including turbine hill chart and
detailed models of the generator excitation system, helped to predict the operational behaviour of the whole
control system.
The last two axes were specifically related to fully-fed synchronous machines. Indeed, the analysis of the
“Potential for conversion of classical PSP to variable speed units in EU15, Norway and Switzerland” (Work
Package 4, Deliverable D4.1) has highlighted a significant technical potential for variable speed units designed
with full size converters, particularly for refurbishment of horizontal machines the solution with full size
converters turns out to be the only feasible solution for conversion without constraining the unit power.
ENERGY.2011.7.3-2- STORAGE AND BALANCING VARIABLE ELECTRICITY SUPPLY AND DEMAND / ESTORAGE
eStorage_D1.4_New Rotor Design Guidelines for both Doubly and Full-Fed Solutions - Publishable Summary fv
03/03/2017 9/32
• Hydraulic developments for reversible fully-fed synchronous machines
The hydraulic design represents the major technical barrier commonly identified for fully fed variable speed
PSP technology. The design should enable safe and efficient operation from 0 to 100% of load, especially in
pump mode. To address this need, GE undertook specific hydraulic developments during the course of the
project: first performing Computational Fluid Dynamic (CFD) design optimization (computer simulation), then
scale model testing (design, manufacturing a scale model and hydraulic test rig testing) of a fully fed pump
turbine to measure new turbine design performance and validate the computer simulations.
• Insulation system of converter fed machines
The insulation system of converter-fed machines must be able to withstand voltage generated by the
converter feeding the winding. Due to a lack of long term experience with large drives in the hydro industry,
further developments of the insulation and grading system of high voltage windings were needed. Therefore,
lab tests, in compliance with the latest international standards for converter fed windings, were conducted.
The tests validated the design criteria for the main insulation and corona protection system.
ENERGY.2011.7.3-2- STORAGE AND BALANCING VARIABLE ELECTRICITY SUPPLY AND DEMAND / ESTORAGE
eStorage_D1.4_New Rotor Design Guidelines for both Doubly and Full-Fed Solutions - Publishable Summary fv
03/03/2017 10/32
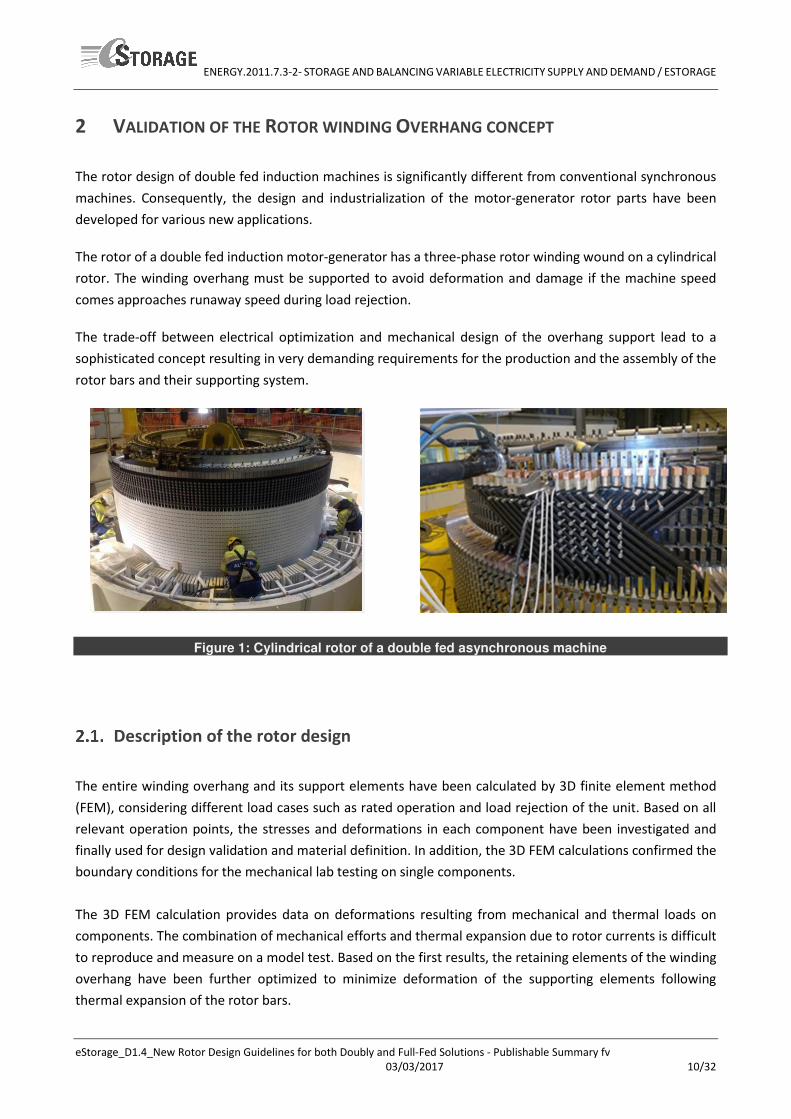
2 VALIDATION OF THE ROTOR WINDING OVERHANG CONCEPT
The rotor design of double fed induction machines is significantly different from conventional synchronous
machines. Consequently, the design and industrialization of the motor-generator rotor parts have been
developed for various new applications.
The rotor of a double fed induction motor-generator has a three-phase rotor winding wound on a cylindrical
rotor. The winding overhang must be supported to avoid deformation and damage if the machine speed
comes approaches runaway speed during load rejection.
The trade-off between electrical optimization and mechanical design of the overhang support lead to a
sophisticated concept resulting in very demanding requirements for the production and the assembly of the
rotor bars and their supporting system.
Figure 1: Cylindrical rotor of a double fed asynchronous machine
Description of the rotor design
The entire winding overhang and its support elements have been calculated by 3D finite element method
(FEM), considering different load cases such as rated operation and load rejection of the unit. Based on all
relevant operation points, the stresses and deformations in each component have been investigated and
finally used for design validation and material definition. In addition, the 3D FEM calculations confirmed the
boundary conditions for the mechanical lab testing on single components.
The 3D FEM calculation provides data on deformations resulting from mechanical and thermal loads on
components. The combination of mechanical efforts and thermal expansion due to rotor currents is difficult
to reproduce and measure on a model test. Based on the first results, the retaining elements of the winding
overhang have been further optimized to minimize deformation of the supporting elements following
thermal expansion of the rotor bars.
ENERGY.2011.7.3-2- STORAGE AND BALANCING VARIABLE ELECTRICITY SUPPLY AND DEMAND / ESTORAGE
eStorage_D1.4_New Rotor Design Guidelines for both Doubly and Full-Fed Solutions - Publishable Summary fv
03/03/2017 11/32
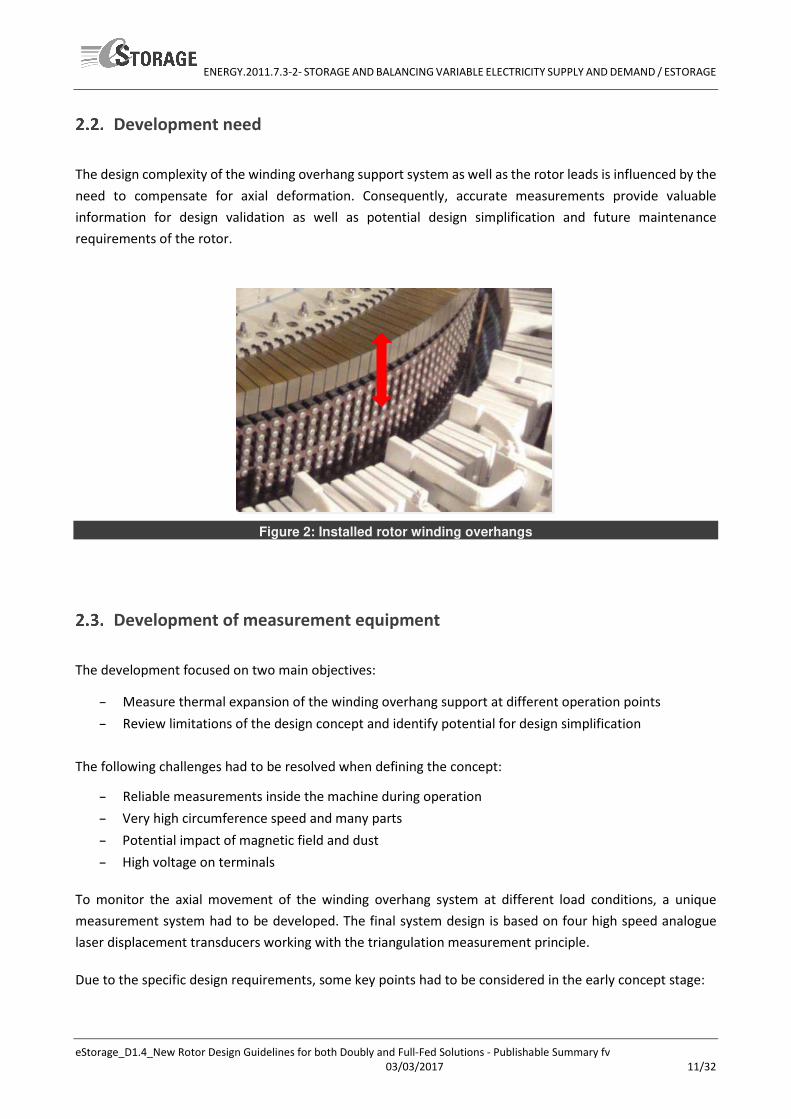
Development need
The design complexity of the winding overhang support system as well as the rotor leads is influenced by the
need to compensate for axial deformation. Consequently, accurate measurements provide valuable
information for design validation as well as potential design simplification and future maintenance
requirements of the rotor.
Figure 2: Installed rotor winding overhangs
Development of measurement equipment
The development focused on two main objectives:
– Measure thermal expansion of the winding overhang support at different operation points
– Review limitations of the design concept and identify potential for design simplification
The following challenges had to be resolved when defining the concept:
– Reliable measurements inside the machine during operation
– Very high circumference speed and many parts
– Potential impact of magnetic field and dust
– High voltage on terminals
To monitor the axial movement of the winding overhang system at different load conditions, a unique
measurement system had to be developed. The final system design is based on four high speed analogue
laser displacement transducers working with the triangulation measurement principle.
Due to the specific design requirements, some key points had to be considered in the early concept stage:
ENERGY.2011.7.3-2- STORAGE AND BALANCING VARIABLE ELECTRICITY SUPPLY AND DEMAND / ESTORAGE
eStorage_D1.4_New Rotor Design Guidelines for both Doubly and Full-Fed Solutions - Publishable Summary fv
03/03/2017 12/32
– Positioning of the key-phasor on the rotating parts and sensors on the bearing brackets. The system
is designed to handle machine vibrations on the sensor fixation, as well as individual angular offsets
and ambient temperatures up to 60°C.
– Potential impact of the rotor angle on the trigger impulse due to the operation mode such as turbine
and pump mode. Software enable adjustment of data record of one revolution to keep positioning
of physical reference point on the rotor
– System working with very high sampling rate due to high circumference speed and number of
rotating parts
– Precision of measurement in axial direction 0.1 mm
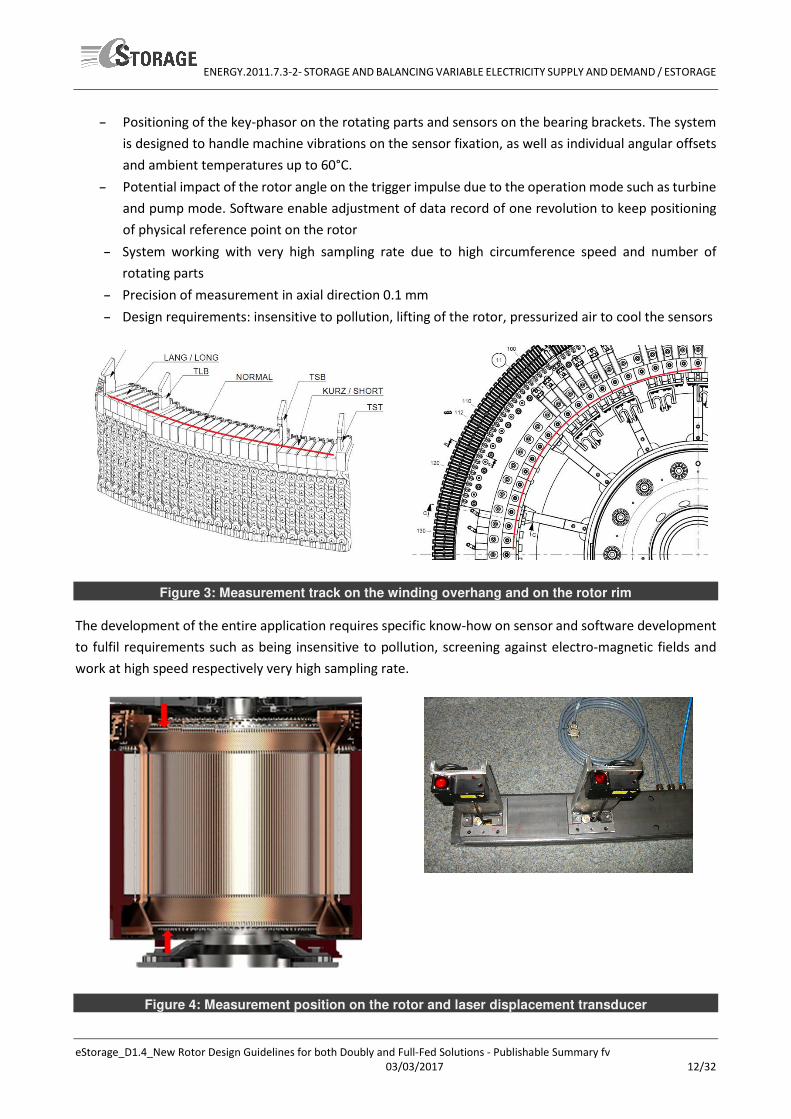
– Design requirements: insensitive to pollution, lifting of the rotor, pressurized air to cool the sensors
Figure 3: Measurement track on the winding overhang and on the rotor rim
The development of the entire application requires specific know-how on sensor and software development
to fulfil requirements such as being insensitive to pollution, screening against electro-magnetic fields and
work at high speed respectively very high sampling rate.
Figure 4: Measurement position on the rotor and laser displacement transducer
ENERGY.2011.7.3-2- STORAGE AND BALANCING VARIABLE ELECTRICITY SUPPLY AND DEMAND / ESTORAGE
eStorage_D1.4_New Rotor Design Guidelines for both Doubly and Full-Fed Solutions - Publishable Summary fv
03/03/2017 13/32
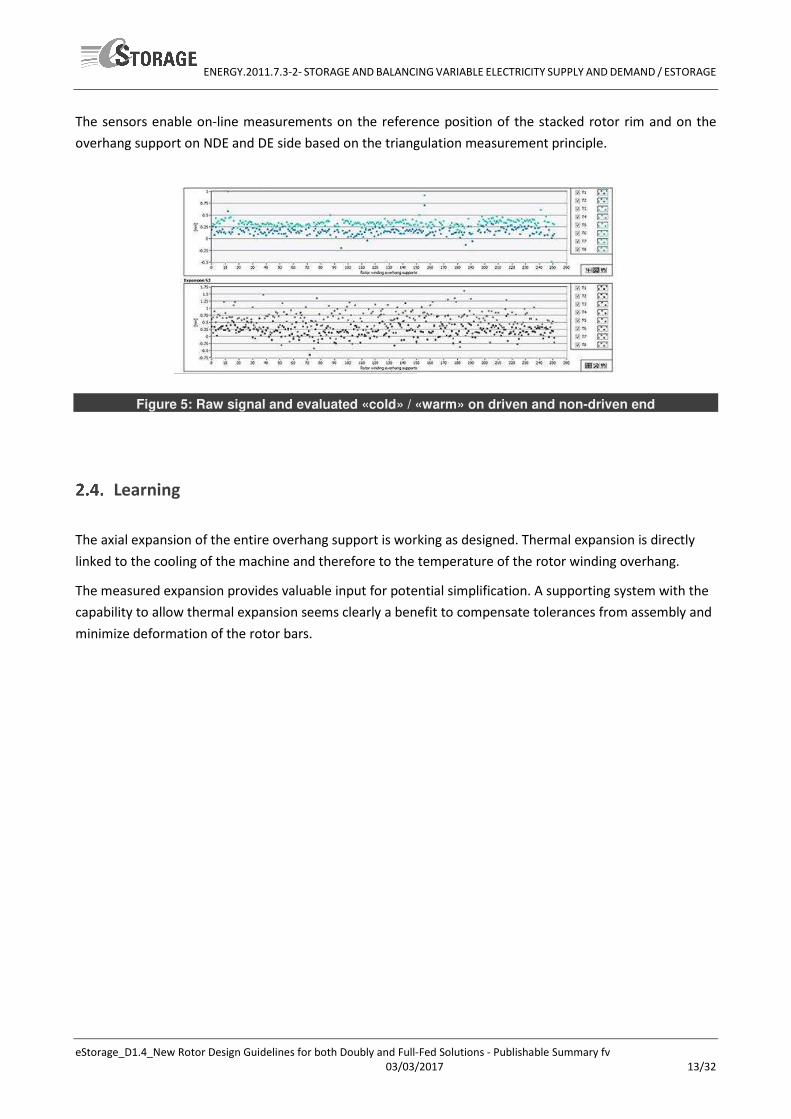
The sensors enable on-line measurements on the reference position of the stacked rotor rim and on the
overhang support on NDE and DE side based on the triangulation measurement principle.
Figure 5: Raw signal and evaluated «cold» / «warm» on driven and non-driven end
Learning
The axial expansion of the entire overhang support is working as designed. Thermal expansion is directly
linked to the cooling of the machine and therefore to the temperature of the rotor winding overhang.
The measured expansion provides valuable input for potential simplification. A supporting system with the
capability to allow thermal expansion seems clearly a benefit to compensate tolerances from assembly and
minimize deformation of the rotor bars.
ENERGY.2011.7.3-2- STORAGE AND BALANCING VARIABLE ELECTRICITY SUPPLY AND DEMAND / ESTORAGE
eStorage_D1.4_New Rotor Design Guidelines for both Doubly and Full-Fed Solutions - Publishable Summary fv
03/03/2017 14/32
3 VARIABLE SPEED CONTROL SPMAX
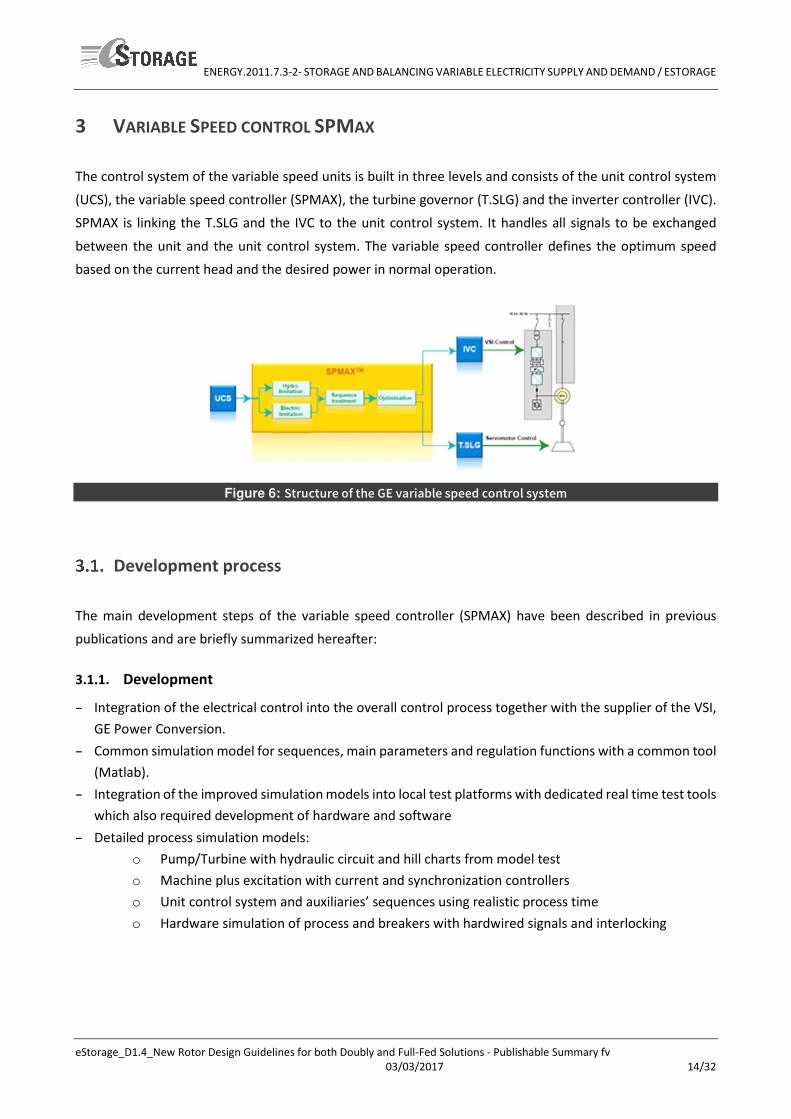
The control system of the variable speed units is built in three levels and consists of the unit control system
(UCS), the variable speed controller (SPMAX), the turbine governor (T.SLG) and the inverter controller (IVC).
SPMAX is linking the T.SLG and the IVC to the unit control system. It handles all signals to be exchanged
between the unit and the unit control system. The variable speed controller defines the optimum speed
based on the current head and the desired power in normal operation.
Figure 6: Structure of the GE variable speed control system
Development process
The main development steps of the variable speed controller (SPMAX) have been described in previous
publications and are briefly summarized hereafter:
3.1.1. Development
– Integration of the electrical control into the overall control process together with the supplier of the VSI,
GE Power Conversion.
– Common simulation model for sequences, main parameters and regulation functions with a common tool
(Matlab).
– Integration of the improved simulation models into local test platforms with dedicated real time test tools
which also required development of hardware and software
– Detailed process simulation models:
o Pump/Turbine with hydraulic circuit and hill charts from model test
o Machine plus excitation with current and synchronization controllers
o Unit control system and auxiliaries’ sequences using realistic process time
o Hardware simulation of process and breakers with hardwired signals and interlocking
ENERGY.2011.7.3-2- STORAGE AND BALANCING VARIABLE ELECTRICITY SUPPLY AND DEMAND / ESTORAGE
eStorage_D1.4_New Rotor Design Guidelines for both Doubly and Full-Fed Solutions - Publishable Summary fv
03/03/2017 15/32
3.1.2. Three level validation tests with associated platforms
Platform 1 Sub-system control platform dedicated to the validation of variable speed controller (SPMAX),
turbine governor (T.SLG) and inverter control (front end control).
Platform 2 SPMAX-T.SLG control platform dedicated to the detailed validation and final acceptance tests.
The platform was also used for the permanent support during commissioning.
Platform 3 Unit control system platform dedicated to the validation of the overall UCS-SPMAX control with
final sequences and signals. Common tests for interface adaptations. The platform was moved
to site for operator training and pre-commissioning tests with operators.
Recent Developments
In normal operation, low rotor current frequencies must be avoided due to the thermal constraints of
inverter power electronics. The control is designed to avoid unit operation with rotor current frequency
below 0.2 Hz. For a given head and grid frequency, the pumping power reference may give a resulting speed
inside the synchronous dead band. Since active power is directly linked to the speed, the system can be
controlled satisfying inverter limitation by adjusting the input power. Dynamic switchover between speed
control, when speed is close to sensitive area and active power control, when dead band is avoided allows a
smooth and performant management of the transition of the synchronous dead band. The fine tuning of this
control function is complex and had to be done during commissioning.
Very high head pump-turbines have several intrinsic technical challenges like transient behaviour, operation
stability and design for high pressure. To cope with the effects of high head in combination with- low specific
speed and the very demanding hydraulic circuit, special closing laws on the guide vanes and main inlet valves
were introduced and tested. During commissioning, new concepts and design solutions were validated by
measurements and finally used to optimize future plant operation. Specifically, the confirmation of the
speed-power range requires detailed measurements of the pump-turbine characteristics as well as the
dynamic response of the entire system.
Considering that the power variation capability of the variable speed units were not clearly defined in the
transmission code, special tests in pump mode, which were a new concept for all involved parties were done
during commissioning of the first unit.
During commissioning a real-time simulation on a test bench was used for backup simulation in parallel to
the progress on site. Improved simulators with complete electrical and hydraulic models, including turbine
hill chart and detailed models of the generator excitation system, helped to successfully predict the
operational behaviour of the whole control system. To prove compliance with the new grid code
requirements, comprehensive network simulations were performed followed by common acceptance tests
involving the plant owner and TSO.
ENERGY.2011.7.3-2- STORAGE AND BALANCING VARIABLE ELECTRICITY SUPPLY AND DEMAND / ESTORAGE
eStorage_D1.4_New Rotor Design Guidelines for both Doubly and Full-Fed Solutions - Publishable Summary fv
03/03/2017 16/32
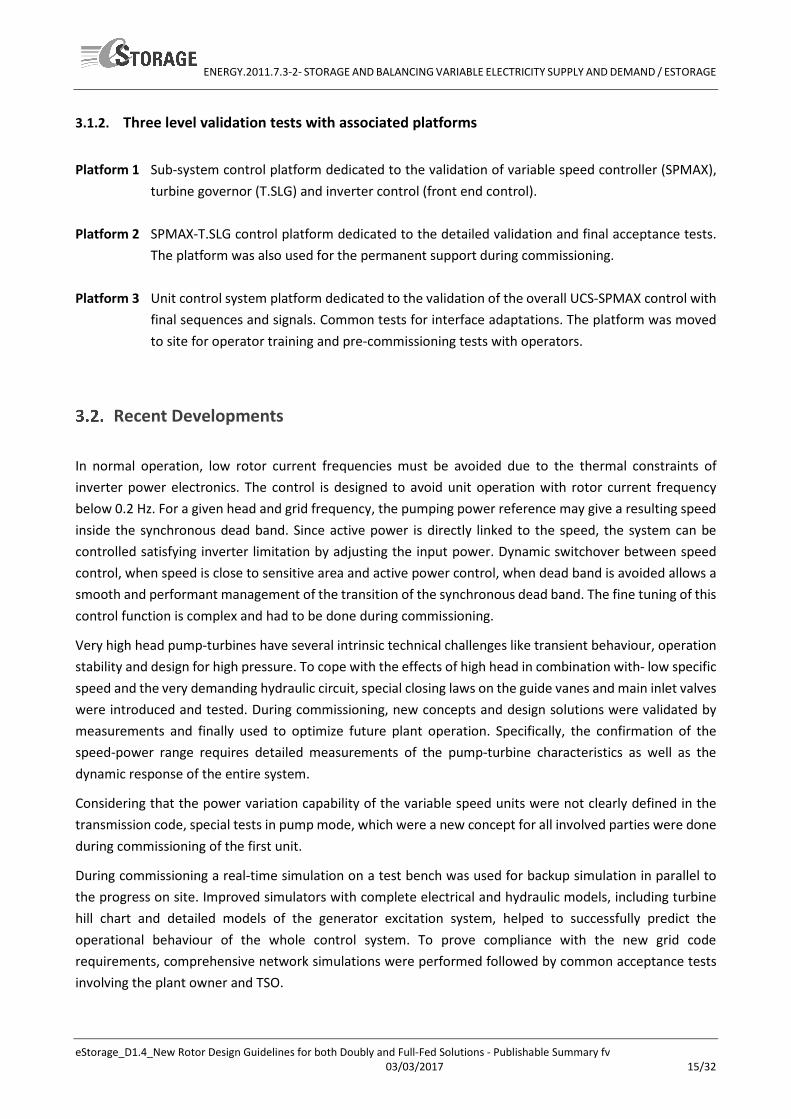
Figure 7: Test rig facility for real time simulation in Grenoble
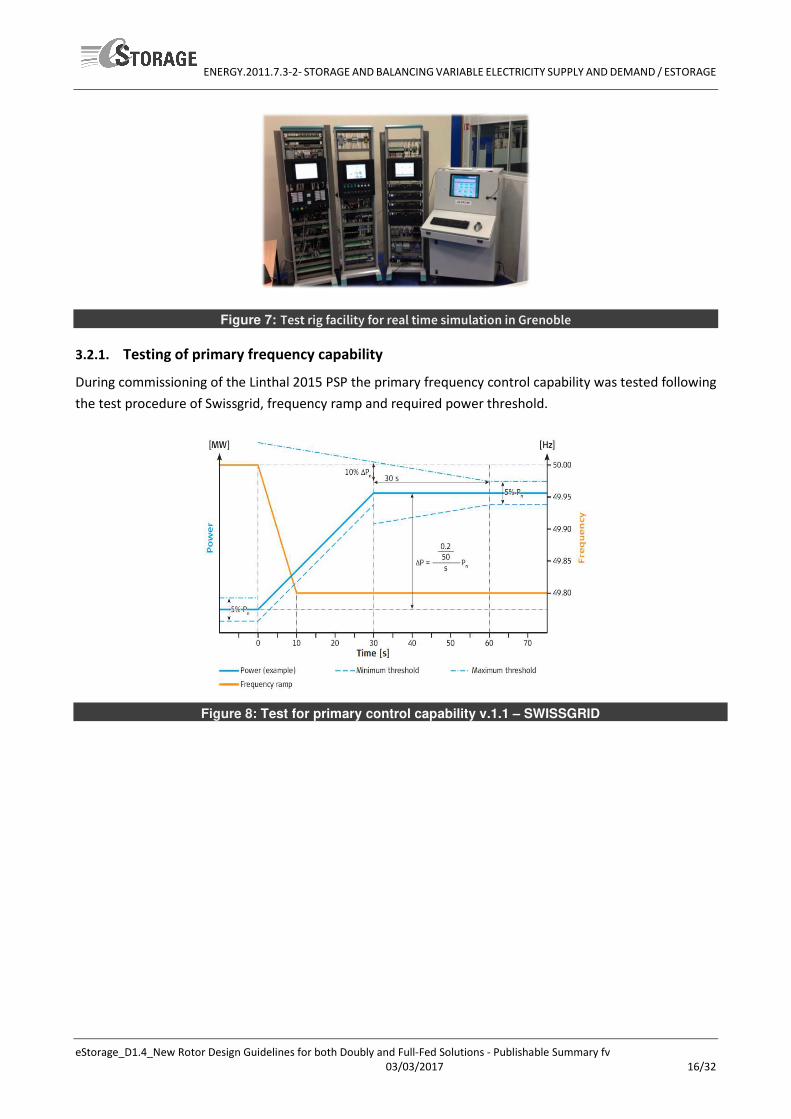
3.2.1. Testing of primary frequency capability
During commissioning of the Linthal 2015 PSP the primary frequency control capability was tested following
the test procedure of Swissgrid, frequency ramp and required power threshold.
Figure 8: Test for primary control capability v.1.1 – SWISSGRID
ENERGY.2011.7.3-2- STORAGE AND BALANCING VARIABLE ELECTRICITY SUPPLY AND DEMAND / ESTORAGE
eStorage_D1.4_New Rotor Design Guidelines for both Doubly and Full-Fed Solutions - Publishable Summary fv
03/03/2017 17/32
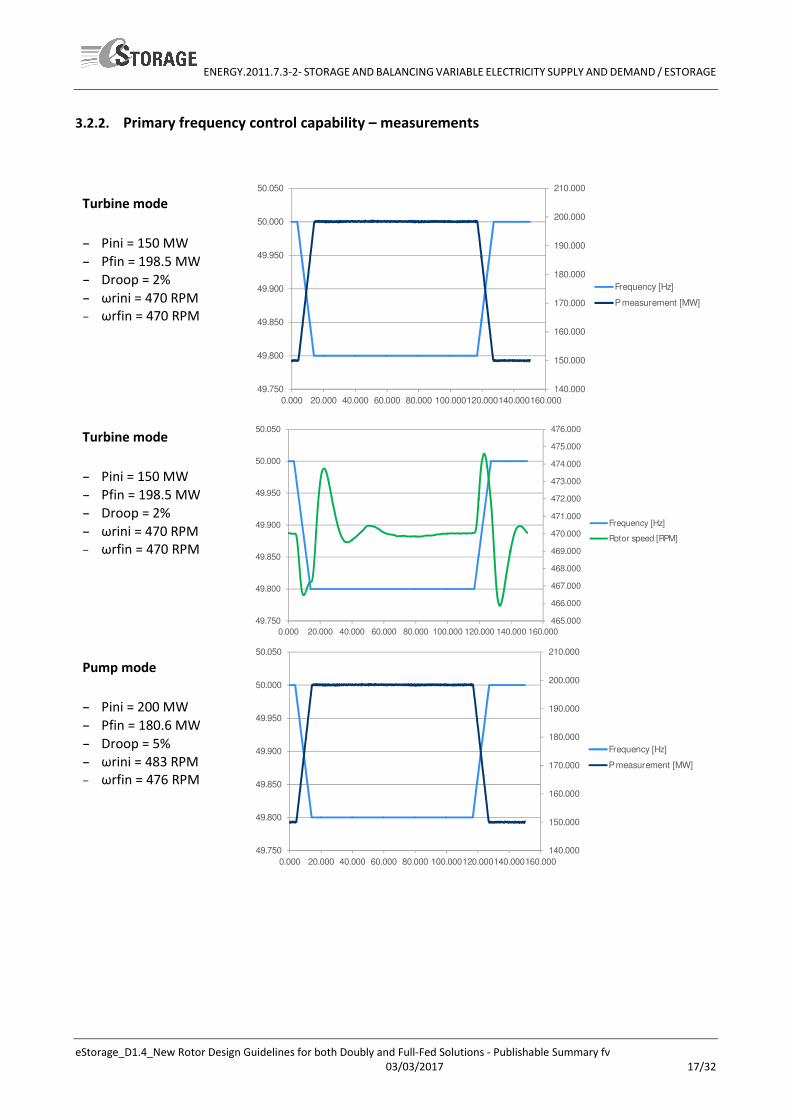
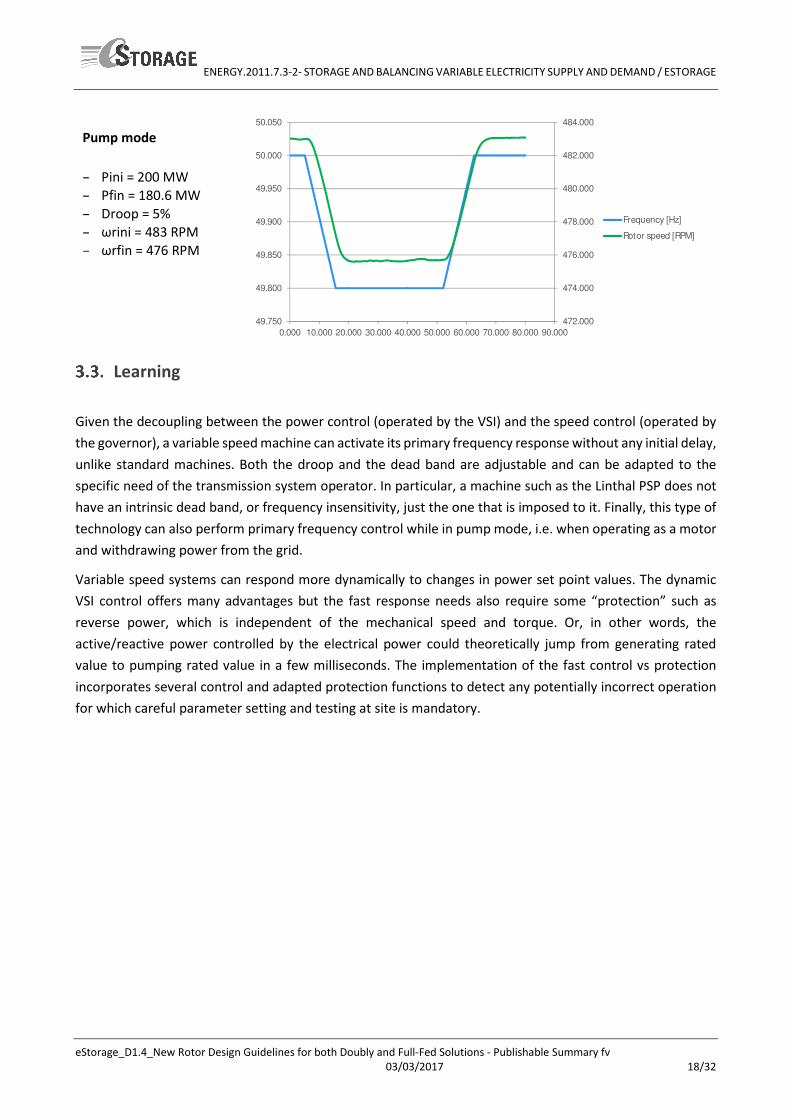
3.2.2. Primary frequency control capability – measurements
Turbine mode
– Pini = 150 MW
– Pfin = 198.5 MW
– Droop = 2%
– ωrini = 470 RPM
– ωrfin = 470 RPM
Turbine mode
– Pini = 150 MW
– Pfin = 198.5 MW
– Droop = 2%
– ωrini = 470 RPM
– ωrfin = 470 RPM
Pump mode
– Pini = 200 MW
– Pfin = 180.6 MW
– Droop = 5%
– ωrini = 483 RPM
– ωrfin = 476 RPM
140.000
150.000
160.000
170.000
180.000
190.000
200.000
210.000
49.750
49.800
49.850
49.900
49.950
50.000
50.050
0.000 20.000 40.000 60.000 80.000 100.000120.000140.000160.000
Frequency [Hz]
P measurement [MW]
465.000
466.000
467.000
468.000
469.000
470.000
471.000
472.000
473.000
474.000
475.000
476.000
49.750
49.800
49.850
49.900
49.950
50.000
50.050
0.000 20.000 40.000 60.000 80.000 100.000 120.000 140.000 160.000
Frequency [Hz]
Rotor speed [RPM]
140.000
150.000
160.000
170.000
180.000
190.000
200.000
210.000
49.750
49.800
49.850
49.900
49.950
50.000
50.050
0.000 20.000 40.000 60.000 80.000 100.000120.000140.000160.000
Frequency [Hz]
P measurement [MW]
ENERGY.2011.7.3-2- STORAGE AND BALANCING VARIABLE ELECTRICITY SUPPLY AND DEMAND / ESTORAGE
eStorage_D1.4_New Rotor Design Guidelines for both Doubly and Full-Fed Solutions - Publishable Summary fv
03/03/2017 18/32
Pump mode
– Pini = 200 MW
– Pfin = 180.6 MW
– Droop = 5%
– ωrini = 483 RPM
– ωrfin = 476 RPM
Learning
Given the decoupling between the power control (operated by the VSI) and the speed control (operated by
the governor), a variable speed machine can activate its primary frequency response without any initial delay,
unlike standard machines. Both the droop and the dead band are adjustable and can be adapted to the
specific need of the transmission system operator. In particular, a machine such as the Linthal PSP does not
have an intrinsic dead band, or frequency insensitivity, just the one that is imposed to it. Finally, this type of
technology can also perform primary frequency control while in pump mode, i.e. when operating as a motor
and withdrawing power from the grid.
Variable speed systems can respond more dynamically to changes in power set point values. The dynamic
VSI control offers many advantages but the fast response needs also require some “protection” such as
reverse power, which is independent of the mechanical speed and torque. Or, in other words, the
active/reactive power controlled by the electrical power could theoretically jump from generating rated
value to pumping rated value in a few milliseconds. The implementation of the fast control vs protection
incorporates several control and adapted protection functions to detect any potentially incorrect operation
for which careful parameter setting and testing at site is mandatory.
472.000
474.000
476.000
478.000
480.000
482.000
484.000
49.750
49.800
49.850
49.900
49.950
50.000
50.050
0.000 10.000 20.000 30.000 40.000 50.000 60.000 70.000 80.000 90.000
Frequency [Hz]
Rotor speed [RPM]
ENERGY.2011.7.3-2- STORAGE AND BALANCING VARIABLE ELECTRICITY SUPPLY AND DEMAND / ESTORAGE
eStorage_D1.4_New Rotor Design Guidelines for both Doubly and Full-Fed Solutions - Publishable Summary fv
03/03/2017 19/32
4 HYDRAULIC DEVELOPMENTS FOR REVERSIBLE FULLY FED SYNCHRONOUS MACHINES
This section presents the improvements of hydraulic components to be perfectly suited to fully fed
technology. The case study is a typical European fully fed project with power lower than 100MW, about 200
meters of head and an expected power variation of 0-100% of maximum power.
Specific requirements for fully fed reversible machines
Contrary to conventional reversible machines operating at fixed speed, variable speed machines allow input
power regulation in pump mode. In a fixed speed machine, the input power depends on the gross head and
on the characteristic curve, i.e. the relation between the power and the head which is unique for a single
speed machine; therefore, power regulation is not possible.
For a variable speed machine, the characteristic curve varies with the speed and allows the power flexibility
needed for grid frequency regulation.
In addition to this benefit in pump mode, variable speed allows increasing the hydraulic efficiency in turbine
mode by shifting the operating point towards the best efficiency line.
4.1.1. Benefits of speed variation in pump and turbine mode
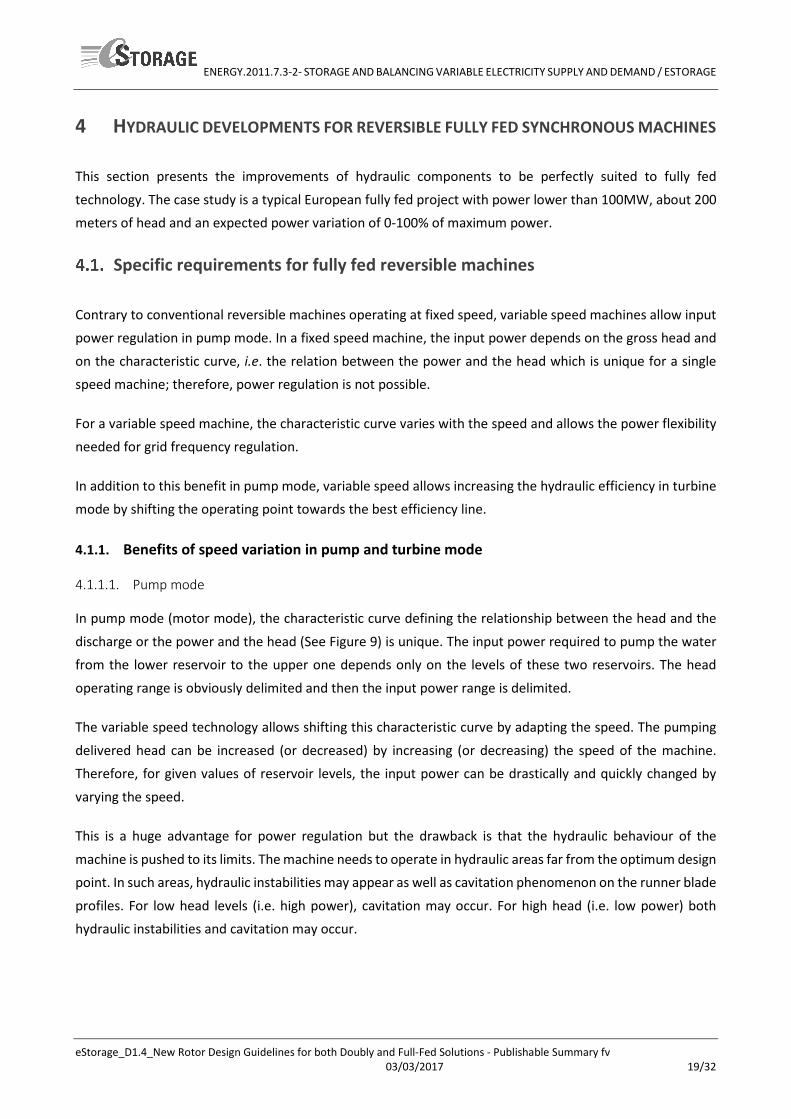
4.1.1.1. Pump mode
In pump mode (motor mode), the characteristic curve defining the relationship between the head and the
discharge or the power and the head (See Figure 9) is unique. The input power required to pump the water
from the lower reservoir to the upper one depends only on the levels of these two reservoirs. The head
operating range is obviously delimited and then the input power range is delimited.
The variable speed technology allows shifting this characteristic curve by adapting the speed. The pumping
delivered head can be increased (or decreased) by increasing (or decreasing) the speed of the machine.
Therefore, for given values of reservoir levels, the input power can be drastically and quickly changed by
varying the speed.
This is a huge advantage for power regulation but the drawback is that the hydraulic behaviour of the
machine is pushed to its limits. The machine needs to operate in hydraulic areas far from the optimum design
point. In such areas, hydraulic instabilities may appear as well as cavitation phenomenon on the runner blade
profiles. For low head levels (i.e. high power), cavitation may occur. For high head (i.e. low power) both
hydraulic instabilities and cavitation may occur.
ENERGY.2011.7.3-2- STORAGE AND BALANCING VARIABLE ELECTRICITY SUPPLY AND DEMAND / ESTORAGE
eStorage_D1.4_New Rotor Design Guidelines for both Doubly and Full-Fed Solutions - Publishable Summary fv
03/03/2017 20/32
Figure 9: Head variation with variable speed technology compared to fixed speed (left) and pump
input variation (right)
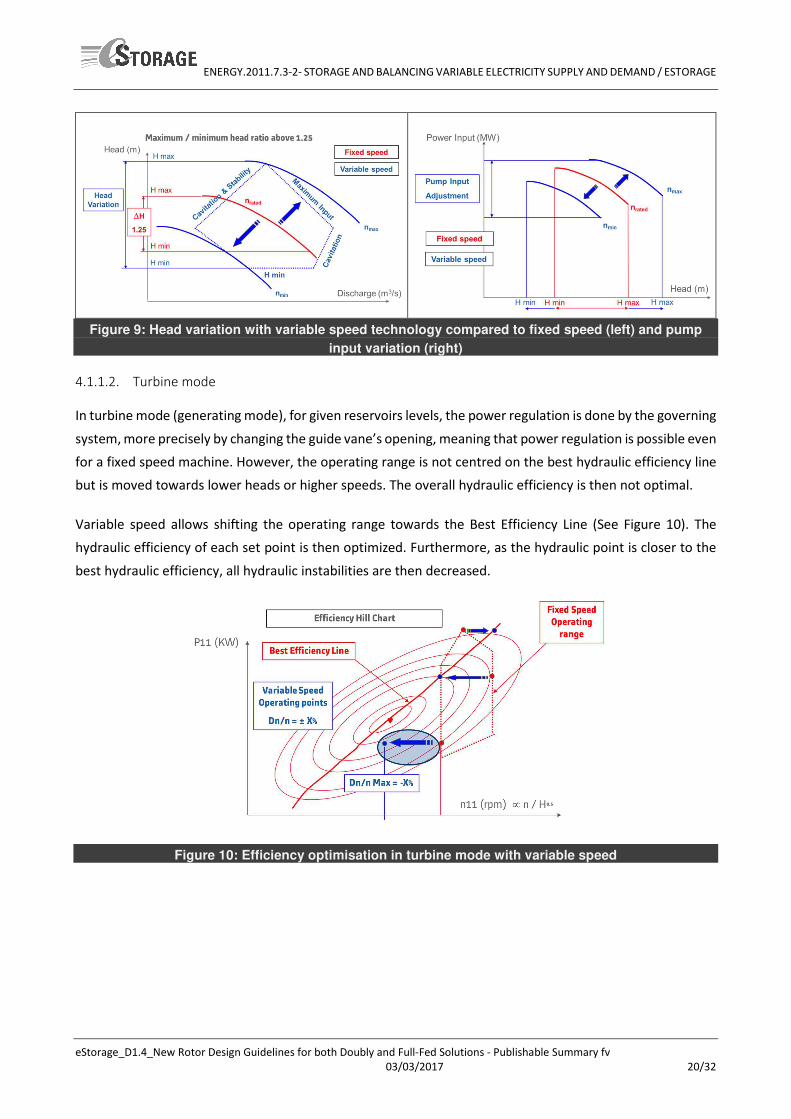
4.1.1.2. Turbine mode
In turbine mode (generating mode), for given reservoirs levels, the power regulation is done by the governing
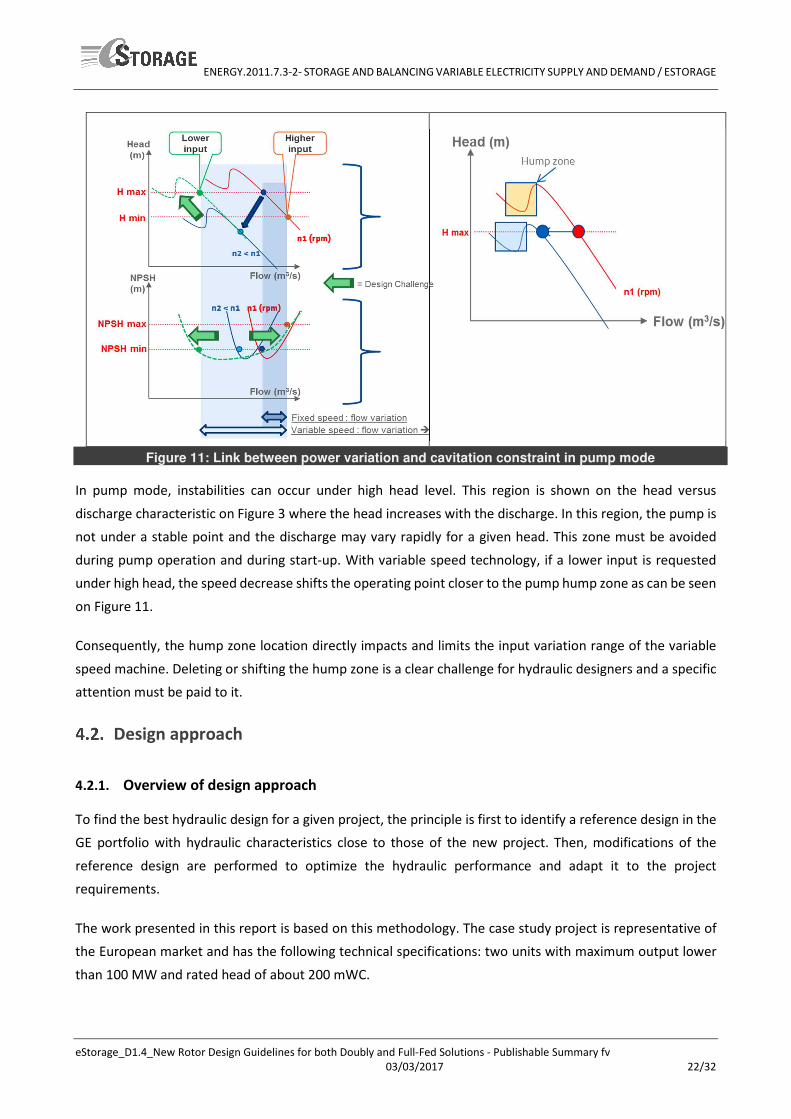
system, more precisely by changing the guide vane’s opening, meaning that power regulation is possible even
for a fixed speed machine. However, the operating range is not centred on the best hydraulic efficiency line
but is moved towards lower heads or higher speeds. The overall hydraulic efficiency is then not optimal.
Variable speed allows shifting the operating range towards the Best Efficiency Line (See Figure 10). The
hydraulic efficiency of each set point is then optimized. Furthermore, as the hydraulic point is closer to the
best hydraulic efficiency, all hydraulic instabilities are then decreased.
Figure 10: Efficiency optimisation in turbine mode with variable speed
ENERGY.2011.7.3-2- STORAGE AND BALANCING VARIABLE ELECTRICITY SUPPLY AND DEMAND / ESTORAGE
eStorage_D1.4_New Rotor Design Guidelines for both Doubly and Full-Fed Solutions - Publishable Summary fv
03/03/2017 21/32
4.1.2. Specific hydraulic approach for variable speed
From a hydraulic point of view, variable speed brings challenges to increasing the power range of the
machine. To extend the hydraulic operating range of the machine in pump mode, a specific study had be
done to improve cavitation behaviour on the runner blade profiles as well as on hydraulic instabilities.
Cavitation phenomenon appears on the runner blade profile when the flow angle is strongly misaligned with
the geometric angle of the runner blade profile. This misalignment leads to a local pressure drop at the
vicinity of the blade profile and generates cavitation bubbles (gas bubbles) if the local pressure level is less
than the vapour pressure level of water.
The parameter used to define cavitation is the Thoma number. The Thoma number is a dimensionless term
indicating the conditions of cavitation under which the machine operates. It is expressed as the ratio of Net
Positive Suction Head NPSH (mWC) to the net Head (mWC) of the operating point. For pump mode, it is
common practice to use the NPSH value as parameter to define cavitation limit such as the incipient limit.
The incipient cavitation limit is defined when the value of NPSH is associated with the beginning of visible
runner cavitation usually detected by observation.
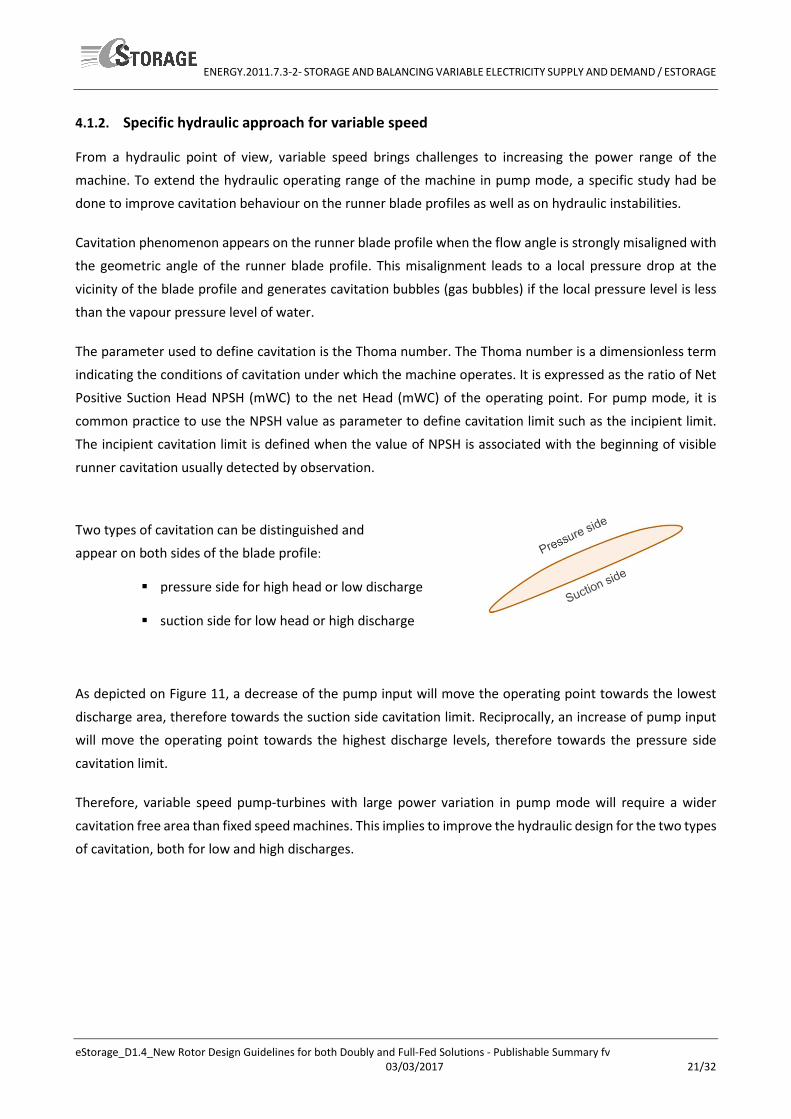
Two types of cavitation can be distinguished and
appear on both sides of the blade profile:
� pressure side for high head or low discharge
� suction side for low head or high discharge
As depicted on Figure 11, a decrease of the pump input will move the operating point towards the lowest
discharge area, therefore towards the suction side cavitation limit. Reciprocally, an increase of pump input
will move the operating point towards the highest discharge levels, therefore towards the pressure side
cavitation limit.
Therefore, variable speed pump-turbines with large power variation in pump mode will require a wider
cavitation free area than fixed speed machines. This implies to improve the hydraulic design for the two types
of cavitation, both for low and high discharges.
ENERGY.2011.7.3-2- STORAGE AND BALANCING VARIABLE ELECTRICITY SUPPLY AND DEMAND / ESTORAGE
eStorage_D1.4_New Rotor Design Guidelines for both Doubly and Full-Fed Solutions - Publishable Summary fv
03/03/2017 22/32
Figure 11: Link between power variation and cavitation constraint in pump mode
In pump mode, instabilities can occur under high head level. This region is shown on the head versus
discharge characteristic on Figure 3 where the head increases with the discharge. In this region, the pump is
not under a stable point and the discharge may vary rapidly for a given head. This zone must be avoided
during pump operation and during start-up. With variable speed technology, if a lower input is requested
under high head, the speed decrease shifts the operating point closer to the pump hump zone as can be seen
on Figure 11.
Consequently, the hump zone location directly impacts and limits the input variation range of the variable
speed machine. Deleting or shifting the hump zone is a clear challenge for hydraulic designers and a specific
attention must be paid to it.
Design approach
4.2.1. Overview of design approach
To find the best hydraulic design for a given project, the principle is first to identify a reference design in the
GE portfolio with hydraulic characteristics close to those of the new project. Then, modifications of the
reference design are performed to optimize the hydraulic performance and adapt it to the project
requirements.
The work presented in this report is based on this methodology. The case study project is representative of
the European market and has the following technical specifications: two units with maximum output lower
than 100 MW and rated head of about 200 mWC.
ENERGY.2011.7.3-2- STORAGE AND BALANCING VARIABLE ELECTRICITY SUPPLY AND DEMAND / ESTORAGE
eStorage_D1.4_New Rotor Design Guidelines for both Doubly and Full-Fed Solutions - Publishable Summary fv
03/03/2017 23/32
4.2.2. Improvements needed from the reference case
Before the start of the 3D design, projection tools are used to evaluate the impact of macroscopic changes
in the design. To ensure a sufficient margin towards the hump zone and the cavitation in pump, the main
objectives of the new design are:
� Improve by 3.5% in Head for the Hump zone
� Improve by 48% in cavitation width
These objectives are particularly challenging because the reference design is already optimized. To fulfil these
objectives, multiple designs are done and the best are tested on scale models.
For the runner, two developments have been planned to be tested (DEV01 and DEV02): The objectives are
cavitation and hump zone while maintaining a good level of hydraulic efficiency both in pump and turbine
modes.
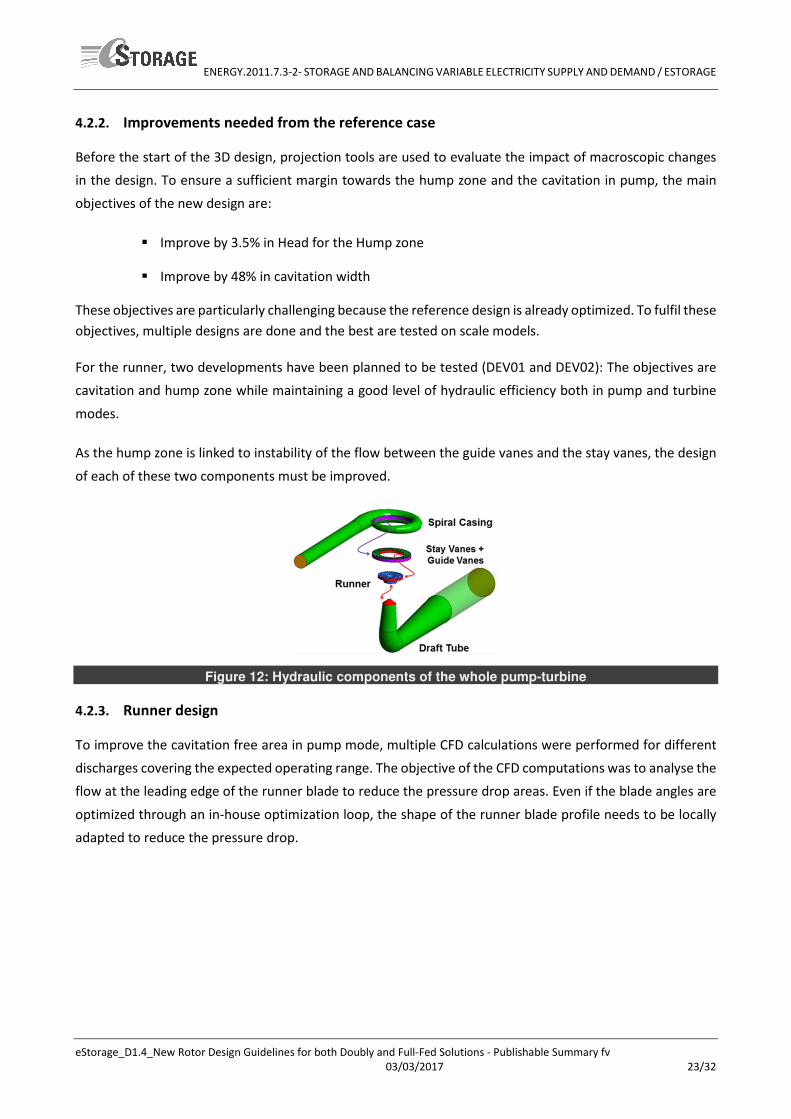
As the hump zone is linked to instability of the flow between the guide vanes and the stay vanes, the design
of each of these two components must be improved.
Figure 12: Hydraulic components of the whole pump-turbine
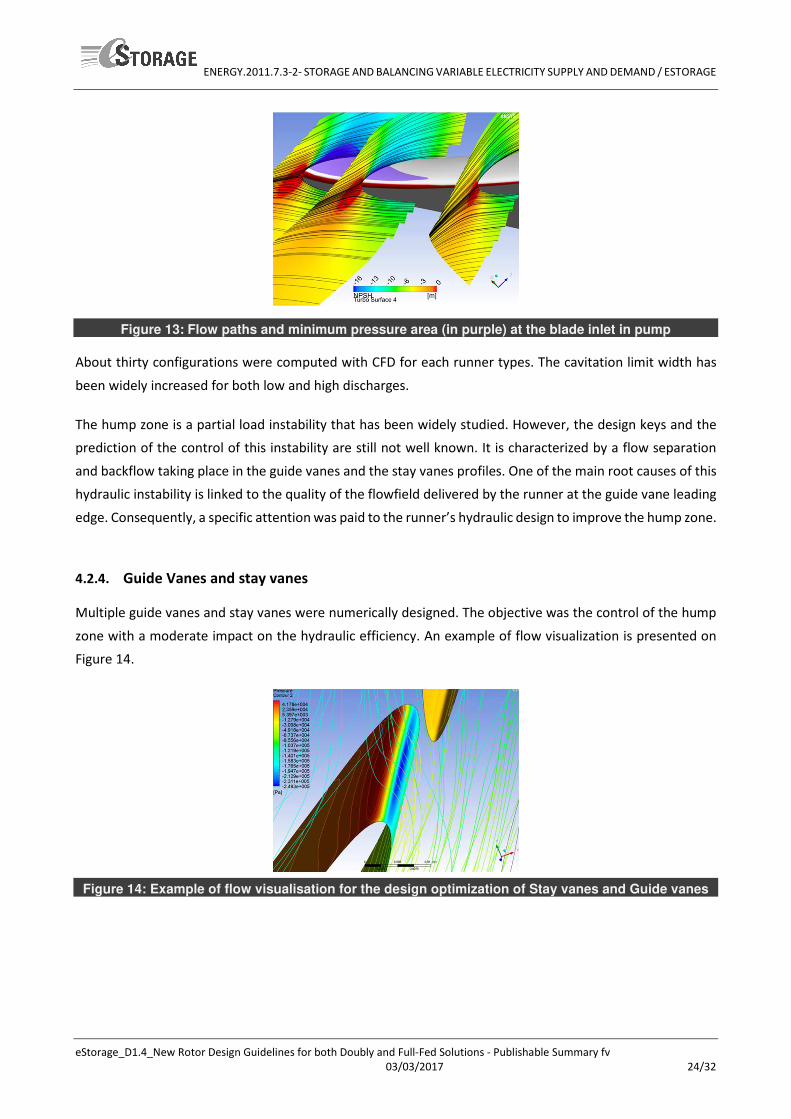
4.2.3. Runner design
To improve the cavitation free area in pump mode, multiple CFD calculations were performed for different
discharges covering the expected operating range. The objective of the CFD computations was to analyse the
flow at the leading edge of the runner blade to reduce the pressure drop areas. Even if the blade angles are
optimized through an in-house optimization loop, the shape of the runner blade profile needs to be locally
adapted to reduce the pressure drop.
ENERGY.2011.7.3-2- STORAGE AND BALANCING VARIABLE ELECTRICITY SUPPLY AND DEMAND / ESTORAGE
eStorage_D1.4_New Rotor Design Guidelines for both Doubly and Full-Fed Solutions - Publishable Summary fv
03/03/2017 24/32
Figure 13: Flow paths and minimum pressure area (in purple) at the blade inlet in pump
About thirty configurations were computed with CFD for each runner types. The cavitation limit width has
been widely increased for both low and high discharges.
The hump zone is a partial load instability that has been widely studied. However, the design keys and the
prediction of the control of this instability are still not well known. It is characterized by a flow separation
and backflow taking place in the guide vanes and the stay vanes profiles. One of the main root causes of this
hydraulic instability is linked to the quality of the flowfield delivered by the runner at the guide vane leading
edge. Consequently, a specific attention was paid to the runner’s hydraulic design to improve the hump zone.
4.2.4. Guide Vanes and stay vanes
Multiple guide vanes and stay vanes were numerically designed. The objective was the control of the hump
zone with a moderate impact on the hydraulic efficiency. An example of flow visualization is presented on
Figure 14.
Figure 14: Example of flow visualisation for the design optimization of Stay vanes and Guide vanes
ENERGY.2011.7.3-2- STORAGE AND BALANCING VARIABLE ELECTRICITY SUPPLY AND DEMAND / ESTORAGE
eStorage_D1.4_New Rotor Design Guidelines for both Doubly and Full-Fed Solutions - Publishable Summary fv
03/03/2017 25/32
Test campaign
4.3.1. Overview of test rig facility
Every hydropower station is unique and is optimized for the unique site conditions such as head, flow
discharge and geodesic particularities. Thanks to a permanent research and development program, hydraulic
design teams at GE use state of the art tools to optimize turbine hydraulic designs. Among those tools, the
hydraulic laboratory in Grenoble, France is key: As an integrated step of the optimization process, each
turbine design is manufactured at model scale and validated by a series of tests in the hydraulic laboratory:
turbine efficiency and output, cavitation, stability, thrust, probing tests and flow observation. The complete
hydraulic behavior of the machine is measured and analyzed to ensure that the properties of the turbine
respond perfectly to the project requirements.
The Grenoble laboratory is equipped with six test-rigs and one hydrodynamic loop including the latest
measurement tools that allow complete testing of Francis, Kaplan, Bulb, Pump-Turbine and Tidal bulb
turbines. The model tests are performed in accordance with the international hydraulic standards IEC 60193.
The turbine models are fitted under the runner with transparent elements to allow visualization,
photography and video records.
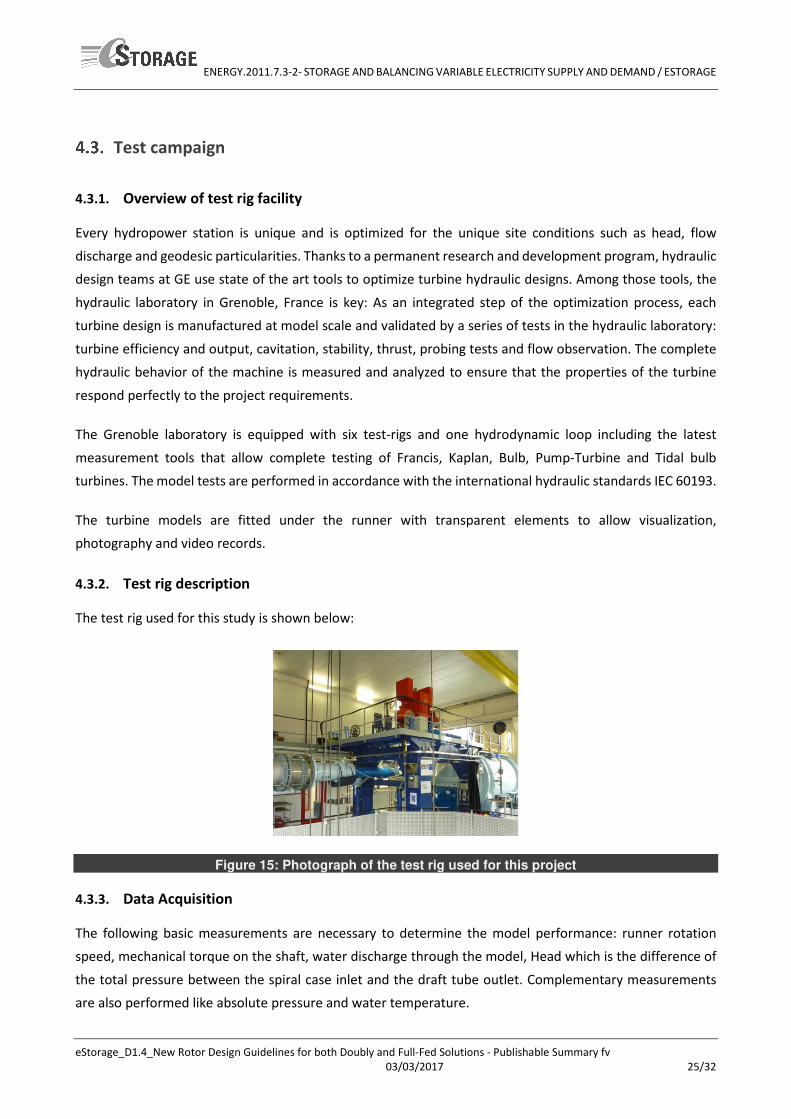
4.3.2. Test rig description
The test rig used for this study is shown below:
Figure 15: Photograph of the test rig used for this project
4.3.3. Data Acquisition
The following basic measurements are necessary to determine the model performance: runner rotation
speed, mechanical torque on the shaft, water discharge through the model, Head which is the difference of
the total pressure between the spiral case inlet and the draft tube outlet. Complementary measurements
are also performed like absolute pressure and water temperature.
ENERGY.2011.7.3-2- STORAGE AND BALANCING VARIABLE ELECTRICITY SUPPLY AND DEMAND / ESTORAGE
eStorage_D1.4_New Rotor Design Guidelines for both Doubly and Full-Fed Solutions - Publishable Summary fv
03/03/2017 26/32
Result and analysis
4.4.1. Pump results
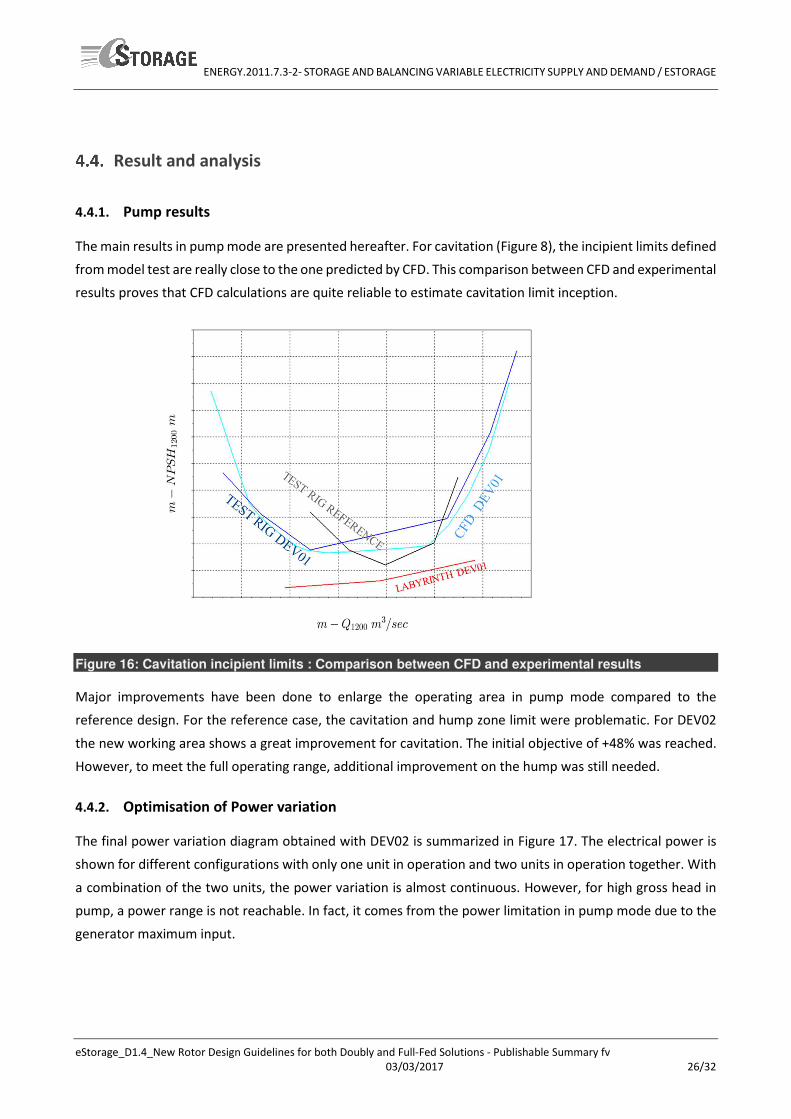
The main results in pump mode are presented hereafter. For cavitation (Figure 8), the incipient limits defined
from model test are really close to the one predicted by CFD. This comparison between CFD and experimental
results proves that CFD calculations are quite reliable to estimate cavitation limit inception.
Figure 16: Cavitation incipient limits : Comparison between CFD and experimental results
Major improvements have been done to enlarge the operating area in pump mode compared to the
reference design. For the reference case, the cavitation and hump zone limit were problematic. For DEV02
the new working area shows a great improvement for cavitation. The initial objective of +48% was reached.
However, to meet the full operating range, additional improvement on the hump was still needed.
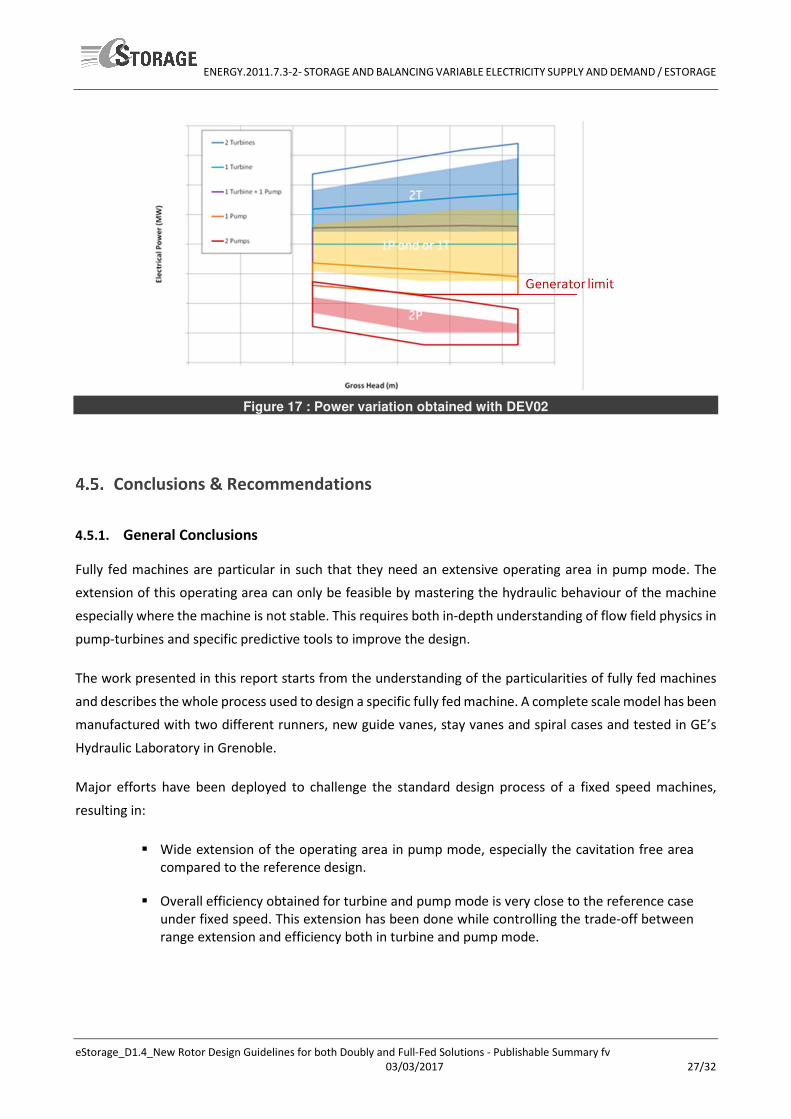
4.4.2. Optimisation of Power variation
The final power variation diagram obtained with DEV02 is summarized in Figure 17. The electrical power is
shown for different configurations with only one unit in operation and two units in operation together. With
a combination of the two units, the power variation is almost continuous. However, for high gross head in
pump, a power range is not reachable. In fact, it comes from the power limitation in pump mode due to the
generator maximum input.
ENERGY.2011.7.3-2- STORAGE AND BALANCING VARIABLE ELECTRICITY SUPPLY AND DEMAND / ESTORAGE
eStorage_D1.4_New Rotor Design Guidelines for both Doubly and Full-Fed Solutions - Publishable Summary fv
03/03/2017 27/32
Figure 17 : Power variation obtained with DEV02
Conclusions & Recommendations
4.5.1. General Conclusions
Fully fed machines are particular in such that they need an extensive operating area in pump mode. The
extension of this operating area can only be feasible by mastering the hydraulic behaviour of the machine
especially where the machine is not stable. This requires both in-depth understanding of flow field physics in
pump-turbines and specific predictive tools to improve the design.
The work presented in this report starts from the understanding of the particularities of fully fed machines
and describes the whole process used to design a specific fully fed machine. A complete scale model has been
manufactured with two different runners, new guide vanes, stay vanes and spiral cases and tested in GE’s
Hydraulic Laboratory in Grenoble.
Major efforts have been deployed to challenge the standard design process of a fixed speed machines,
resulting in:
� Wide extension of the operating area in pump mode, especially the cavitation free area
compared to the reference design.
� Overall efficiency obtained for turbine and pump mode is very close to the reference case
under fixed speed. This extension has been done while controlling the trade-off between
range extension and efficiency both in turbine and pump mode.

ENERGY.2011.7.3-2- STORAGE AND BALANCING VARIABLE ELECTRICITY SUPPLY AND DEMAND / ESTORAGE
eStorage_D1.4_New Rotor Design Guidelines for both Doubly and Full-Fed Solutions - Publishable Summary fv
03/03/2017 28/32
4.5.2. Suggestion for future research
The design requirements to improve the cavitation inception are now well known and this improvement can
be done without sacrificing the efficiency. This is not the case for the hump zone prediction. This instability
area is difficult to predict with the same numerical tools used for efficiency prediction. More accurate
numerical tools and with more embedded physics need to be developed and/or tested. Such tools require
also large computational capacities.
ENERGY.2011.7.3-2- STORAGE AND BALANCING VARIABLE ELECTRICITY SUPPLY AND DEMAND / ESTORAGE
eStorage_D1.4_New Rotor Design Guidelines for both Doubly and Full-Fed Solutions - Publishable Summary fv
03/03/2017 29/32
5 INSULATION SYSTEM OF CONVERTER FED MACHINES
Development for large double-fed machines
Standard corona protection systems for large high voltage generators are optimized for 50 and 60 Hz,
therefore these systems must be adapted to converter applications. Due to this, the impact of the voltage
shape on the partial discharge inception was studied in the lab starting in 2012 and finally confirmed by
electrical measurements on the installed winding of the large-scale prototype motor-generator rotor for the
Linthal PSP project. The impact of the main parameters such as peak voltages in operation conditions as well
as air distances was studied to confirm the PD inception for different design solutions. The measurements
were done using different voltage patterns e.g. variation of frequency and voltage rise time. The
investigations on corona protection finally lead to the implementation of a system with grounded winding
caps, a new GE patented concept.
Per IEC 60034-18-42, the corona protection system of a bar must be tested with converter impulse voltage.
The test can be done by an impulse generator which reproduces equivalent pulse patterns. The test peak
voltage amplitude, slew rate and switching frequency on the specimen must be at least as severe as in the
severest operation mode. The bars must be mounted in a mock up to simulate the real operating
conditions. For example, a bar must be installed in a slot device with round-packing and any relevant
neighbouring elements around it.
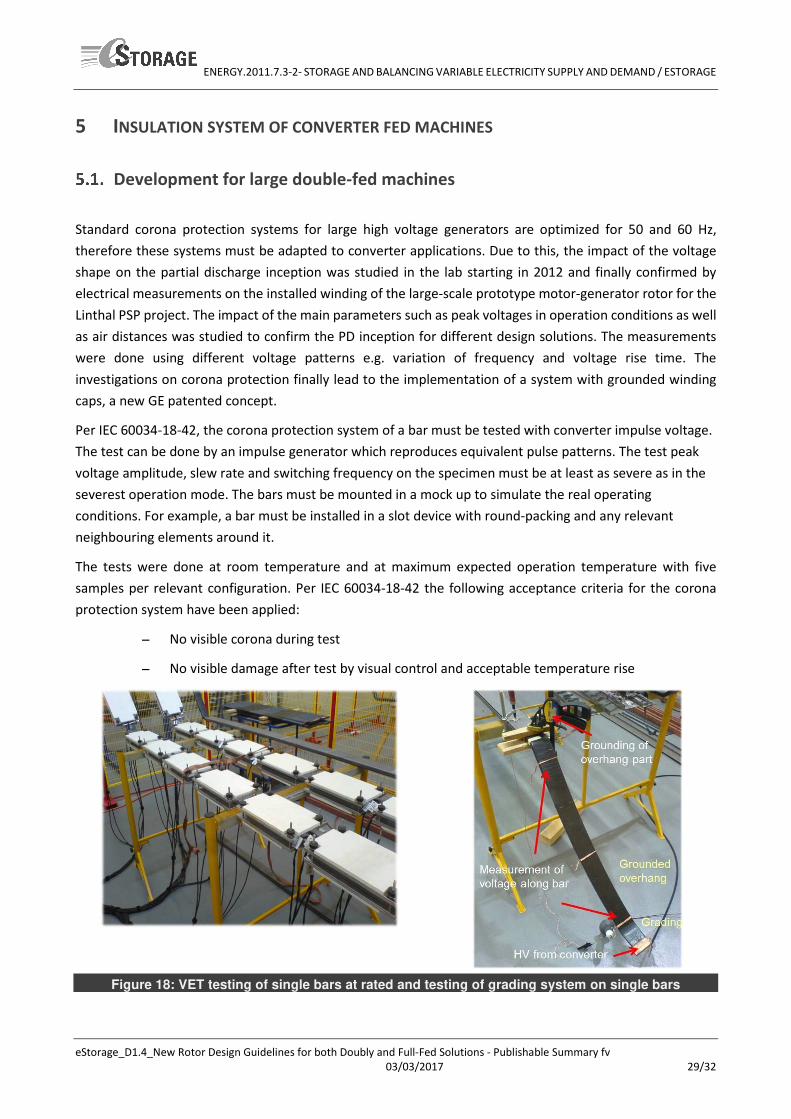
The tests were done at room temperature and at maximum expected operation temperature with five
samples per relevant configuration. Per IEC 60034-18-42 the following acceptance criteria for the corona
protection system have been applied:
− No visible corona during test
− No visible damage after test by visual control and acceptable temperature rise
Figure 18: VET testing of single bars at rated and testing of grading system on single bars
ENERGY.2011.7.3-2- STORAGE AND BALANCING VARIABLE ELECTRICITY SUPPLY AND DEMAND / ESTORAGE
eStorage_D1.4_New Rotor Design Guidelines for both Doubly and Full-Fed Solutions - Publishable Summary fv
03/03/2017 30/32
The first validation tests have identified the following elements as the most important criteria to be
considered in the detailed design and industrialization process:
− PD inception due to air distances
− Tolerances of rotor bars (CTQ)
− Rotor bar surface voltage (VSI pulse)
To mitigate the risk for partial discharges between rotor bars and overhang support a new grading system
with grounded insulation caps was developed. This new patented concept incorporated several new
developments such as high conductive tapes and insulation caps.
The lessons learnt from the assembly of the large-scale mock-up were implemented during the first
installation of the motor-generator rotor in the Linthal PSP in 2014. Nevertheless, several improvements on
tools and procedures were identified and adapted to the conditions at site. These lessons learnt are today
transferred to the engineering of other projects which are currently under manufacturing.
Recent Developments
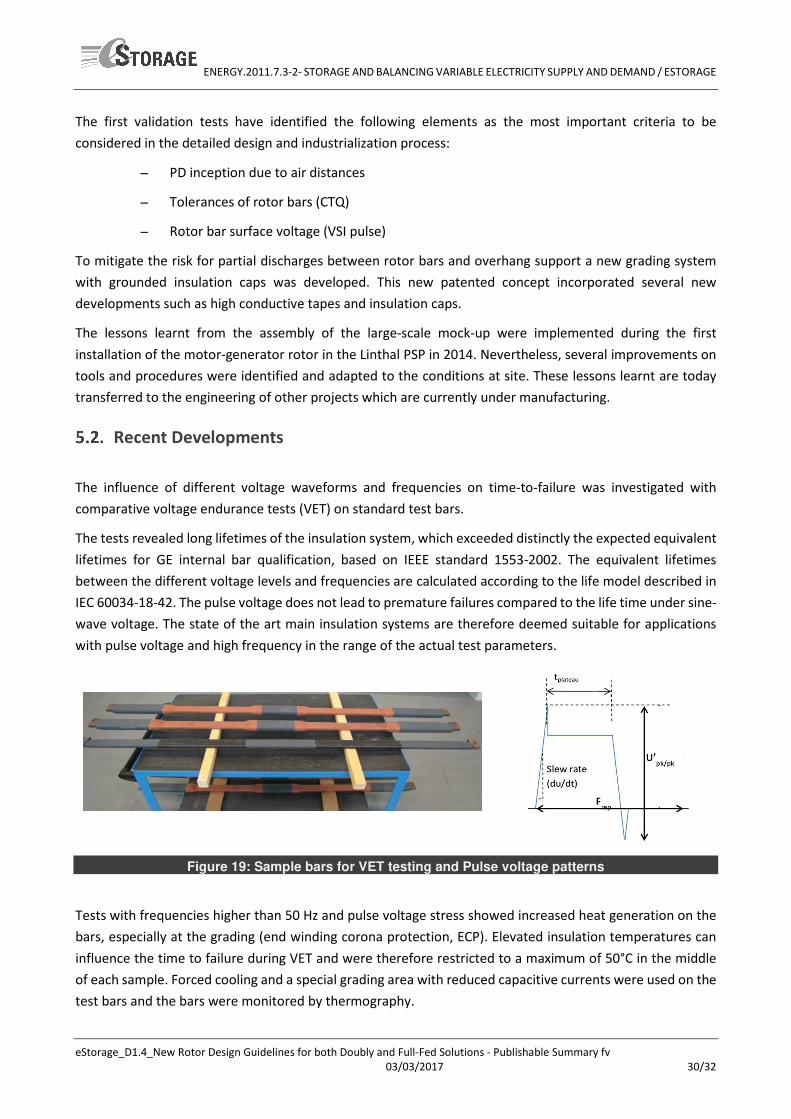
The influence of different voltage waveforms and frequencies on time-to-failure was investigated with
comparative voltage endurance tests (VET) on standard test bars.
The tests revealed long lifetimes of the insulation system, which exceeded distinctly the expected equivalent
lifetimes for GE internal bar qualification, based on IEEE standard 1553-2002. The equivalent lifetimes
between the different voltage levels and frequencies are calculated according to the life model described in
IEC 60034-18-42. The pulse voltage does not lead to premature failures compared to the life time under sine-
wave voltage. The state of the art main insulation systems are therefore deemed suitable for applications
with pulse voltage and high frequency in the range of the actual test parameters.
Figure 19: Sample bars for VET testing and Pulse voltage patterns
Tests with frequencies higher than 50 Hz and pulse voltage stress showed increased heat generation on the
bars, especially at the grading (end winding corona protection, ECP). Elevated insulation temperatures can
influence the time to failure during VET and were therefore restricted to a maximum of 50°C in the middle
of each sample. Forced cooling and a special grading area with reduced capacitive currents were used on the
test bars and the bars were monitored by thermography.
ENERGY.2011.7.3-2- STORAGE AND BALANCING VARIABLE ELECTRICITY SUPPLY AND DEMAND / ESTORAGE
eStorage_D1.4_New Rotor Design Guidelines for both Doubly and Full-Fed Solutions - Publishable Summary fv
03/03/2017 31/32
Voltage source converters generate harmonic frequency content by their switching for the output voltage
modulation (PWM). It results in a significant stress increase on the corona protection system (CPS) compared
to grid frequency sine-wave voltage. The main reasons are the pulse slopes and the frequent switching of the
converter.
The typical voltage pulse contains steep slopes (several 100V/μs to kVs/μs) that pass through the capacitive
main insulation easier than a 50Hz sine-wave due to their higher frequency content. The resulting capacitive
current increase through the main insulation causes higher ohmic losses in the corona protection system
before the current can reach ground potential in the slot. This can build up a significant voltage potential
already along the slot exit. The high capacitive current is not a concern for the main insulation itself because
it is almost free of losses.
The switching frequency of a converter is a multiple of the grid frequency. During each switching event, the
current driven by the pulse slopes stresses the corona protection system. It results in a multiple of stress
events compared to the grid frequency during the same time interval.
In the grading, the capacitive currents of the pulses also cause a shortened active grading length that
concentrates the voltage stress.
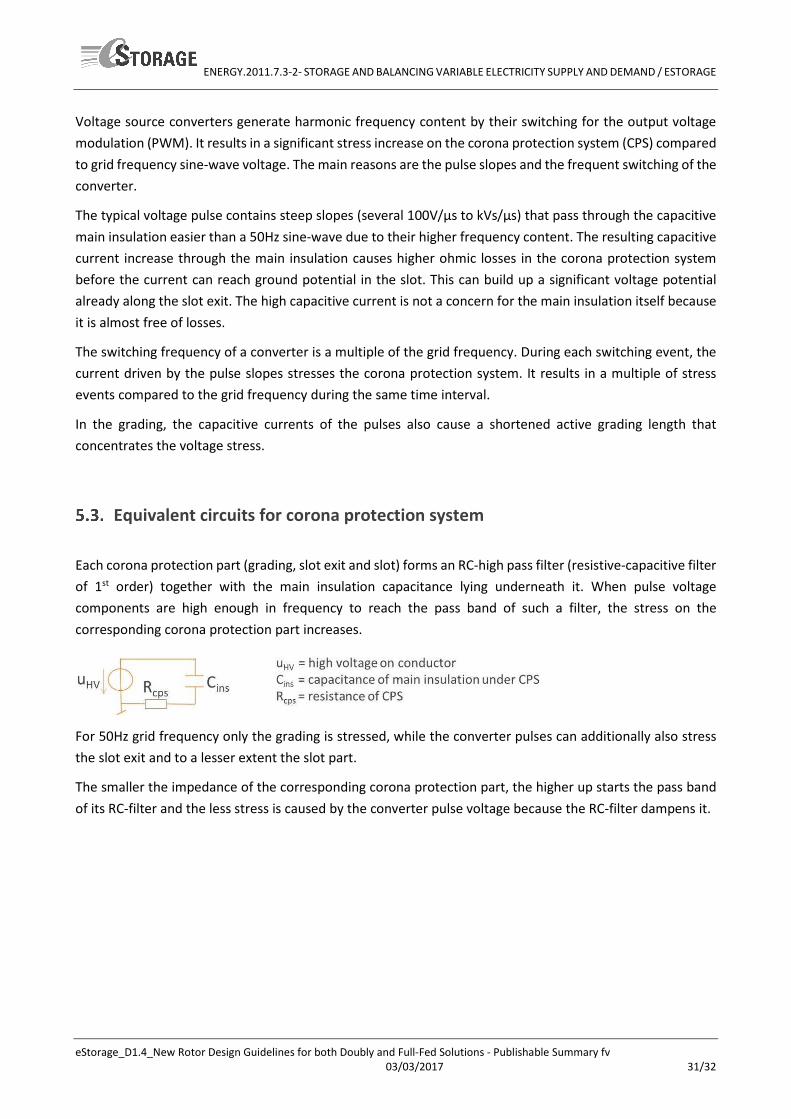
Equivalent circuits for corona protection system
Each corona protection part (grading, slot exit and slot) forms an RC-high pass filter (resistive-capacitive filter
of 1st order) together with the main insulation capacitance lying underneath it. When pulse voltage
components are high enough in frequency to reach the pass band of such a filter, the stress on the
corresponding corona protection part increases.
For 50Hz grid frequency only the grading is stressed, while the converter pulses can additionally also stress
the slot exit and to a lesser extent the slot part.
The smaller the impedance of the corresponding corona protection part, the higher up starts the pass band
of its RC-filter and the less stress is caused by the converter pulse voltage because the RC-filter dampens it.
ENERGY.2011.7.3-2- STORAGE AND BALANCING VARIABLE ELECTRICITY SUPPLY AND DEMAND / ESTORAGE
eStorage_D1.4_New Rotor Design Guidelines for both Doubly and Full-Fed Solutions - Publishable Summary fv
03/03/2017 32/32
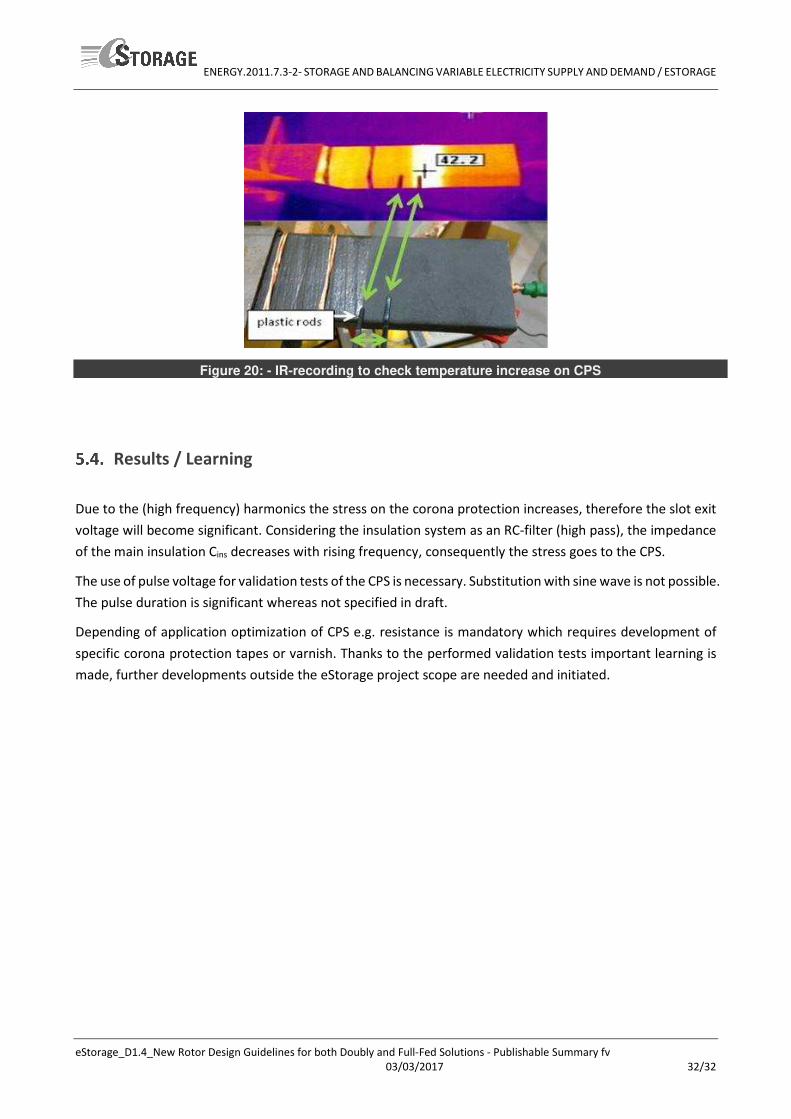
Figure 20: - IR-recording to check temperature increase on CPS
Results / Learning
Due to the (high frequency) harmonics the stress on the corona protection increases, therefore the slot exit
voltage will become significant. Considering the insulation system as an RC-filter (high pass), the impedance
of the main insulation Cins decreases with rising frequency, consequently the stress goes to the CPS.
The use of pulse voltage for validation tests of the CPS is necessary. Substitution with sine wave is not possible.
The pulse duration is significant whereas not specified in draft.
Depending of application optimization of CPS e.g. resistance is mandatory which requires development of
specific corona protection tapes or varnish. Thanks to the performed validation tests important learning is
made, further developments outside the eStorage project scope are needed and initiated.