Estimation of water retention behaviour of bentonite based ...
69
This is an electronic reprint of the original article. This reprint may differ from the original in pagination and typographic detail. Powered by TCPDF (www.tcpdf.org) This material is protected by copyright and other intellectual property rights, and duplication or sale of all or part of any of the repository collections is not permitted, except that material may be duplicated by you for your research use or educational purposes in electronic or print form. You must obtain permission for any other use. Electronic or print copies may not be offered, whether for sale or otherwise to anyone who is not an authorised user. Abed, Ayman; Sołowski, Wojciech Tomasz Estimation of water retention behaviour of bentonite based on mineralogy and mercury intrusion porosimetry tests Published in: Géotechnique DOI: 10.1680/jgeot.18.P.220 Published: 01/06/2021 Document Version Peer reviewed version Please cite the original version: Abed, A., & Soowski, W. T. (2021). Estimation of water retention behaviour of bentonite based on mineralogy and mercury intrusion porosimetry tests. Géotechnique, 71(6), 494-508. [220]. https://doi.org/10.1680/jgeot.18.P.220
Transcript of Estimation of water retention behaviour of bentonite based ...

This is an electronic reprint of the original article.This reprint may differ from the original in pagination and typographic detail.
Powered by TCPDF (www.tcpdf.org)
This material is protected by copyright and other intellectual property rights, and duplication or sale of all or part of any of the repository collections is not permitted, except that material may be duplicated by you for your research use or educational purposes in electronic or print form. You must obtain permission for any other use. Electronic or print copies may not be offered, whether for sale or otherwise to anyone who is not an authorised user.
Abed, Ayman; Sołowski, Wojciech TomaszEstimation of water retention behaviour of bentonite based on mineralogy and mercuryintrusion porosimetry tests
Published in:Géotechnique
DOI:10.1680/jgeot.18.P.220
Published: 01/06/2021
Document VersionPeer reviewed version
Please cite the original version:Abed, A., & Soowski, W. T. (2021). Estimation of water retention behaviour of bentonite based on mineralogyand mercury intrusion porosimetry tests. Géotechnique, 71(6), 494-508. [220].https://doi.org/10.1680/jgeot.18.P.220

Accepted manuscript doi: 10.1680/jgeot.18.P.220
Accepted manuscript As a service to our authors and readers, we are putting peer-reviewed accepted manuscripts (AM) online, in the Ahead of Print section of each journal web page, shortly after acceptance.
Disclaimer The AM is yet to be copyedited and formatted in journal house style but can still be read and referenced by quoting its unique reference number, the digital object identifier (DOI). Once the AM has been typeset, an ‘uncorrected proof’ PDF will replace the ‘accepted manuscript’ PDF. These formatted articles may still be corrected by the authors. During the Production process, errors may be discovered which could affect the content, and all legal disclaimers that apply to the journal relate to these versions also.
Version of record The final edited article will be published in PDF and HTML and will contain all author corrections and is considered the version of record. Authors wishing to reference an article published Ahead of Print should quote its DOI. When an issue becomes available, queuing Ahead of Print articles will move to that issue’s Table of Contents. When the article is published in a journal issue, the full reference should be cited in addition to the DOI.
Downloaded by [ Aalto University Library] on [20/04/20]. Copyright © ICE Publishing, all rights reserved.

Accepted manuscript doi: 10.1680/jgeot.18.P.220
Submitted: 07 September 2018
Published online in ‘accepted manuscript’ format: 10 March 2020
Manuscript title: Estimation of water retention behaviour of bentonite based on mineralogy
and mercury intrusion porosimetry tests
Authors: Ayman A. Abed* and Wojciech T. Sołowski*
Affiliation: *Department of Civil Engineering, Aalto University, Espoo, Finland
Corresponding author: Ayman A. Abed, Department of Civil Engineering, Aalto
University, P.O. Box 12100, FI-00076 Aalto, Finland. Tel.: +358 50 4088908.
E-mail: [email protected]
Downloaded by [ Aalto University Library] on [20/04/20]. Copyright © ICE Publishing, all rights reserved.

Accepted manuscript doi: 10.1680/jgeot.18.P.220
Abstract
This paper develops a water retention model based on the soil mineralogy and microscopic features of the
material behaviour. The model estimates the water content at a given total suction as the sum of the bentonite
minerals interlayer water and the water in the interparticle pores. The paper proposes simple formulae to
estimate the interlayer water content and interlayer void ratio based on mineralogical properties. Additionally,
the model uses the mercury intrusion porosimetry measurements to approximate the water content in the larger
pores. The validation of the proposed procedure relies on published data for MX-80 and GMZ bentonites and
yields promising results. Even though the discussion and the validation are restricted to bentonite here, the
procedure is generic in nature and can be modified easily for other geomaterials. The paper also offers insights
into the links between soil microstructure and its macroscopic behaviour. The contribution provides a new tool
for quick indirect estimation of the water retention behaviour of porous materials with known mineral
composition and available microstructural data, e.g. based on the mercury intrusion porosimetry tests. Such tool
is of high practical interest in design e.g. nuclear waste repositories where large material pool may be initially
considered.
Downloaded by [ Aalto University Library] on [20/04/20]. Copyright © ICE Publishing, all rights reserved.

Accepted manuscript doi: 10.1680/jgeot.18.P.220
INTRODUCTION
The soil water retention curve characterises the ability of a particular porous material to hold
water at a given suction value (s). Usually it is defined as a continuous relationship between
suction and water content (w), or between suction and degree of saturation (Sl) (Fredlund &
Rahardjo, 1993). This relationship, being also known as soil water characteristic curve
(SWCC), is a fundamental constitutive equation which plays a central role in the Thermo-
Hydro-Mechanical-Chemical (THMC) coupled behaviour of unsaturated porous material
(Abed & Sołowski, 2017). The correct estimation of the water retention curve is especially
important for clay-rich materials such as bentonite, due to high water retaining ability under
high suction resulting in a very low hydraulic conductivity. Low conductivity, self-sealing
ability due to swelling, together with durability typical to natural mineral materials, lead to
bentonite being the material to be used for the sealing of high-level nuclear waste (Bucher et
al., 1989; Sellin & Leupin, 2013; Pusch, 2015). Due to the complex surrounding
environmental conditions, as well as the time scale, the design of such repository requires
accurate prediction of the material behaviour and thus the solution of Thermo-Hydro-
Mechanical-Chemical coupled balance equations with advanced numerical methods (Olivella
et al., 1996; Thomas & He, 1997; Collin et al., 2002; Wu et al., 2004; Abed & Sołowski,
2017). This paper presents a new water-retention model that links the water retention
behaviour of the soil to the minerals present in the material, as well as to the pore size
distribution. The inclusion of microstructure leads to a more accurate understanding of the
material evolution caused by wetting and drying or by other factors that influence the water
retention curve. It also opens up the constitutive modelling of clay to the wealth of
information about the material microstructure coming from the experiments as well as
numerical methods such as molecular dynamics. Inclusion of the microstructure related
Downloaded by [ Aalto University Library] on [20/04/20]. Copyright © ICE Publishing, all rights reserved.
Accepted manuscript doi: 10.1680/jgeot.18.P.220
knowledge from physics and chemistry would give the THMC framework an additional
physical basis and an extra link (and associated limits related to material behaviour) between
material macroscopic behaviour and its microstructure and mineralogy. For example, pore
structure may be linked with transport properties and material parameters, leading to an
increase of the reliability of the long-term predictions, as one would have physical link
instead of uncertain parameter values.
There are several methods to obtain the water retention curve (Zielinski et al., 2010), though
the related tests are usually time consuming and relatively expensive. In general, the water
retention curve shows irreversible hysteric behaviour during drying and wetting. The
hysteresis is attributed to several reasons including the non-uniformity of the pores leading to
the inkbottle effect, the difference in contact angle in wetting and drying phases and the
entrapped air within the pores during drying process (Haines, 1930). The accumulated
research data also reveal other factors that influence the water retention curve including, but
not restricted to: i) initial dry density (void ratio), ii) temperature, iii) chemical and salt
concentration (Jacinto et al., 2009; Kuusela-Lahtinen et al., 2016). Ideally, all the
aforementioned factors should be addressed during modelling.
As the laboratory tests measure a limited number of points of the water retention curve, to get
a continuous curve suitable for numerical implementation in a THMC code, one fits the
experimental data with a mathematical function. Leong & Rahardjo (1997) provide a detailed
review of the classical formulae for the soil water characteristic curves. Initially, the aim of
the majority of these expressions was to fit data for common agricultural and geotechnical
practical applications, hence they assume the water retention curve to be constant throughout
the analysis (Fredlund & Rahardjo, 1993). However, in special engineering applications,
Downloaded by [ Aalto University Library] on [20/04/20]. Copyright © ICE Publishing, all rights reserved.

Accepted manuscript doi: 10.1680/jgeot.18.P.220
where there is a need to consider the complex coupling between the mechanical, hydraulic,
thermal and chemical effects on the material, classical models limitations emerge.
It now seems that to capture the THMC effects accurately, one has to account for the
microstructural influence on the overall material behaviour (Gens & Alonso, 1992; Delage et
al., 2006; Tarantino, 2009; Romero et al., 2011; Musso et al., 2013; Seiphoori et al., 2014;
Della Vecchia et al., 2015), which is a significant challenge.
Fig. 1 illustrates a schematic representation of the pore structure in a clay-rich soil. Taking
the pore-diameter as the classification criterion, three structural levels may be
distinguished (Romero, 1999; Delage et al., 2006; Monroy et al., 2010; Seiphoori et al.,
2014):
(a) Macro-level (inter-aggregate pores): includes all the pores with diameter larger
than approximately 200nm (0.2m).
(b) Micro-level (intra-aggregate pores): typically gathers all the pores with diameter
in the range [1.2nm (12Å)-200nm].
(c) Intra-particle level: includes the interlayer spaces, which vary depending on the
degree of saturation. At full saturation, it contains all the spaces with interlayer
distance less than 1.2nm (12Å).
It is worthwhile to mention that the provided limits to distinguish these structural levels are
approximate and generally depend on the tested material. They are given here mainly to give
an example of the typical pore size ranges.
The mercury intrusion porosimetry (MIP) test results give information on the microstructure
of the porous material. Depending on the used apparatus, MIP allows to investigate pore
diameters in the range 4nm ~ 400m which covers the structural levels a and b.
Downloaded by [ Aalto University Library] on [20/04/20]. Copyright © ICE Publishing, all rights reserved.

Accepted manuscript doi: 10.1680/jgeot.18.P.220
As discussed later in the paper, MIP can help in estimation of the drying branch of soil water
retention curve (Romero et al., 1999; Simms & Yanful, 2002; Nowamooz & Masrouri, 2010;
Della Vecchia et al., 2015). The existing water retention models (Romero et al., 1999; Simms
& Yanful, 2002; Nowamooz & Masrouri, 2010) which use MIP data, rely on the porosimetry
measurements only, without any in-depth consideration of the mineralogy effect on the
interlayer water (structural level c that is not detected by MIP) or discussion of the effect of
freeze-drying on the fabric structure before any mercury intrusion takes place. For instance,
Romero et al. (1999) proposed an expression, that has been later adopted by Nowamooz &
Masrouri (2010), to estimate the water retention curve based on MIP data. The expression
contains a term that accounts for the residual water content that resides in the structural level
c. However, that term has no derivation shown and is treated just as a fitting parameter. The
mentioned existing models, which rely on porosimetry, can be quite accurate when the
amount of this residual water content is negligible, that is in relatively coarse materials with
low specific surface. However, for the materials that have large specific surface (such as
bentonite), with the majority of water stored in the interlayers, the mercury intrusion
porosimetry test alone is insufficient to reproduce the water retention properties. That is due
to both the sample preparation procedures, and the test itself, as MIP does not allow for an
accurate assessment of the sizes of interlayer pores.
Saiyouri et al. (2000), Likos & Wayllace (2010), Villar et al. (2012) and Bestel et al. (2014)
provided data about the evolution of interlayer water content in bentonite. However, these
data, so far, have not been used to improve the existing soil water characteristic curve
models. Therefore, this paper employs these data to introduce a novel procedure for
estimating the water retention curve. Additionally, the proposed model accounts for the
mineralogical properties of the material, such as its specific surface, as well as the
Downloaded by [ Aalto University Library] on [20/04/20]. Copyright © ICE Publishing, all rights reserved.

Accepted manuscript doi: 10.1680/jgeot.18.P.220
information related to the pore structure, obtained e.g. from the mercury intrusion
porosimetry tests.
This study divides the total water content into the interlayer water content, consisting of
water in between elementary clay layers and the interparticle water content, entailing water
outside the particles. The model estimates the interlayer water content based on the basal
distance between the clay particles and the specific surface of the bentonite, whereas the
interparticle water content is estimated based on the MIP results. The paper proposes new
formulae, e.g. to determine the interlayer water content, and computes the total water content
as the total of the interlayer water content and the scaled interparticle water content obtained
from MIP. The introduction of the scaling is justified by the need to compensate for the
shrinkage happening at the clay particle level during the freeze-drying of the sample.
The proposed framework is validated against experimental data and gives very promising
results. In principle, the approach is generic and can be used for any clay geomaterial, which
has significant amount of water captured in the clay interlayer. The authors stress, however,
that this method is not proposed, by any means, to replace the direct measurements of the
SWCC but rather as a supporting tool for indirect estimation of the retention properties,
especially useful in cases when the direct measurements of water retention behaviour are not
available, or not feasible due to time constrains and costs (e.g. in preliminary estimation of
properties during initial material pre-selection for large engineering projects).
WATER IN GRANULAR MATERIALS
When a conventional dry granular material is wetted, the water fills the smallest pores first
followed by the larger ones until reaching full saturation. However, the water in the interlayer
pores is chemically bound to the bentonite. The amount of this chemically bound water
particles is in equilibrium with the water in the other pores and thus is linked to the total
Downloaded by [ Aalto University Library] on [20/04/20]. Copyright © ICE Publishing, all rights reserved.

Accepted manuscript doi: 10.1680/jgeot.18.P.220
suction value, but is not directly related to the pore size. Therefore, the interlayer pores may
still not be filled with the maximum number of water particles before some of the other pores
are filled with water.
This paper in particular is focused on bentonite applied to the sealing of nuclear waste
storages, which tends to be saturated at almost constant volume. Such bentonite does not
follow the classical wetting curve. Similarly, in these applications, the cycles of wetting and
drying are not expected; hence, the hysteric behaviour is neglected at this stage of the study.
These assumptions are supported by several experimental findings on the slight observed
hysteresis in the SWCC of illite and montmorillonite-rich materials (Branson & Newman,
1983; Kraehenbuehl et al., 1987; Delage et al., 1998; Gens & Alonso, 1992).
It is also assumed that the water resides only in two main domains: i) the interlayer spaces
(structural level c), where it is named as interlayer water ( and ii) in the pores outside
the interlayer spaces (structural levels a and b), consisting of intra- and inter-aggregate pores,
where it is referred to as interparticle water. A fundamental assumption here is that the water
in these two spaces are considered to be in hydraulic and chemical equilibrium so that they
have the same total suction value at any point in time. Consequently, the total degree of
saturation is expressed as:
(1)
where and represent the contribution of the interlayer water and the interparticle
water to the total degree of saturation, respectively. The interlayer water content contribution
is defined as:
(2)
Downloaded by [ Aalto University Library] on [20/04/20]. Copyright © ICE Publishing, all rights reserved.

Accepted manuscript doi: 10.1680/jgeot.18.P.220
where is the saturated water content of the geomaterial. The interparticle water
contribution is derived based on MIP data.
This paper aims to give a method to quantify these two components of water content, as well
as to show how those can help in estimation of the soil water retention curve. The following
section explains a simplified yet efficient method to estimate the interlayer water
contribution based on mineralogy. Other, though comparable, derivation of this quantity is
given in Tournassat & Appelo (2011). A later section shows how to estimate the interparticle
water contribution based on mercury intrusion porosimetry measurements.
SIMPLIFIED METHOD TO ESTIMATE INTERLAYER WATER CONTENT AND
POROSITY
The total specific surface is the ratio of the surface area of a material to its mass. For a soil
sample, it can be estimated based on the direct experimental measurements. Theoretically,
with reference to Fig. 2, a clay sample composed from a single mineral has the total specific
surface
(3)
where is the total number of clay particles per unit mass of the material, is the total
number of layers per one clay particle and is the surface area of one clay layer. Fig. 2
provides an additional explanation of the symbols.
Consequently, assuming that the available interlayer spaces is fully saturated at any total
suction value, the water content in the interlayer is:
[ ( ] ⏟
(4)
Downloaded by [ Aalto University Library] on [20/04/20]. Copyright © ICE Publishing, all rights reserved.

Accepted manuscript doi: 10.1680/jgeot.18.P.220
where and are the number of water layers on the external and internal surface of a
single clay particle, respectively (see Fig. 2 for more clarification). The symbols and
denote the thickness of one water layer and the interlayer water density,
respectively.
Taking into account the expression for the specific surface in Equation (3) one finds:
[ ( ]
(5)
For the clay particles and (Saiyouri et al., 2000), which allows for a
simplification
and
, leading to:
(6)
The symbol represents the interlayer distance which is mineral and saturation
dependent (Saiyouri et al., 2000; Likos & Wayllace, 2010; Villar et al., 2012; Bestel et al.,
2014).
For a soil that consists of more than a single mineral (let be the total number of composing
minerals), Equation (6) becomes:
∑
(7)
where is the percentage of the ith composing mineral by weight of total solids and is
the interlayer water content of the ith composing mineral calculated according to Equation (6).
Equation (7) demonstrates that the total water content in the interlayer is the sum of the
contribution of the interlayer water content for all the composing minerals ( ). In this
case, and are mineral dependent and should be correctly considered during
calculation.
Downloaded by [ Aalto University Library] on [20/04/20]. Copyright © ICE Publishing, all rights reserved.

Accepted manuscript doi: 10.1680/jgeot.18.P.220
In what follows the interlayer water density is assumed to be constant Mg/m3
which is a first order approximation (Jacinto et al., 2012; Marcial, 2011).
Fig. 3 compiles the measured interlayer distance versus suction in case of MX-80
bentonite conditions (Bestel et al., 2014; Saiyouri et al., 2000), similar data can also be
found in Villar et al. (2012) and Chipera et al. (1998). It is worth mentioning that molecular
dynamics simulations produce comparable data (Hsiao & Hedström, 2017) which provide a
promising tool that might be utilized to generalize the method in the future. The measured
data points were fitted by employing the least squares method, assuming an exponential
fitting function of the form:
, (8)
where the total suction is estimated in kPa. The analysis led to the values of fitting
parameters = 9.237 [Å] and [1/kPa].
Combining the data depicted in Fig. 3 with Equation (7) for MX-80 bentonite with = 82%
montmorillonite and specific surface of = 522m2/g (Delage et al., 2006) gives the
interlayer water content as shown in Fig. 4 with respect to suction. The suction appears here
through the dependency of on suction in Equation (8). It is assumed that other
composing minerals of bentonite have marginal effect on the interlayer water content and as
such, they were neglected with in this case. Obviously, the curve linking suction and
interlayer water content is material dependent. For materials with a low specific surface, the
interlayer water content will be low as well and the interlayer spacing will be smaller. For
example, if the specific surface of MX-80 bentonite would be much lower, e.g. 40m2/g
(typical value for kaolinite), its interlayer water content would be much lower (see Fig. 4).
Downloaded by [ Aalto University Library] on [20/04/20]. Copyright © ICE Publishing, all rights reserved.

Accepted manuscript doi: 10.1680/jgeot.18.P.220
The interlayer water in Equation (7) shows significant dependency on the specific surface of
the material. This is in line with the experimental findings provided by other researchers (e.g
Marinho, 2005) who found that the clay ability to hold water at high suction values is
commensurate with the liquid limit and consequently the specific surface. Unfortunately,
the data provided by Marinho (2005) is for common clays with maximum < 120%.
Bentonite has > 300% and therefore no meaningful comparison is possible at this stage.
Once the proposed method in this paper is generalised, such statistical method would be of
significance for validation purposes.
Based on the fundamental relationships between the soil physical properties (Holtz &
Kovacs, 1981), the interlayer water content relates to the interlayer void ratio and
the interlayer porosity as follows:
( (9)
where , and are the solid particles density, dry density and total void ratio,
respectively.
Substituting Equation (7) into Equation (9) yields the following formula for the interlayer
porosity:
∑
(10)
Equation (10) predicts the evolution of the interlayer porosity with the interlayer water
content that leads implicitly to a relationship with suction. In case of compacted MX-80
bentonite, with = 1.6Mg/m3, the estimated interlayer porosity is depicted in Fig. 4.
For a natural wet soil sample, at any given suction value, the interlayer porosity is fully
occupied by chemically bound water. The interlayer pores are also very small, both of which
Downloaded by [ Aalto University Library] on [20/04/20]. Copyright © ICE Publishing, all rights reserved.

Accepted manuscript doi: 10.1680/jgeot.18.P.220
would mean that mercury might not be able to intrude these pores. Consequently, the non-
intruded porosity during the porosimetry test should be always bigger or equal to that in
Equation (10) and the measured soil water characteristic curve for the material should never
fall below the limiting curve represented by . However, the mercury intrusion tests a
(freeze) dried material, meaning that there should be almost no water in the interlayer pores.
In such case, the distance between clay platelets will be reduced, leading to a redistribution of
the interlayer porosity into the larger pores.
ESTIMATION OF THE INTERPARTICLE WATER CONTENT FROM THE
MERCURY INTRUSION POROSIMETRY RESULTS
The mercury intrusion porosimetry (MIP) investigates the distribution of pores in a porous
material (Romero & Simms, 2008). The experiment is standardized (ASTM 4404-84, 1998),
routinely used in practice and allows for the detection for pores as small as 4.0nm in
diameter. However, no information about the smaller pores can be extracted from MIP data.
The main idea behind MIP is to inject mercury (non-wetting fluid) gradually into a
completely dried soil sample under increasing external pressure. The measured volume of the
injected mercury and the corresponding applied pressure correlate to the pore volume and
pore diameter, respectively (Prapaharan et al., 1985). That eventually gives information about
soil fabric and grain size distribution. Mercury intrusion into a completely dry sample
resembles the intrusion of air into a fully saturated soil on drying path. Therefore, in
principle, the derived retention properties based solely on MIP results correspond to the
desorption curve. In addition, the mercury intrusion porosimetry theory assumes that all the
pores in the tested material can be characterized as cylindrical with the diameter . Usually
in geotechnical applications, the MIP measurements are given as the mercury intruded void
ratio versus pore diameter. This value relates to the degree of saturation as follows:
Downloaded by [ Aalto University Library] on [20/04/20]. Copyright © ICE Publishing, all rights reserved.

Accepted manuscript doi: 10.1680/jgeot.18.P.220
( (11)
and consequently:
(12)
where , , , are the intruded void volume, the total void volume, the total solid
particles volume and the total initial void ratio, respectively. The symbols and
denote the mercury degree of saturation and the corresponding water degree of saturation as
predicted by MIP, respectively.
The equivalent pore diameter is linked to the corresponding suction through the
Washburn’s equation (Washburn, 1921):
(13)
where ( is a constant for a given liquid. The symbol represents the surface
tension of the pore fluid (for water, N/m) and is the contact angle between
the fluid and the soil particle. Typically for water-soil contact, is taken as which is a
widely accepted assumption. There is still some discussion about the correct value of the
contact angle to be adopted (Lourenço et al., 2012). For example Zheng & Zaoui (2017)
reported an angle as high as 25o in case of water-montmorillonite contact. However, in the
investigated case of bentonite, most of water is residing in the interlayer spaces and the value
of the adopted contact angle has only minor effect on the estimated water retention curve.
Nonetheless, in case of coarser geomaterials where the role of capillary forces is dominant,
the correct choice of contact angle would affect the predictions significantly.
Downloaded by [ Aalto University Library] on [20/04/20]. Copyright © ICE Publishing, all rights reserved.

Accepted manuscript doi: 10.1680/jgeot.18.P.220
Given the MIP measurements, the degree of saturation at any D or s can be estimated
with Equations (12) and (13). This value is later employed to estimate the interparticle water
contribution to the total degree of saturation .
Arguing on the technical details of the mercury intrusion porosimetry test is out of the scope
of this study and can be found elsewhere, e.g. in Ritter & Erich (1948), ASTM 4404 (1998)
and Romero & Simms (2008). However, it is important to note that before the mercury
intrusion starts, the sample has to be moisture free. That is achieved, in case of tests on
bentonite, with a freeze-drying technique, in which the water is removed from the sample via
sublimation. The technique seems to be able to remove all the water that is both the
interparticle and the interlayer water from the sample. The effects of such sample preparation
on the MIP test results are rarely discussed in the geotechnical field. Considering the
interlayer pore spaces, the removal of water molecules would most likely result in altering the
sample condition, as the interlayer space should close. That also alters the interlayer porosity
(Murray & Quirk, 1980; Gallé, 2001; Saranya & Arnepalli, 2018) and eventually by the end
of freeze-drying, the interlayer spaces will be smaller than in the initial sample. Here, we
assume that they will be approximately 0.4Å, which is the width of the interlayer space in a
fully dry montmorillonite. There is a general agreement within the field that the freeze-drying
followed by MIP intrusion would not affect the original clay pore structure (Sills et al., 1973;
Lawrence, 1978; Delage & Lefebvre, 1984), that is the pores which are above 4.0nm.
However, it should be noted that these studies concentrated on the effect of mercury intrusion
phase on the pore structure and not on the freeze-drying effect. Therefore, their findings are
applicable to the sample after the freeze-drying procedure, during which the change of the
interlayer spaces has already occurred. Furthermore, several experimental observations by
Tovey (1971), Greene-Kelly (1973), Lawrence et al. (1979) and Wierzchoś et al. (1992)
Downloaded by [ Aalto University Library] on [20/04/20]. Copyright © ICE Publishing, all rights reserved.

Accepted manuscript doi: 10.1680/jgeot.18.P.220
support the hypothesis that it may be that the closure of interlayer spaces would eventually be
reflected globally altering the whole pore structure of the material, especially where
interlayer role is dominant (bentonite-like materials with large specific surface). Heller-Kallai
in Bergaya and Lagaly (2013) states, as an undisputed fact, that freeze-drying stimulates
edge-to-face association which alters the texture of the clay minerals creating a range of
larger pores. Finally, Deirieh et al. (2018) provided excellent experimental data, which
clearly showed that the freeze-drying affects the pore size distribution of clay. Further
research quantifying the interlayer shrinkage effect on the interparticle level would be needed
to shed more light on the issue.
As discussed in the introduction, it seems that the MIP results can be interpreted directly to
predict the SWCC in case of coarse grain materials with relatively low specific surface. This
has been indicated in Prapaharan et al. (1985), Romero et al. (1999) and Nowamooz &
Masrouri (2010), where the ad-hoc values are assumed to calculate the residual water content
which represents the interlayer water content. The materials with low specific surface are
dominated by the capillary mechanism of water retention, which correlates to MIP data in a
more physically sound way than in the case of materials with large specific surface that
promotes the hydro-chemical activity (dominated by adsorption mechanism for retaining
water). Perhaps, mercury intrusion porosimetry should be considered only as a supporting test
in the case of bentonite-like materials, as it is not sufficient to give the complete picture of
material porosity and hence water retention behaviour.
Despite this uncertainty, the accumulated MIP studies revealed, qualitatively, many
interesting features of clay response under different hydro-mechanical paths (Delage et al.,
2006; Romero et al., 2011; Della Vecchia et al., 2015). The most relevant to the content of
this paper are:
Downloaded by [ Aalto University Library] on [20/04/20]. Copyright © ICE Publishing, all rights reserved.

Accepted manuscript doi: 10.1680/jgeot.18.P.220
a- Compacted clays are usually characterised by bimodal pore size distribution
reflecting the concentration of pore diameters around two sizes. One representing
the macro pores and the other the micro pores.
b- External mechanical loading only affects the macro pores with marginal effect on
the micro level pores. That explains the dependency of air entry value on the dry
density of the soil.
c- Drying path decreases both macro and micro pores volume and shift them towards
smaller sizes.
d- Under constant void ratio, saturation causes increase in micro pores volume and
reduction in macro pores volume.
e- At full saturation the pores tend to concentrate at a unified median pore range and
the pore size distribution becomes single pore mode.
f- Drying the sample again after full saturation will recover the bimodal distribution.
These observations have significant consequences on understanding and modelling the
coupled hydro-mechanical behaviour of unsaturated soils. Most important for this paper, they
show that the pore size distribution is not constant and consequently a single MIP
measurement only represents one hyro-mechanical state, therefore, it is not enough to derive
the full SWCC.
It is important to note that neither MIP measurements (due to insufficient intrusion pressure)
nor the interlayer water content formula (7) gives data related to the water content in the
range 12Å - 40Å. Therefore, in this paper the amount of those pores will be extrapolated
based on MIP results.
Downloaded by [ Aalto University Library] on [20/04/20]. Copyright © ICE Publishing, all rights reserved.

Accepted manuscript doi: 10.1680/jgeot.18.P.220
PREDICTION OF THE SOIL WATER CHARACTERISTIC CURVE
The problem associated with the derivation of the interparticle water contribution based on
MIP results is that MIP is performed on a water-free sample and consequently its results
employ the initial void ratio as a reference value to estimate pore size distribution.
However, with reference to Fig. 5, in a hypothetical wet sample, which has not been treated
with the freeze-drying technique, the void available for intrusion is considerably different due
to the interlayer water. The amount of interlayer water, in a wet sample, increases nonlinearly
with saturation (see Fig. 6 and Equation (7)) and simultaneously occupies increasing volume.
Therefore, with the interlayer void ratio in a hypothetical wet sample, estimated based on
the simplified model introduced earlier, the void ratio available for MIP (intrusion) under
constant volume is . To consider this effect, the degree of saturation
derived based on MIP and is scaled down by a factor giving the contribution of the
interparticle water to the total degree of saturation. The factor is a variable
controlled by the interlayer void ratio:
(14)
This factor plays a role similar to an interaction function between micro and macro levels, a
concept that is already used in several well-established modelling frameworks of unsaturated
swelling clays (Gens & Alonso, 1992; Monroy et al., 2010; Romero et al., 2011; Della
Vecchia et al., 2015).
The total degree of saturation at any suction is the sum of interlayer contribution and
the interparticle contribution , see Fig. 6:
(15)
Downloaded by [ Aalto University Library] on [20/04/20]. Copyright © ICE Publishing, all rights reserved.

Accepted manuscript doi: 10.1680/jgeot.18.P.220
The effect of scaling gets smaller with the increasing coarseness of the material (decreasing
specific surface). The assumed scaling is a simplification that may be improved in the future
research; however, it seems to be sufficient for materials with high clay content.
Fig. 7 illustrates the evolution of with suction for the MIP data obtained from MX-80
bentonite sample tested at initial degree of saturation of = 0.59 (Delage et al., 2006). The
figure also gives , the degree of saturation derived based on MIP and , the
corresponding scaled value. The authors emphasize that the data in Fig. 7 are only valid for
= 0.59. At other degrees of saturation, the MIP results differ and the resulted differs.
Each MIP test provides data to locate a single point on the SWCC. Table 1 lists the required
steps to estimate that point at a given total degree of saturation.
One repeats the Steps 1 to 4 for other available MIP data at other initial total degrees of
saturation to estimate other points on the SWCC. As a final simple step, these points can be
used to fit a water retention curve with any suitable model (Leong & Rahardjo, 1997).
The ability of the framework to predict the soil water characteristic curve is assessed based
on three different MIP data sets on MX-80 and GMZ bentonites provided by Delage et al.
(2006), Ye et al. (2009), Seiphoori et al. (2014) and Lui (2016). These sets of data include
measurements for the water retention curve, which are used for the validation purposes.
VALIDATION BASED ON DATA FROM Delage et al. (2006)
Within a comprehensive microstructural study on the effect of aging on the structure of
compacted MX-80 Wyoming bentonite, Delage et al. (2006) provided MIP measurements
performed on samples with dry density = 1.61Mg/m3 at different initial (i.e. before freeze-
drying) degrees of saturation. The maximum applied mercury intrusion pressure
corresponded to the minimum detected pore diameter of = 6.8nm. Relevant physical
properties of the investigated bentonite are as listed in Table 2.
Downloaded by [ Aalto University Library] on [20/04/20]. Copyright © ICE Publishing, all rights reserved.

Accepted manuscript doi: 10.1680/jgeot.18.P.220
Delage et al. (2006) also provided measured wetting branch of the SWCC under constant
volume using vapour equilibrium method for a sample with = 1.7Mg/m3. Unfortunately,
this dry density differs from the dry density used in the MIP, which makes the comparison
difficult. To overcome that, additional data from Villar et al. (2005) also under constant
volume but with = 1.6Mg/m3 and 1.7Mg/m3 are considered in this example.
There is also an additional inconsistency in the SWCC data in Delage et al. (2006) where the
curve is provided as water content - suction relationship. Here, the curve is converted to
its degree of saturation - suction counterpart. However, for = 2.65Mg/m3 and =
1.7Mg/m3 the corresponding void ratio is – .
That yields a saturated water content of
which is remarkably less than 0.25 the value provided by Delage et al. (2006). The difference
might be attributed to the variation of water density with saturation as has been discussed
in Marcial (2011) and Jacinto et al. (2012) or some mistake. However, if the dry density of
the bentonite was rather closer to 1.6 instead of 1.7, it would lead to almost perfect match
with the saturated water content of 0.25, as well as lead to a match with the water retention
curve of Villar et al. (2005) for the dry density of 1.6Mg/m3. This study assumes that =
0.25 which is used to convert the water content values as reported by Delage et al. (2006) to
the corresponding degree of saturation.
The results of MIP tests for the samples with = 1.61Mg/m3 are given in the original
contribution in terms of accumulated intruded void ratio for a sample with initial = 0.39
before freeze-drying and another sample with initial = 0.59.
These MIP data are extrapolated in the range < 6.8nm to estimate the size distribution of
the pores that are not intruded by mercury. The extrapolated part is assumed to smoothly
follow the trend of the MIP data and is constructed manually, with the only purpose to clarify
Downloaded by [ Aalto University Library] on [20/04/20]. Copyright © ICE Publishing, all rights reserved.
Accepted manuscript doi: 10.1680/jgeot.18.P.220
the proposed method idea. In real cases, however, a suitable mathematical probability
distribution function that fits the MIP data would be advisable to be used instead.
With reference to Table 1, the following paragraphs discuss in details the implementation of
each step in the current example.
Estimation of predicted degree of saturation by MIP measurements ( )
The measured curves of the intruded mercury void ratio versus pore radius, as given in
Delage et al. (2006) are converted to the curves of versus suction by employing
Equations (12) and (13). The results are shown in Fig. 9. These curves are later used to
estimate the interparticle saturation .
Estimation of contribution of interlayer saturation, interlayer void ratio and the scaling
factor ( )
By examining the data in Fig. 3 related to the interlayer distance evolution with suction, and
the physical properties of MX-80 bentonite as listed in Table 2, Equation (7) and Equation (2)
predict the contribution of the interlayer water to the total degree of saturation as represented
by the blue dashed curve in Fig. 10. This curve corresponds to the minimum degree of
saturation that should be available in the soil sample at any suction level. Equations (9) and
(14) are then used to estimate and consequently the scaling factor to be applied on
. The scaling factor varies with suction as, for instance, given in Fig. 10 for = 0.648
and = 0.59. Similar procedure applies for the MIP data of the sample with
= 0.39 and
= 0.649 which gives different and curves.
Estimation of the contribution of interparticle saturation based on MIP data
Following the algorithm in Table 1, the calculated data is scaled down by factor to get
the contribution of interparticle saturation . This contribution is then added to the
interlayer contribution to get the total degree of saturation estimation as shown in Fig.
Downloaded by [ Aalto University Library] on [20/04/20]. Copyright © ICE Publishing, all rights reserved.
Accepted manuscript doi: 10.1680/jgeot.18.P.220
11. This total degree of saturation curve is only valid at the corresponding initial degree of
saturation of the MIP sample. For the given initial degree of saturation of = 0.59, only the
point shown as a red square mark in Fig. 11 is valid and corresponds to suction =
42000kPa. It represents the first estimated point on the targeted SWCC. Upon repeating
exactly the same procedure for the sample with = 0.39, one ends up with the second point
on the SWCC with the coordinates ( = 80000kPa , = 0.39). The used data in this case are
depicted in Fig. 12.
Predicted versus measured soil water characteristic curve
These two MIP tests at different initial degree of saturation, following the proposed method,
yielded two points of the SWCC. Now, one might use two additional points at the boundaries
assuming that at = 1.0kPa the total degree of saturation is 1.0 and at very high suction =
kPa the degree of saturation is 0.0 (Fredlund & Xing, 1994; Romero et al., 2011). Having
these four points, any suitable fitting model can be employed to build the full SWCC. For
example, Fig. 13 shows the fitting result upon employing the well-known van Genuchten
model (van Genuchten, 1980):
(
)[ (
] (16)
where , and are fitting parameters. The symbols and
denote the degree of
saturation at full saturation and at the residual state. In these validation examples, they are
taken equal to 1.0 and 0.0, respectively. Fig. 13 gives the values of all the used fitting
parameters.
Fig. 14 shows the measured data of the SWCC by Delage et al. (2006) and Villar et al.
(2005) being plotted on top of Fig. 13. It shows a perfect replication of the soil water
characteristic curve measurements, which validates the procedure in this case.
Downloaded by [ Aalto University Library] on [20/04/20]. Copyright © ICE Publishing, all rights reserved.

Accepted manuscript doi: 10.1680/jgeot.18.P.220
VALIDATION BASED ON DATA FROM Seiphoori et al. (2014)
To have an in depth view on the effect of microstructure evolution on the water retention
characteristics of MX-80 bentonite, Seiphoori et al. (2014) conducted several MIP
measurements which demonstrated, among other points, the effect of different hydraulic
paths on micro and macro pore size distribution.
The validation here bases only on a single set of measurements. To keep the consistency, the
employed physical properties of MX-80 bentonite are the same as in the previous example
and listed in Table 2. Seiphoori et al. (2014) used WP4 dewpoint potentiometer to obtain the
water retention curve for a sample with = 1.8Mg/m3 ( = 0.53) under constant volume. In
the mercury intrusion porosimetry test the maximum applied intrusion mercury pressure was
400MPa which allowed for intrusion of pores with minimum diameter of = 4.0nm, that is
smaller than in previously used data (Delage et al., 2006).
The MIP measurements are provided in terms of accumulated intruded void ratio for three
samples, which had similar initial but different initial degrees of saturation before freeze-
drying ( = 0.28, 0.62 and 1.0). As in the preceding example, extrapolation is used to cover
the non-intruded pore size range ( < 4.0nm).
Based on the proposed algorithm in Table 1, the following paragraphs present the detailed
steps to estimate the water retention curve employing the new data.
Estimation of predicted degree of saturation by MIP measurements ( )
The MIP data lead to the corresponding degree of saturation with the results depicted in Fig.
15 for the three samples at three different initial degrees of saturation.
Estimation of contribution of interlayer saturation, interlayer void ratio and the scaling
factor ( )
Downloaded by [ Aalto University Library] on [20/04/20]. Copyright © ICE Publishing, all rights reserved.
Accepted manuscript doi: 10.1680/jgeot.18.P.220
The contribution of the interlayer water to the total degree of saturation is estimated by
Equation (2). The interlayer void ratio and consequently the scaling factor come from
Equations (9) and (14), respectively. Fig. 16 presents the relevant results for the sample with
= 0.28. It is clear in the figure that at high saturation the interlayer water dominates for the
soil sample with such a high dry density ( = 0.53). In the suction range lower than
1000kPa most of the water is the interlayer water. Same equations lead to the curves for other
degrees of saturation (e.g. = 0.62 and
=1.0).
Estimation of the contribution of interparticle saturation based on MIP data
The contribution of the interparticle saturation is estimated by scaling the calculated
data by the factor. The resulted value is added to the interlayer contribution as
estimated in the previous paragraph to get the total degree of saturation . The total degree
of saturation curve is only valid at the corresponding initial degree of saturation of the MIP
sample. Fig. 17, Fig. 18 and Fig. 19 graphically illustrate the procedure for the three samples
with different initial degrees of saturation 0.28,
0.62 and 1.0, respectively.
As it is clear in the figures, these three samples yield three different points on the SWCC with
the coordinates ( = 140000kPa, 0.28), ( = 70000kPa, 0.62) and ( = 2000kPa,
1.0).
Predicted versus measured soil water characteristic curve
Following a similar procedure to that in Delage et al. (2006) example, to the three estimated
points, one might add two additional points at the boundaries with the coordinates ( = 1kPa,
1.0) and ( = kPa, 0.0). These five points are fitted with the van Genuchten
model as shown in Fig. 20, which also gives the model fitting parameters values.
Examination of the measured SWCC data and the obtained water retention curve in Fig. 21
reveals an excellent match and further confirms the validity of the proposed method.
Downloaded by [ Aalto University Library] on [20/04/20]. Copyright © ICE Publishing, all rights reserved.

Accepted manuscript doi: 10.1680/jgeot.18.P.220
VALIDATION IN CASE OF GAOMIAOZI (GMZ) BENTONITE
Gaomiaozi (GMZ) bentonite, the main candidate as a nuclear waste sealing material in China,
has received detailed experimental characterisation and its physical properties are well
established (Ye et al., 2010, 2012, 2014a, 2014b; Chen et al., 2017; Xu, Ye & Ye, 2017).
Table 3 lists the most relevant physical properties to this validation example.
Ye et al. (2010) and Xu et al. (2017) reported measurements of the water retention curve at
dry density d = 1.7Mg/m3 ( = 0.564) using the vapour equilibrium technique. For the
same dry density, Ye et al. (2009) and Lui (2016) provided MIP data for compacted GMZ
bentonite at different initial degree of saturation.
Ye et al. (2009) gave MIP curve at the initial suction value of =1000kPa without
mentioning the corresponding water content in the original work. Nonetheless, the value of
initial suction is equally useful for the proposed procedure.
Adopting the algorithm in Table 1, the following steps clarify how to estimate the water
retention curve for GMZ bentonite.
Estimation of predicted degree of saturation by MIP measurements ( )
Lui (2016) provided the MIP data at and as pore size density curves being
defined as
versus the pore diameter . Correspondingly, the increment of
intruded pore volume at the related ith average pore diameter , computed as average
between the diameters at the beginning and the end of the pore diameter increment
equals:
( (17)
Consequently, the accumulated intruded void volume per unit mass and the intruded
void ratio at the average pore diameter are:
Downloaded by [ Aalto University Library] on [20/04/20]. Copyright © ICE Publishing, all rights reserved.

Accepted manuscript doi: 10.1680/jgeot.18.P.220
∑
; (18)
where . Using Equations (17) and (18), the authors converted the provided pore
size density curves back to the accumulated intruded void ratio curves. Based on these
curves, the estimated degree of saturation by MIP data are estimated and depicted in Fig. 22.
Estimation of contribution of interlayer saturation, interlayer void ratio and the scaling
factor ( )
The interlayer water contribution to the total degree of saturation , the interlayer void
ratio and the scaling factor are estimated by Equation (2), (9) and (14), respectively.
The interlayer water content in Equation (2) is determined through Equation (7). The
result in case of the sample with initial degree of saturation = 0.63 is depicted in Fig. 23.
Similar procedure applies for the other two samples.
Estimation of the contribution of interparticle saturation based on MIP data
To estimate the contribution of the interparticle saturation , the calculated data are
scaled by the factor . Subsequently, the value is added to the previously estimated
interlayer contribution to obtain the total degree of saturation which is only valid at
the corresponding initial degree of saturation of the MIP sample. The results for the three
tested samples are shown in Fig. 24, Fig. 25 and Fig. 26 with 0.63,
0.51 and
1000kPa, respectively. The procedure predicts that the points ( = 64000kPa, 0.51), ( =
46500kPa, 0.63) and ( = 1000kPa, 0.97) to be on the retention curve of the
compacted GMZ bentonite with dry density d = 1.7Mg/m3. It is worth noting that the given
initial suction in the sample in Fig. 26 is used to estimate the initial degree of saturation,
unlike as in the two other samples with given initial degree of saturation.
Predicted versus measured soil water characteristic curve
Downloaded by [ Aalto University Library] on [20/04/20]. Copyright © ICE Publishing, all rights reserved.
Accepted manuscript doi: 10.1680/jgeot.18.P.220
Again, in addition to the three predicted points, one could add two additional points at the
boundaries with the coordinates ( = 1kPa, 1.0) and ( = kPa, 0.0). Fig. 27
shows the fitting result of these points with the corresponding fitting parameters values.
The measured SWCC data validates the procedure for GMZ bentonite as illustrated in Fig.
28. Upon examining Fig. 28, it seems that the predicted points fit the experimental curve very
well, though the van Genuchten fit would be improved by having the two defining point of
the curve further apart, or assuming a higher value of suction at zero degree of saturation.
CONCLUSIONS
The paper proposes a new procedure to estimate the soil water characteristic curve for
bentonite based on mineralogy, simple physical properties and MIP measurements. The main
assumption is that at any total suction value, the available water in the geomaterial can be
decomposed to the interlayer water, which exists in between clay unit layers and the
interparticle water that resides everywhere else in the available pores. A simplified formula is
introduced to estimate the interlayer water content. The formula requires the knowledge of
the material specific surface and the weight ratio of the composing minerals.
The interparticle water content is estimated based on the MIP measurements. To account for
the effect of freeze-drying on the microstructure of the bentonite, a factor is introduced to
scale down the available pore for the intrusion. The factor is a function of interlayer void
ratio and evolves with saturation. The proposed framework is validated against available data
in literature and proved to replicate the experiments very well.
Despite the focus on bentonite, the procedure may be more generic and perhaps be used for
any geomaterial. The framework allows for an indirect estimation of the water retention
properties of the material based on the mercury intrusion porosimetry (MIP) measurements,
Downloaded by [ Aalto University Library] on [20/04/20]. Copyright © ICE Publishing, all rights reserved.

Accepted manuscript doi: 10.1680/jgeot.18.P.220
which may lead to time savings and provides an elegant modelling tool for the estimation of
SWCC under different hydro-mechanical paths.
ACKNOWLEDGEMENT
The authors would like to gratefully acknowledge that the presented research has been funded
by KYT2018 Finnish Research Programme on Nuclear Waste Management via THEBES
project.
Downloaded by [ Aalto University Library] on [20/04/20]. Copyright © ICE Publishing, all rights reserved.

Accepted manuscript doi: 10.1680/jgeot.18.P.220
NOTATION
Roman Fitting parameter, L Contribution due to interlayer spaces saturation
Clay layer surface area, L2
Fitting parameter, M-1 L T2 Predicted degree of saturation by MIP measurements
Auxiliary term Contribution due to interparticle pores saturation
Pore diameter, L Specific surface, L2 M-1
Initial void ratio Mercury intruded pore volume per unit mass, L3 M-1
Mercury intruded void ratio Solid particles volume per unit mass, L3 M-1
Interlayer void ratio Voids volume per unit mass, L3 M-1
Interparticle void ratio Water content
van Genuchten fitting parameter Interlayer water content
van Genuchten fitting parameter
Liquid limit
van Genuchten fitting parameter Plastic limit
Specific gravity Saturated water content
Plasticity index
Number of clay layers per particle
Greek
Number of water layers in between two adjacent clay layers Scaling factor
Number of water layers on the outer surface of a clay particle
The contact angle between the fluid and the soil particle
Total number of clay particles per unit mass, M-1 Interlayer spacing, L
The percentage of the composing mineralogy by weight of total solids The thickness of one water layer, L
Total suction, M L-1 T-2 Dry density, M L-3
Total initial suction before freeze-drying, M L-1 T-2 Solid particles density, M L-3
Total degree of saturation Free water density, M L-3
Initial total degree of saturation
Interparticle water density, M L-3
Mercury degree of saturation Surface tension of water, M T-2
Abbreviations
MIP Mercury Intrusion Porosimetry
SWCC Soil Water Characteristic Curve
THMC Thermo-Hydro-Mechanical-Chemical
Note: Units are given after the comma; where L, M and T mean units of length, mass and time, respectively.
Downloaded by [ Aalto University Library] on [20/04/20]. Copyright © ICE Publishing, all rights reserved.

Accepted manuscript doi: 10.1680/jgeot.18.P.220
REFERENCES
Abed, A.A. & Sołowski, W.T. (2017). A study on how to couple thermo-hydro-mechanical behaviour of unsaturated soils: Physical equations, numerical implementation and examples. Computers and Geotechnics 92, 132–155.
ASTM, D. (1998). 4404 “Standard test method for determination of pore volume and pore volume distribution of soil and rock by mercury intrusion porosimetry”. ASTM International.
Bergaya, F. & Lagaly, G. (2013) Handbook of Clay Science. Newnes.
Bestel, M., Diamond, L.W., Glaus, M.A., Gimmi, T., Van Loon, L.R. & Jurányi, L. (2014). Water–montmorillonite systems: Neutron scattering and tracer through diffusion studies. PhD thesis, Universität Bern, Bern, Switzerland.
Branson, K. & Newman, A.C.D. (1983). Water sorption on Ca-saturated clays: I. Multilayer sorption and microporosity in some illites. Clay Minerals 18, No. 3, 277-287.
Bucher, F. & Müller-Vonmoos, M. (1989). Bentonite as a containment barrier for the disposal of highly radioactive wastes. Applied Clay Science 4, No. 2, 157–177.
Chen, Z.G., Tang, C.S., Shen, Z., Liu, Y.M. & Shi, B. (2017). The geotechnical properties of GMZ buffer/backfill material used in high-level radioactive nuclear waste geological repository: a review. Environmental Earth Sciences 76, No. 7, p. 270.
Chipera, S.J., Carey, J.W. & Bish, D.L. (1998). Controlled-humidity XRD analyses: Application to the study of smectite expansion/contraction. In: Advances in X-ray Analysis. Springer. pp. 713–722.
Collin, F., Li, X.L., Radu, J.P. & Charlier, R. (2002). Thermo-hydro-mechanical coupling in clay barriers. Engineering Geology 64, No. 2, 179–193.
Deirieh, A., Chang, I.Y., Whittaker, M.L., Weigand, S., Keane, D., Rix, J., Germaine, J.T., Joester, D. & Flemings, P.B. (2018). Particle arrangements in clay slurries: The case against the honeycomb structure. Applied Clay Science, 152, 166-172.
Delage, P. & Lefebvre, G. (1984). Study of the structure of a sensitive Champlain clay and of its evolution during consolidation. Canadian Geotechnical Journal 21, No. 1, 21–35.
Delage, P., Howat, M.D. & Cui, Y.J. (1998). The relationship between suction and swelling properties in a heavily compacted unsaturated clay. Engineering geology 50, No.1-2, 31-48.
Delage, P., Marcial, D., Cui, Y.J. & Ruiz, X. (2006). Ageing effects in a compacted bentonite: a microstructure approach. Géotechnique 56, No. 5, 291–304.
Della Vecchia, G., Dieudonné, A., Jommi, C. & Charlier, R. (2015). Accounting for evolving pore size distribution in water retention models for compacted clays. International Journal for Numerical and Analytical Methods in Geomechanics 39, No. 7, 702–723.
Downloaded by [ Aalto University Library] on [20/04/20]. Copyright © ICE Publishing, all rights reserved.

Accepted manuscript doi: 10.1680/jgeot.18.P.220
Fredlund, D.G. & Rahardjo, H. (1993). Soil mechanics for unsaturated soils. John Wiley & Sons.
Fredlund, D.G. & Xing, A. (1994). Equations for the soil-water characteristic curve. Canadian geotechnical journal 31, No. 4, 521–532.
Gallé, C. (2001). Effect of drying on cement-based materials pore structure as identified by mercury intrusion porosimetry: a comparative study between oven-, vacuum-, and freeze-drying. Cement and Concrete Research 31, No. 10, 1467–1477.
Gens, A. & Alonso, E.E. (1992). A framework for the behaviour of unsaturated expansive clays. Canadian Geotechnical Journal 29, No. 6, 1013–1032.
Greene-Kelly, R. (1973). The preparation of clay soils for determination of structure. Journal of Soil Science 24, No. 3, 277–283.
Haines, W.B. (1930). Studies in the physical properties of soil. V. The hysteresis effect in capillary properties, and the modes of moisture distribution associated therewith. The Journal of Agricultural Science 20, No. 1, 97–116.
Holtz, R.D. & Kovacs, W.D. (1981). An introduction to geotechnical engineering. Englewood Cliffs, NJ: Prentice-Hall.
Hsiao, Y.-W. & Hedström, M. (2017). Swelling Pressure in Systems with Na-Montmorillonite and Neutral Surfaces: A Molecular Dynamics Study. The Journal of Physical Chemistry C. [Online] 121, No. 47, 26414–26423. Available from: doi:10.1021/acs.jpcc.7b09496.
Jacinto, A.C., Villar, M.V., Gómez-Espina, R. & Ledesma, A. (2009). Adaptation of the van Genuchten expression to the effects of temperature and density for compacted bentonites. Applied Clay Science 42, No. 3, 575–582.
Jacinto, A.C., Villar, M.V. & Ledesma, A. (2012). Influence of water density on the water-retention curve of expansive clays. Geotechnique 62, No. 8, 657–667.
Kraehenbuehl, F., Stoeckli, H.F., Brunner, F., Kahr, G. & Müller-Vonmoos, M. (1987). Study of the water-bentonite system by vapour adsorption, immersion calorimetry and X-ray techniques: I. Micropore volumes and internal surface areas, following Dubinin's theory. Clay Minerals 22, No. 1, 1-9.
Kuusela-Lahtinen, A., Sinnathamby, G., Mendez, J., Sołowski, W.T., Gallipoli, D., Pintado, X. & Korkiala-Tanttu, L.K. (2016). Estimation of water retention behaviour of MX-80 bentonite partially saturated with saline solution. In: E3S Web of Conferences. 2016 EDP Sciences. p. 11006.
Lawrence, G.P. (1978). Stability of soil pores during mercury intrusion porosimetry. European Journal of Soil Science 29, No. 3, 299–304.
Downloaded by [ Aalto University Library] on [20/04/20]. Copyright © ICE Publishing, all rights reserved.

Accepted manuscript doi: 10.1680/jgeot.18.P.220
Lawrence, G.P., Payne, D. & Greenland, D.J. (1979). Pore size distribution in critical point and freeze dried aggregates from clay subsoils. Journal of soil science 30, No. 3, 499–516.
Leong, E.C. & Rahardjo, H. (1997). Review of soil-water characteristic curve equations. Journal of Geotechnical and Geoenvironmental Engineering 123, No. 12, 1106–1117.
Likos, W.J. & Wayllace, A. (2010). Porosity evolution of free and confined bentonites during interlayer hydration. Clays and Clay minerals 58, No. 3, 399–414.
Lourenço, S.D.N., Gallipoli, D., Augarde, C.E., Toll, D.G., et al. (2012). Formation and evolution of water menisci in unsaturated granular media. Géotechnique 62, No. 3, 193-199.
Lui, Y. (2016). Investigation on the swelling properties and microstruc-ture mechanism of compacted Gaomiaozi bentonite. Journal of Engineering Geology 24, No. 3, 451–458.
Marcial, D. (2011). A simple method to consider water density changes in the calculation of the degree of saturation of swelling clays. Unsaturated Soils. CRC Press/Balkema, London. 473–478.
Marinho, F.A. (2005) Nature of soil–water characteristic curve for plastic soils. Journal of Geotechnical and Geoenvironmental Engineering 131, No. 5, 654–661.
Monroy, R., Zdravkovic, L. & Ridley, A. (2010). Evolution of microstructure in compacted London Clay during wetting and loading. Géotechnique 60, No. 2, 105-119.
Murray, R.S. & Quirk, J.P. (1980). Freeze-Dried and Critical-Point-Dried Clay—A Comparison. Soil Science Society of America Journal 44, No. 2, 232–234.
Musso, G., Romero, E. & Della Vecchia, G. (2013). Double-structure effects on the chemo-hydro-mechanical behaviour of a compacted active clay. Géotechnique 63, No. 3, 206–220.
Nowamooz, H. & Masrouri, F. (2010). Relationships between soil fabric and suction cycles in compacted swelling soils. Engineering Geology 114, No. 3–4, 444–455.
Olivella, S., Gens, A., Carrera, J. & Alonso, E.E. (1996). Numerical formulation for a simulator (CODE_BRIGHT) for the coupled analysis of saline media. Engineering Computations 13, No. 7, 87–112.
Prapaharan, S., Altschaeffl, A.G. & Dempsey, B.J. (1985). Moisture curve of compacted clay: mercury intrusion method. Journal of Geotechnical Engineering 111, No. 9, 1139–1143.
Pusch, R. (2015). Bentonite clay: environmental properties and applications. CRC Press.
Ritter, H.L. & Erich, L.C. (1948). Pore size distribution in porous materials. Analytical Chemistry 20, No. 7, 665–670.
Downloaded by [ Aalto University Library] on [20/04/20]. Copyright © ICE Publishing, all rights reserved.

Accepted manuscript doi: 10.1680/jgeot.18.P.220
Romero, E., Della Vecchia, G. & Jommi, C. (2011). An insight into the water retention properties of compacted clayey soils. Géotechnique 61, No. 4, 313–328.
Romero, E., Gens, A. & Lloret, A. (1999). Water permeability, water retention and microstructure of unsaturated compacted Boom clay. Engineering Geology 54, No. 1–2, 117–127.
Romero, E. & Simms, P.H. (2008). Microstructure investigation in unsaturated soils: a review with special attention to contribution of mercury intrusion porosimetry and environmental scanning electron microscopy. Geotechnical and Geological Engineering 26, No. 6, 705–727.
Romero, E. (1999). Characterisation and thermo-hydro-mechanical behaviour of unsaturated Boom clay: an experimental study. PhD thesis, Universitat Politècnica de Catalunya, Barcelona, Spain.
Saiyouri, N., Hicher, P.Y. & Tessier, D. (2000). Microstructural approach and transfer water modelling in highly compacted unsaturated swelling clays. Mechanics of Cohesive-Frictional Materials 5, No. 1, 41–60.
Saranya, N. & Arnepalli, D.N. (2018). Effect of drying technique on pore structure characteristics of fine-grained geomaterials. International Journal of Geotechnical Engineering 12, No. 6, 578–591.
Seiphoori, A., Ferrari, A. & Laloui, L. (2014). Water retention behaviour and microstructural evolution of MX-80 bentonite during wetting and drying cycles. Géotechnique 64, No. 9, 721–734.
Sellin, P. & Leupin, O.X. (2013). The use of clay as an engineered barrier in radioactive-waste management–a review. Clays and Clay Minerals 61, No. 6, 477–498.
Sills, I.D., Aylmore, L.A.G. & Quirk, J.P. (1973). A Comparison Between Mercury Injection and Nitrogen Sorption as Methods of Determining Pore Size Distributions. Soil Science Society of America Journal 37, No. 4, 535–537.
Simms, P.H. & Yanful, E.K. (2002). Predicting soil—water characteristic curves of compacted plastic soils from measured pore-size distributions. Géotechnique 52, No. 4, 269–278.
Simms, P.H. & Yanful, E.K. (2004). A discussion of the application of mercury intrusion porosimetry for the investigation of soils, including an evaluation of its use to estimate volume change in compacted clayey soils. Géotechnique 54, No. 6, 421-426.
Tarantino, A. (2009). A water retention model for deformable soils. Géotechnique 59, No. 9, 751–762.
Thomas, H.R. & He, Y. (1997). A coupled heat-moisture transfer theory for deformable unsaturated soil and its algorithmic implementation. International Journal for Numerical Methods in Engineering 40, No. 18, 3421–3441.
Downloaded by [ Aalto University Library] on [20/04/20]. Copyright © ICE Publishing, all rights reserved.

Accepted manuscript doi: 10.1680/jgeot.18.P.220
Tournassat, C. & Appelo, C.A.J. (2011). Modelling approaches for anion-exclusion in compacted Na-bentonite. Geochimica et Cosmochimica Acta 75, No. 13, 3698–3710.
Tovey, N.K. (1971). Discussion on Session 1: Roscoe Memorial Symposium, Stress-Strain Behavior of Soils. Proc., Cambridge. 116–120.
van Genuchten, M. T. (1980). A closed-form equation for predicting the hydraulic conductivity of unsaturated soils. Soil Science Society of America Journal 44, No. 5, 892–898.
Villar, M.V. (2005). MX-80 bentonite, thermo-hydro-mechanical characterisation performed at CIEMAT in the context of the prototype project. No. Ciemat: 1053, Centro de Investigaciones Energeticas, Madrid, Spain.
Villar, M.V., Gómez-Espina, R. & Gutiérrez-Nebot, L. (2012). Basal spacings of smectite in compacted bentonite. Applied Clay Science 65, 95–105.
Washburn, E.W. (1921). Note on a method of determining the distribution of pore sizes in a porous material. Proceedings of the National Academy of Sciences 7, No. 4, 115–116.
Wierzchoś, J., Ascaso, C., Garcia-Gonzalez, M.T. & Kozak, E. (1992) A new method of dehydration for pure clay materials using Peldri II. Clays and Clay Minerals 40, No. 2, 230–236.
Wu, W., Li, X., Charlier, R. & Collin, F. (2004). A thermo-hydro-mechanical constitutive model and its numerical modelling for unsaturated soils. Computers and Geotechnics 31, No. 2, 155–167.
Xu, L., Ye, W.M. & Ye, B. (2017). Gas breakthrough in saturated compacted GaoMiaoZi (GMZ) bentonite under rigid boundary conditions. Canadian Geotechnical Journal 54, No. 8, 1139–1149.
Ye, W.M., Borrell, N.C., Zhu, J.Y., Chen, B., et al. (2014a). Advances on the investigation of the hydraulic behavior of compacted GMZ bentonite. Engineering geology 169, 41–49.
Ye, W.M., Chen, Y.G., Chen, B., Wang, Q., et al. (2010). Advances on the knowledge of the buffer/backfill properties of heavily-compacted GMZ bentonite. Engineering Geology 116, No.1–2, 12–20.
Ye, W.M., Wan, M., Chen, B., Chen, Y.-G., et al. (2012). Temperature effects on the unsaturated permeability of the densely compacted GMZ01 bentonite under confined conditions. Engineering Geology 126, 1–7.
Ye, W.M., Wang, Q., Chen, Y.G. & Chen, B. (2009). Advances on buffer/backfill properties of heavily compacted Gaomiaozi bentonite. In: ISGE2009, Hangzhou, China.
Ye, W.M., Zheng, Z.J., Chen, B., Chen, Y.G., Cui, Y.J. & Wang, J. (2014b). Effects of pH and temperature on the swelling pressure and hydraulic conductivity of compacted GMZ01 bentonite. Applied Clay Science 101, 192–198.
Downloaded by [ Aalto University Library] on [20/04/20]. Copyright © ICE Publishing, all rights reserved.

Accepted manuscript doi: 10.1680/jgeot.18.P.220
Zheng, Y. & Zaoui, A. (2017). Wetting and nanodroplet contact angle of the clay 2: 1 surface: The case of Na-montmorillonite (001). Applied Surface Science 396, 717–722.
Zielinski, M., Sentenac, P., Atique, A., Sánchez, M. & Romero, E.E. (2010). Comparison of four methods for determining the soil water retention curve. In: Unsaturated soils. Taylor & Francis. pp. 525–530.
Table captions
Table 1. Steps to follow to locate a point on the water retention curve.
Table 2. Physical properties of MX-80 bentonite after Delage et al. (2006).
Table 3. Physical properties of GMZ bentonite (Ye et al., 2010).
Downloaded by [ Aalto University Library] on [20/04/20]. Copyright © ICE Publishing, all rights reserved.

Accepted manuscript doi: 10.1680/jgeot.18.P.220
Table 1. Steps to follow to locate a point on the water retention curve. Step 1: Estimate using Equation (12), based on MIP test (see Fig. 7).
Step 2: For each pore diameter (given by MIP measurements in Step 1 where
and is the total number of measured MIP points):
a. Estimate suction according to Equation (13).
b. Estimate and using Equation (2) and Equation (9), respectively
(see Fig. 8). The interlayer water content in Equation (7) is determined
through Equation (6).
c. Estimate the scaling factor employing Equation (14), see Fig. 7.
d. Use to scale the as estimated in Step 1 to determine (see Fig.
7).
e. Calculate and save the total degree of saturation at and the
corresponding suction using formula (15).
Step 3: Use the calculate data in Step 2 to construct a full curve for the given
MIP test and mineralogical data (see Fig. 8).
Step 4: As the resulted curve in Step 3 is only valid at the given total degree of
saturation before freeze-drying , it is used to find the corresponding suction at
that degree of saturation. The resulted pair ( , ) represents the estimated point on
the targeted SWCC (see Fig. 8).
Downloaded by [ Aalto University Library] on [20/04/20]. Copyright © ICE Publishing, all rights reserved.

Accepted manuscript doi: 10.1680/jgeot.18.P.220
Table 2. Physical properties of MX-80 bentonite after Delage et al. (2006). Mineralogy 82% Na-Ca smectite
Liquid limit 520%
Plastic limit 46%
Plasticity index 474
Solid particles densitys 2.65Mg/m3
Specific surface Ss 522 m2/g
Table 3. Physical properties of GMZ bentonite (Ye et al., 2010). Mineralogy 75.4% montmorillonite
Liquid limit 313%
Plastic limit 38%
Plasticity index 275%
Solid particles densitys 2.66Mg/m3
Specific surface Ss 570 m2/g
Downloaded by [ Aalto University Library] on [20/04/20]. Copyright © ICE Publishing, all rights reserved.

Accepted manuscript doi: 10.1680/jgeot.18.P.220
Figure captions
Fig. 1. Idealized pore distribution in clay.
Fig. 2. Visualization of items and corresponding symbols that are employed to estimate
interlayer water content.
Fig. 3. Measured interlayer distance versus suction in case of MX-80 bentonite.
Fig. 4. Evolution of interlayer water content and porosity as predicted by Equation (6) and
Equation (10) with .
Fig. 5. Evolution of interlayer and interparticle void ratio with increasing saturation.
Fig. 6. Components of total degree of saturation.
Fig. 7. Scaling of MIP results to account for interlayer void ratio increase with saturation.
Fig. 8. Graphical illustration of the followed steps in Table 1 to locate a point on the water
retention curve.
Fig. 9. Estimated degree of saturation based on MIP data at two different initial degree
of saturation before freeze-drying.
Fig. 10. Contribution of interlayer water and unscaled interparticle water (predicted by MIP)
to the total degree of saturation.
Fig. 11. Graphical illustration of the estimation of suction value using mineralogical and MIP
data. The sample has an initial degree of saturation of 0.59 before freeze-drying.
Fig. 12. Graphical illustration of the estimation of suction value using mineralogical and MIP
data. The sample has an initial degree of saturation of 0.39 before freeze-drying.
Fig. 13. Predicted soil water retention curve for MX-80 bentonite.
Fig. 14. Predicted versus measured soil water retention curve for MX-80 bentonite.
Fig. 15. Estimated degree of saturation based on MIP data at three different initial
degree of saturation before freeze-drying.
Downloaded by [ Aalto University Library] on [20/04/20]. Copyright © ICE Publishing, all rights reserved.

Accepted manuscript doi: 10.1680/jgeot.18.P.220
Fig. 16. Contribution of interlayer water and unscaled interparticle water (predicted by MIP)
to the total degree of saturation.
Fig. 17. Graphical illustration of the estimation of suction value using mineralogical and MIP
data. The sample has an initial degree of saturation of 0.28 before freeze-drying.
Fig. 18. Graphical illustration of the estimation of suction value using mineralogical and MIP
data. The sample has an initial degree of saturation of 0.62 before freeze-drying.
Fig. 19. Graphical illustration of the estimation of suction value using mineralogical and MIP
data. The sample has an initial degree of saturation of 1.0 before freeze-drying.
Fig. 20. Predicted soil water retention curve for MX-80 bentonite.
Fig. 21. Predicted versus measured soil water retention curve for MX-80 bentonite.
Fig. 22. Estimated degree of saturation based on MIP data at three different initial
degree of saturation before freeze-drying.
Fig. 23. Contribution of interlayer water and unscaled interparticle water (predicted by MIP)
to the total degree of saturation.
Fig. 24. Graphical illustration of the estimation of suction value using mineralogical and MIP
data. The sample has an initial degree of saturation of 0.63 before freeze-drying.
Fig. 25. Graphical illustration of the estimation of suction value using mineralogical and MIP
data. The sample has an initial degree of saturation of 0.51 before freeze-drying.
Fig. 26. Graphical illustration of the estimation of initial degree of saturation using
mineralogical and MIP data. The sample has an initial suction of 1000kPa before
freeze-drying.
Fig. 27. Predicted water retention curve for GMZ bentonite.
Fig. 28. Predicted versus measured water retention curve for GMZ bentonite.
Downloaded by [ Aalto University Library] on [20/04/20]. Copyright © ICE Publishing, all rights reserved.
Accepted manuscript doi: 10.1680/jgeot.18.P.220
Downloaded by [ Aalto University Library] on [20/04/20]. Copyright © ICE Publishing, all rights reserved.

Accepted manuscript doi: 10.1680/jgeot.18.P.220
Downloaded by [ Aalto University Library] on [20/04/20]. Copyright © ICE Publishing, all rights reserved.

Accepted manuscript doi: 10.1680/jgeot.18.P.220
Downloaded by [ Aalto University Library] on [20/04/20]. Copyright © ICE Publishing, all rights reserved.

Accepted manuscript doi: 10.1680/jgeot.18.P.220
Downloaded by [ Aalto University Library] on [20/04/20]. Copyright © ICE Publishing, all rights reserved.

Accepted manuscript doi: 10.1680/jgeot.18.P.220
Downloaded by [ Aalto University Library] on [20/04/20]. Copyright © ICE Publishing, all rights reserved.

Accepted manuscript doi: 10.1680/jgeot.18.P.220
Downloaded by [ Aalto University Library] on [20/04/20]. Copyright © ICE Publishing, all rights reserved.

Accepted manuscript doi: 10.1680/jgeot.18.P.220
Downloaded by [ Aalto University Library] on [20/04/20]. Copyright © ICE Publishing, all rights reserved.

Accepted manuscript doi: 10.1680/jgeot.18.P.220
Downloaded by [ Aalto University Library] on [20/04/20]. Copyright © ICE Publishing, all rights reserved.

Accepted manuscript doi: 10.1680/jgeot.18.P.220
Downloaded by [ Aalto University Library] on [20/04/20]. Copyright © ICE Publishing, all rights reserved.

Accepted manuscript doi: 10.1680/jgeot.18.P.220
Downloaded by [ Aalto University Library] on [20/04/20]. Copyright © ICE Publishing, all rights reserved.

Accepted manuscript doi: 10.1680/jgeot.18.P.220
Downloaded by [ Aalto University Library] on [20/04/20]. Copyright © ICE Publishing, all rights reserved.

Accepted manuscript doi: 10.1680/jgeot.18.P.220
Downloaded by [ Aalto University Library] on [20/04/20]. Copyright © ICE Publishing, all rights reserved.

Accepted manuscript doi: 10.1680/jgeot.18.P.220
Downloaded by [ Aalto University Library] on [20/04/20]. Copyright © ICE Publishing, all rights reserved.

Accepted manuscript doi: 10.1680/jgeot.18.P.220
Downloaded by [ Aalto University Library] on [20/04/20]. Copyright © ICE Publishing, all rights reserved.

Accepted manuscript doi: 10.1680/jgeot.18.P.220
Downloaded by [ Aalto University Library] on [20/04/20]. Copyright © ICE Publishing, all rights reserved.

Accepted manuscript doi: 10.1680/jgeot.18.P.220
Downloaded by [ Aalto University Library] on [20/04/20]. Copyright © ICE Publishing, all rights reserved.

Accepted manuscript doi: 10.1680/jgeot.18.P.220
Downloaded by [ Aalto University Library] on [20/04/20]. Copyright © ICE Publishing, all rights reserved.

Accepted manuscript doi: 10.1680/jgeot.18.P.220
Downloaded by [ Aalto University Library] on [20/04/20]. Copyright © ICE Publishing, all rights reserved.

Accepted manuscript doi: 10.1680/jgeot.18.P.220
Downloaded by [ Aalto University Library] on [20/04/20]. Copyright © ICE Publishing, all rights reserved.

Accepted manuscript doi: 10.1680/jgeot.18.P.220
Downloaded by [ Aalto University Library] on [20/04/20]. Copyright © ICE Publishing, all rights reserved.
Accepted manuscript doi: 10.1680/jgeot.18.P.220
Downloaded by [ Aalto University Library] on [20/04/20]. Copyright © ICE Publishing, all rights reserved.

Accepted manuscript doi: 10.1680/jgeot.18.P.220
Downloaded by [ Aalto University Library] on [20/04/20]. Copyright © ICE Publishing, all rights reserved.

Accepted manuscript doi: 10.1680/jgeot.18.P.220
Downloaded by [ Aalto University Library] on [20/04/20]. Copyright © ICE Publishing, all rights reserved.
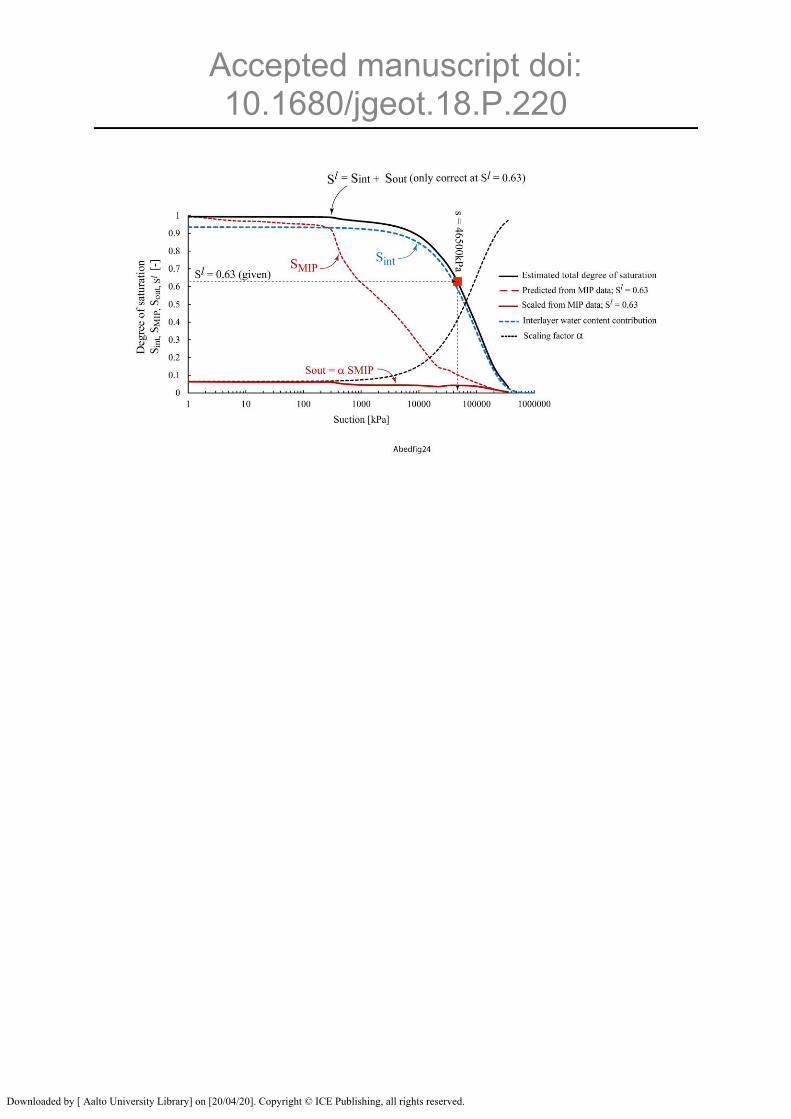
Accepted manuscript doi: 10.1680/jgeot.18.P.220
Downloaded by [ Aalto University Library] on [20/04/20]. Copyright © ICE Publishing, all rights reserved.

Accepted manuscript doi: 10.1680/jgeot.18.P.220
Downloaded by [ Aalto University Library] on [20/04/20]. Copyright © ICE Publishing, all rights reserved.

Accepted manuscript doi: 10.1680/jgeot.18.P.220
Downloaded by [ Aalto University Library] on [20/04/20]. Copyright © ICE Publishing, all rights reserved.

Accepted manuscript doi: 10.1680/jgeot.18.P.220
Downloaded by [ Aalto University Library] on [20/04/20]. Copyright © ICE Publishing, all rights reserved.

Accepted manuscript doi: 10.1680/jgeot.18.P.220
Downloaded by [ Aalto University Library] on [20/04/20]. Copyright © ICE Publishing, all rights reserved.