Estimation of Total Nitrogen and Phosphorus in New England …€¦ · · 2004-04-05Phosphorus in...
50
Estimation of Total Nitrogen and Phosphorus in New England Streams Using Spatially Referenced Regression Models By Richard Bridge Moore, Craig M. Johnston, Keith W. Robinson, and Jeffrey R. Deacon U.S. Department of the Interior U.S. Geological Survey In cooperation with the New England Interstate Water Pollution Control Commission and U.S. Environmental Protection Agency Scientific Investigations Report 2004-5012
Transcript of Estimation of Total Nitrogen and Phosphorus in New England …€¦ · · 2004-04-05Phosphorus in...

Estimation of Total Nitrogen and Phosphorus in New England Streams Using Spatially Referenced Regression Models
By Richard Bridge Moore, Craig M. Johnston, Keith W. Robinson, and Jeffrey R. Deacon
In cooperation with the New England Interstate Water Pollution Control Commission and U.S. Environmental Protection Agency
Scientific Investigations Report 2004-5012
U.S. Department of the Interior U.S. Geological Survey
U.S. Department of the InteriorGale A. Norton, Secretary
U.S. Geological SurveyCharles G. Groat, Director
U.S. Geological Survey, Pembroke, New Hampshire: 2004
For sale by U.S. Geological Survey, Information Services Box 25286, Denver Federal Center Denver, CO 80225
For more information about the USGS and its products: Telephone: 1-888-ASK-USGS World Wide Web: http://www.usgs.gov/
Any use of trade, product, or firm names in this publication is for descriptive purposes only and does not imply endorsement by the U.S. Government.
Although this report is in the public domain, permission must be secured from the individual copyright owners to reproduce any copyrighted materials contained within this report.

iii
Acknowledgments
The authors thank Richard A. Smith, Richard B. Alexander, and Gregory E. Schwarz of the U. S. Geological Survey (USGS), who developed the SPARROW modeling technique and made this work possible by providing computer code, assistance, and reviews. We especially acknowledge the efforts of Richard Alexander for patiently answering questions regarding the computer code, and to Gregory E. Schwarz, who has written the most recent version of the SPARROW computer code and provided assistance with the update. We thank Mary Chepiga and Gerard McMahon of the USGS for their thoughtful reviews of this report, and those who provided assistance during the course of the project, including Stephen Preston, Elaine Trench, Thor Smith, Laura Medalie, James Shanley, John Brakebill, Lance Ostiguy, Peter Steeves, and Laura Hayes, from the USGS. We thank and acknowledge the essential support, encouragement, and reviews provided by Alison Simcox, Matthew Liebman, and Henry Walker of the U.S. Environmental Protection Agency, and Bethany Card and Laura Blake of the New England Interstate Water Pollution Control Commission.

v
Contents
Acknowledgments . . . . . . . . . . . . . . . . . . . . . . . . . . . . . . . . . . . . . . . . . . . . . . . . . . . . . . . . . . . . . . . . . . . . . . . . . . . . . . . . . . . . . . . . . . . iAbstract . . . . . . . . . . . . . . . . . . . . . . . . . . . . . . . . . . . . . . . . . . . . . . . . . . . . . . . . . . . . . . . . . . . . . . . . . . . . . . . . . . . . . . . . . . . . . . . . . . . . 1Introduction . . . . . . . . . . . . . . . . . . . . . . . . . . . . . . . . . . . . . . . . . . . . . . . . . . . . . . . . . . . . . . . . . . . . . . . . . . . . . . . . . . . . . . . . . . . . . . . . . 1
Purpose and Scope . . . . . . . . . . . . . . . . . . . . . . . . . . . . . . . . . . . . . . . . . . . . . . . . . . . . . . . . . . . . . . . . . . . . . . . . . . . . . . . . . . . 2Description of the SPARROW Modeling Technique . . . . . . . . . . . . . . . . . . . . . . . . . . . . . . . . . . . . . . . . . . . . . . . . . . . 3
Description of Data Used in the New England Sparrow Models . . . . . . . . . . . . . . . . . . . . . . . . . . . . . . . . . . . . . . . . . . . . . 7Hydrologic Network . . . . . . . . . . . . . . . . . . . . . . . . . . . . . . . . . . . . . . . . . . . . . . . . . . . . . . . . . . . . . . . . . . . . . . . . . . . . . . . . . . 8Channel-Transport Characteristics Data . . . . . . . . . . . . . . . . . . . . . . . . . . . . . . . . . . . . . . . . . . . . . . . . . . . . . . . . . . . . . . 8Stream Nutrient-Load Data . . . . . . . . . . . . . . . . . . . . . . . . . . . . . . . . . . . . . . . . . . . . . . . . . . . . . . . . . . . . . . . . . . . . . . . . . . . 9Nutrient-Source Data . . . . . . . . . . . . . . . . . . . . . . . . . . . . . . . . . . . . . . . . . . . . . . . . . . . . . . . . . . . . . . . . . . . . . . . . . . . . . . . . . 9Physical Watershed Characteristics Data . . . . . . . . . . . . . . . . . . . . . . . . . . . . . . . . . . . . . . . . . . . . . . . . . . . . . . . . . . . . 12
Climatic Factors . . . . . . . . . . . . . . . . . . . . . . . . . . . . . . . . . . . . . . . . . . . . . . . . . . . . . . . . . . . . . . . . . . . . . . . . . . . . . . . . 13Land-Surface Characteristics . . . . . . . . . . . . . . . . . . . . . . . . . . . . . . . . . . . . . . . . . . . . . . . . . . . . . . . . . . . . . . . . . . 13
Spatially Referenced Regression Models for Nutrients in New England Streams . . . . . . . . . . . . . . . . . . . . . . . . . . . 13Nitrogen . . . . . . . . . . . . . . . . . . . . . . . . . . . . . . . . . . . . . . . . . . . . . . . . . . . . . . . . . . . . . . . . . . . . . . . . . . . . . . . . . . . . . . . . . . . . . 13Phosphorus . . . . . . . . . . . . . . . . . . . . . . . . . . . . . . . . . . . . . . . . . . . . . . . . . . . . . . . . . . . . . . . . . . . . . . . . . . . . . . . . . . . . . . . . . 16Model Assumptions and Limitations . . . . . . . . . . . . . . . . . . . . . . . . . . . . . . . . . . . . . . . . . . . . . . . . . . . . . . . . . . . . . . . . . 16
Model Estimates of Nutrient Loads . . . . . . . . . . . . . . . . . . . . . . . . . . . . . . . . . . . . . . . . . . . . . . . . . . . . . . . . . . . . . . . . . . . . . . . . . 18Nitrogen . . . . . . . . . . . . . . . . . . . . . . . . . . . . . . . . . . . . . . . . . . . . . . . . . . . . . . . . . . . . . . . . . . . . . . . . . . . . . . . . . . . . . . . . . . . . . 18Phosphorus . . . . . . . . . . . . . . . . . . . . . . . . . . . . . . . . . . . . . . . . . . . . . . . . . . . . . . . . . . . . . . . . . . . . . . . . . . . . . . . . . . . . . . . . . 22
Use of SPARROW Model Results in Water-Resources Management . . . . . . . . . . . . . . . . . . . . . . . . . . . . . . . . . . . . . . 32Determining Sources and Transport of Nutrient Loads . . . . . . . . . . . . . . . . . . . . . . . . . . . . . . . . . . . . . . . . . . . . . . . 32Determining Nutrient Concentrations . . . . . . . . . . . . . . . . . . . . . . . . . . . . . . . . . . . . . . . . . . . . . . . . . . . . . . . . . . . . . . . . 32Determining Nutrient Loads Delivered to Coastal Waters . . . . . . . . . . . . . . . . . . . . . . . . . . . . . . . . . . . . . . . . . . . . . 37
Summary . . . . . . . . . . . . . . . . . . . . . . . . . . . . . . . . . . . . . . . . . . . . . . . . . . . . . . . . . . . . . . . . . . . . . . . . . . . . . . . . . . . . . . . . . . . . . . . . . . 37Selected References . . . . . . . . . . . . . . . . . . . . . . . . . . . . . . . . . . . . . . . . . . . . . . . . . . . . . . . . . . . . . . . . . . . . . . . . . . . . . . . . . . . . . . 40
vi
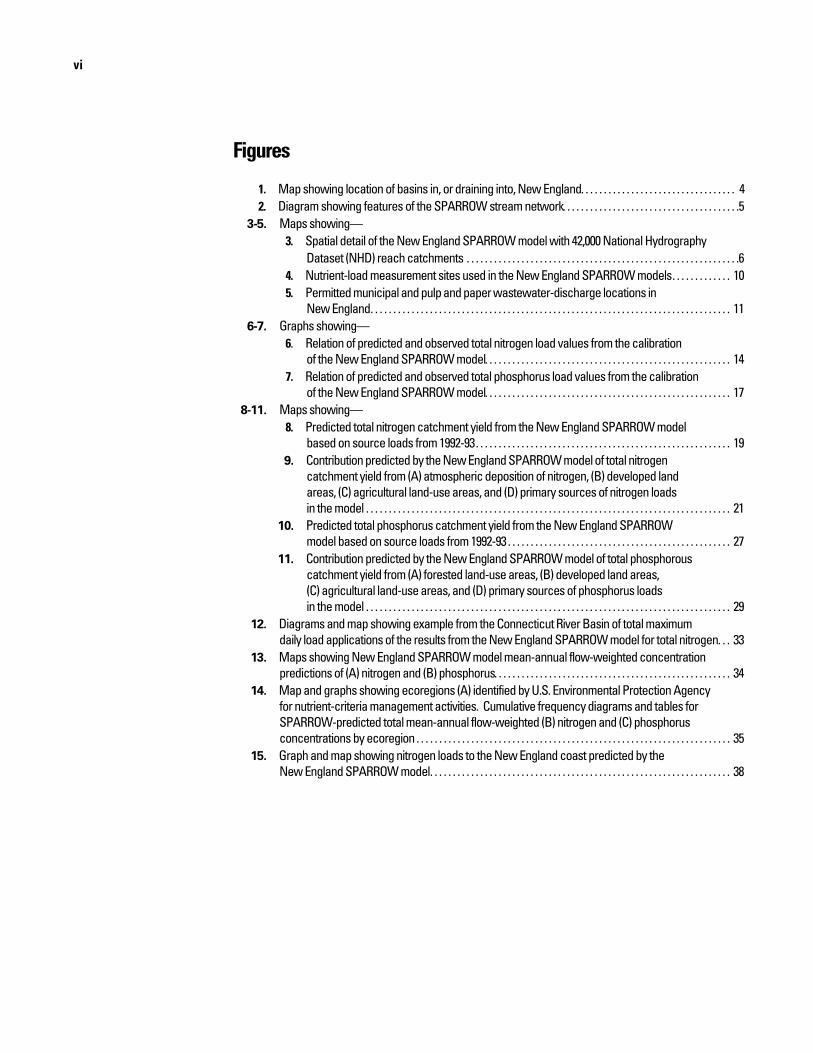
Figures
1. Map showing location of basins in, or draining into, New England. . . . . . . . . . . . . . . . . . . . . . . . . . . . . . . . . . 42. Diagram showing features of the SPARROW stream network. . . . . . . . . . . . . . . . . . . . . . . . . . . . . . . . . . . . . . .5
3-5. Maps showing—3. Spatial detail of the New England SPARROW model with 42,000 National Hydrography
Dataset (NHD) reach catchments . . . . . . . . . . . . . . . . . . . . . . . . . . . . . . . . . . . . . . . . . . . . . . . . . . . . . . . . . . . .64. Nutrient-load measurement sites used in the New England SPARROW models. . . . . . . . . . . . . 105. Permitted municipal and pulp and paper wastewater-discharge locations in
New England. . . . . . . . . . . . . . . . . . . . . . . . . . . . . . . . . . . . . . . . . . . . . . . . . . . . . . . . . . . . . . . . . . . . . . . . . . . . . . . 116-7. Graphs showing—
6. Relation of predicted and observed total nitrogen load values from the calibration of the New England SPARROW model. . . . . . . . . . . . . . . . . . . . . . . . . . . . . . . . . . . . . . . . . . . . . . . . . . . . . . 14
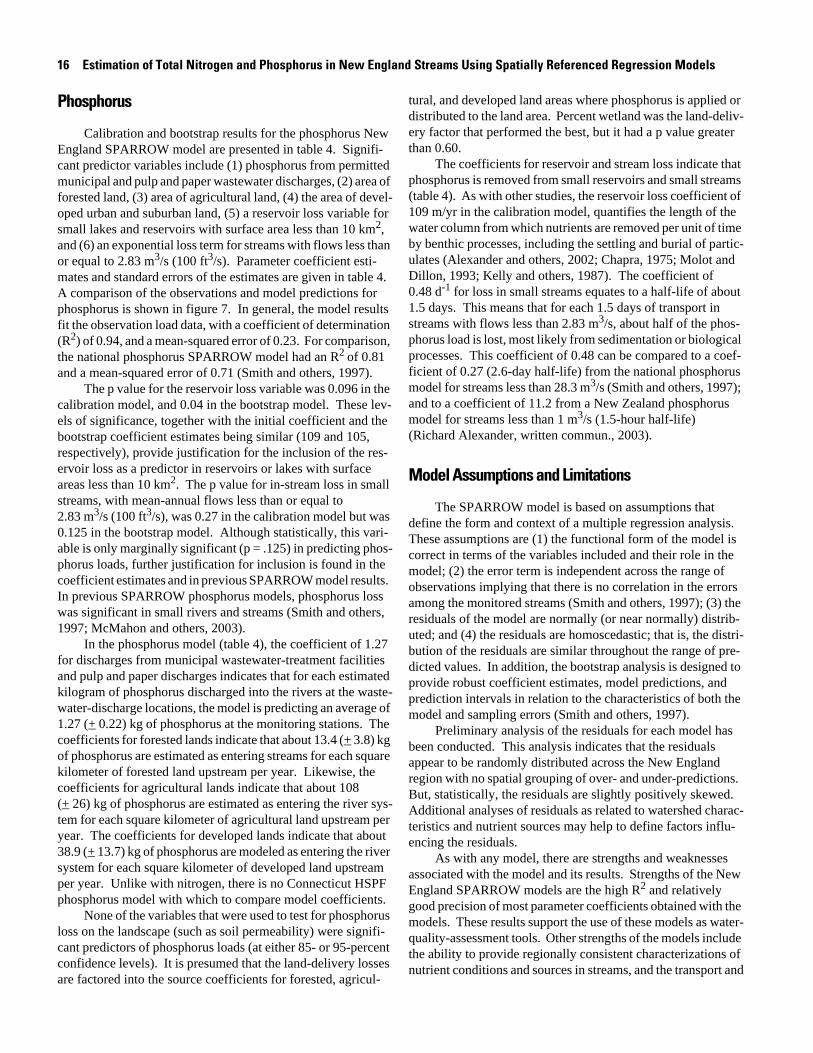
7. Relation of predicted and observed total phosphorus load values from the calibration of the New England SPARROW model. . . . . . . . . . . . . . . . . . . . . . . . . . . . . . . . . . . . . . . . . . . . . . . . . . . . . . 17
8-11. Maps showing—8. Predicted total nitrogen catchment yield from the New England SPARROW model
based on source loads from 1992-93 . . . . . . . . . . . . . . . . . . . . . . . . . . . . . . . . . . . . . . . . . . . . . . . . . . . . . . . . 199. Contribution predicted by the New England SPARROW model of total nitrogen
catchment yield from (A) atmospheric deposition of nitrogen, (B) developed land areas, (C) agricultural land-use areas, and (D) primary sources of nitrogen loads in the model . . . . . . . . . . . . . . . . . . . . . . . . . . . . . . . . . . . . . . . . . . . . . . . . . . . . . . . . . . . . . . . . . . . . . . . . . . . . . . . . 21
10. Predicted total phosphorus catchment yield from the New England SPARROW model based on source loads from 1992-93 . . . . . . . . . . . . . . . . . . . . . . . . . . . . . . . . . . . . . . . . . . . . . . . . . 27
11. Contribution predicted by the New England SPARROW model of total phosphorous catchment yield from (A) forested land-use areas, (B) developed land areas, (C) agricultural land-use areas, and (D) primary sources of phosphorus loads in the model . . . . . . . . . . . . . . . . . . . . . . . . . . . . . . . . . . . . . . . . . . . . . . . . . . . . . . . . . . . . . . . . . . . . . . . . . . . . . . . . 29
12. Diagrams and map showing example from the Connecticut River Basin of total maximum daily load applications of the results from the New England SPARROW model for total nitrogen. . . 33
13. Maps showing New England SPARROW model mean-annual flow-weighted concentration predictions of (A) nitrogen and (B) phosphorus. . . . . . . . . . . . . . . . . . . . . . . . . . . . . . . . . . . . . . . . . . . . . . . . . . . . 34
14. Map and graphs showing ecoregions (A) identified by U.S. Environmental Protection Agency for nutrient-criteria management activities. Cumulative frequency diagrams and tables for SPARROW-predicted total mean-annual flow-weighted (B) nitrogen and (C) phosphorus concentrations by ecoregion . . . . . . . . . . . . . . . . . . . . . . . . . . . . . . . . . . . . . . . . . . . . . . . . . . . . . . . . . . . . . . . . . . . . . 35
15. Graph and map showing nitrogen loads to the New England coast predicted by the New England SPARROW model. . . . . . . . . . . . . . . . . . . . . . . . . . . . . . . . . . . . . . . . . . . . . . . . . . . . . . . . . . . . . . . . . . 38
vii
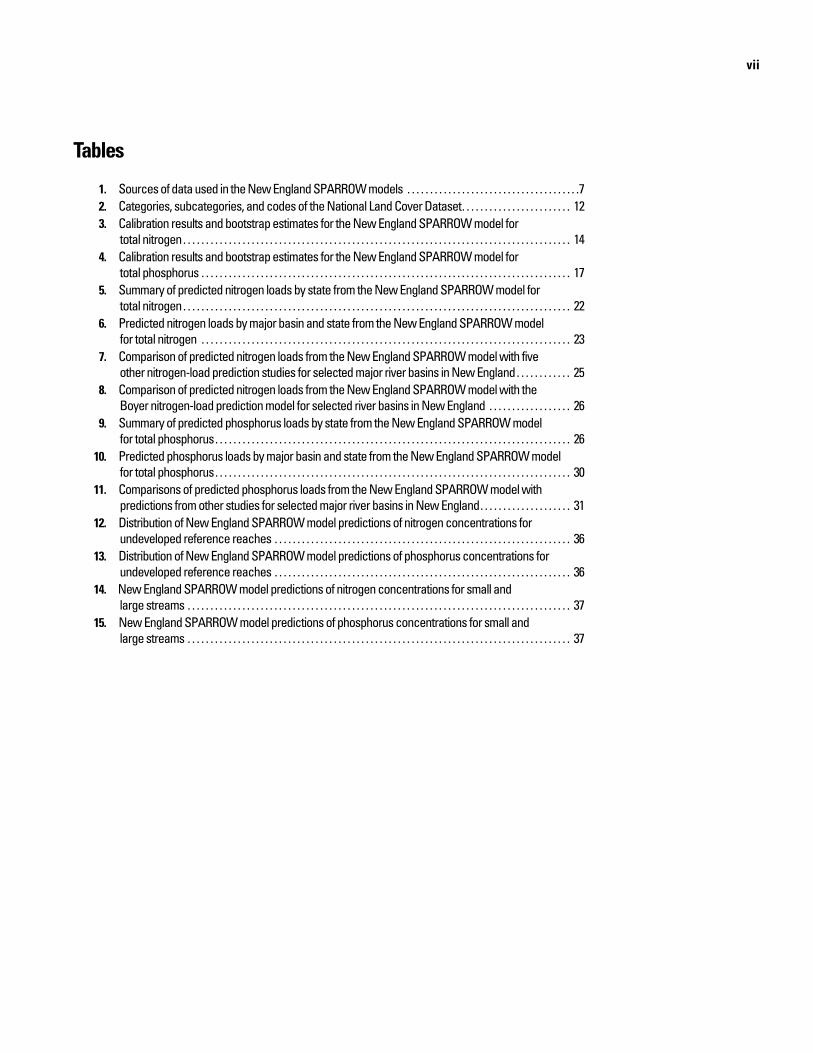
Tables
1. Sources of data used in the New England SPARROW models . . . . . . . . . . . . . . . . . . . . . . . . . . . . . . . . . . . . . .72. Categories, subcategories, and codes of the National Land Cover Dataset. . . . . . . . . . . . . . . . . . . . . . . . 123. Calibration results and bootstrap estimates for the New England SPARROW model for
total nitrogen . . . . . . . . . . . . . . . . . . . . . . . . . . . . . . . . . . . . . . . . . . . . . . . . . . . . . . . . . . . . . . . . . . . . . . . . . . . . . . . . . . . . . 144. Calibration results and bootstrap estimates for the New England SPARROW model for
total phosphorus . . . . . . . . . . . . . . . . . . . . . . . . . . . . . . . . . . . . . . . . . . . . . . . . . . . . . . . . . . . . . . . . . . . . . . . . . . . . . . . . . 175. Summary of predicted nitrogen loads by state from the New England SPARROW model for
total nitrogen . . . . . . . . . . . . . . . . . . . . . . . . . . . . . . . . . . . . . . . . . . . . . . . . . . . . . . . . . . . . . . . . . . . . . . . . . . . . . . . . . . . . . 226. Predicted nitrogen loads by major basin and state from the New England SPARROW model
for total nitrogen . . . . . . . . . . . . . . . . . . . . . . . . . . . . . . . . . . . . . . . . . . . . . . . . . . . . . . . . . . . . . . . . . . . . . . . . . . . . . . . . . 237. Comparison of predicted nitrogen loads from the New England SPARROW model with five
other nitrogen-load prediction studies for selected major river basins in New England . . . . . . . . . . . . 258. Comparison of predicted nitrogen loads from the New England SPARROW model with the
Boyer nitrogen-load prediction model for selected river basins in New England . . . . . . . . . . . . . . . . . . 269. Summary of predicted phosphorus loads by state from the New England SPARROW model
for total phosphorus . . . . . . . . . . . . . . . . . . . . . . . . . . . . . . . . . . . . . . . . . . . . . . . . . . . . . . . . . . . . . . . . . . . . . . . . . . . . . . 2610. Predicted phosphorus loads by major basin and state from the New England SPARROW model
for total phosphorus . . . . . . . . . . . . . . . . . . . . . . . . . . . . . . . . . . . . . . . . . . . . . . . . . . . . . . . . . . . . . . . . . . . . . . . . . . . . . . 3011. Comparisons of predicted phosphorus loads from the New England SPARROW model with
predictions from other studies for selected major river basins in New England . . . . . . . . . . . . . . . . . . . . 3112. Distribution of New England SPARROW model predictions of nitrogen concentrations for
undeveloped reference reaches . . . . . . . . . . . . . . . . . . . . . . . . . . . . . . . . . . . . . . . . . . . . . . . . . . . . . . . . . . . . . . . . . 3613. Distribution of New England SPARROW model predictions of phosphorus concentrations for
undeveloped reference reaches . . . . . . . . . . . . . . . . . . . . . . . . . . . . . . . . . . . . . . . . . . . . . . . . . . . . . . . . . . . . . . . . . 3614. New England SPARROW model predictions of nitrogen concentrations for small and
large streams . . . . . . . . . . . . . . . . . . . . . . . . . . . . . . . . . . . . . . . . . . . . . . . . . . . . . . . . . . . . . . . . . . . . . . . . . . . . . . . . . . . . 3715. New England SPARROW model predictions of phosphorus concentrations for small and
large streams . . . . . . . . . . . . . . . . . . . . . . . . . . . . . . . . . . . . . . . . . . . . . . . . . . . . . . . . . . . . . . . . . . . . . . . . . . . . . . . . . . . . 37
viii
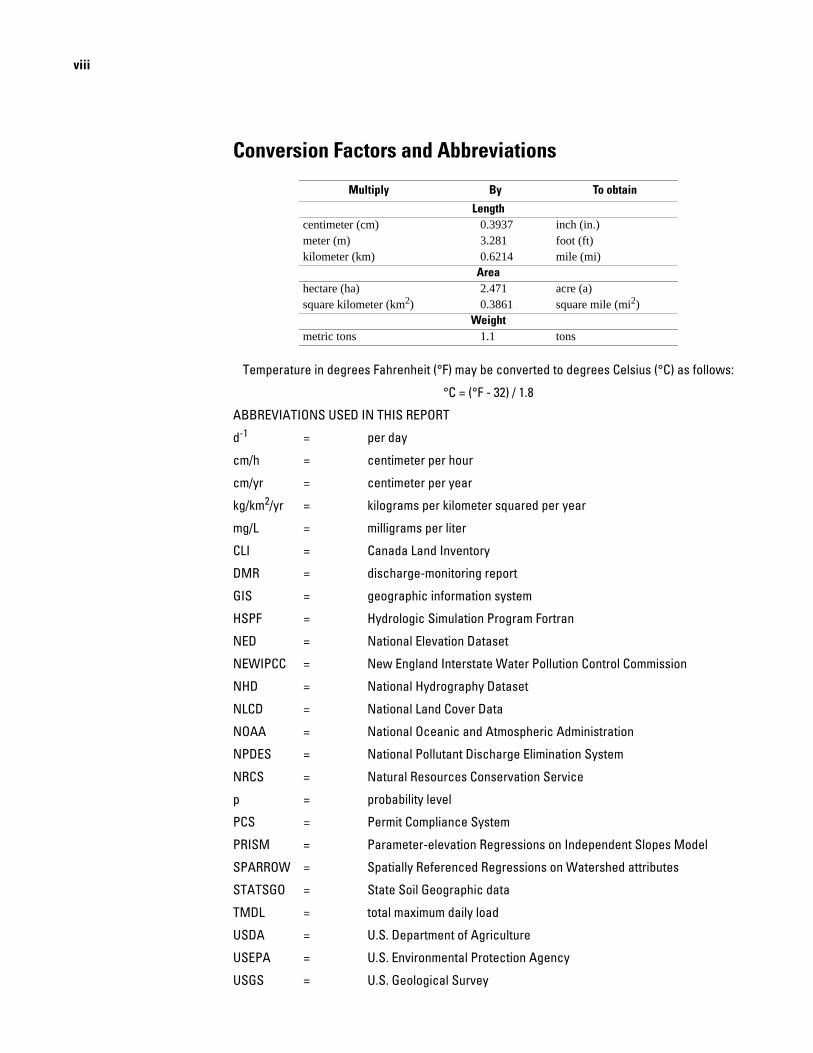
Conversion Factors and Abbreviations
Temperature in degrees Fahrenheit (°F) may be converted to degrees Celsius (°C) as follows:
°C = (°F - 32) / 1.8
ABBREVIATIONS USED IN THIS REPORT
d-1 = per day
cm/h = centimeter per hour
cm/yr = centimeter per year
kg/km2/yr = kilograms per kilometer squared per year
mg/L = milligrams per liter
CLI = Canada Land Inventory
DMR = discharge-monitoring report
GIS = geographic information system
HSPF = Hydrologic Simulation Program Fortran
NED = National Elevation Dataset
NEWIPCC = New England Interstate Water Pollution Control Commission
NHD = National Hydrography Dataset
NLCD = National Land Cover Data
NOAA = National Oceanic and Atmospheric Administration
NPDES = National Pollutant Discharge Elimination System
NRCS = Natural Resources Conservation Service
p = probability level
PCS = Permit Compliance System
PRISM = Parameter-elevation Regressions on Independent Slopes Model
SPARROW = Spatially Referenced Regressions on Watershed attributes
STATSGO = State Soil Geographic data
TMDL = total maximum daily load
USDA = U.S. Department of Agriculture
USEPA = U.S. Environmental Protection Agency
USGS = U.S. Geological Survey
Multiply By To obtain
Lengthcentimeter (cm) 0.3937 inch (in.)meter (m) 3.281 foot (ft)kilometer (km) 0.6214 mile (mi)
Areahectare (ha) 2.471 acre (a)square kilometer (km2) 0.3861 square mile (mi2)
Weightmetric tons 1.1 tons

Estimation of Total Nitrogen and Phosphorus in New England Streams Using Spatially Referenced Regression Models
By Richard Bridge Moore, Craig M. Johnston, Keith W. Robinson, and Jeffrey R. Deacon
Abstract
The U.S. Geological Survey (USGS), in cooperation with the U.S. Environmental Protection Agency (USEPA) and the New England Interstate Water Pollution Control Commission (NEWIPCC), has developed a water-quality model, called SPARROW (Spatially Referenced Regressions on Watershed Attributes), to assist in regional total maximum daily load (TMDL) and nutrient-criteria activities in New England. SPARROW is a spatially detailed, statistical model that uses regression equations to relate total nitrogen and phosphorus (nutrient) stream loads to nutrient sources and watershed char-acteristics. The statistical relations in these equations are then used to predict nutrient loads in unmonitored streams.
The New England SPARROW models are built using a hydrologic network of 42,000 stream reaches and associated watersheds. Watershed boundaries are defined for each stream reach in the network through the use of a digital elevation model and existing digitized watershed divides. Nutrient source data is from permitted wastewater discharge data from USEPA’s Permit Compliance System (PCS), various land-use sources, and atmospheric deposition. Physical watershed characteristics include drainage area, land use, streamflow, time-of-travel, stream density, percent wetlands, slope of the land surface, and soil permeability.
The New England SPARROW models for total nitrogen and total phosphorus have R-squared values of 0.95 and 0.94, with mean square errors of 0.16 and 0.23, respectively. Vari-ables that were statistically significant in the total nitrogen model include permitted municipal-wastewater discharges, atmospheric deposition, agricultural area, and developed land area. Total nitrogen stream-loss rates were significant only in streams with average annual flows less than or equal to 2.83 cubic meters per second. In streams larger than this, there is nondetectable in-stream loss of annual total nitrogen in New England. Variables that were statistically significant in the total phosphorus model include discharges for municipal wastewa-ter-treatment facilities and pulp and paper facilities, developed land area, agricultural area, and forested area. For total phos-phorus, loss rates were significant for reservoirs with surface
areas of 10 square kilometers or less, and in streams with flows less than or equal to 2.83 cubic meters per second.
Applications of SPARROW for evaluating nutrient load-ing in New England waters include estimates of the spatial dis-tributions of total nitrogen and phosphorus yields, sources of the nutrients, and the potential for delivery of those yields to receiv-ing waters. This information can be used to (1) predict ranges in nutrient levels in surface waters, (2) identify the environmen-tal variables that are statistically significant predictors of nutri-ent levels in streams, (3) evaluate monitoring efforts for better determination of nutrient loads, and (4) evaluate management options for reducing nutrient loads to achieve water-quality goals.
Introduction
Excessive nutrient (nitrogen and phosphorus) concentra-tions are common in rivers and lakes throughout the United States and New England and frequently result in water-resource impairments (U.S. Environmental Protection Agency, 2000a and 2000b). Although nitrogen and phosphorus are essential for healthy plant and animal life, elevated concentrations of these nutrients can cause eutrophication of waterbodies. Elevated amounts of phosphorus are the common cause of eutrophic freshwater rivers and lakes that often exhibit dense growths of algae or other nuisance aquatic plants, depressed dissolved oxy-gen levels, loss of fish and submerged aquatic vegetation, and foul odors. More than 30 percent of the lakes in New England were classified by State and Federal agencies as eutrophic in 2000 (U.S. Environmental Protection Agency, 2000b). Eutrophication of coastal waters from excessive nitrogen load-ings is also common in the United States and locally in New England (National Research Council, 2000; U.S. Environmen-tal Protection Agency, 2000b).
Sources of phosphorus and nitrogen to rivers, lakes, and coastal waters include permitted and unpermitted wastewater discharges (termed point sources), and runoff from the land sur-face, ground waters, and the atmosphere (a source primarily for nitrogen only) that collectively are called nonpoint sources. Agricultural and urban land uses are major sources of nutrients

2 Estimation of Total Nitrogen and Phosphorus in New England Streams Using Spatially Referenced Regression Models
(Carpenter and others, 1998) and are typically a greater source of nutrients than wastewater discharges (Howarth and others, 1996).
Numerous studies have assessed nutrient discharges to coastal waters of the eastern United States because of coastal eutrophication concerns. Many of these studies are summarized by the National Research Council (2000). Howarth and others (1996) report that riverine discharges of nitrogen to coastal waters have increased 5 to 20 times since pre-industrial times and that the increased human population, use of nitrogen fertil-izers, increased imports of human food and animal feed, and atmospheric deposition are the principal sources of the increas-ing levels of nitrogen to coastal waters. Nitrogen levels during the later years of the 20th century in forested watersheds of the northeastern United States continued to increase in contrast to urbanized rivers that have experienced stable nitrogen levels (Roman and others, 2000). Roman and others (2000), Robinson and others (2003), and Litke (1999) show that phosphorus con-centrations in streams have declined since the 1960s as a result of phosphate detergent bans and improved wastewater treat-ment at municipal sewage facilities. Nutrient loads to coastal waters of New England were characterized by the National Oceanic and Atmospheric Administration (NOAA) (1987). Boyer and others (2002) and Mullaney and others (2002) esti-mated the loads of nitrogen to coastal waters of the eastern United States and to Long Island Sound from Connecticut, respectively, and the relative importance of point and nonpoint sources to the total loads.
Managing and reducing nutrient loads to rivers has been a major water-pollution-control activity of individual states and U.S. Environmental Protection Agency (USEPA) under the Clean Water Act since the 1970s. In the 1990s, the USEPA implemented two programs to facilitate the management of nutrients in the Nation’s waters. The Nutrient Criteria program was designed to create waterbody-specific nutrient-concentra-tion criteria for rivers, lakes, and estuaries. The Total Maxi-mum Daily Load (TMDL) program was designed to assess and manage contaminant loads to waterbodies with designated-use impairment. Numeric criteria for concentrations of nitrogen and phosphorus to protect the designated uses of waterbodies are being generated by ecoregions and USEPA regions by the individual states and the USEPA (1998a). Available nutrient data for waterbodies also are being analyzed and new data are being collected during the process of creating the nutrient crite-ria.
USEPA implements the TMDL program for waterbodies not meeting designed uses because of some form of contamina-tion. TMDLs define the amount of contaminant allowable in the waterbody so that designated uses are met, and allocate allowable pollutant loadings from point and nonpoint sources that contribute the contaminants (U.S. Environmental Protec-tion Agency, 2003). States and the USEPA are charged with identifying streams, rivers, and other waterbodies that have nutrient levels causing designated-use impairment and may require management action. In New England, nearly 2,000 waterbodies do not meet designated uses due to nutrient and
organic enrichment, noxious aquatic plants, and low dissolved oxygen (U.S. Environmental Protection Agency, 2003).
Because water-quality data for New England waterbodies are limited for generating nutrient criteria and TMDLs, gener-ating new data through field sampling or modeling to character-ize nutrient levels is needed. Statistical modeling that relates nutrient conditions in waterbodies to watershed characteristics is an approach recommended by the National Research Council (2001) for the TMDL program. Such models can include mea-sures of model prediction uncertainty, which can be useful when developing and implementing TMDLs (National Research Council, 2001; Shabman, 2002). The National Research Council study also recommended that approaches to TMDL development incorporate physical (deterministic) char-acteristics along with stochastic models that provide estimates of the errors involved in the predictions.
The spatially referenced regression model SPARROW (Spatially Referenced Regressions on Watershed attributes), by Smith and others (1997), provides a modeling approach recom-mended by the National Research Council for water-quality assessments, including assessments needed for the TMDL pro-gram. The SPARROW model is designed to characterize nutri-ent loads in rivers based on a regression equation that includes terms for nutrient sources, land-to-water delivery of nutrients, and riverine transport and loss. The model also relies on geo-graphic information system (GIS) technology to link river seg-ments (termed reaches) and contributing drainage areas together. The SPARROW modeling technique has been suc-cessfully applied for predicting total nitrogen and phosphorus loads for streams in the continental United States (Smith and others, 1997) and New Zealand (Alexander and others, 2002), and for estimating total nitrogen loads for the Chesapeake Bay watershed in the eastern United States (Preston and Brakebill, 1999) and in the Albemarle-Pamlico watersheds in North Caro-lina (McMahon and others, 2003).
Purpose and Scope
This report describes results of two New England SPAR-ROW models—one each for total nitrogen and total phosphorus —that have been developed for assisting water-resources man-agers with TMDL and nutrient-criteria development in New England. The models were developed by the U.S. Geological Survey (USGS), in cooperation with the New England Inter-state Water Pollution Control Commission (NEIWPCC) and the USEPA. The New England models for total nitrogen and total phosphorus are calibrated for the early to mid-1990s and designed to refine national SPARROW results (Smith and oth-ers, 1997) by providing enhanced spatial detail and calibrated models on the basis of regional data. These enhancements are desirable because of national-model limitations that include (1) coarse stream resolution for parts of New England; (2) an inability to accurately predict nutrient loads in watersheds less than 65 km2 (Focazio and others, 1998); (3) the use of only agri-cultural and non agricultural land-use categorizations; and
Introduction 3
(4) older county-level point-source data from the late 1970s and early 1980s. This report also provides a basic understanding of the New England SPARROW model technique, a description of the New England SPARROW model input data, and examples of SPARROW results and applications for use by water-resources managers in TMDL and nutrient-criteria develop-ment efforts.
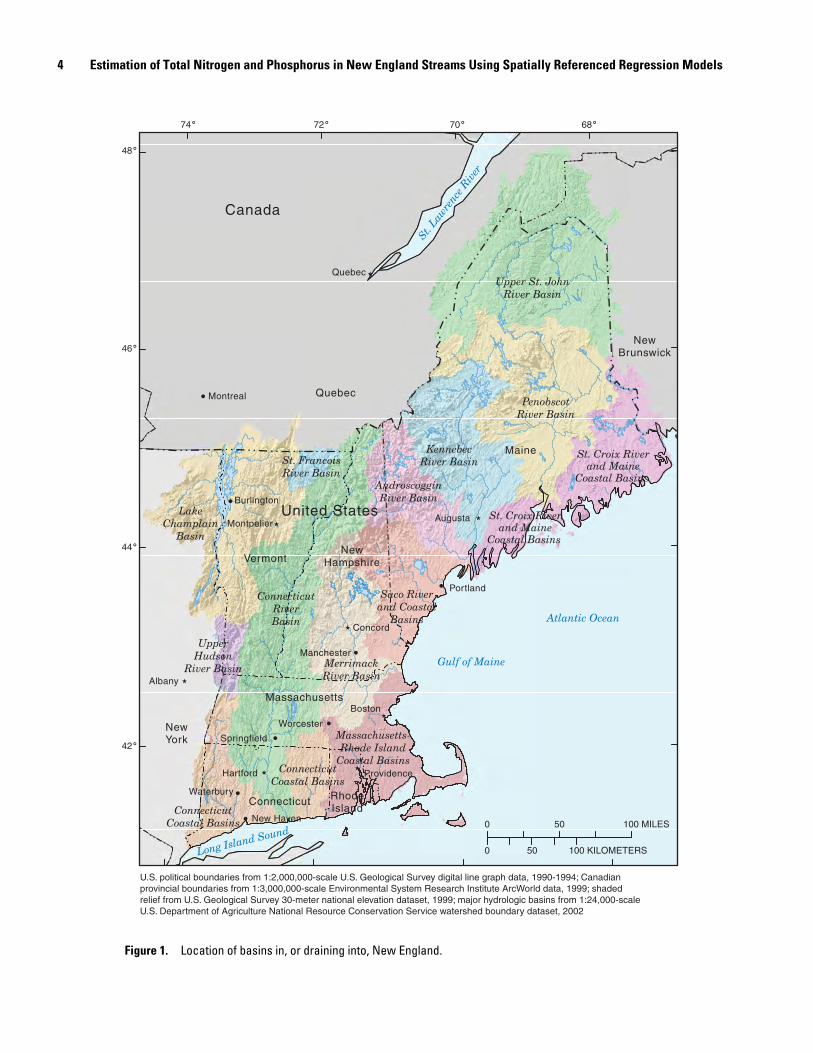
The study area for the New England SPARROW models includes watersheds that drain to Long Island Sound, the Gulf of Maine, Lake Champlain, and the New England portions of the Hudson and St. Francois River watersheds (fig. 1). The area includes 172,000 km2 and covers all of New Hampshire, Vermont, Massachusetts, Connecticut, Rhode Island, most of Maine, and parts of New York and Canada (fig. 1). Major urban areas within the study area include Boston, Springfield, and Worcester, Mass.; Hartford, Waterbury, and New Haven, Conn.; Providence, R.I.; Manchester, N.H.; Burlington, Vt.; and Portland, Maine. Major river basins include the Connecti-cut, Merrimack, Saco, Androscoggin, Kennebec, Penobscot, and parts of the St. Croix, and Upper St. John River Basins. Parts of the St. John and St. Croix River Basins in Canada were not included because of incomplete model input data for these areas.
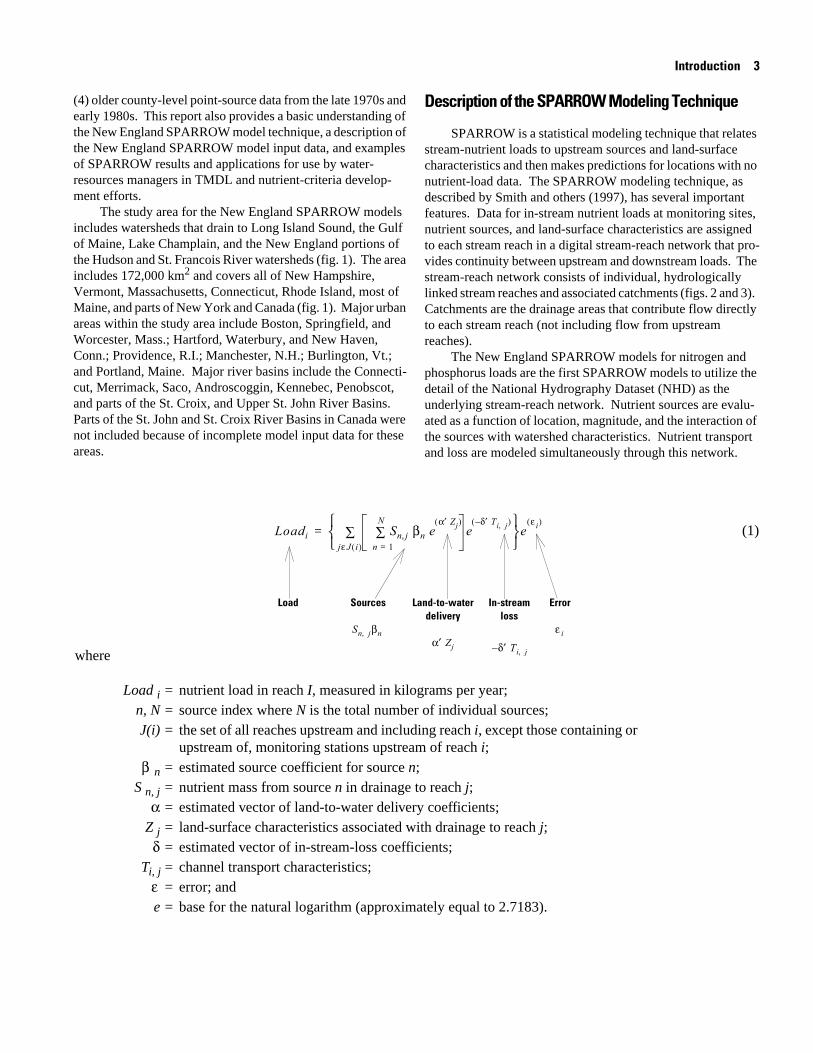
Description of the SPARROW Modeling Technique
SPARROW is a statistical modeling technique that relates stream-nutrient loads to upstream sources and land-surface characteristics and then makes predictions for locations with no nutrient-load data. The SPARROW modeling technique, as described by Smith and others (1997), has several important features. Data for in-stream nutrient loads at monitoring sites, nutrient sources, and land-surface characteristics are assigned to each stream reach in a digital stream-reach network that pro-vides continuity between upstream and downstream loads. The stream-reach network consists of individual, hydrologically linked stream reaches and associated catchments (figs. 2 and 3). Catchments are the drainage areas that contribute flow directly to each stream reach (not including flow from upstream reaches).
The New England SPARROW models for nitrogen and phosphorus loads are the first SPARROW models to utilize the detail of the National Hydrography Dataset (NHD) as the underlying stream-reach network. Nutrient sources are evalu-ated as a function of location, magnitude, and the interaction of the sources with watershed characteristics. Nutrient transport and loss are modeled simultaneously through this network.
(1)
where
Load i = nutrient load in reach I, measured in kilograms per year;n, N = source index where N is the total number of individual sources;J(i) = the set of all reaches upstream and including reach i, except those containing or
upstream of, monitoring stations upstream of reach i;β n = estimated source coefficient for source n;
S n, j = nutrient mass from source n in drainage to reach j;α = estimated vector of land-to-water delivery coefficients;
Z j = land-surface characteristics associated with drainage to reach j;δ = estimated vector of in-stream-loss coefficients;
Ti, j = channel transport characteristics;ε = error; ande = base for the natural logarithm (approximately equal to 2.7183).
Loadi Sn j, βn eα′ Zj( )
n 1=
N∑ e
δ′ Ti j,–( )
jε J i( )∑
⎩ ⎭⎨ ⎬⎧ ⎫
eε i( )
=
Load Sources
Sn j, βn
Land-to-water delivery
α′ Zj
In-stream loss
δ′ Ti j,–
Error
ε i
4 Estimation of Total Nitrogen and Phosphorus in New England Streams Using Spatially Referenced Regression Models
NewHampshire
Maine
Vermont
Massachusetts
Connecticut RhodeIsland
Quebec
NewBrunswick
NewYork
ConnecticutRiverBasin
KennebecRiver Basin
Upper St. JohnRiver Basin
PenobscotRiver Basin
AndroscogginRiver Basin
Saco Riverand Coastal
Basins
MerrimackRiver Basin
LakeChamplain
Basin
UpperHudson
River Basin
St. FrancoisRiver Basin
Gulf of Maine
Atlantic Ocean
Quebec
Boston
Albany
Concord
Augusta
Montreal
Hartford
Portland
New Haven
Waterbury
Worcester
Montpelier
Providence
Manchester
Burlington
Springfield
Canada
United States
Long Island Sound
St. Law
renc
e Riv
er
Massachusetts-Rhode Island
Coastal Basins
ConnecticutCoastal Basins
ConnecticutCoastal Basins
St. Croix Riverand Maine
Coastal Basins
St. Croix Riverand Maine
Coastal Basins
U.S. political boundaries from 1:2,000,000-scale U.S. Geological Survey digital line graph data, 1990-1994; Canadian provincial boundaries from 1:3,000,000-scale Environmental System Research Institute ArcWorld data, 1999; shaded relief from U.S. Geological Survey 30-meter national elevation dataset, 1999; major hydrologic basins from 1:24,000-scale U.S. Department of Agriculture National Resource Conservation Service watershed boundary dataset, 2002
0 100 MILES50
0 50 100 KILOMETERS
72˚ 70˚ 68˚74˚48˚
46˚
44˚
42˚
Figure 1. Location of basins in, or draining into, New England.

Introduction 5
The mathematical form of the SPARROW models is that of a nonlinear regression model in which nutrient loads are related to nutrient-source data, which are weighted by estimates of loss as a result of land-surface and in-stream processes (equa-tion 1) (Smith and others, 1997). In-stream nutrient loads (model-dependent variables) are evaluated as nonlinear func-tions of independent variables for nutrient sources (such as per-mitted wastewater releases; atmospheric deposition of nitrogen; and forest, agricultural, and developed land uses), for land-delivery processes (such as slope and precipitation), and for in-stream nutrient processes (such as travel times and reservoir-settling factors).
Model parameters are estimated for each of the indepen-dent variables to evaluate the statistical significance of that vari-able for explaining the spatial variation in-stream nutrient loads. Source parameters (βn) are included and tested to determine the statistical significance of nutrient sources (Sn,j) in explaining the variation of loads among stream reaches.
The land-to-water delivery coefficients (α) are used to determine the statistical significance of different types of land-surface characteristics (Z) for increasing or decreasing the delivery of nutrients from the land surface to the stream reach. For example, large percentages of developed land use, with accompanying impermeable surface areas, could potentially increase delivery of water and nutrients from the land surface to stream reaches. Developed lands could not only act as a nutri-ent source, but could increase the delivery of nutrients from atmospheric deposition to the streams. Land-to-water coeffi-cients that were considered in the New England SPARROW models include air temperature, precipitation, runoff per unit of area, land-surface slope, soil permeability, stream density, wet-land area, percent urban, percent forest, percent wetland, and percent open water. Delivery of wastewater-discharge loads to stream reaches was assumed to be unaffected by land-surface characteristics, and the value of the land-delivery term (e(α ′ Zj)) for these sources is set equal to one because the discharges are delivered directly into the streams.
Estimating in-stream-loss and reservoir-loss parameters (equation 1) is important for relating upstream sources to down-stream loads because some nutrients may be lost through stream and reservoir processes, such as denitrification (for nitrogen only), biological uptake, and sedimentation. These losses may be important for determining the importance of upstream nutri-ent sources to eventual receiving waters such as Long Island Sound and the Gulf of Maine. Although there are a variety of chemical, biological, and physical processes that contribute to in-stream loss of nutrients, the SPARROW models do not attempt to distinguish or identify individual nutrient loss pro-cesses because adequately detailed information on these pro-cesses generally is not available. The SPARROW model requires that estimates of mean-annual flow and associated mean velocities be assigned to each stream reach in the NHD.
In-stream-loss variables are included in the model and tested to see whether they are statistically significant predictors of nutri-ent loads and whether nutrient loads significantly decrease with increased residence time. Stream residence time is estimated by dividing reach length by mean velocity. Additionally, the recip-rocal hydrologic load (the ratio of the water-body surface area divided by the outflow) is used to determine if estimated nutri-ent loss in reservoirs is statistically significant. A coefficient for this variable (calculated by calibrating the model) is the areal hydraulic load, which is mathematically equivalent to the ratio of depth to water residence time (Chapra, 1997).
Fortran programs (Richard Alexander, U.S. Geological Survey, written commun., 2002) are used to simulate the down-stream movement of nutrients. SAS computer software pro-grams (Richard Alexander, written commun., 2002; Gregory Schwarz, U.S. Geological Survey, written commun., 2002, 2003) are used to calibrate and apply the model. Arc-Info GRID (Environmental Systems Research Institute, Inc., 1999) was used for storage of spatial data.
A bootstrap analysis was conducted to assess the errors associated with the predictions and to confirm calibration results. Bootstrap analysis uses a single dataset to derive an empirical distribution of the coefficients in the model that approximates their true distribution (Efron, 1982). Bootstrap analysis is useful when multiple datasets are not available to compute multiple sets of model coefficients and has been used in previous SPARROW models (Smith and others, 1997; Preston and Brakebill, 1999). For the SPARROW models the bootstrap analysis permits the computation of 200 sets of model coefficients, based on a single input dataset. The bootstrap analysis involves a parametric simulation in which Monte Carlo methods are used to generate 200 sets of bootstrap samples. This method is based on the assumption that the coefficients are distributed multivariate normal with the mean and the covari-ance matrix given by the original parametric model results (Gregory Schwarz, written commun., 2003). The final model predictions and prediction intervals are based on the parametric Monte Carlo bootstrap procedure.
Upstream monitoring station
Point source
Reach segment nonpoint-source contributing area "catchment"
Reach segment
Downstream monitoring station
Subbasin divide
Figure 2. Features of the SPARROW stream network (modi-fied from Schwarz (1998)).
6 Estimation of Total Nitrogen and Phosphorus in New England Streams Using Spatially Referenced Regression Models
74˚
72˚
70˚
68˚
42˚
44˚
46˚
010
0 M
ILE
S50
050
100
KIL
OM
ET
ER
SB
ase
from
U.S
. Geo
logi
cal S
urve
yD
igita
l lin
e gr
aph,
1:2
,000
,000
sca
le, 1
990-
94
EX
PLA
NAT
ION
N
atio
nal H
ydro
grap
hy D
atas
et
rea
ch c
atch
men
ts
E
xten
t of b
asin
s no
t mod
eled
Topo
grap
hic
map
Bas
e fr
om U
.S. G
eolo
gica
l Sur
vey
Cen
ter
Love
ll an
d N
orth
Wat
erfo
rd q
uadr
angl
es,
1:24
,000
sca
le, 1
989
70˚52
'30"
Rea
ch c
atch
men
t d
ivid
e Sub
basi
n di
vide
44˚15
'
NH
D s
trea
m
rea
ch
Sac
o R
iver
Bas
in
K
ezar
Lak
e su
bbas
in
Sub
basi
n di
vide
Kez
ar L
ake
subb
asin
NH
D s
trea
m r
each
NH
D w
ater
-bod
y c
ente
r lin
e
NH
D w
ater
-bod
y c
ente
r lin
e re
ach
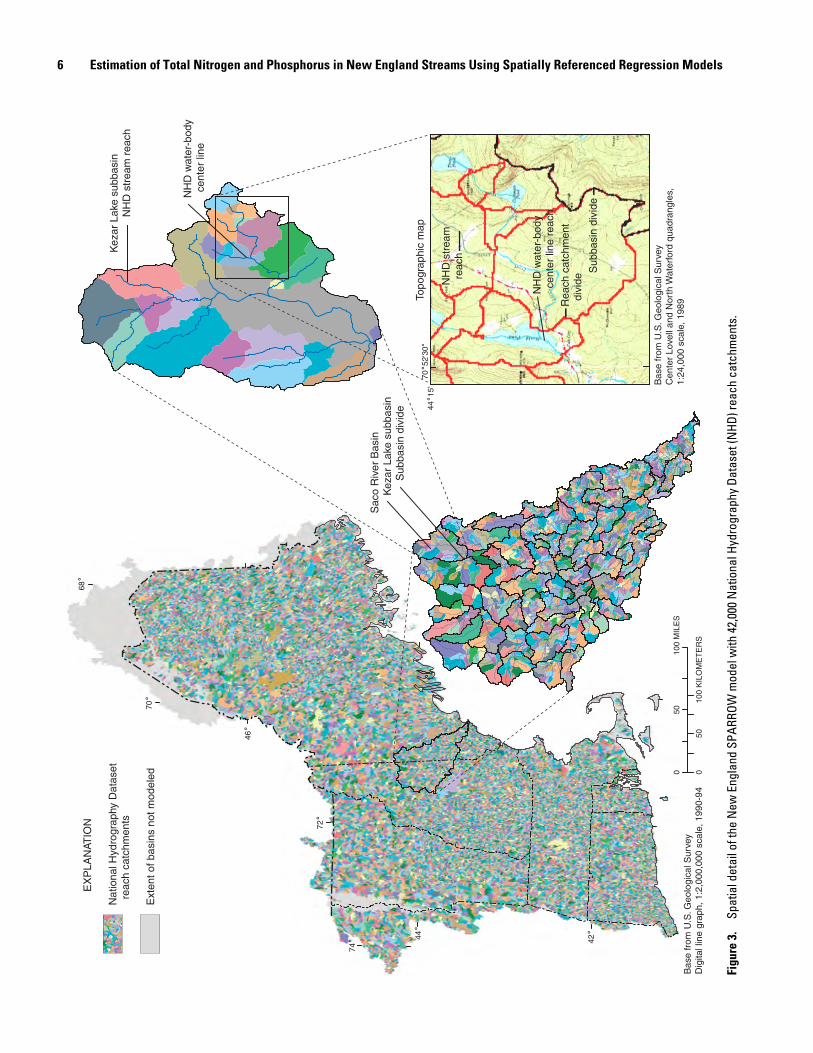
Figu
re 3
. Sp
atia
l det
ail o
f the
New
Eng
land
SPA
RROW
mod
el w
ith 4
2,00
0 N
atio
nal H
ydro
grap
hy D
atas
et (N
HD) r
each
cat
chm
ents
.
Description of Data Used in the New England Sparrow Models 7
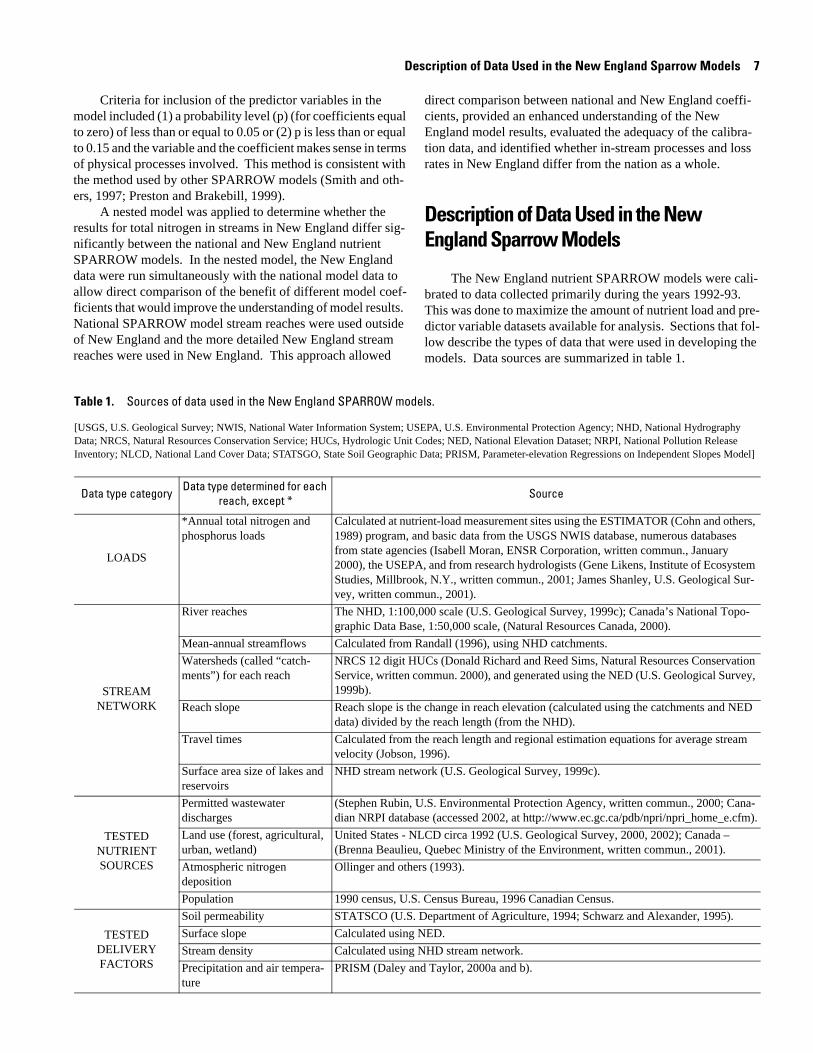
Criteria for inclusion of the predictor variables in the model included (1) a probability level (p) (for coefficients equal to zero) of less than or equal to 0.05 or (2) p is less than or equal to 0.15 and the variable and the coefficient makes sense in terms of physical processes involved. This method is consistent with the method used by other SPARROW models (Smith and oth-ers, 1997; Preston and Brakebill, 1999).
A nested model was applied to determine whether the results for total nitrogen in streams in New England differ sig-nificantly between the national and New England nutrient SPARROW models. In the nested model, the New England data were run simultaneously with the national model data to allow direct comparison of the benefit of different model coef-ficients that would improve the understanding of model results. National SPARROW model stream reaches were used outside of New England and the more detailed New England stream reaches were used in New England. This approach allowed
direct comparison between national and New England coeffi-cients, provided an enhanced understanding of the New England model results, evaluated the adequacy of the calibra-tion data, and identified whether in-stream processes and loss rates in New England differ from the nation as a whole.
Description of Data Used in the New England Sparrow Models
The New England nutrient SPARROW models were cali-brated to data collected primarily during the years 1992-93. This was done to maximize the amount of nutrient load and pre-dictor variable datasets available for analysis. Sections that fol-low describe the types of data that were used in developing the models. Data sources are summarized in table 1.
Table 1. Sources of data used in the New England SPARROW models.
[USGS, U.S. Geological Survey; NWIS, National Water Information System; USEPA, U.S. Environmental Protection Agency; NHD, National Hydrography Data; NRCS, Natural Resources Conservation Service; HUCs, Hydrologic Unit Codes; NED, National Elevation Dataset; NRPI, National Pollution Release Inventory; NLCD, National Land Cover Data; STATSGO, State Soil Geographic Data; PRISM, Parameter-elevation Regressions on Independent Slopes Model]
Data type category Data type determined for each reach, except * Source
LOADS
*Annual total nitrogen and phosphorus loads
Calculated at nutrient-load measurement sites using the ESTIMATOR (Cohn and others, 1989) program, and basic data from the USGS NWIS database, numerous databases from state agencies (Isabell Moran, ENSR Corporation, written commun., January 2000), the USEPA, and from research hydrologists (Gene Likens, Institute of Ecosystem Studies, Millbrook, N.Y., written commun., 2001; James Shanley, U.S. Geological Sur-vey, written commun., 2001).
STREAM NETWORK
River reaches The NHD, 1:100,000 scale (U.S. Geological Survey, 1999c); Canada’s National Topo-graphic Data Base, 1:50,000 scale, (Natural Resources Canada, 2000).
Mean-annual streamflows Calculated from Randall (1996), using NHD catchments.
Watersheds (called “catch-ments”) for each reach
NRCS 12 digit HUCs (Donald Richard and Reed Sims, Natural Resources Conservation Service, written commun. 2000), and generated using the NED (U.S. Geological Survey, 1999b).
Reach slope Reach slope is the change in reach elevation (calculated using the catchments and NED data) divided by the reach length (from the NHD).
Travel times Calculated from the reach length and regional estimation equations for average stream velocity (Jobson, 1996).
Surface area size of lakes and reservoirs
NHD stream network (U.S. Geological Survey, 1999c).
TESTED NUTRIENT SOURCES
Permitted wastewater discharges
(Stephen Rubin, U.S. Environmental Protection Agency, written commun., 2000; Cana-dian NRPI database (accessed 2002, at http://www.ec.gc.ca/pdb/npri/npri_home_e.cfm).
Land use (forest, agricultural, urban, wetland)
United States - NLCD circa 1992 (U.S. Geological Survey, 2000, 2002); Canada – (Brenna Beaulieu, Quebec Ministry of the Environment, written commun., 2001).
Atmospheric nitrogen deposition
Ollinger and others (1993).
Population 1990 census, U.S. Census Bureau, 1996 Canadian Census.
TESTED DELIVERY FACTORS
Soil permeability STATSCO (U.S. Department of Agriculture, 1994; Schwarz and Alexander, 1995).
Surface slope Calculated using NED.
Stream density Calculated using NHD stream network.
Precipitation and air tempera-ture
PRISM (Daley and Taylor, 2000a and b).

8 Estimation of Total Nitrogen and Phosphorus in New England Streams Using Spatially Referenced Regression Models
Hydrologic Network
The SPARROW model requires a hydrologically con-nected representation of a stream network through which nutri-ent loads are transported from an upstream reach to the next reach downstream, thus relating upstream sources to monitored load data (fig. 3). The hydrologic network used for the New England SPARROW models was the National Hydrography Dataset (NHD) (U.S. Geological Survey, 1999c). The NHD is produced by the USGS, in cooperation with the USEPA, at an initial scale of 1:100,000. The NHD is a digital hydrographic-data model represented in ARC/INFO, a GIS software package (Environmental Systems Research Institute, Inc., 1994). Basic characteristics, such as reach length, have been assigned to each stream reach including the identification of the upstream and downstream reaches in a series of related tabular databases. This link between upstream and downstream reaches is vital to the SPARROW model.
Previous SPARROW models in the United States (Smith and others, 1997; Alexander and others, 2002; Preston and Brakebill, 1999; McMahon and others, 2003) were based on USEPA’s River Reach File 1 (RF1) (DeWald and others, 1985). RF1 is a 1:500,000-scale, digital stream dataset that has attributes for stream-reach length, average stream discharge, and average flow velocity. The need for improved resolution in the New England models resulted in the selection of the NHD at a 1:100,000 scale. For comparison, in New England there are 2,462 RF1 catchments (mean size 75.6 km2) and 42,000 NHD catchments (mean size 4.4 km2).
The SPARROW model required a number of modifica-tions to the NHD. As a result of inconsistencies in the resolu-tion of intermittent streams across New England in the NHD, these streams were not included in the New England SPAR-ROW models. New reaches also were added for watersheds with contributing drainage in Canada. These watersheds included parts of the Connecticut Rivers and the Lake Cham-plain Basins on the basis of 1:50,000-scale digital hydrography data obtained from Natural Resources Canada’s National Topo-graphic Data Base (NTDB) (Natural Resources Canada, 2000). These stream reaches were integrated into the NHD by selecting and generalizing them to match the density of the NHD. Cana-dian reaches were not added for the Upper St. John and St. Croix River Basins in Maine because of lack of existing data required for input to SPARROW. In addition, editing of the NHD was required before it could be used for modeling. For example, connector reaches were added manually to connect gaps in the NHD network, and corrections were made to the relational flow tables, which identify which reach flows into which, to ensure hydrographic continuity throughout all water-sheds in the model. Tidal reaches are included in the network (no differentiation is made between tidal and nontidal in the NHD) but all nutrient-load measurement sites are upstream of the head of tide. Tidal reaches have been identified by a com-bination of National Elevation Dataset (NED) (U.S. Geological Survey, 1999b) data and known tidal ranges along the New England coast.
The catchment for each reach in the network (fig. 3) was determined using the NED, the NHD stream network, and the 12-digit hydrologic unit watersheds delineated by the Natural Resources Conservation Service (NRCS) (Donald Richard and Reed Sims, NRCS, written commun., 2000). The NRCS water-shed delineations were subdivided by use of the 30-meter NED dataset and surface modeling in the ARC/INFO Grid software (Environmental Systems Research Institute, Inc., 1999). An ARC/INFO AML program called AGREE (Hellweger and Maidmont, 1997) was used in this process. AGREE forces the NED to conform to the NHD stream network because drainage inferred from the NED may not match stream locations in the NHD. A similar process developed for this study forced com-patibility between the NRCS watershed boundaries (where they exist) to the surface-modeled watershed boundaries generated from the NED. An example of the spatial detail on the resultant stream reaches and catchments used in the New England SPAR-ROW hydrologic network is shown in figure 3.
Throughout this report, catchment refers to the local drain-age area directly contributing to a stream reach. Watersheds are the total upstream drainage area, and the term “basin” refers to large named watersheds such as the Connecticut River Basin.
Channel-Transport Characteristics Data
The New England SPARROW models require that esti-mates of mean-annual flow, stream velocity, and retention or settling effects of impoundments and lakes be assigned to each reach of the NHD. Mean-annual flow was determined by applying data from a streamflow-runoff map of the northeastern United States by Randall (1996) to the drainage area of each reach catchment. Mean-annual flow was calculated as the sum of the runoff from each catchment and all upstream catchments. Results of this process compared favorably with measured data from 211 active USGS stream-gaging stations. The estimates for 53 percent of the sites compared (112 stations) had errors less than 5 percent of the reported mean-annual flow; 30 percent of the sites (64 stations) had errors between 5 and 10 percent of the reported flow; 10 percent of the sites (20 stations) were between 10 and 15 percent of the reported flow; and the remain-ing 7 percent (15 stations) were between 15 and 28 percent of the reported flow.
In addition to the total streamflow in each stream reach, the SPARROW models require a time-of-travel or residence time in each reach. This residence time was generated for all stream reaches by applying a regression equation for stream velocity from Jobson (1996, equation 12) and dividing the reach length by the velocity. To estimate velocity, Jobson’s equation requires flow, reach slope, and total drainage area for each stream reach. A comparison of velocity estimates to measured velocity data was made using mean-annual flow conditions for five selected (relatively unregulated) New Hampshire stream reaches (Thor Smith, U.S. Geological Survey, written com-mun., 2002). These comparisons indicate that the velocity esti-mates may have as much as a 40 percent error. Further compar-
Description of Data Used in the New England Sparrow Models 9
ison of these estimates to RF1 velocity estimates reveal an improvement over the estimates associated with the RF1 net-work.
The parameter used by SPARROW in testing for loss of nutrients in lakes and reservoirs is defined as the “reciprocal areal hydraulic load,” which is the ratio of water-surface area to outflow discharge in units of years per meter (Alexander and others, 2002). Lakes and reservoirs were identified on the basis of the size of the waterbody polygon identified in the NHD. Reaches passing through waterbody polygons with surface areas greater than or equal to 2 km2 were classified as lake or reservoir reaches.
Stream Nutrient-Load Data
In-stream total nitrogen and total phosphorous loads serve as the dependent variables in the SPARROW models. The loads were estimated from stream discharge and water-quality data collected at monitoring sites throughout the New England model study area by a variety of agencies and researchers. Nutrient data were obtained from the USGS, numerous data-bases from state agencies (Isabell Moran, ENSR Corporation, written commun., January 2000), the USEPA, from researchers at Sleepers River Watershed in Vermont (James Shanley, U.S. Geological Survey, written commun., 2001), and from the Lake Champlain Long-Term Water Quality and Biological Monitor-ing Program in Vermont and New York (Laura Medalie, U.S. Geological Survey, written commun., 2001). Nutrient data from stream-monitoring sites were compiled for 1974 through 1999.
Nutrient-load values were generated from stream-dis-charge and water-quality data through the use of a log-linear regression model called ESTIMATOR (Cohn and others, 1989). The ESTIMATOR model estimates daily concentration values on the basis of available concentration data, flow, sea-son, and temporal load trends for a specified period. Estimated daily load values were calculated by ESTIMATOR from esti-mated daily concentrations and long-term average daily flows. The long-term average daily flow data are used in the analysis to prevent an error resulting from random spatial variations in precipitation and flow during any given year. Estimated daily load values were subsequently summed to calculate an annual stream load. Annual loads were averaged to calculate a mean-annual load. In most cases, the mean-annual load, which was representative of the early 1990s, was used for load prediction. Some sites did not have data to generate loads for the early 1990s; therefore, mean-annual loads from the available time period were used. The use of these data allowed for the inclu-sion of more sites in the model. Where flow data were not avail-able at the water-quality monitoring site, estimates were made by applying drainage-area adjustments to streamflow data from a nearby station. For the remainder of this report, stream loads that were derived from ESTIMATOR are referred to as “obser-vation loads” to distinguish them from those predicted by the SPARROW models.
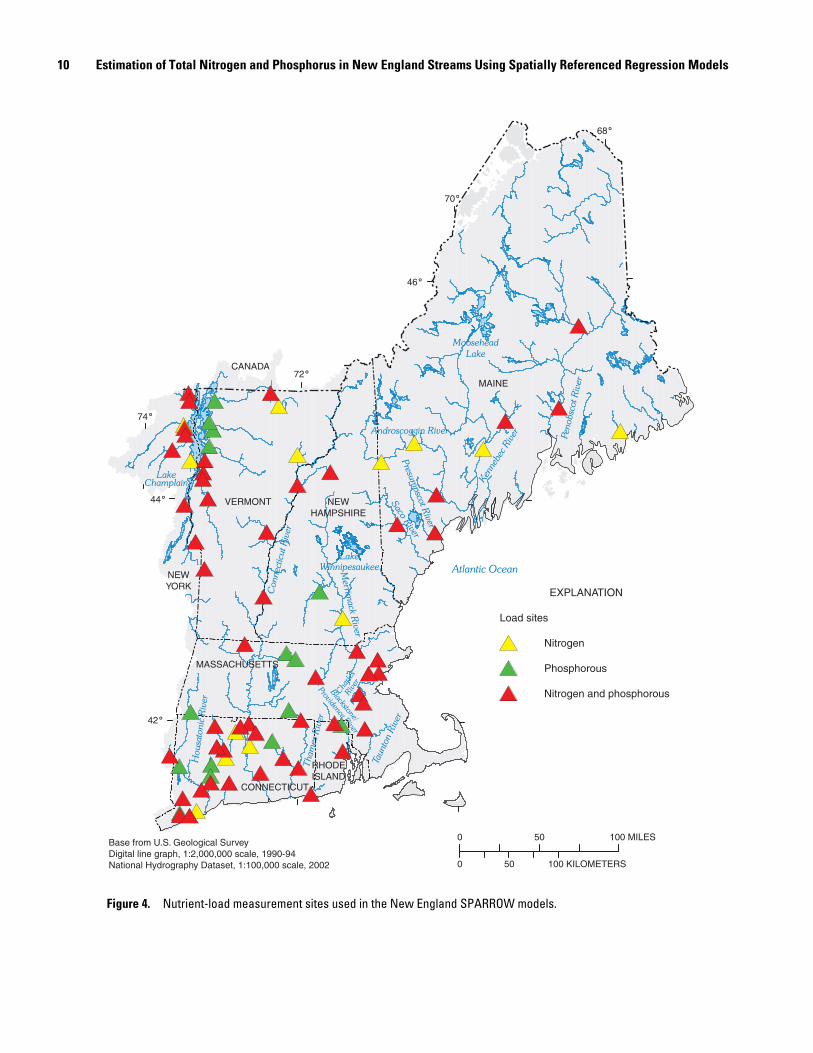
Nutrient-concentration data from many of the 123 sites with data were eliminated for use in the study because the data were considered inadequate for annual-load estimation. Sites had inadequate data if (1) the time period for collection of water-quality data did not overlap with the collection of flow data, (2) there was insufficient water-quality data to estimate an annual load, or (3) the error terms in the computed-load esti-mates were considered too high (greater than 60-percent error). Of the 72 sites with total nitrogen data and 95 sites with total phosphorus data, 65 and 67 sites, respectively, had appropriate stream-loading data and were included in the models (fig. 4).
Nutrient-Source Data
The SPARROW models require information on specific or potential point and nonpoint sources of nutrients. All potential sources were georeferenced and allocated to the appropriate NHD catchments.
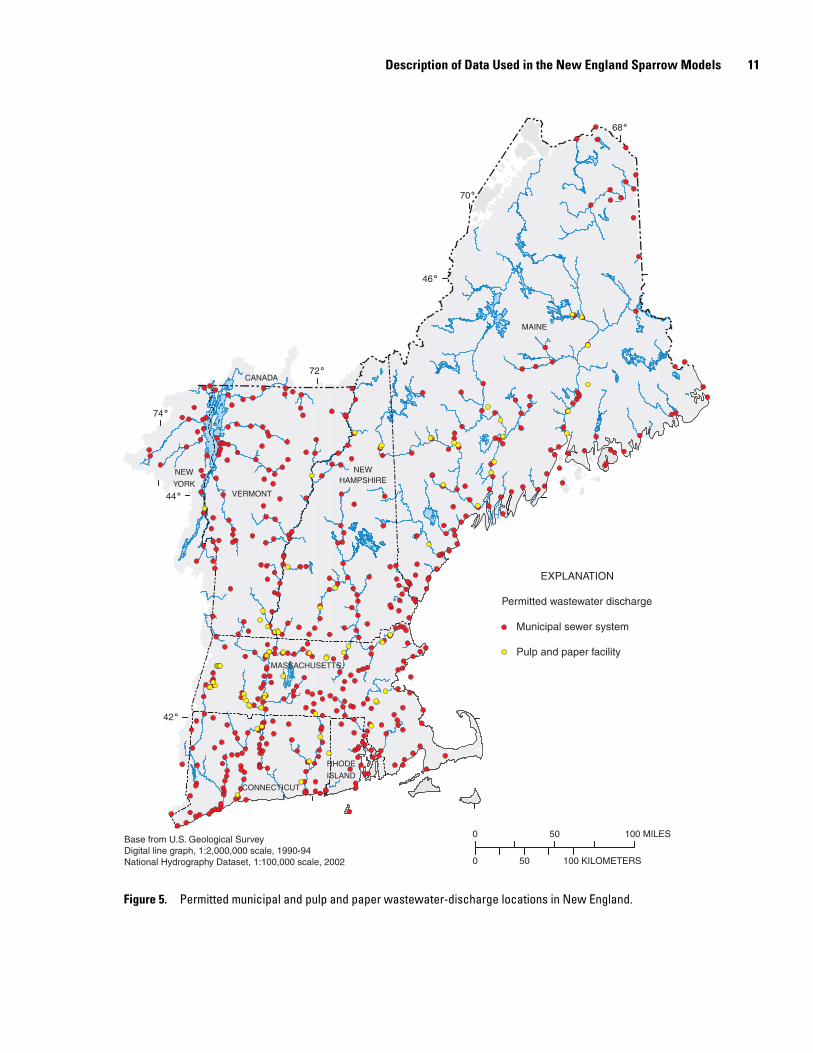
Municipal and industrial wastewater discharges of nitro-gen or phosphorus for the New England SPARROW models were based on a USEPA permitted wastewater-discharge dataset (Steven Rubin, U.S. Environmental Protection Agency, written commun., January 2000). This dataset includes esti-mates of nutrient loads and other pollutants as average yearly or monthly estimates of total nitrogen or total phosphorus. Loads were estimated by USEPA using a methodology developed by NOAA to characterize wastewater loads to coastal waters and watersheds (National Oceanic and Atmospheric Administra-tion, 1993). These provided estimates were based on a hierar-chy of data sources. The highest priority source was derived from data from the USEPA's National Pollutant Discharge Elimination System (NPDES) program as reported in each facility's discharge monitoring report (DMR). When this infor-mation was not available, permitted discharge limits set for the facility were used. If neither monitoring nor permit pollutant data were available, engineering values, associated with either the facility's industrial activity or level of wastewater treatment, were used for the estimate (National Ocean and Atmospheric Administration, 1993). Spot checking of the estimates, with a more recent nitrogen dataset for Connecticut and a phosphorus dataset for western Vermont, showed some large discrepancies. However, the wastewater discharge estimates were used in the models because they were the best available information cover-ing the entire New England model area.
Estimates of total nitrogen and total phosphorous loads from permitted wastewater discharges in Canada were provided by the Quebec Ministry of the Environment (Jacques Dupont, Quebec Ministry of the Environment, written commun., 2001). A total of 2,300 permitted wastewater discharges of nutrients were present on 1,506 stream reaches. Of these, 403 stream reaches had discharges from municipal wastewater-treatment facilities, and 73 reaches had discharges from paper and pulp industries (fig. 5). The remaining reaches had nutrient dis-charges from other industries.
10 Estimation of Total Nitrogen and Phosphorus in New England Streams Using Spatially Referenced Regression Models
Connect
icut R
iver
Tham
es
Riv
er
Housa
tonic
Riv
er
Taunto
n R
iver
Atlantic OceanMerrim
ack
Riv
er
Saco R
iver
Presu
mpsco
t River
Androscoggin River
Ken
nebe
c Riv
er Penobsc
ot R
iver
Blackstone/
Providence River
Cha
rles
Riv
er
Moosehead
Lake
LakeWinnipesaukee
74˚
72˚
70˚
68˚
42˚
44˚
46˚
0 100 MILES50
0 50 100 KILOMETERS
EXPLANATION
Load sites
Nitrogen
Phosphorous
Nitrogen and phosphorous
Base from U.S. Geological SurveyDigital line graph, 1:2,000,000 scale, 1990-94National Hydrography Dataset, 1:100,000 scale, 2002
MAINE
NEWHAMPSHIRE
VERMONT
MASSACHUSETTS
CONNECTICUT
RHODEISLAND
NEWYORK
CANADA
LakeChamplain
Figure 4. Nutrient-load measurement sites used in the New England SPARROW models.
Description of Data Used in the New England Sparrow Models 11
74˚
72˚
70˚
68˚
42˚
44˚
46˚
0 100 MILES50
0 50 100 KILOMETERS
EXPLANATION
Permitted wastewater discharge
Municipal sewer system
Pulp and paper facility
Base from U.S. Geological SurveyDigital line graph, 1:2,000,000 scale, 1990-94National Hydrography Dataset, 1:100,000 scale, 2002
MAINE
NEWHAMPSHIRE
VERMONT
MASSACHUSETTS
CONNECTICUT
RHODE
ISLAND
NEW
YORK
CANADA
Figure 5. Permitted municipal and pulp and paper wastewater-discharge locations in New England.

12 Estimation of Total Nitrogen and Phosphorus in New England Streams Using Spatially Referenced Regression Models
Disperse (nonpoint) nutrient sources are characterized in the SPARROW models through land-use data and measures of agricultural activities, population density, and atmospheric dep-osition. Land use was defined by using the National Land Cover Data (NLCD) that is available for the early 1990s at a 30-m resolution grid (U.S. Geological Survey, 2000; 2002). Major land-use categories include water, developed, barren, forest, shrubland, non-natural woody, agricultural, and wet-lands; although there are a total of 18 subcategories within the model area (table 2). A similar land-cover dataset in Canada at a 25-m resolution was integrated for areas in Canada (Brenna Beaulieu, Quebec Ministry of the Environment, written com-mun., 2001).
The New England SPARROW model study area is 75.7 percent forested, 7.9 percent agricultural, 5.8 percent developed, 4.9 percent wetland, 4.3 percent water, and 1.4 percent barren land.
County and state-based estimates of the nitrogen and phos-phorus contents of fertilizers applied to agricultural lands and from livestock manure wastes also were considered as predic-tors in the models (Alexander and Smith, 1990; Soil Conserva-tion Service, 1992). These data, however, were not used in the models because of apparent discrepancies in the reporting pro-cedures used from state to state.
Atmospheric deposition of nitrogen is known to be a sig-nificant contributor of total nitrogen to streams (Smith and oth-ers, 1997; Valigura and others, 2001). Atmospheric deposition of phosphorus is considered minor (Smith and others, 1997) and was not considered as a phosphorus source in the model. Esti-mates from an existing spatial model of atmospheric deposition of total nitrogen in the northeastern United States (Ollinger and others, 1993) were used for the New England SPARROW model for total nitrogen. In the model by Ollinger and others (1993), total nitrogen deposition is a function of latitude, longi-tude, and total precipitation. Contoured data from Ollinger and others (1993) were extended into Canada using a shaded relief map as a general guide for extrapolating the atmospheric-depo-sition contours for the New England SPARROW model area into Canada. In the New England SPARROW model area, atmospheric deposition of total nitrogen is shown to range from 320 kg/km2/yr in the northeastern part to 1,030 kg/km2/yr in the southwestern part and on the higher mountains such as Mount Washington in New Hampshire (Ollinger and others, 1993).
Human population density was characterized and tested in the New England SPARROW models by use of the 1990 census map data available in ARC INFO format. The U.S. Bureau of the Census data are available at the block group level (townwide or even more detailed for populous municipalities). Population was assumed to be evenly distributed within each block. Popu-lation for all blocks and partial blocks in each catchment were summed to estimate the population in each catchment. Cana-dian population data were from the 1996 Statistics Canada data at the enumeration-area level, which is comparable to the U.S. Census block group (Brenna Beaulieu, Quebec Ministry of the Environment, written commun., 2001). The population, in 1990, for the entire model area was 11,800,000.
Physical Watershed Characteristics Data
Meteorological and land-surface characteristics data were compiled for each catchment from a variety of datasets. Each of the variables was considered to be a potentially important factor in controlling the delivery of nutrients from the land sur-face to streams.
Table 2. Categories, subcategories, and codes of the National Land Cover Dataset.
[U.S. Geological Survey, 2000; Model runs were conducted in all combina-tions, with and without the main category of which it is a part, and with and without each subcategory within the main category; --, negligible in model ar-ea]
Category and subcategory name Percent of model area
Water 4.3
Open water1
Developed 5.8
Low-intensity residential1
High-intensity residential1
Commercial/industrial/transportation
Urban/recreational grasses1
Barren 1.4
Bare rock/sand/clay
Quarries/strip mines/gravel pits
Transitional
Forest 75.7
Deciduous forest1
Evergreen forest1
Mixed forest1
Shrubland --
Shrubland
Non-natural woody --
Orchards/vineyards/other1
Agricultural 7.9
Pasture/hay
Row crops
Small grains
Wetlands 4.9
Woody wetlands
Emergent herbaceous wetlands1Subcategories tested in the models.
Spatially Referenced Regression Models for Nutrients in New England Streams 13
Climatic Factors
The climatic variables of mean-annual air temperature and precipitation were compiled for the New England SPARROW models. Air temperature can affect the amount of nitrogen that reaches streams by affecting the rate of biological processes such as denitrification. Precipitation affects delivery by deter-mining the volume and rate of runoff in areas of the watershed. Estimates of mean-annual temperature and precipitation for use in the New England SPARROW models came from the Param-eter-elevation Regressions on Independent Slopes Model (PRISM) developed by Oregon State University as part of the USDA-NRCS Spatial Climate Mapping Project (Daley and Taylor, 2000a, 2000b). Climate data for Canada was estimated by extending PRISM data contours into Canada using a shaded relief map as an elevation factor guide along with Canadian cli-mate observation station data from State of the Environment (Jacques Dupont, Quebec Ministry of the Environment, written commun., 2001). Within the model area, mean-annual precipi-tation, averaged by catchment, ranged from a low of 79.4 centi-meters per year (cm/yr) to a high of 244 cm/yr, with an average catchment precipitation of 114 cm/yr. Mean-annual tempera-ture ranged from a low of 1.6oC to a high of 11.1oC, with an average mean-annual catchment temperature of 6.7oC.
Land-Surface Characteristics
Land-surface characteristics tested in the New England SPARROW models include soil permeability, surface slope, stream density, and percent wetlands. Soil permeability infor-mation (given in units of centimeters per hour) is contained in the 1:250,000-scale NRCS State Soil Geographic (STATSGO) data (U.S. Department of Agriculture, 1994; Schwarz and Alex-ander, 1995) and is based on generalized soils maps. Detailed county-level digitized soils data were not available throughout much of New England; therefore, the more generalized STATSGO data was used to characterize soils. Canadian soils data were integrated with STATSGO using 1:250,000-scale Canada Land Inventory (CLI) data (Agriculture and Argi-Food Canada, 1998). CLI data did not have a measure of permeabil-ity, but did have several attributes such as texture and wetness describing the soil suitability for agriculture. A comparison with adjacent soils in the United States was used to assign a mean permeability to each soil type. High soil permeability is an indication of increasing percolation to ground water that can influence nutrient delivery to streams. Within the model area, soil permeability averaged by catchment ranged from a low of 0.0 cm/h to a high of 46.1 cm/h, with an average of 11.3 cm/h.
Average slope of the land surface was determined for each catchment by use of the 30-m NED, which is available for all of New England and parts of Canada (U.S. Geological Survey, 1999b). Steep slopes can potentially cause increased delivery of nutrients to streams. Stream density for each catchment was calculated as the ratio of channel length to drainage area. The channel lengths used to calculate these values were those
depicted in the 1:100,000-scale NHD. High stream densities may indicate a shortened flow path of nutrients to streams, less loss, and high delivery rates. Within the model area, the land-surface slope, averaged by catchment and measured as a per-cent-change elevation relative to horizontal distance, ranged from a 0.0 to 52.6 percent, with an average of 8.2 percent.
Spatially Referenced Regression Models for Nutrients in New England Streams
The calibration and bootstrap New England SPARROW models are presented in this section. Total nitrogen and total phosphorus loads (referred to as simply nitrogen and phospho-rus) are dependent variables in the two separate models. Model applications and the comparison of model results to those from other nutrient assessments are provided.
Nitrogen
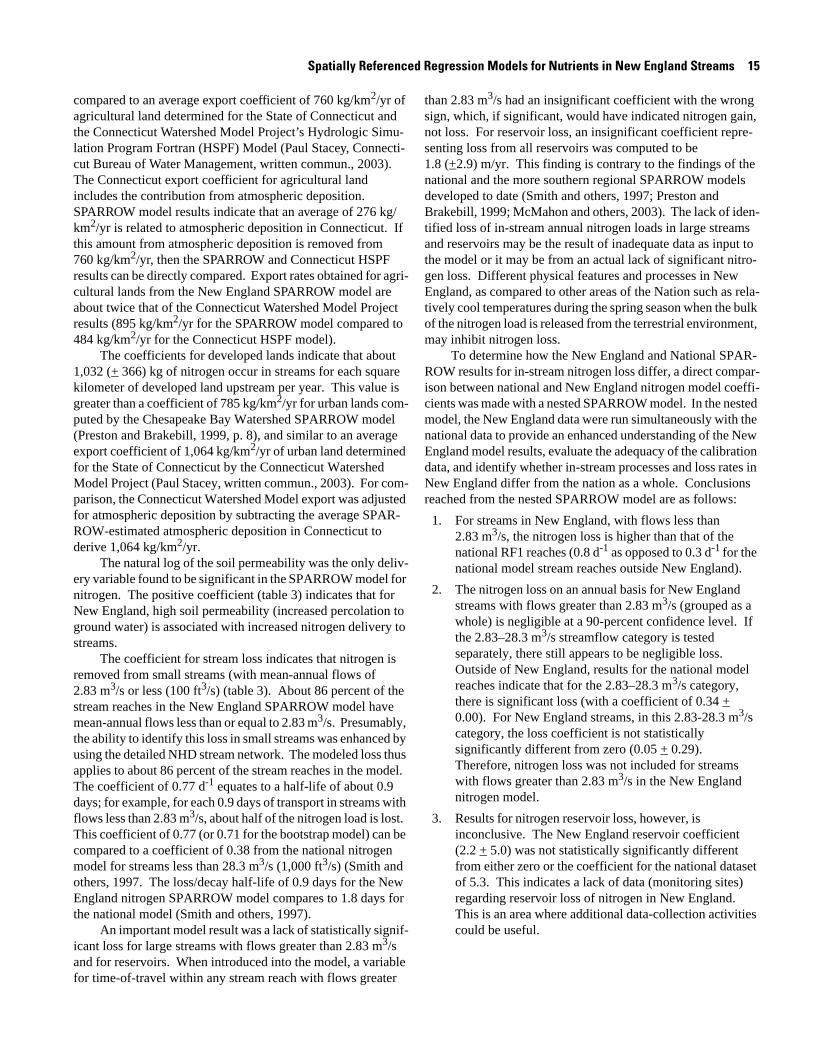
Calibration and bootstrap results for the New England SPARROW model for nitrogen are presented in table 3. Signif-icant predictor variables were found to include (1) nitrogen loadings from permitted municipal wastewater discharge, (2) atmospheric deposition of total nitrogen, (3) the area of agri-cultural land, and (4) the area of developed urban and suburban land. Parameter-coefficient estimates and standard errors of the estimates are given in table 3. In general, the nitrogen load pre-dicted by the model closely matches the observation load as indicated by a coefficient of determination (R2) of 0.95, and a mean-squared error of 0.16 (fig. 6). The coefficient of determi-nation is a measure of the fraction of variance in the load data (expressed in natural log units) that was accounted for by the independent variables used in the regression model. The nitro-gen model accounted for a large proportion of the variance (95 percent) in the load data. For comparison, the national SPARROW model for nitrogen had an R2 of 0.88 and a mean-squared error of 0.43 (Smith and others, 1997).
The coefficients estimated for the nitrogen model (table 3) have various physical interpretations. The coefficient of 1.11 for discharges from municipal wastewater-treatment facilities indicates that for each estimated kilogram of nitrogen dis-charged into the rivers at the wastewater-discharge locations, the model is predicting 1.11 (+ 0.36) kg of nitrogen at the mon-itoring stations. The coefficient of 0.37 for atmospheric depo-sition indicates that for each estimated kilogram of nitrogen that falls on the land surface, the model is predicting that an average of 0.37 (+ 0.06) kg are delivered to streams. In other words, the results of the model indicate that two thirds of the mass of nitro-gen from atmospheric deposition is either retained in the water-shed or returned to the atmosphere.
The coefficient for agricultural lands indicates that, per year, there are 895 (+ 335) kg of nitrogen in streams for each square kilometer of agricultural land. This value can be

14 Estimation of Total Nitrogen and Phosphorus in New England Streams Using Spatially Referenced Regression Models
Table 3. Calibration results and bootstrap estimates for the New England SPARROW model for total nitrogen.
[kg/km2/y, kilograms per kilometer squared per year; d-1, per day; m/s, meters per second; ft3/s, cubic feet per second; R-squared = 0.95; mean-square error = 0.16]
Significant predictor variables(coefficient units)
Calibration model coefficient
Standard error of coefficient
Bootstrap estimate of coefficient
Standard error of bootstrap coefficient
Sources:
Municipal wastewater-treatment facilities1 1.11 0.36 1.13 0.36
Atmospheric deposition1 .37 .06 .36 .07
Cultivated agricultural land (kg/km2/y) 895 335 910 362
Developed urban and suburban land (kg/km2/y) 1,032 366 988 385
Delivery variable:
Natural log of soil permeability1 0.37 .14 .36 .14
Loss variable:
Stream loss for small streams2 (d-1) .78 .49 .71 .522Dimensionless.3Small streams with mean-annual flow less than or equal to 2.83 m3/s (100 ft3/s).
8 9 10 11 12 13 14 15 16 178
9
10
11
12
13
14
15
16
17
OBSERVATIONNATURAL LOG OF NITROGEN LOAD, IN KILOGRAMS PER YEAR
PR
ED
ICT
ION
FR
OM
MO
DE
LN
AT
UR
AL L
OG
OF
NIT
RO
GE
N L
OA
D, IN
KIL
OG
RA
MS
PE
R Y
EA
R
Figure 6. Relation of predicted and observed total nitrogen load values from the calibration of the New England SPARROW model.
Spatially Referenced Regression Models for Nutrients in New England Streams 15
compared to an average export coefficient of 760 kg/km2/yr of agricultural land determined for the State of Connecticut and the Connecticut Watershed Model Project’s Hydrologic Simu-lation Program Fortran (HSPF) Model (Paul Stacey, Connecti-cut Bureau of Water Management, written commun., 2003). The Connecticut export coefficient for agricultural land includes the contribution from atmospheric deposition. SPARROW model results indicate that an average of 276 kg/km2/yr is related to atmospheric deposition in Connecticut. If this amount from atmospheric deposition is removed from 760 kg/km2/yr, then the SPARROW and Connecticut HSPF results can be directly compared. Export rates obtained for agri-cultural lands from the New England SPARROW model are about twice that of the Connecticut Watershed Model Project results (895 kg/km2/yr for the SPARROW model compared to 484 kg/km2/yr for the Connecticut HSPF model).
The coefficients for developed lands indicate that about 1,032 (+ 366) kg of nitrogen occur in streams for each square kilometer of developed land upstream per year. This value is greater than a coefficient of 785 kg/km2/yr for urban lands com-puted by the Chesapeake Bay Watershed SPARROW model (Preston and Brakebill, 1999, p. 8), and similar to an average export coefficient of 1,064 kg/km2/yr of urban land determined for the State of Connecticut by the Connecticut Watershed Model Project (Paul Stacey, written commun., 2003). For com-parison, the Connecticut Watershed Model export was adjusted for atmospheric deposition by subtracting the average SPAR-ROW-estimated atmospheric deposition in Connecticut to derive 1,064 kg/km2/yr.
The natural log of the soil permeability was the only deliv-ery variable found to be significant in the SPARROW model for nitrogen. The positive coefficient (table 3) indicates that for New England, high soil permeability (increased percolation to ground water) is associated with increased nitrogen delivery to streams.
The coefficient for stream loss indicates that nitrogen is removed from small streams (with mean-annual flows of 2.83 m3/s or less (100 ft3/s) (table 3). About 86 percent of the stream reaches in the New England SPARROW model have mean-annual flows less than or equal to 2.83 m3/s. Presumably, the ability to identify this loss in small streams was enhanced by using the detailed NHD stream network. The modeled loss thus applies to about 86 percent of the stream reaches in the model. The coefficient of 0.77 d-1 equates to a half-life of about 0.9 days; for example, for each 0.9 days of transport in streams with flows less than 2.83 m3/s, about half of the nitrogen load is lost. This coefficient of 0.77 (or 0.71 for the bootstrap model) can be compared to a coefficient of 0.38 from the national nitrogen model for streams less than 28.3 m3/s (1,000 ft3/s) (Smith and others, 1997. The loss/decay half-life of 0.9 days for the New England nitrogen SPARROW model compares to 1.8 days for the national model (Smith and others, 1997).
An important model result was a lack of statistically signif-icant loss for large streams with flows greater than 2.83 m3/s and for reservoirs. When introduced into the model, a variable for time-of-travel within any stream reach with flows greater
than 2.83 m3/s had an insignificant coefficient with the wrong sign, which, if significant, would have indicated nitrogen gain, not loss. For reservoir loss, an insignificant coefficient repre-senting loss from all reservoirs was computed to be 1.8 (+2.9) m/yr. This finding is contrary to the findings of the national and the more southern regional SPARROW models developed to date (Smith and others, 1997; Preston and Brakebill, 1999; McMahon and others, 2003). The lack of iden-tified loss of in-stream annual nitrogen loads in large streams and reservoirs may be the result of inadequate data as input to the model or it may be from an actual lack of significant nitro-gen loss. Different physical features and processes in New England, as compared to other areas of the Nation such as rela-tively cool temperatures during the spring season when the bulk of the nitrogen load is released from the terrestrial environment, may inhibit nitrogen loss.
To determine how the New England and National SPAR-ROW results for in-stream nitrogen loss differ, a direct compar-ison between national and New England nitrogen model coeffi-cients was made with a nested SPARROW model. In the nested model, the New England data were run simultaneously with the national data to provide an enhanced understanding of the New England model results, evaluate the adequacy of the calibration data, and identify whether in-stream processes and loss rates in New England differ from the nation as a whole. Conclusions reached from the nested SPARROW model are as follows:
1. For streams in New England, with flows less than 2.83 m3/s, the nitrogen loss is higher than that of the national RF1 reaches (0.8 d-1 as opposed to 0.3 d-1 for the national model stream reaches outside New England).
2. The nitrogen loss on an annual basis for New England streams with flows greater than 2.83 m3/s (grouped as a whole) is negligible at a 90-percent confidence level. If the 2.83–28.3 m3/s streamflow category is tested separately, there still appears to be negligible loss. Outside of New England, results for the national model reaches indicate that for the 2.83–28.3 m3/s category, there is significant loss (with a coefficient of 0.34 + 0.00). For New England streams, in this 2.83-28.3 m3/s category, the loss coefficient is not statistically significantly different from zero (0.05 + 0.29). Therefore, nitrogen loss was not included for streams with flows greater than 2.83 m3/s in the New England nitrogen model.
3. Results for nitrogen reservoir loss, however, is inconclusive. The New England reservoir coefficient (2.2 + 5.0) was not statistically significantly different from either zero or the coefficient for the national dataset of 5.3. This indicates a lack of data (monitoring sites) regarding reservoir loss of nitrogen in New England. This is an area where additional data-collection activities could be useful.
16 Estimation of Total Nitrogen and Phosphorus in New England Streams Using Spatially Referenced Regression Models
Phosphorus
Calibration and bootstrap results for the phosphorus New England SPARROW model are presented in table 4. Signifi-cant predictor variables include (1) phosphorus from permitted municipal and pulp and paper wastewater discharges, (2) area of forested land, (3) area of agricultural land, (4) the area of devel-oped urban and suburban land, (5) a reservoir loss variable for small lakes and reservoirs with surface area less than 10 km2, and (6) an exponential loss term for streams with flows less than or equal to 2.83 m3/s (100 ft3/s). Parameter coefficient esti-mates and standard errors of the estimates are given in table 4. A comparison of the observations and model predictions for phosphorus is shown in figure 7. In general, the model results fit the observation load data, with a coefficient of determination (R2) of 0.94, and a mean-squared error of 0.23. For comparison, the national phosphorus SPARROW model had an R2 of 0.81 and a mean-squared error of 0.71 (Smith and others, 1997).
The p value for the reservoir loss variable was 0.096 in the calibration model, and 0.04 in the bootstrap model. These lev-els of significance, together with the initial coefficient and the bootstrap coefficient estimates being similar (109 and 105, respectively), provide justification for the inclusion of the res-ervoir loss as a predictor in reservoirs or lakes with surface areas less than 10 km2. The p value for in-stream loss in small streams, with mean-annual flows less than or equal to 2.83 m3/s (100 ft3/s), was 0.27 in the calibration model but was 0.125 in the bootstrap model. Although statistically, this vari-able is only marginally significant (p = .125) in predicting phos-phorus loads, further justification for inclusion is found in the coefficient estimates and in previous SPARROW model results. In previous SPARROW phosphorus models, phosphorus loss was significant in small rivers and streams (Smith and others, 1997; McMahon and others, 2003).
In the phosphorus model (table 4), the coefficient of 1.27 for discharges from municipal wastewater-treatment facilities and pulp and paper discharges indicates that for each estimated kilogram of phosphorus discharged into the rivers at the waste-water-discharge locations, the model is predicting an average of 1.27 (+ 0.22) kg of phosphorus at the monitoring stations. The coefficients for forested lands indicate that about 13.4 (+ 3.8) kg of phosphorus are estimated as entering streams for each square kilometer of forested land upstream per year. Likewise, the coefficients for agricultural lands indicate that about 108 (+ 26) kg of phosphorus are estimated as entering the river sys-tem for each square kilometer of agricultural land upstream per year. The coefficients for developed lands indicate that about 38.9 (+ 13.7) kg of phosphorus are modeled as entering the river system for each square kilometer of developed land upstream per year. Unlike with nitrogen, there is no Connecticut HSPF phosphorus model with which to compare model coefficients.
None of the variables that were used to test for phosphorus loss on the landscape (such as soil permeability) were signifi-cant predictors of phosphorus loads (at either 85- or 95-percent confidence levels). It is presumed that the land-delivery losses are factored into the source coefficients for forested, agricul-
tural, and developed land areas where phosphorus is applied or distributed to the land area. Percent wetland was the land-deliv-ery factor that performed the best, but it had a p value greater than 0.60.
The coefficients for reservoir and stream loss indicate that phosphorus is removed from small reservoirs and small streams (table 4). As with other studies, the reservoir loss coefficient of 109 m/yr in the calibration model, quantifies the length of the water column from which nutrients are removed per unit of time by benthic processes, including the settling and burial of partic-ulates (Alexander and others, 2002; Chapra, 1975; Molot and Dillon, 1993; Kelly and others, 1987). The coefficient of 0.48 d-1 for loss in small streams equates to a half-life of about 1.5 days. This means that for each 1.5 days of transport in streams with flows less than 2.83 m3/s, about half of the phos-phorus load is lost, most likely from sedimentation or biological processes. This coefficient of 0.48 can be compared to a coef-ficient of 0.27 (2.6-day half-life) from the national phosphorus model for streams less than 28.3 m3/s (Smith and others, 1997); and to a coefficient of 11.2 from a New Zealand phosphorus model for streams less than 1 m3/s (1.5-hour half-life) (Richard Alexander, written commun., 2003).
Model Assumptions and Limitations
The SPARROW model is based on assumptions that define the form and context of a multiple regression analysis. These assumptions are (1) the functional form of the model is correct in terms of the variables included and their role in the model; (2) the error term is independent across the range of observations implying that there is no correlation in the errors among the monitored streams (Smith and others, 1997); (3) the residuals of the model are normally (or near normally) distrib-uted; and (4) the residuals are homoscedastic; that is, the distri-bution of the residuals are similar throughout the range of pre-dicted values. In addition, the bootstrap analysis is designed to provide robust coefficient estimates, model predictions, and prediction intervals in relation to the characteristics of both the model and sampling errors (Smith and others, 1997).
Preliminary analysis of the residuals for each model has been conducted. This analysis indicates that the residuals appear to be randomly distributed across the New England region with no spatial grouping of over- and under-predictions. But, statistically, the residuals are slightly positively skewed. Additional analyses of residuals as related to watershed charac-teristics and nutrient sources may help to define factors influ-encing the residuals.
As with any model, there are strengths and weaknesses associated with the model and its results. Strengths of the New England SPARROW models are the high R2 and relatively good precision of most parameter coefficients obtained with the models. These results support the use of these models as water-quality-assessment tools. Other strengths of the models include the ability to provide regionally consistent characterizations of nutrient conditions and sources in streams, and the transport and

Spatially Referenced Regression Models for Nutrients in New England Streams 17
Table 4. Calibration results and bootstrap estimates for the New England SPARROW model for total phosphorus.
[kg/km2/yr, kilograms per kilometer squared per year; m/yr, meters per year; d-1, per day; km2, square kilometers; m3/s, cubic meters per second; ft3/s, cubic feet per second; R-squared = 0.94; mean-square error = 0.23]
Significant predictor variables(coefficient units)
Calibration model
coefficient
Standard error of coefficient
Bootstrap estimate of coefficient
Standard error of bootstrap coefficient
Sources:
Municipal wastewater-treatment facilities and pulp and paper facilities1 1.27 0.22 1.28 0.22
Forested land (kg/km2/yr) 13.4 3.8 12.7 4.1
Agricultural land (kg/km2/yr) 108 25.7 110 27.5
Developed urban and suburban land (kg/km2/yr) 38.9 13.7 37.8 14.3
Loss variables:
Reservoir loss variable for small lakes and reservoirs2 (m/yr) 109 64.5 105 59.7
Stream loss for small streams3 .48 d-1 .43 .42 .414Dimensionless.5Small lakes and reservoirs with surface area less than or equal to 10 km2.6Small streams with mean-annual flow less than or equal to 2.83 m3/s (100 ft3/s).
OBSERVATIONNATURAL LOG OF PHOSPHORUS LOAD, IN KILOGRAMS PER YEAR
PR
ED
ICT
ION
FR
OM
MO
DE
LN
AT
UR
AL
LO
G O
F P
HO
SP
HO
RU
S L
OA
D,
IN K
ILO
GR
AM
S P
ER
YE
AR
4
5
6
7
8
9
10
11
12
13
14
15
4 5 6 7 8 9 10 11 12 13 14 15
Figure 7. Relation of predicted and observed total phosphorus load values from the cali-bration of the New England SPARROW model.
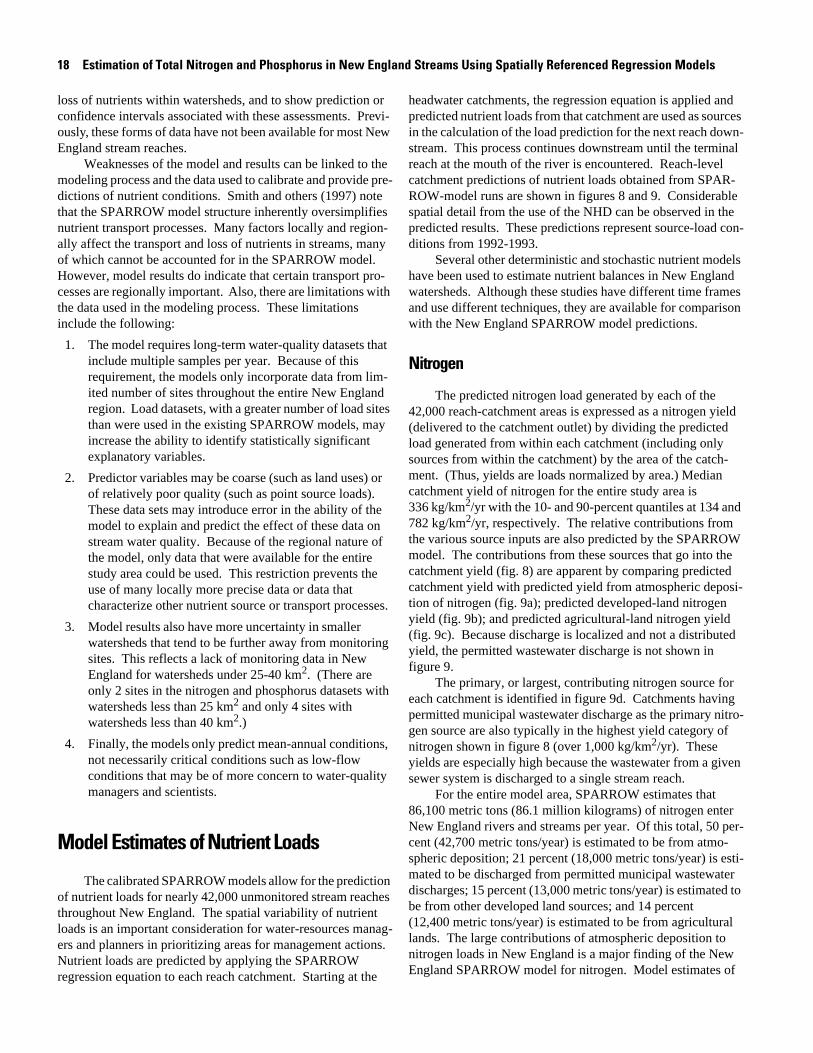
18 Estimation of Total Nitrogen and Phosphorus in New England Streams Using Spatially Referenced Regression Models
loss of nutrients within watersheds, and to show prediction or confidence intervals associated with these assessments. Previ-ously, these forms of data have not been available for most New England stream reaches.
Weaknesses of the model and results can be linked to the modeling process and the data used to calibrate and provide pre-dictions of nutrient conditions. Smith and others (1997) note that the SPARROW model structure inherently oversimplifies nutrient transport processes. Many factors locally and region-ally affect the transport and loss of nutrients in streams, many of which cannot be accounted for in the SPARROW model. However, model results do indicate that certain transport pro-cesses are regionally important. Also, there are limitations with the data used in the modeling process. These limitations include the following:
1. The model requires long-term water-quality datasets that include multiple samples per year. Because of this requirement, the models only incorporate data from lim-ited number of sites throughout the entire New England region. Load datasets, with a greater number of load sites than were used in the existing SPARROW models, may increase the ability to identify statistically significant explanatory variables.
2. Predictor variables may be coarse (such as land uses) or of relatively poor quality (such as point source loads). These data sets may introduce error in the ability of the model to explain and predict the effect of these data on stream water quality. Because of the regional nature of the model, only data that were available for the entire study area could be used. This restriction prevents the use of many locally more precise data or data that characterize other nutrient source or transport processes.
3. Model results also have more uncertainty in smaller watersheds that tend to be further away from monitoring sites. This reflects a lack of monitoring data in New England for watersheds under 25-40 km2. (There are only 2 sites in the nitrogen and phosphorus datasets with watersheds less than 25 km2 and only 4 sites with watersheds less than 40 km2.)
4. Finally, the models only predict mean-annual conditions, not necessarily critical conditions such as low-flow conditions that may be of more concern to water-quality managers and scientists.
Model Estimates of Nutrient Loads
The calibrated SPARROW models allow for the prediction of nutrient loads for nearly 42,000 unmonitored stream reaches throughout New England. The spatial variability of nutrient loads is an important consideration for water-resources manag-ers and planners in prioritizing areas for management actions. Nutrient loads are predicted by applying the SPARROW regression equation to each reach catchment. Starting at the
headwater catchments, the regression equation is applied and predicted nutrient loads from that catchment are used as sources in the calculation of the load prediction for the next reach down-stream. This process continues downstream until the terminal reach at the mouth of the river is encountered. Reach-level catchment predictions of nutrient loads obtained from SPAR-ROW-model runs are shown in figures 8 and 9. Considerable spatial detail from the use of the NHD can be observed in the predicted results. These predictions represent source-load con-ditions from 1992-1993.
Several other deterministic and stochastic nutrient models have been used to estimate nutrient balances in New England watersheds. Although these studies have different time frames and use different techniques, they are available for comparison with the New England SPARROW model predictions.
Nitrogen
The predicted nitrogen load generated by each of the 42,000 reach-catchment areas is expressed as a nitrogen yield (delivered to the catchment outlet) by dividing the predicted load generated from within each catchment (including only sources from within the catchment) by the area of the catch-ment. (Thus, yields are loads normalized by area.) Median catchment yield of nitrogen for the entire study area is 336 kg/km2/yr with the 10- and 90-percent quantiles at 134 and 782 kg/km2/yr, respectively. The relative contributions from the various source inputs are also predicted by the SPARROW model. The contributions from these sources that go into the catchment yield (fig. 8) are apparent by comparing predicted catchment yield with predicted yield from atmospheric deposi-tion of nitrogen (fig. 9a); predicted developed-land nitrogen yield (fig. 9b); and predicted agricultural-land nitrogen yield (fig. 9c). Because discharge is localized and not a distributed yield, the permitted wastewater discharge is not shown in figure 9.
The primary, or largest, contributing nitrogen source for each catchment is identified in figure 9d. Catchments having permitted municipal wastewater discharge as the primary nitro-gen source are also typically in the highest yield category of nitrogen shown in figure 8 (over 1,000 kg/km2/yr). These yields are especially high because the wastewater from a given sewer system is discharged to a single stream reach.
For the entire model area, SPARROW estimates that 86,100 metric tons (86.1 million kilograms) of nitrogen enter New England rivers and streams per year. Of this total, 50 per-cent (42,700 metric tons/year) is estimated to be from atmo-spheric deposition; 21 percent (18,000 metric tons/year) is esti-mated to be discharged from permitted municipal wastewater discharges; 15 percent (13,000 metric tons/year) is estimated to be from other developed land sources; and 14 percent (12,400 metric tons/year) is estimated to be from agricultural lands. The large contributions of atmospheric deposition to nitrogen loads in New England is a major finding of the New England SPARROW model for nitrogen. Model estimates of
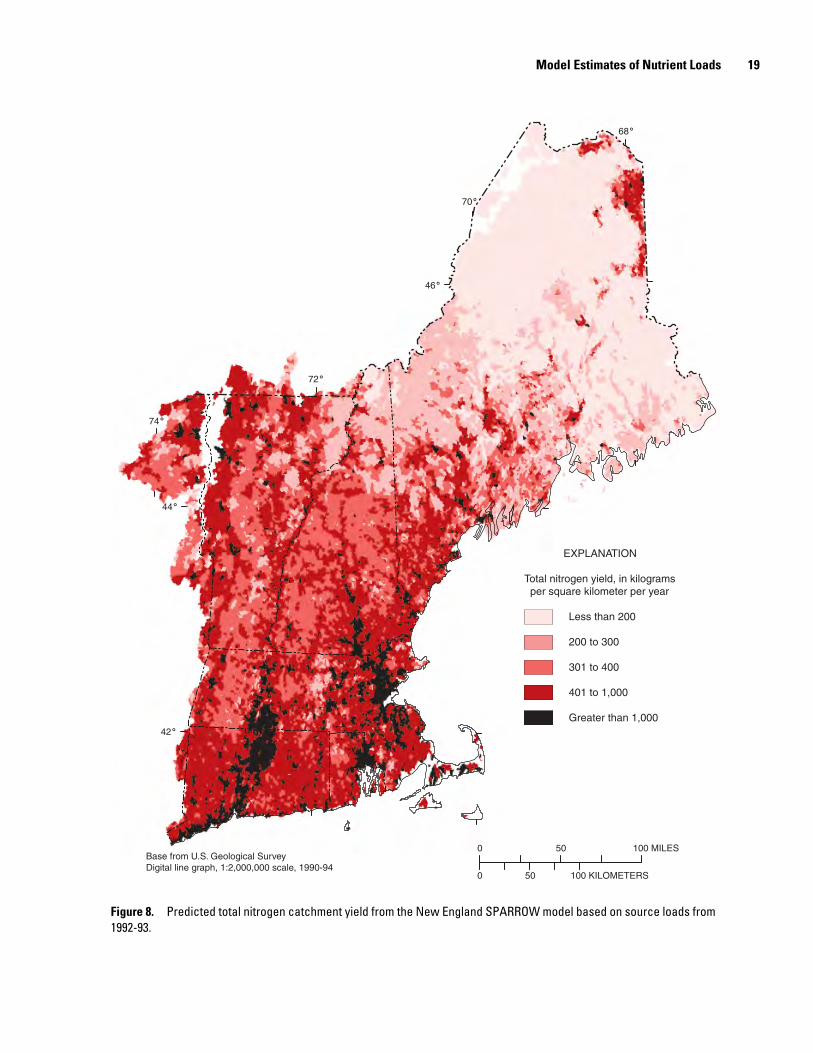
Model Estimates of Nutrient Loads 19
74˚
72˚
70˚
68˚
42˚
44˚
46˚
0 100 MILES50
0 50 100 KILOMETERS
EXPLANATION
Total nitrogen yield, in kilograms per square kilometer per year
Less than 200
200 to 300
301 to 400
401 to 1,000
Greater than 1,000
Base from U.S. Geological SurveyDigital line graph, 1:2,000,000 scale, 1990-94
Figure 8. Predicted total nitrogen catchment yield from the New England SPARROW model based on source loads from 1992-93.
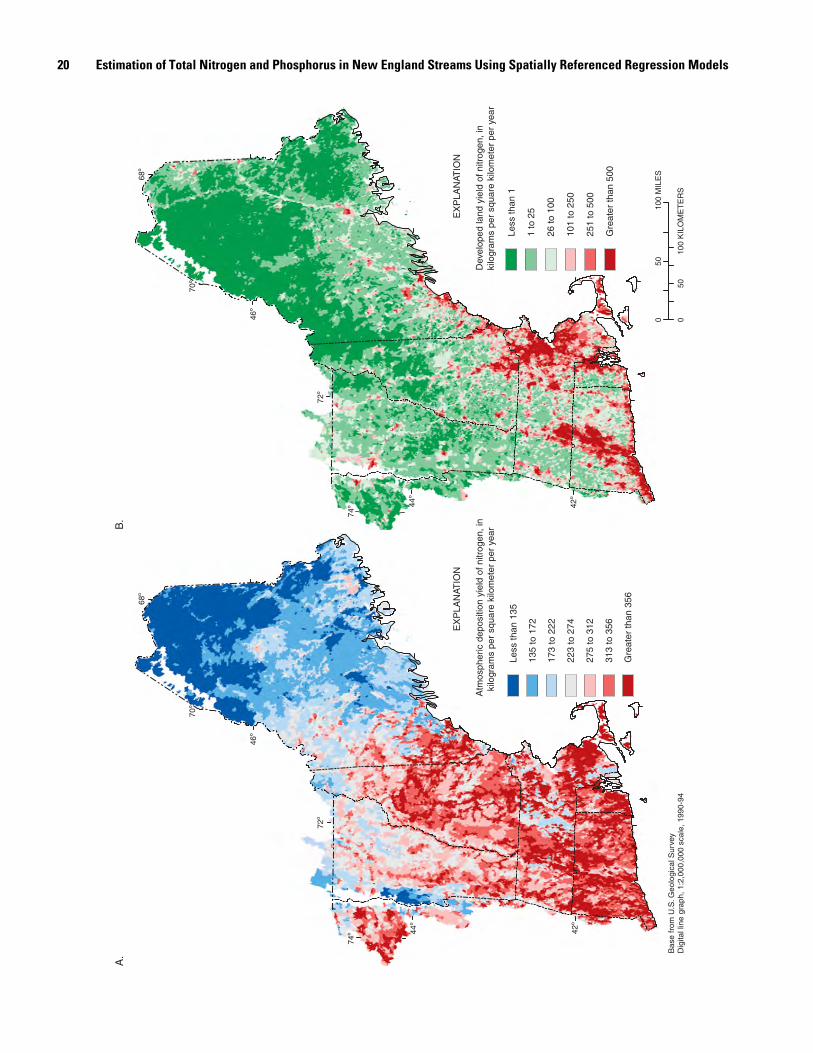
20 Estimation of Total Nitrogen and Phosphorus in New England Streams Using Spatially Referenced Regression Models
74º
72º
70º
68º
42º
44º
46º
010
0 M
ILE
S50
050
100
KIL
OM
ET
ER
SB
ase
from
U.S
. Geo
logi
cal S
urve
yD
igita
l lin
e gr
aph,
1:2
,000
,000
sca
le, 1
990-
94
EX
PLA
NAT
ION
Atm
osph
eric
dep
ositi
on y
ield
of n
itrog
en, i
n k
ilogr
ams
per
squa
re k
ilom
eter
per
yea
r
Le
ss th
an 1
35
13
5 to
172
17
3 to
222
22
3 to
274
27
5 to
312
31
3 to
356
G
reat
er th
an 3
56
74º
72º
70º
68º
42º
44º
46º
A.
B.
EX
PLA
NAT
ION
Dev
elop
ed la
nd y
ield
of n
itrog
en, i
n ki
logr
ams
per
squa
re k
ilom
eter
per
yea
r
Le
ss th
an 1
1
to 2
5
26
to 1
00
10
1 to
250
25
1 to
500
G
reat
er th
an 5
00

Model Estimates of Nutrient Loads 21
74º
72º
70º
68º
42º
44º
46º
Bas
e fr
om U
.S. G
eolo
gica
l Sur
vey
Dig
ital l
ine
grap
h, 1
:2,0
00,0
00 s
cale
, 199
0-94
EX
PLA
NAT
ION
Agr
icul
tura
l lan
d-us
e yi
eld
of n
itrog
en, i
n k
ilogr
ams
per
squa
re k
ilom
eter
per
yea
r
Le
ss th
an 1
1
to 2
9
30
to 7
2
73
to 1
97
19
8 to
335
G
reat
er th
an 3
35
74º
72º
70º
68º
42º
44º
46º
C.
D.
EX
PLA
NAT
ION
Prim
ary
sour
ces
of n
itrog
en
A
tmos
pher
ic
D
evel
oped
land
A
gric
ultu
ral l
and
P
oint
sou
rce
010
0 M
ILE
S50
050
100
KIL
OM
ET
ER
S
Figu
re 9
. Co
ntrib
utio
n pr
edic
ted
by th
e N
ew E
ngla
nd S
PARR
OW m
odel
of t
otal
nitr
ogen
cat
chm
ent y
ield
from
(A) a
tmos
pher
ic d
epos
ition
of n
itrog
en, (
B) d
evel
oped
land
are
as,
(C) a
gric
ultu
ral l
and-
use
area
s, a
nd (D
) prim
ary
sour
ces
of n
itrog
en lo
ads
in th
e m
odel
.
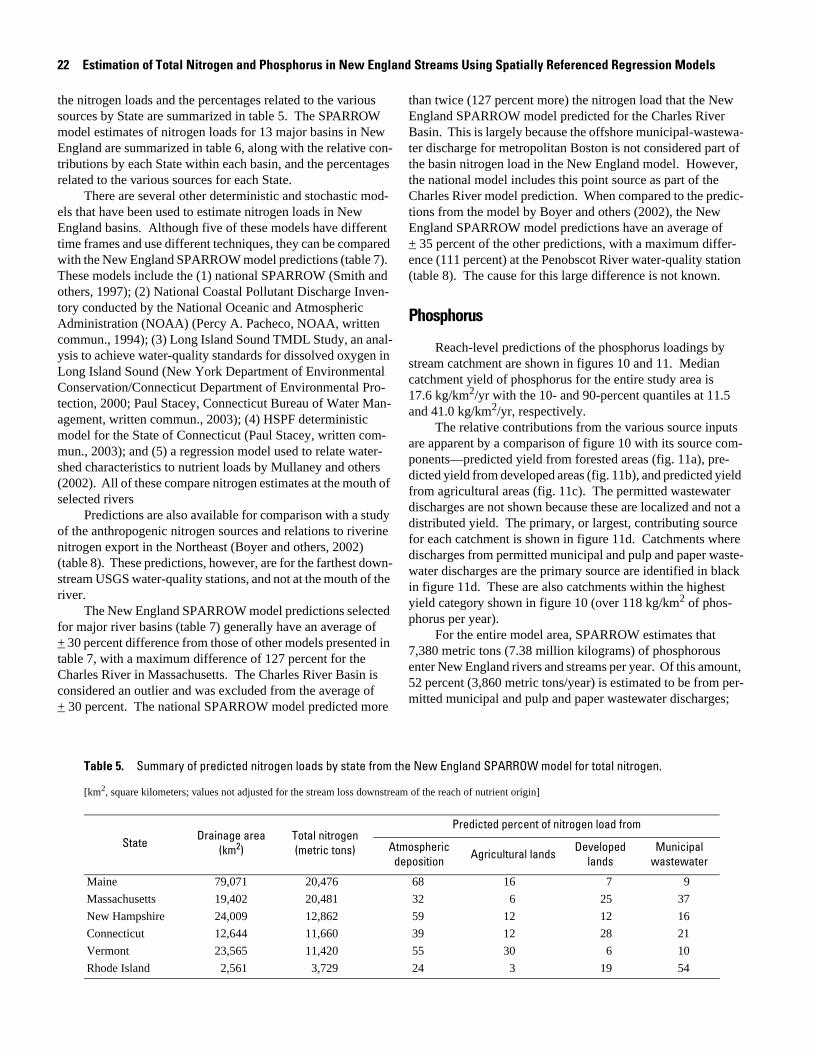
22 Estimation of Total Nitrogen and Phosphorus in New England Streams Using Spatially Referenced Regression Models
the nitrogen loads and the percentages related to the various sources by State are summarized in table 5. The SPARROW model estimates of nitrogen loads for 13 major basins in New England are summarized in table 6, along with the relative con-tributions by each State within each basin, and the percentages related to the various sources for each State.
There are several other deterministic and stochastic mod-els that have been used to estimate nitrogen loads in New England basins. Although five of these models have different time frames and use different techniques, they can be compared with the New England SPARROW model predictions (table 7). These models include the (1) national SPARROW (Smith and others, 1997); (2) National Coastal Pollutant Discharge Inven-tory conducted by the National Oceanic and Atmospheric Administration (NOAA) (Percy A. Pacheco, NOAA, written commun., 1994); (3) Long Island Sound TMDL Study, an anal-ysis to achieve water-quality standards for dissolved oxygen in Long Island Sound (New York Department of Environmental Conservation/Connecticut Department of Environmental Pro-tection, 2000; Paul Stacey, Connecticut Bureau of Water Man-agement, written commun., 2003); (4) HSPF deterministic model for the State of Connecticut (Paul Stacey, written com-mun., 2003); and (5) a regression model used to relate water-shed characteristics to nutrient loads by Mullaney and others (2002). All of these compare nitrogen estimates at the mouth of selected rivers
Predictions are also available for comparison with a study of the anthropogenic nitrogen sources and relations to riverine nitrogen export in the Northeast (Boyer and others, 2002) (table 8). These predictions, however, are for the farthest down-stream USGS water-quality stations, and not at the mouth of the river.
The New England SPARROW model predictions selected for major river basins (table 7) generally have an average of + 30 percent difference from those of other models presented in table 7, with a maximum difference of 127 percent for the Charles River in Massachusetts. The Charles River Basin is considered an outlier and was excluded from the average of + 30 percent. The national SPARROW model predicted more
than twice (127 percent more) the nitrogen load that the New England SPARROW model predicted for the Charles River Basin. This is largely because the offshore municipal-wastewa-ter discharge for metropolitan Boston is not considered part of the basin nitrogen load in the New England model. However, the national model includes this point source as part of the Charles River model prediction. When compared to the predic-tions from the model by Boyer and others (2002), the New England SPARROW model predictions have an average of + 35 percent of the other predictions, with a maximum differ-ence (111 percent) at the Penobscot River water-quality station (table 8). The cause for this large difference is not known.
Phosphorus
Reach-level predictions of the phosphorus loadings by stream catchment are shown in figures 10 and 11. Median catchment yield of phosphorus for the entire study area is 17.6 kg/km2/yr with the 10- and 90-percent quantiles at 11.5 and 41.0 kg/km2/yr, respectively.
The relative contributions from the various source inputs are apparent by a comparison of figure 10 with its source com-ponents—predicted yield from forested areas (fig. 11a), pre-dicted yield from developed areas (fig. 11b), and predicted yield from agricultural areas (fig. 11c). The permitted wastewater discharges are not shown because these are localized and not a distributed yield. The primary, or largest, contributing source for each catchment is shown in figure 11d. Catchments where discharges from permitted municipal and pulp and paper waste-water discharges are the primary source are identified in black in figure 11d. These are also catchments within the highest yield category shown in figure 10 (over 118 kg/km2 of phos-phorus per year).
For the entire model area, SPARROW estimates that 7,380 metric tons (7.38 million kilograms) of phosphorous enter New England rivers and streams per year. Of this amount, 52 percent (3,860 metric tons/year) is estimated to be from per-mitted municipal and pulp and paper wastewater discharges;
Table 5. Summary of predicted nitrogen loads by state from the New England SPARROW model for total nitrogen.
[km2, square kilometers; values not adjusted for the stream loss downstream of the reach of nutrient origin]
State Drainage area(km2)
Total nitrogen (metric tons)
Predicted percent of nitrogen load from
Atmospheric deposition Agricultural lands Developed
landsMunicipal
wastewater
Maine 79,071 20,476 68 16 7 9
Massachusetts 19,402 20,481 32 6 25 37
New Hampshire 24,009 12,862 59 12 12 16
Connecticut 12,644 11,660 39 12 28 21
Vermont 23,565 11,420 55 30 6 10
Rhode Island 2,561 3,729 24 3 19 54
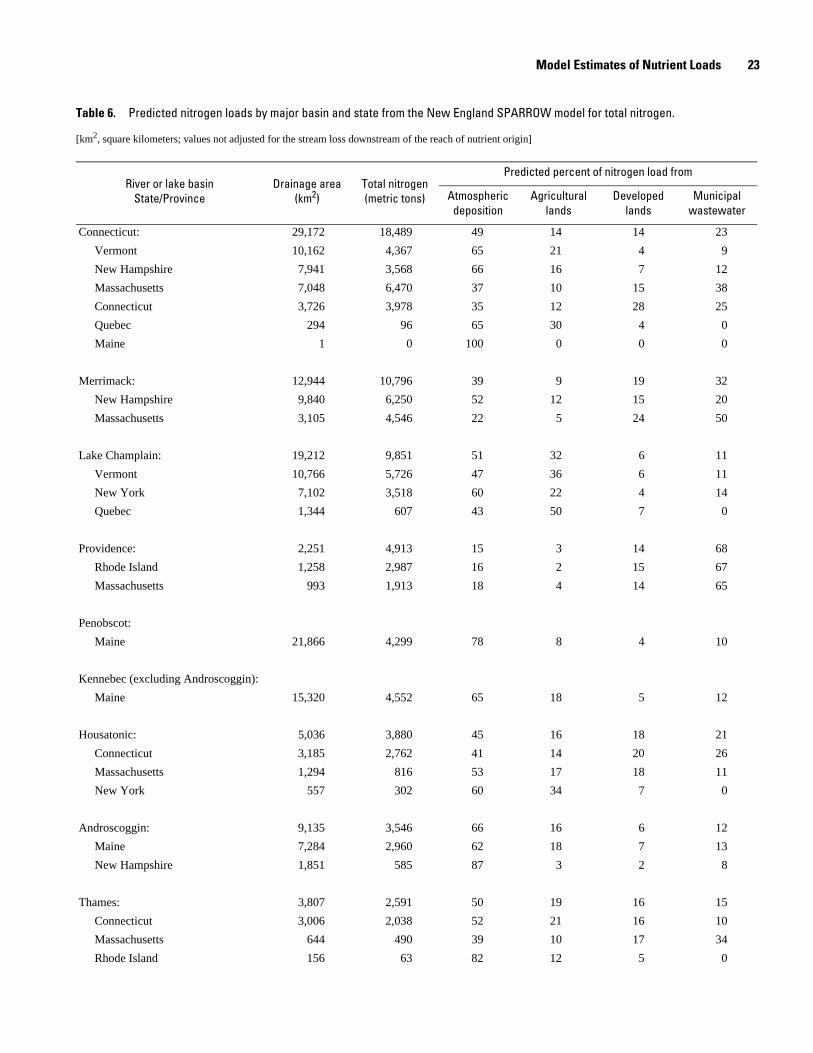
Model Estimates of Nutrient Loads 23
Table 6. Predicted nitrogen loads by major basin and state from the New England SPARROW model for total nitrogen.
[km2, square kilometers; values not adjusted for the stream loss downstream of the reach of nutrient origin]
River or lake basinState/Province
Drainage area (km2)
Total nitrogen (metric tons)
Predicted percent of nitrogen load from
Atmospheric deposition
Agricultural lands
Developed lands
Municipal wastewater
Connecticut: 29,172 18,489 49 14 14 23
Vermont 10,162 4,367 65 21 4 9
New Hampshire 7,941 3,568 66 16 7 12
Massachusetts 7,048 6,470 37 10 15 38
Connecticut 3,726 3,978 35 12 28 25
Quebec 294 96 65 30 4 0
Maine 1 0 100 0 0 0
Merrimack: 12,944 10,796 39 9 19 32
New Hampshire 9,840 6,250 52 12 15 20
Massachusetts 3,105 4,546 22 5 24 50
Lake Champlain: 19,212 9,851 51 32 6 11
Vermont 10,766 5,726 47 36 6 11
New York 7,102 3,518 60 22 4 14
Quebec 1,344 607 43 50 7 0
Providence: 2,251 4,913 15 3 14 68
Rhode Island 1,258 2,987 16 2 15 67
Massachusetts 993 1,913 18 4 14 65
Penobscot:
Maine 21,866 4,299 78 8 4 10
Kennebec (excluding Androscoggin):
Maine 15,320 4,552 65 18 5 12
Housatonic: 5,036 3,880 45 16 18 21
Connecticut 3,185 2,762 41 14 20 26
Massachusetts 1,294 816 53 17 18 11
New York 557 302 60 34 7 0
Androscoggin: 9,135 3,546 66 16 6 12
Maine 7,284 2,960 62 18 7 13
New Hampshire 1,851 585 87 3 2 8
Thames: 3,807 2,591 50 19 16 15
Connecticut 3,006 2,038 52 21 16 10
Massachusetts 644 490 39 10 17 34
Rhode Island 156 63 82 12 5 0

24 Estimation of Total Nitrogen and Phosphorus in New England Streams Using Spatially Referenced Regression Models
Saco: 4,397 1,981 73 13 6 8
Maine 2,148 1,088 63 18 9 11
New Hampshire 2,249 892 85 7 3 5
Piscataqua (Portsmouth Harbor): 2,608 1,802 46 13 20 21
New Hampshire 1,977 1,414 44 12 21 22
Maine 630 388 52 15 16 16
Taunton:
Massachusetts 1,392 1,646 31 4 30 36
Charles:
Massachusetts 767 844 31 5 44 21
Table 6. Predicted nitrogen loads by major basin and state from the New England SPARROW model for total nitrogen.—Continued
[km2, square kilometers; values not adjusted for the stream loss downstream of the reach of nutrient origin]
River or lake basinState/Province
Drainage area (km2)
Total nitrogen (metric tons)
Predicted percent of nitrogen load from
Atmospheric deposition
Agricultural lands
Developed lands
Municipal wastewater
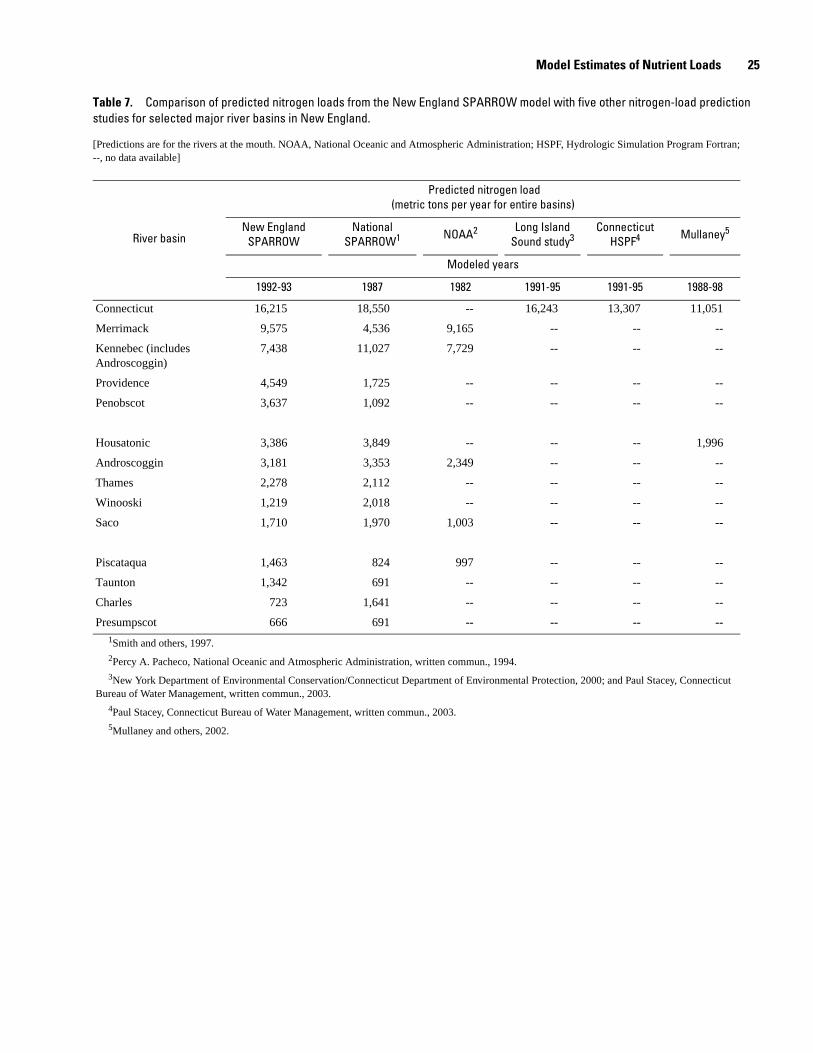
Model Estimates of Nutrient Loads 25
Table 7. Comparison of predicted nitrogen loads from the New England SPARROW model with five other nitrogen-load prediction studies for selected major river basins in New England.
[Predictions are for the rivers at the mouth. NOAA, National Oceanic and Atmospheric Administration; HSPF, Hydrologic Simulation Program Fortran; --, no data available]
River basin
Predicted nitrogen load (metric tons per year for entire basins)
New England SPARROW
National SPARROW1 NOAA2 Long Island
Sound study3Connecticut
HSPF4 Mullaney5
Modeled years
1992-93 1987 1982 1991-95 1991-95 1988-98
Connecticut 16,215 18,550 -- 16,243 13,307 11,051
Merrimack 9,575 4,536 9,165 -- -- --
Kennebec (includes Androscoggin)
7,438 11,027 7,729 -- -- --
Providence 4,549 1,725 -- -- -- --
Penobscot 3,637 1,092 -- -- -- --
Housatonic 3,386 3,849 -- -- -- 1,996
Androscoggin 3,181 3,353 2,349 -- -- --
Thames 2,278 2,112 -- -- -- --
Winooski 1,219 2,018 -- -- -- --
Saco 1,710 1,970 1,003 -- -- --
Piscataqua 1,463 824 997 -- -- --
Taunton 1,342 691 -- -- -- --
Charles 723 1,641 -- -- -- --
Presumpscot 666 691 -- -- -- --1Smith and others, 1997.2Percy A. Pacheco, National Oceanic and Atmospheric Administration, written commun., 1994.3New York Department of Environmental Conservation/Connecticut Department of Environmental Protection, 2000; and Paul Stacey, Connecticut
Bureau of Water Management, written commun., 2003.4Paul Stacey, Connecticut Bureau of Water Management, written commun., 2003.5Mullaney and others, 2002.
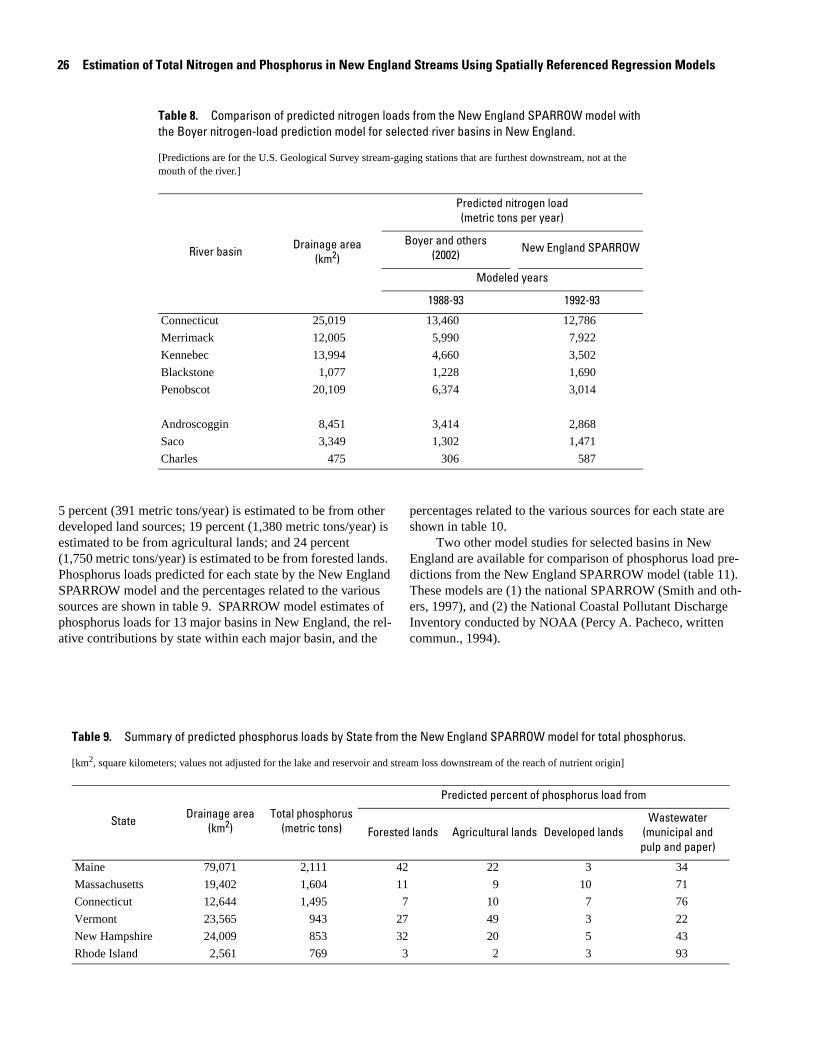
26 Estimation of Total Nitrogen and Phosphorus in New England Streams Using Spatially Referenced Regression Models
Table 8. Comparison of predicted nitrogen loads from the New England SPARROW model with the Boyer nitrogen-load prediction model for selected river basins in New England.
[Predictions are for the U.S. Geological Survey stream-gaging stations that are furthest downstream, not at the mouth of the river.]
River basin Drainage area (km2)
Predicted nitrogen load (metric tons per year)
Boyer and others (2002) New England SPARROW
Modeled years
1988-93 1992-93
Connecticut 25,019 13,460 12,786
Merrimack 12,005 5,990 7,922
Kennebec 13,994 4,660 3,502
Blackstone 1,077 1,228 1,690
Penobscot 20,109 6,374 3,014
Androscoggin 8,451 3,414 2,868
Saco 3,349 1,302 1,471
Charles 475 306 587
Table 9. Summary of predicted phosphorus loads by State from the New England SPARROW model for total phosphorus.
[km2, square kilometers; values not adjusted for the lake and reservoir and stream loss downstream of the reach of nutrient origin]
State Drainage area (km2)
Total phosphorus (metric tons)
Predicted percent of phosphorus load from
Forested lands Agricultural lands Developed landsWastewater
(municipal andpulp and paper)
Maine 79,071 2,111 42 22 3 34
Massachusetts 19,402 1,604 11 9 10 71
Connecticut 12,644 1,495 7 10 7 76
Vermont 23,565 943 27 49 3 22
New Hampshire 24,009 853 32 20 5 43
Rhode Island 2,561 769 3 2 3 93
5 percent (391 metric tons/year) is estimated to be from other developed land sources; 19 percent (1,380 metric tons/year) is estimated to be from agricultural lands; and 24 percent (1,750 metric tons/year) is estimated to be from forested lands. Phosphorus loads predicted for each state by the New England SPARROW model and the percentages related to the various sources are shown in table 9. SPARROW model estimates of phosphorus loads for 13 major basins in New England, the rel-ative contributions by state within each major basin, and the
percentages related to the various sources for each state are shown in table 10.
Two other model studies for selected basins in New England are available for comparison of phosphorus load pre-dictions from the New England SPARROW model (table 11). These models are (1) the national SPARROW (Smith and oth-ers, 1997), and (2) the National Coastal Pollutant Discharge Inventory conducted by NOAA (Percy A. Pacheco, written commun., 1994).
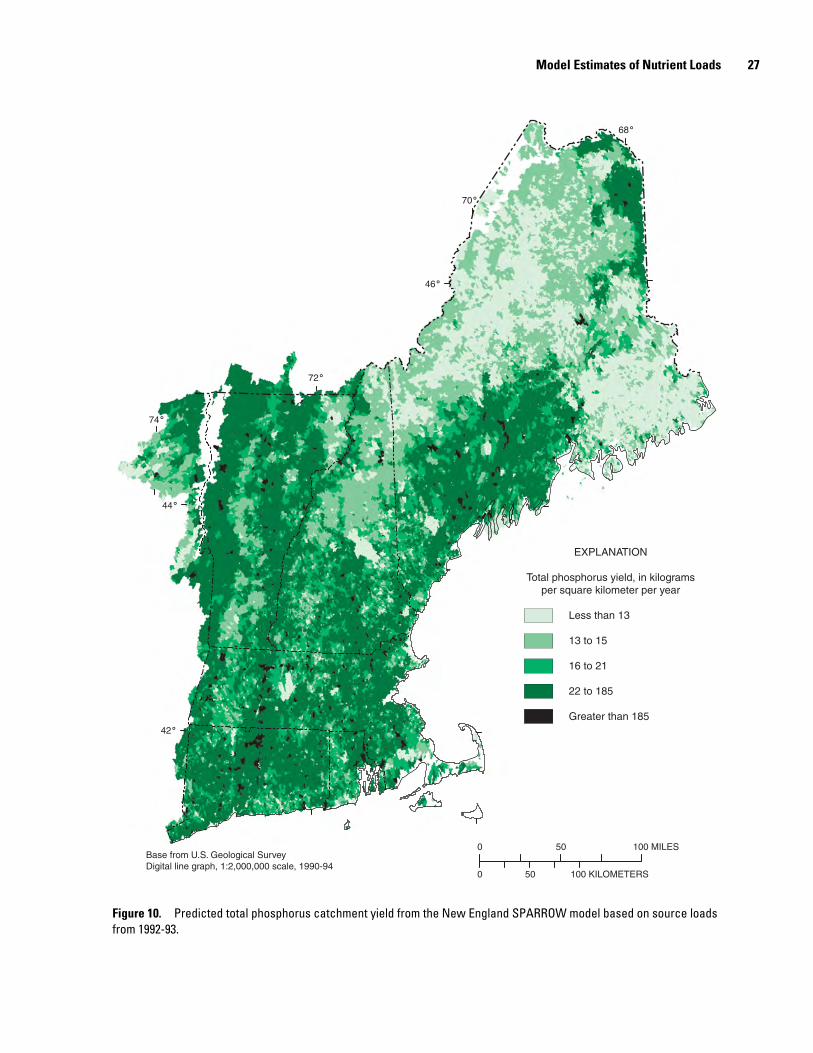
Model Estimates of Nutrient Loads 27
74˚
72˚
70˚
68˚
42˚
44˚
46˚
0 100 MILES50
0 50 100 KILOMETERS
EXPLANATION
Total phosphorus yield, in kilograms per square kilometer per year
Less than 13
13 to 15
16 to 21
22 to 185
Greater than 185
Base from U.S. Geological SurveyDigital line graph, 1:2,000,000 scale, 1990-94
Figure 10. Predicted total phosphorus catchment yield from the New England SPARROW model based on source loads from 1992-93.
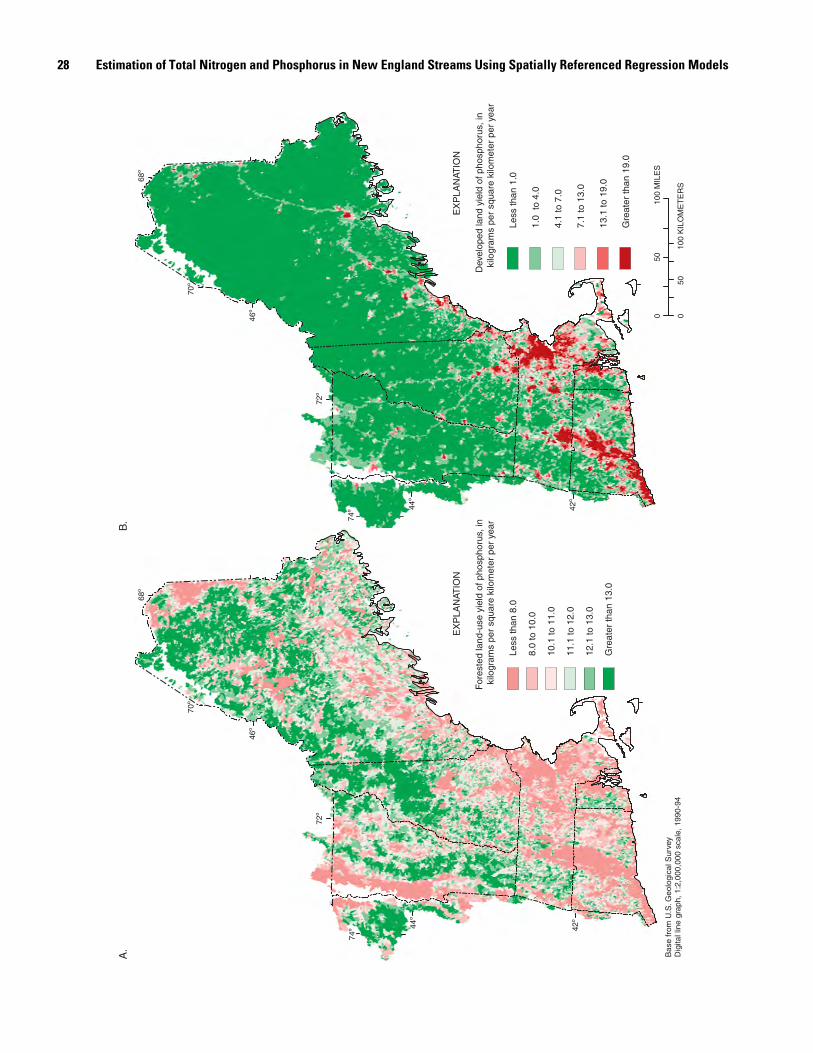
28 Estimation of Total Nitrogen and Phosphorus in New England Streams Using Spatially Referenced Regression Models
74º
72º
70º
68º
42º
44º
46º
Bas
e fr
om U
.S. G
eolo
gica
l Sur
vey
Dig
ital l
ine
grap
h, 1
:2,0
00,0
00 s
cale
, 199
0-94
EX
PLA
NAT
ION
For
este
d la
nd-u
se y
ield
of p
hosp
horu
s, in
kilo
gram
s pe
r sq
uare
kilo
met
er p
er y
ear
Le
ss th
an 8
.0
8.
0 to
10.
0
10
.1 to
11.
0
11
.1 to
12.
0
12
.1 to
13.
0
G
reat
er th
an 1
3.0
74º
72º
70º
68º
42º
44º
46º
A.
B.
EX
PLA
NAT
ION
Dev
elop
ed la
nd y
ield
of p
hosp
horu
s, in
kilo
gram
s pe
r sq
uare
kilo
met
er p
er y
ear
Le
ss th
an 1
.0
1.
0 to
4.0
4.
1 to
7.0
7.
1 to
13.
0
13
.1 to
19.
0
G
reat
er th
an 1
9.0
010
0 M
ILE
S50
050
100
KIL
OM
ET
ER
S

Model Estimates of Nutrient Loads 29
EX
PLA
NAT
ION
Agr
icul
tura
l lan
d-us
e yi
eld
of p
hosp
horu
s, i
n ki
logr
ams
per
squa
re k
ilom
eter
per
yea
r
Le
ss th
an 5
.0
5.
1 to
13.
0
13
.1 to
24.
0
24
.1 to
40.
0
40
.1 to
63.
0
G
reat
er th
an 6
3.0
74º
72º
70º
68º
42º
44º
46º
Bas
e fr
om U
.S. G
eolo
gica
l Sur
vey
Dig
ital l
ine
grap
h, 1
:2,0
00,0
00 s
cale
, 199
0-94
74º
72º
70º
68º
42º
44º
46º
C.
D.
EX
PLA
NAT
ION
Prim
ary
sour
ces
of p
hosp
horu
s
F
ores
t
A
gric
ultu
ral l
and
D
evel
oped
land
P
oint
sou
rce
010
0 M
ILE
S50
050
100
KIL
OM
ET
ER
S
Figu
re 1
1.
Cont
ribut
ion
pred
icte
d by
the
New
Eng
land
SPA
RROW
mod
el o
f tot
al p
hosp
horo
us c
atch
men
t yie
ld fr
om (A
) for
este
d la
nd-u
se a
reas
, (B)
dev
elop
ed la
nd a
reas
, (C
) agr
icul
tura
l lan
d-us
e ar
eas,
and
(D) p
rimar
y so
urce
s of
pho
spho
rus
load
s in
the
mod
el.

30 Estimation of Total Nitrogen and Phosphorus in New England Streams Using Spatially Referenced Regression Models
Table 10. Predicted phosphorus loads by major basin and state from the New England SPARROW model for total phosphorus.
[km2, square kilometers; values not adjusted for the reservoir and stream loss downstream of the reach of nutrient origin]
River or lake basinState/Province
Drainage area(km2)
Total phosphorus (metric tons)
Predicted percent of phosphorus load from
Forested lands Agricultural lands
Developed lands
Wastewater (municipal andpulp and paper)
Connecticut: 29,172 1,790 18 17 4 61
Connecticut 3,726 662 4 7 5 83
Massachusetts 7,048 572 12 12 5 70
Vermont 10,162 310 39 38 2 21
New Hampshire 7,941 238 39 27 3 31
Quebec 295 8 44 53 2 0
Maine 1 0 99 1 0 0
Lake Champlain: 19,212 872 22 51 2 24
Vermont 10,766 535 19 56 3 22
New York 7,102 275 29 36 2 33
Quebec 1,344 62 19 78 3 0
Providence: 2,251 957 2 1 2 94
Rhode Island 1,258 700 2 1 2 95
Massachusetts 993 257 3 3 4 90
Merrimack: 12,944 840 16 12 7 65
Massachusetts 3105 424 6 6 8 81
New Hampshire 9,840 417 26 19 7 49
Penobscot:
Maine 21,866 617 41 9 1 49
Kennebec (excluding Androscoggin):
Maine 15,320 428 39 28 2 30
Housatonic: 5,036 407 12 19 6 64
Connecticut 3,185 323 9 14 6 71
Massachusetts 1,294 64 20 26 8 46
New York 557 20 29 67 4 0
Androscoggin: 9,135 394 27 15 2 56
Maine 7,284 341 24 17 2 57
New Hampshire 1,851 53 45 3 1 51
Thames: 3,807 240 15 22 6 57
Connecticut 3,006 203 14 22 5 59
Massachusetts 644 32 18 19 9 53
Rhode Island 156 3 64 32 4 0
Piscataqua (Portsmouth Harbor): 2,611 117 22 19 9 49
New Hampshire 1,977 92 21 18 9 51
Maine 630 25 27 23 8 43
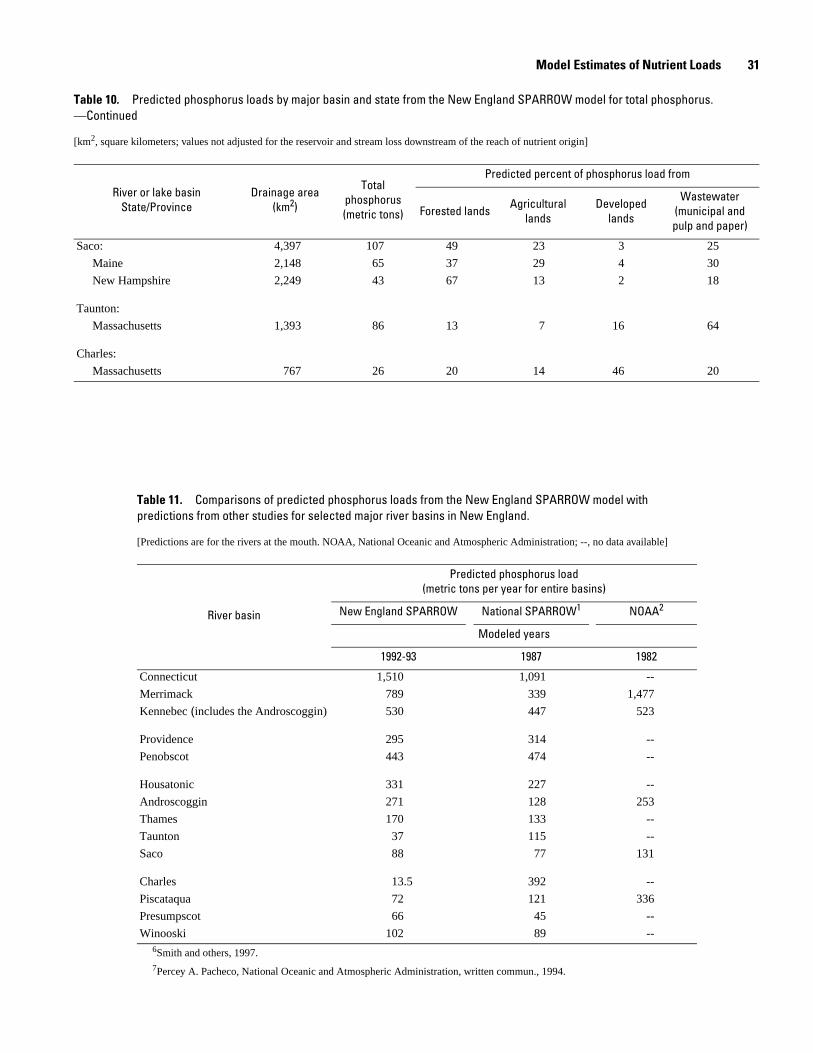
Model Estimates of Nutrient Loads 31
Table 11. Comparisons of predicted phosphorus loads from the New England SPARROW model with predictions from other studies for selected major river basins in New England.
[Predictions are for the rivers at the mouth. NOAA, National Oceanic and Atmospheric Administration; --, no data available]
River basin
Predicted phosphorus load(metric tons per year for entire basins)
New England SPARROW National SPARROW1 NOAA2
Modeled years
1992-93 1987 1982
Connecticut 1,510 1,091 --
Merrimack 789 339 1,477
Kennebec (includes the Androscoggin) 530 447 523
Providence 295 314 --
Penobscot 443 474 --
Housatonic 331 227 --
Androscoggin 271 128 253
Thames 170 133 --
Taunton 37 115 --
Saco 88 77 131
Charles 13.5 392 --
Piscataqua 72 121 336
Presumpscot 66 45 --
Winooski 102 89 --6Smith and others, 1997.7Percey A. Pacheco, National Oceanic and Atmospheric Administration, written commun., 1994.
Saco: 4,397 107 49 23 3 25
Maine 2,148 65 37 29 4 30
New Hampshire 2,249 43 67 13 2 18
Taunton:
Massachusetts 1,393 86 13 7 16 64
Charles:
Massachusetts 767 26 20 14 46 20
Table 10. Predicted phosphorus loads by major basin and state from the New England SPARROW model for total phosphorus. —Continued
[km2, square kilometers; values not adjusted for the reservoir and stream loss downstream of the reach of nutrient origin]
River or lake basinState/Province
Drainage area(km2)
Total phosphorus (metric tons)
Predicted percent of phosphorus load from
Forested lands Agricultural lands
Developed lands
Wastewater (municipal andpulp and paper)
32 Estimation of Total Nitrogen and Phosphorus in New England Streams Using Spatially Referenced Regression Models
The New England SPARROW phosphorus model predic-tions have an average of + 43 percent difference from that of the national SPARROW model predictions, with a maximum dif-ference of 211 percent for the Taunton River Basin, and have an average of + 88 percent difference from the NOAA predictions, with a maximum difference of 367 percent for the Piscataqua River Basin (table 11). As with nitrogen, comparisons for the Charles River Basin are not valid because the offshore munici-pal-wastewater discharge for metropolitan Boston is excluded from the basin in the New England SPARROW model but included in the national SPARROW model prediction. Phos-phorus loads estimated by NOAA are higher in three of the five basins compared. These higher estimates may be due to higher phosphorus concentrations in New England streams in the 1970s and 1980s (Robinson and others, 2003).
Use of SPARROW Model Results in Water-Resources Management
The SPARROW models can be used by water-resources managers as tools in water-quality assessment and management activities such as TMDL studies, nutrient-criteria development, and determination of nutrient loadings to coastal waters. Exam-ples of how SPARROW model results can be used for these specific water-quality activities are provided.
Determining Sources and Transport of Nutrient Loads
SPARROW model results can increase understanding of nutrient transport, load distributions, and relative effects of var-ious nutrient sources in large river basins that are difficult and costly to model with deterministic models. This ability to esti-mate contaminant loads relative to watershed characteristics, complete with statistical estimates of the error, can be an impor-tant tool for TMDL studies.
Nitrogen-model results for the Connecticut River Basin serve as an example of how SPARROW results are useful for TMDL studies. The SPARROW model provides an estimation of the nitrogen loading delivered from any selected stream reach to the mouth of the river. For the Connecticut River Basin, this information can be used in estimating the total nitro-gen contributions to Long Island Sound from any location in the entire basin. SPARROW results from just two reaches, the mouth of the Connecticut River where it enters Long Island Sound, and the reach where the Connecticut River leaves New Hampshire and Vermont, indicate that 41 percent of the nitro-gen load entering Long Island Sound originated upstream of the point where the Connecticut River leaves New Hampshire and Vermont (fig. 12). SPARROW results also indicate that, of the nitrogen load in the Connecticut River leaving New Hampshire and Vermont, 11 percent is from municipal wastewater-treat-ment facilities; 6 percent is from developed land; 20 percent is from agricultural lands; and the remaining 63 percent is from
atmospheric deposition. The model shows no statistically sig-nificant loss of nitrogen load, on an annual basis, as the load is transported down the Connecticut River from New Hampshire and Vermont to Long Island Sound. Nitrogen loss is only observed in small streams.
Determining Nutrient Concentrations
Currently (2004), the USEPA (1998a, 2000a) is develop-ing nutrient (nitrogen and phosphorus) concentration criteria for rivers, lakes, and estuaries. The USEPA is identifying which streams, rivers, and other waterbodies have nutrient levels caus-ing water-quality impairment, determining what concentrations cause impairment, and then relating these levels to management actions to improve water-quality conditions. SPARROW model results can provide information on the estimated nutrient concentrations throughout the New England region. A mean-annual, flow-weighted concentration (in milligrams per liter) is derived from the mean-annual loads predicted by the SPAR-ROW model (converted to milligrams per year) divided by the mean-annual flows (estimated as a SPARROW input dataset and converted to liters per year). The SPARROW-predicted mean-annual flow-weighted concentrations (in milligrams per liter) for nitrogen are shown in figure 13a and for phosphorus in figure 13b. Although these concentrations do not represent the variability of nutrient concentrations throughout the year, these predictions can be used as a guide for water-resource managers to set priorities. McMahon and others (2003) demonstrated for watersheds in North Carolina how SPARROW-predicted con-centrations can be used in conjunction with the associated errors of the predictions to determine probability of exceeding (on an annual basis) threshold concentrations of interest for water management.
The USEPA is developing nutrient criteria specific to ecoregions or areas suspected of having similar natural or refer-ence nitrogen and phosphorus levels based on geology, vegeta-tion, and land uses (U.S. Environmental Protection Agency, 1999). Reference levels are defined as nutrient concentrations in stream reaches having little or no nutrient contributions from urban or agricultural sources. The five ecoregions in the model area are shown in figure 14a along with the cumulative distribu-tion of the SPARROW-predicted mean-annual flow-weighted concentrations by ecoregion for nitrogen (fig. 14b) and for phosphorus (fig. 14c). The Laurentian Plains and the Northeast Highlands have low median concentrations of nitrogen (0.26 and 0.48 mg/L, respectively) compared to the Eastern Great Lakes and Hudson Lowlands ecoregion surrounding Lake Champlain (0.88 mg/L). The median concentration of 1.32 mg/L for the Atlantic Coastal Pine Barrens (fig. 14b) is especially high because of the effective delivery of the nutrients to the streams associated with the high soil permeability. For the Laurentian Plains, the low nitrogen concentrations are the result of less atmospheric deposition of nitrogen. In the Eastern Great Lakes and Hudson Lowlands ecoregion, average concen-trations of phosphorus (fig. 14c) are higher than in the other

Use of SPARROW Model Results in Water-Resources Management 33
41 percent59 percent
EXPLANATION
Predicted total nitrogen loads to Long Island Sound
New Hampshire- Vermont
Massachusetts- Connecticut
EXPLANATION
Primary sources of nitrogen in the Connecticut River as it leaves New Hampshire and Vermont
Atmospheric
Developed land
Agricultural land Point source
20 percent
Connect
icut R
iver
Atlantic Ocean
Long Island Sound
63 percent
11 percent
6 percent
72˚
42˚
44˚
0 100 MILES50
0 50 100 KILOMETERS
EXPLANATION
Connecticut River Basin
Base from U.S. Geological SurveyDigital line graph, 1:2,000,000 scale, 1990-94National Hydrography Dataset, 1:100,000 scale, 2002
MaineVermont
New Hampshire
Massachusestts
Connecticut
New York
RhodeIsland
Canada
Figure 12. Example from the Connecticut River Basin of total maximum daily load applications of the results from the New England SPARROW model for total nitrogen.
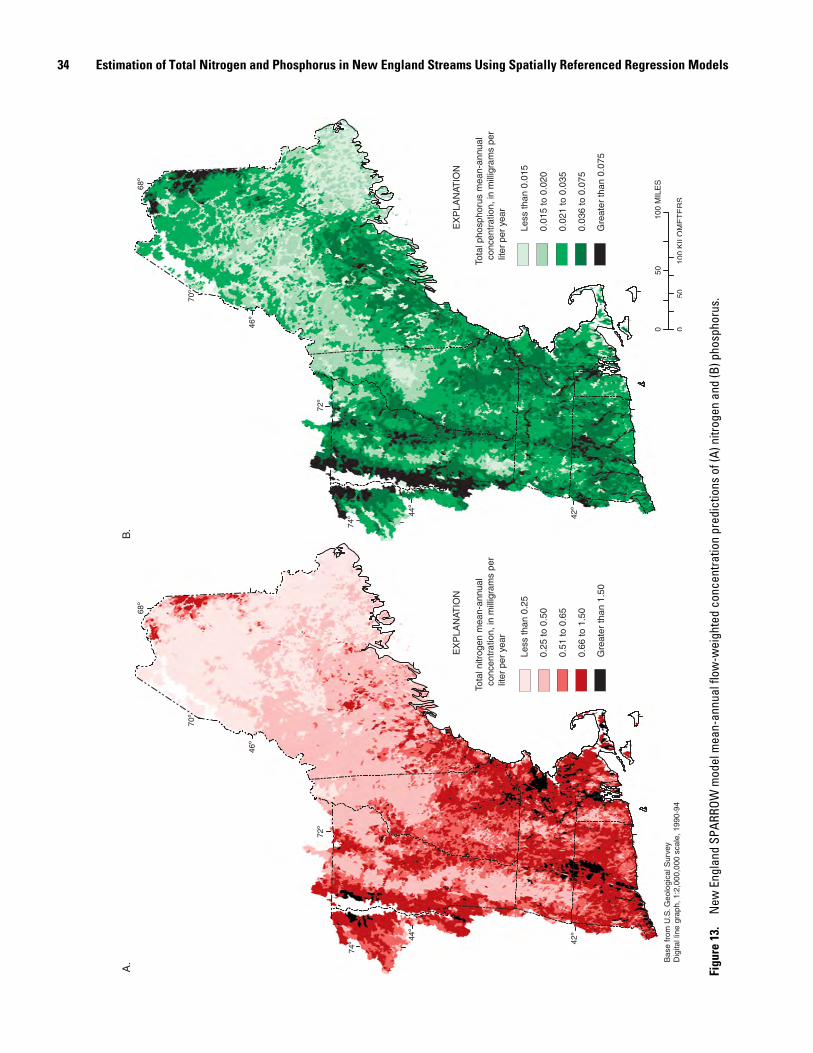
34 Estimation of Total Nitrogen and Phosphorus in New England Streams Using Spatially Referenced Regression Models
74º
72º
70º
68º
42º
44º
46º
Bas
e fr
om U
.S. G
eolo
gica
l Sur
vey
Dig
ital l
ine
grap
h, 1
:2,0
00,0
00 s
cale
, 199
0-94
EX
PLA
NAT
ION
Tota
l nitr
ogen
mea
n-an
nual
c
once
ntra
tion,
in m
illig
ram
s pe
r l
iter
per
year
Le
ss th
an 0
.25
0.
25 to
0.5
0
0.
51 to
0.6
5
0.
66 to
1.5
0
G
reat
er th
an 1
.50
74º
72º
70º
68º
42º
44º
46º
A.
B.
EX
PLA
NAT
ION
Tota
l pho
spho
rus
mea
n-an
nual
c
once
ntra
tion,
in m
illig
ram
s pe
r l
iter
per
year
Le
ss th
an 0
.015
0.
015
to 0
.020
0.
021
to 0
.035
0.
036
to 0
.075
G
reat
er th
an 0
.075
010
0 M
ILE
S50
050
100
KIL
OM
ET
ER
S
Figu
re 1
3.
New
Eng
land
SPA
RROW
mod
el m
ean-
annu
al fl
ow-w
eigh
ted
conc
entra
tion
pred
ictio
ns o
f (A)
nitr
ogen
and
(B) p
hosp
horu
s.

Use of SPARROW Model Results in Water-Resources Management 35
74˚
72˚
70˚
68˚
42˚
44˚
46˚
0 100 MILES50
0 50 100 KILOMETERS
EXPLANATION
Ecoregion
Northeast Highlands
Northeast Coastal Zone
Laurentian Plains
Hudson Lowlands and Eastern Great Lakes
Atlantic Coastal Pine Barrens
Base from U.S. Geological SurveyDigital line graph, 1:2,000,000 scale, 1990-94
0 0.2 0.4 0.6
1.00
0.75
0.50
0.25
0CU
MU
LAT
IVE
FR
EQ
UE
NC
Y
PHOSPHORUS CONCENTRATION BY ECOREGION,IN MILLIGRAMS PER LITER
C.
0 1 2 3
1.00
0.75
0.50
0.25
0CU
MU
LAT
IVE
FR
EQ
UE
NC
Y
NITROGEN CONCENTRATION BY ECOREGION,IN MILLIGRAMS PER LITER
B.
NITROGEN MEAN ANNUAL CONCENTRATION BY ECOREGION, IN MILLIGRAMS PER LITER
Quantile, Ecoregion in percent 90 0.49 0.79 1.74 1.48 2.46 75 0.36 0.63 1.15 1.17 1.86 50 (median) 0.26 0.48 0.80 0.88 1.32 25 0.20 0.32 0.61 0.68 0.94 10 0.16 0.22 0.51 0.56 0.78
PHOSPHORUS MEAN ANNUAL CONCENTRATION BY ECOREGION, IN MILLIGRAMS PER LITER
Quantile, Ecoregion in percent 90 0.049 0.044 0.051 0.065 0.205 75 0.033 0.034 0.035 0.048 0.133 50 (median) 0.023 0.025 0.025 0.036 0.089 25 0.017 0.020 0.020 0.028 0.051 10 0.013 0.018 0.017 0.023 0.036
A.
Figure 14. Ecoregions (A) identified by U.S. Environmental Protection Agency for nutrient-criteria management activities. Cumulative frequency diagrams and tables for SPARROW-predicted total mean-annual flow-weighted (B) nitrogen and (C) phosphorus concentrations by ecoregion.
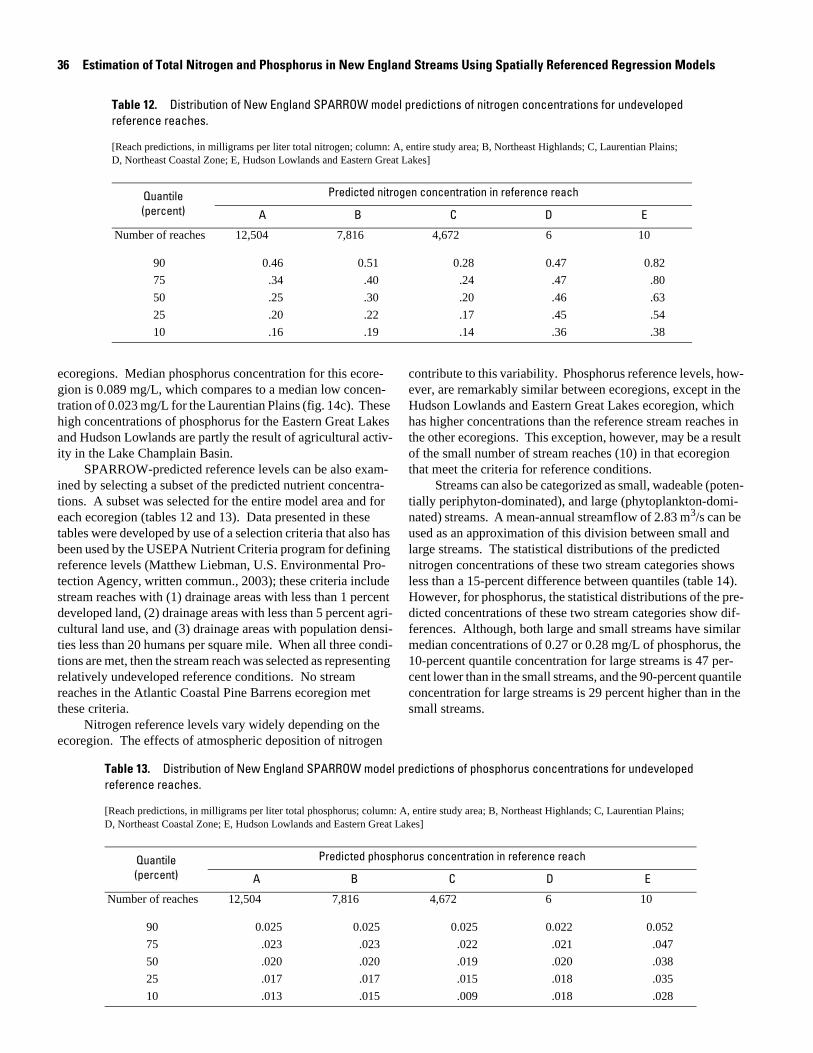
36 Estimation of Total Nitrogen and Phosphorus in New England Streams Using Spatially Referenced Regression Models
ecoregions. Median phosphorus concentration for this ecore-gion is 0.089 mg/L, which compares to a median low concen-tration of 0.023 mg/L for the Laurentian Plains (fig. 14c). These high concentrations of phosphorus for the Eastern Great Lakes and Hudson Lowlands are partly the result of agricultural activ-ity in the Lake Champlain Basin.
SPARROW-predicted reference levels can be also exam-ined by selecting a subset of the predicted nutrient concentra-tions. A subset was selected for the entire model area and for each ecoregion (tables 12 and 13). Data presented in these tables were developed by use of a selection criteria that also has been used by the USEPA Nutrient Criteria program for defining reference levels (Matthew Liebman, U.S. Environmental Pro-tection Agency, written commun., 2003); these criteria include stream reaches with (1) drainage areas with less than 1 percent developed land, (2) drainage areas with less than 5 percent agri-cultural land use, and (3) drainage areas with population densi-ties less than 20 humans per square mile. When all three condi-tions are met, then the stream reach was selected as representing relatively undeveloped reference conditions. No stream reaches in the Atlantic Coastal Pine Barrens ecoregion met these criteria.
Nitrogen reference levels vary widely depending on the ecoregion. The effects of atmospheric deposition of nitrogen
contribute to this variability. Phosphorus reference levels, how-ever, are remarkably similar between ecoregions, except in the Hudson Lowlands and Eastern Great Lakes ecoregion, which has higher concentrations than the reference stream reaches in the other ecoregions. This exception, however, may be a result of the small number of stream reaches (10) in that ecoregion that meet the criteria for reference conditions.
Streams can also be categorized as small, wadeable (poten-tially periphyton-dominated), and large (phytoplankton-domi-nated) streams. A mean-annual streamflow of 2.83 m3/s can be used as an approximation of this division between small and large streams. The statistical distributions of the predicted nitrogen concentrations of these two stream categories shows less than a 15-percent difference between quantiles (table 14). However, for phosphorus, the statistical distributions of the pre-dicted concentrations of these two stream categories show dif-ferences. Although, both large and small streams have similar median concentrations of 0.27 or 0.28 mg/L of phosphorus, the 10-percent quantile concentration for large streams is 47 per-cent lower than in the small streams, and the 90-percent quantile concentration for large streams is 29 percent higher than in the small streams.
Table 13. Distribution of New England SPARROW model predictions of phosphorus concentrations for undeveloped reference reaches.
[Reach predictions, in milligrams per liter total phosphorus; column: A, entire study area; B, Northeast Highlands; C, Laurentian Plains; D, Northeast Coastal Zone; E, Hudson Lowlands and Eastern Great Lakes]
Quantile (percent)
Predicted phosphorus concentration in reference reach
A B C D E
Number of reaches 12,504 7,816 4,672 6 10
90 0.025 0.025 0.025 0.022 0.052
75 .023 .023 .022 .021 .047
50 .020 .020 .019 .020 .038
25 .017 .017 .015 .018 .035
10 .013 .015 .009 .018 .028
Table 12. Distribution of New England SPARROW model predictions of nitrogen concentrations for undeveloped reference reaches.
[Reach predictions, in milligrams per liter total nitrogen; column: A, entire study area; B, Northeast Highlands; C, Laurentian Plains; D, Northeast Coastal Zone; E, Hudson Lowlands and Eastern Great Lakes]
Quantile (percent)
Predicted nitrogen concentration in reference reach
A B C D E
Number of reaches 12,504 7,816 4,672 6 10
90 0.46 0.51 0.28 0.47 0.82
75 .34 .40 .24 .47 .80
50 .25 .30 .20 .46 .63
25 .20 .22 .17 .45 .54
10 .16 .19 .14 .36 .38

Summary 37
Determining Nutrient Loads Delivered to Coastal Waters
The transport of nitrogen from freshwaters to coastal waters has resulted in environmental concerns, such as eutroph-ication and depletion of oxygen, in coastal ecosystems (New York Department of Environmental Conservation/Connecticut Department of Environmental Protection, 2000). Because of the significance and complexity of the nutrient-enrichment problems within coastal waters, an active area of scientific research has emerged and nationwide strategies to assess water-quality conditions and management options are under consider-ation (National Research Council, 2000). The New England SPARROW model provides estimates of mean-annual nutrient loadings to coastal waters (fig. 15). This information can help identify the relative contributions of different river basins to nutrient loads to the coast and where potential eutrophication may occur. Estimated nitrogen loads to the coast are greatest from the Connecticut, Merrimack, and Kennebec Rivers, which is partly related to their large drainage size. Large annual nitro-gen loads from the Connecticut, Providence, and the Housa-tonic Rivers make Long Island Sound especially vulnerable to nitrogen enrichment and eutrophication (New York Department of Environmental Conservation/Connecticut Department of Environmental Protection, 2000).
Summary
Excessive nutrient (nitrogen and phosphorus) concentra-tions in water can potentially affect human health and the health of aquatic ecosystems. Although nitrogen and phosphorus are essential for healthy plant and animal life, elevated concentra-tions of these nutrients can degrade water quality or cause human health problems. Managing and reducing nutrient loads to rivers has been a major activity under the Clean Water Act since the 1970s. Currently (2004), the U.S. Environmental Protection Agency (USEPA) has two major programs to help
address nutrient management. One program is the Nutrient Criteria Program, which is designed to develop nutrient- concentration criteria for rivers, lakes, and estuaries. The other program is the Total Maximum Daily Load (TMDL) program, which attempts to understand and manage nutrient loads that result in designated-use impairment. To provide analysis that can help water-resources managers with these efforts, the U.S. Geological Survey, in cooperation with the USEPA and the New England Interstate Water Pollution Control Commission, has developed water-quality models called the New England SPARROW (Spatially Referenced Regressions on Watershed Attributes) models.
SPARROW is a spatially detailed, statistical model that uses regression equations to relate total nitrogen and phospho-rus (nutrient) stream loads to nutrient sources and watershed characteristics. These statistical relations are then used to pre-dict nutrient loads in unmonitored streams. The study area for the New England SPARROW models for total nitrogen and total phosphorus includes river basins that drain to Long Island Sound, the Gulf of Maine, Lake Champlain, and the New England parts of the Hudson and St. Francois River Basins. The area includes 172,000 km2 and covers all of New Hampshire, Vermont, Massachusetts, Connecticut, Rhode Island, most of Maine, and parts of New York and Canada.
The New England SPARROW models are based on a hydrologic network of 42,000 stream reaches and associated watersheds. The hydrologic network used was primarily the National Hydrography Dataset (NHD) at a scale of 1:100,000 (Canadian streams had to be added). Watershed boundaries are defined for each stream reach in the network through the use of a digital elevation model and available digitized watershed divides. Nutrient-source data are from permitted wastewater-discharge data, from USEPA’s Permit Compliance System (PCS), various land-use sources, and atmospheric deposition.
The dependent variables in the SPARROW models are in-stream total nitrogen and total phosphorous loads. The loads were estimated from stream discharge and water-quality data collected at monitoring locations throughout the study area by a variety of agencies and researchers. The required stream-
Table 14. New England SPARROW model predictions of nitro-gen concentrations for small and large streams.
[Concentrations are in milligrams per liter. Small streams are defined as hav-ing flows less than 2.83 cubic meters per second and large streams are de-fined as having flows greater than or equal to 2.83 cubic meters per second]
Quantile (percent)
Predicted nitrogen concentration
Small streams Large streams
90 1.12 1.01
75 .74 .69
50 .52 .47
25 .31 .27
10 .21 .18
Table 15. New England SPARROW model predictions of phos-phorus concentrations for small and large streams.
[Concentrations are in milligrams per liter. Small streams are defined as hav-ing flows less than 100 cubic meters per second and large streams are defined as having flows greater than or equal to 100 cubic meters per second]
Quantile (percent)
Predicted phosphorus concentration
Small streams Large streams
90 0.056 0.072
75 .040 .046
50 .028 .027
25 .021 .016
10 .017 .009
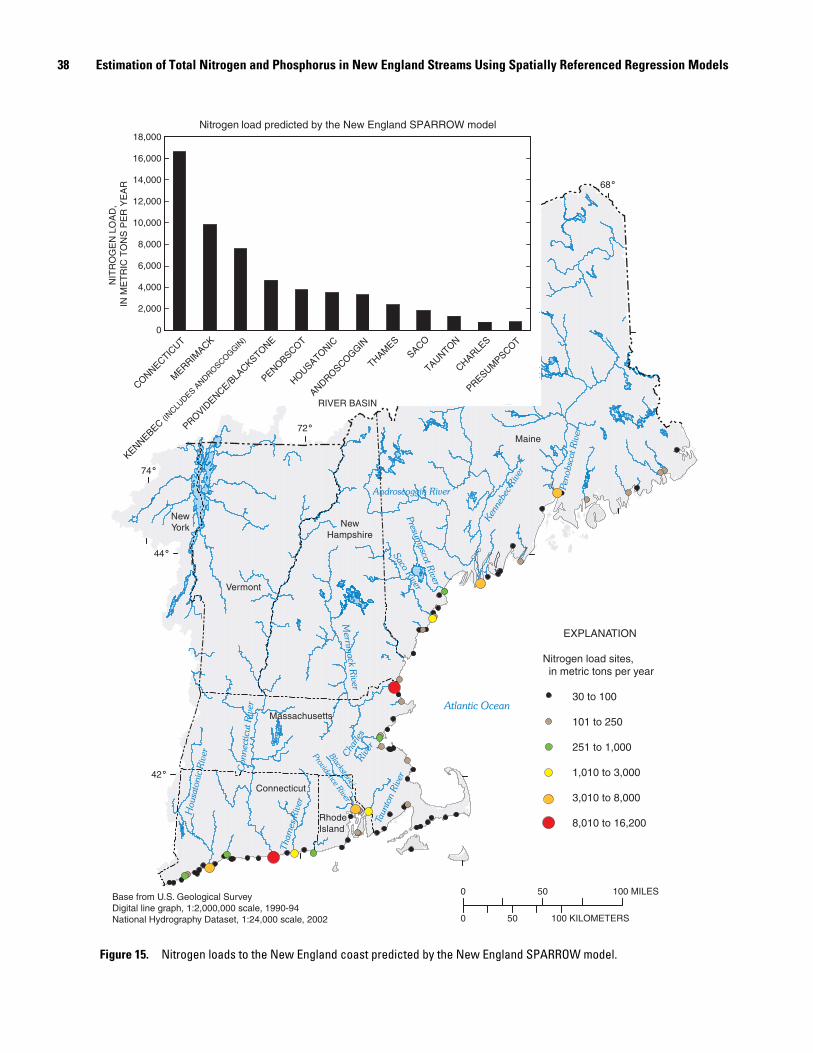
38 Estimation of Total Nitrogen and Phosphorus in New England Streams Using Spatially Referenced Regression Models
74˚
72˚
68˚
42˚
44˚
0 100 MILES50
0 50 100 KILOMETERS
Base from U.S. Geological SurveyDigital line graph, 1:2,000,000 scale, 1990-94National Hydrography Dataset, 1:24,000 scale, 2002
EXPLANATION
Nitrogen load sites, in metric tons per year
30 to 100
101 to 250
251 to 1,000
1,010 to 3,000
3,010 to 8,000
8,010 to 16,200
Connect
icut R
iver
Tham
es R
iver
Housa
tonic
Riv
er B
lackstone/
Providence River
Taunto
n R
iver
Cha
rles
Riv
er
Atlantic Ocean
Merrim
ack
Riv
er
Saco R
iverPresu
mpsco
t River
Androscoggin RiverKen
nebe
c Riv
er
Penobsc
ot R
iver
NewHampshire
Vermont
Massachusetts
Maine
Connecticut
RhodeIsland
NewYork
Nitrogen load predicted by the New England SPARROW model
0
2,000
4,000
6,000
8,000
10,000
12,000
14,000
16,000
NIT
RO
GE
N L
OA
D,
IN M
ET
RIC
TO
NS
PE
R Y
EA
R
RIVER BASIN
CONNECTICUT
MERRIM
ACK
KENNEBEC(IN
CLUDES A
NDROSCOGGIN)
PROVIDENCE/B
LACKSTONE
PENOBSCOT
HOUSATONIC
ANDROSCOGGIN
THAMES
TAUNTONSACO
CHARLES
PRESUMPSCOT
18,000
Figure 15. Nitrogen loads to the New England coast predicted by the New England SPARROW model.
Summary 39
loading data for inclusion in the SPARROW models were avail-able from 65 total nitrogen and 67 total phosphorus sites.
Predictor variables of total nitrogen loads in streams include (1) atmospheric deposition of total nitrogen, (2) nitro-gen loadings from permitted wastewater discharges (EPA esti-mates for municipal wastewater-treatment facilities), (3) area of agricultural land, and (4) the area of developed land. In general, the model results fit the observation load data as indicated by a coefficient of determination (R2) of 0.95, and a mean-squared error of 0.16. To estimate prediction intervals, a bootstrap anal-ysis was conducted.
For the entire model area, SPARROW estimates that 86,100 metric tons (86.1 million kilograms) of total nitrogen enters New England rivers and streams per year based on data from 1992 to 1993. Fifty percent (42,700 metric tons/year) is estimated to be from atmospheric deposition; 21 percent (18,000 metric tons/year) is estimated to be discharged from municipal wastewater-treatment facilities; 15 percent (13,000 metric tons/year) is estimated to be generated from other developed land sources; and 14 percent (12,400 metric tons/year) is estimated to be generated from agricultural lands.
The coefficient for nitrogen stream loss indicates that nitrogen is removed from the streams with mean-annual flows less than or equal to 2.83 m3/s. About 86 percent of the stream reaches in New England streams modeled with SPARROW have mean-annual flows less than or equal to 2.83 m3/s. Pre-sumably, the ability to identify this loss in small streams was enhanced by using a detailed stream network. The coefficient of 0.77 from the bootstrap model is equivalent to a half-life of about 0.9 days.
An important model result was a lack of statistically signif-icant annual modeled attenuation of nitrogen for larger streams with flows greater than 2.83 m3/s and for reservoirs. This find-ing is contrary to the findings of the national and other regional SPARROW models developed to date. To determine how the estimates for nitrogen in the New England and national SPAR-ROW models differ for streams in New England, a direct com-parison between the nitrogen model coefficients was made by applying a nested model. In the nested model, the New England data was run simultaneously with the national data to allow direct comparison of national and New England specific model coefficients. Conclusions reached from nesting the New England model within the national model are (1) for streams in New England with flows less than 2.83 m3/s, the nitrogen loss is higher than that of the national model stream reaches (0.8 d-1 as opposed to 0.3 d-1 for the national model stream reaches out-side New England); (2) for streams in New England with flows greater than 2.83 m3/s (grouped as a whole), the nitrogen loss on an annual basis is negligible at a 90-percent confidence level; and (3) there is a lack of data regarding reservoir loss of nitro-gen in New England.
Significant predictor variables of total phosphorus loads in streams were found to include (1) phosphorus from wastewater discharges (USEPA estimates for permitted municipal and pulp and paper wastewater discharges), (2) area of forested land, (3) area of agricultural land, (4) area of developed land, (5) a
reservoir loss variable for small reservoirs less than 10 km2 in surface area, and (6) a stream loss variable for streams with flows less than or equal to 2.83 m3/s.
In general, the model results fit the phosphorus observa-tion load data, as indicated by an R2 of 0.94 and a mean-squared error of 0.23. The bootstrap coefficients for reservoir and stream loss indicate that phosphorus is removed within the smaller reservoirs and streams. The coefficient of 0.48, for the stream loss variable for small streams from the bootstrap model, is equivalent to a half-life of about 1.5 days.
For the entire model area, SPARROW estimates that 7,380 metric tons (7.38 million kilograms) of total phosphorous enter New England rivers and streams per year. Of this amount, 52 percent (3,860 metric tons/year) is estimated to be dis-charged from municipal wastewater-treatment facilities or the paper industry; 5 percent (391 metric tons/year) is estimated to be from other developed land sources; 19 percent (1,380 metric tons/year) is estimated to be from agricultural lands; and 24 per-cent (1,750 metric tons/year) is estimated to be from forested lands.
As with any model, the New England SPARROW models have strengths and weaknesses. Strengths of the New England SPARROW models include the high R2 values and relatively good precision of most parameter coefficients. Other strengths include (1) the ability to provide regionally consistent charac-terizations of nutrient conditions and sources of the nutrients in streams, (2) to characterize the transport and loss of nutrients within watersheds, and (3) to show prediction intervals associ-ated with nutrient load estimates. Weaknesses of the models include (1) the models only incorporate monitored-load data from limited number of sites with long-term data; (2) predictor variables may be coarse (such as land uses) or of relatively poor quality (such as point source loads); and (3) the models only predict mean-annual conditions, not necessarily critical condi-tions such as low-flow conditions.
There are several other deterministic and stochastic mod-els that have been used to estimate nitrogen loads in New England basins. Although five of these models have different time frames and use different techniques, they can be compared with the New England SPARROW model predictions. Exclud-ing one outlier basin (Charles River), the New England Basins SPARROW model predictions have an average of + 30 percent of the other model predictions, with a maximum difference of 70 percent. For phosphorus, there are only two other model studies available for comparison. Excluding the Charles River Basin, the New England SPARROW phosphorus model predic-tions have an average of + 43 percent of the national SPAR-ROW model predictions (with a maximum difference of 211 percent for the Taunton River Basin) and are within an average of + 88 percent of the NOAA predictions (with a max-imum difference of 367 percent for the Piscataqua River Basin). Comparisons for the Charles River Basin are not valid because the offshore municipal wastewater discharge for metropolitan Boston is excluded from the basin in the New England SPAR-ROW model but included in the basin in the national SPAR-ROW model.
40 Estimation of Total Nitrogen and Phosphorus in New England Streams Using Spatially Referenced Regression Models
The SPARROW models can be used as tools by water-resources managers in water-quality assessment and manage-ment activities such as TMDL studies, nutrient-criteria devel-opment, and nutrient loadings to coastal waters. The ability to estimate contaminant loads relative to watershed characteris-tics, complete with statistical estimates of the error involved, can be an important tool available to the TMDL program. Nitrogen-model results for the Connecticut River Basin serve as an example of how SPARROW results are useful in assessing the contributions to Long Island Sound from any location in the entire watershed. SPARROW results provide an estimate that 41 percent of the total nitrogen load entering Long Island Sound originated upstream of the point where the Connecticut River leaves New Hampshire and Vermont. Further, SPARROW estimates also indicate that, of the load leaving New Hampshire and Vermont, 11 percent is from municipal wastewater-treat-ment facilities, 6 percent is from developed land, 20 percent is from agricultural lands, and the remaining 63 percent is from atmospheric deposition.
SPARROW results provide useful information relative to nutrient-criteria goals. The mean flow-weighted concentrations can be computed from the annual loads (total load at the down-stream end of each stream reach, predicted by SPARROW) divided by the mean-annual flows. Model results do not show the variability of concentrations throughout the year; however, these predictions can be used as a guide for water-resources managers to identify management priorities. Nitrogen concen-trations for the Laurentian Plains and the Northeast Highlands have, on average, lower concentrations of nitrogen than do the other ecoregions, and the Atlantic Coastal Pine Barrens has the highest concentrations. For the Laurentian Plains, the low nitrogen concentrations can be attributed to less atmospheric deposition of nitrogen because the ecoregion is farther away from sources in the industrial Midwest United States. The East-ern Great Lakes and Hudson Lowlands ecoregion (surrounding Lake Champlain) appear to have high concentrations of phos-phorus, which is partially the result of intense agricultural activ-ity in the Lake Champlain Basin.
The large estimated contributions of atmospheric deposi-tion to total nitrogen loads in New England is a major finding of this New England SPARROW modeling effort. For the entire study area, the model results indicate that 50 percent of the nitrogen loads come from atmospheric deposition. The percent-age increased for western parts of the model area; SPARROW results indicate that 63 percent of the nitrogen load leaving New Hampshire and Vermont from the Connecticut River is from atmospheric deposition.
A product of the New England SPARROW models is the estimation of the nutrient loading delivered from each stream reach to the mouth of the river. This information can be used in estimating the nutrient contributions to estuaries and the ocean from upstream sources. SPARROW model results have been used to estimate the total nitrogen loads to New England coastal waters. This information can help estimate the relative contribu-tions of different river basins of nutrient loads to the coast and can help identify where potential eutrophication may occur.
Selected References
Agriculture and Agri-Food Canada, 1998, Canada land inven-tory, national soil database, accessed October 27, 2003, at http://sis.agr.gc.ca/cansis/nsdb/cli/intro.html
Alexander, R.B., and Smith, R.A., 1990, County-level esti-mates of nitrogen and phosphorus fertilizer use in the United States, 1945 to 1985: U.S. Geological Survey Open-File Report 90-130, accessed October 27, 2003, at http://water.usgs.gov/pubs/of/ofr90130/.
Alexander, R.B., Smith, R.A., and Schwarz, G.E., 2000, Effect of stream channel size on the delivery of nitrogen to the Gulf of Mexico: Nature, 403, p. 758-761.
Alexander, R.B., Elliott, A.H., Shankar, Ude, and McBride, G.B., 2002, Estimating the sources and transport of nutrients in the Waikato River Basin, New Zealand: Water Resources Research, v. 38, no. 12, p. 1268-1290.
Boyer, E.W., Goodale, C.L., Jaworski, N.A., and Howarth, R.W., 2002, Anthropogenic nitrogen sources and relationships to riverine nitrogen export in the northeastern U.S.A.: Biogeochemistry, v. 57/58, p. 137-169.
Brakebill, J.W., and Preston, S.D., 1999, Digital data used to relate nutrient inputs to water quality in the Chesapeake Bay watershed, Version 1.0: U.S. Geological Survey Open- File Report 99-60, accessed October 27, 2003, at http://md.usgs.gov/publications/ofr-99-60/.
Carpenter, S.R., Caraco, N.F., Correll, D.L., Howarth, R.W., Sharpley, A.N., and Smith, V.H., 1998, Nonpoint pollution of surface waters with phosphorus and nitrogen: Ecological Applications, v. 8, p. 559-568.
Chapra, S.C., 1975, Comment on ‘An empirical method of estimating the retention of phosphorus in lakes’ by W.B. Kirchner and P.J. Dillon: Water Resources Research, v.11, p. 1033-1034.
_____1997, Surface water-quality modeling: New York, The McGraw-Hill Companies, Inc., 844 p.
Cohn, T.A., Delong, L.L., Gilroy, E.J., Hirsch, R.M., and Wells, D.K., 1989, Estimating constituent loads: Water Resources Research, v. 25, no. 5, p. 937-942.
Daley, Chris, and Taylor, George, 2000a, United States average monthly or annual precipitation, 1961-1990: Corvallis, Oreg., Spatial Climate Analysis Service at Oregon State University, digital data accessed March 2001, at http://www.ocs.orst.edu/prism/prism_new.html
_____2000b, United States average monthly or annual temper-ature, 1961-1990, Corvallis, Oreg., Spatial Climate Analysis Service at Oregon State University, digital data accessed March 2001, at http://www.ocs.orst.edu/prism/prism_new.html
DeWald, Thomas, Horn, Robert, Greenspun, Robert, Taylor, Phillip, Manning, Lee, and Montalbano, Ann, 1985, STORET Reach Retrieval Documentation: Washington, D.C., U.S. Environmental Protection Agency.
Efron, Bradley, 1982, The jackknife, the bootstrap, and other resampling plans, in CBMS-NSF Regional Conference

Selected References 41
Series in Applied Mathematics, Philadelphia, Pa.: Society for Industrial and Applied Mathematics, 92 p.
Environmental Systems Research Institute, Inc., (ESRI), 1994, Network analysis: Redlands, Calif., 208 p.
_____1999, Using ARC GRID with ARC/INFO: ESRI, Redlands, Calif., v. 2, 436 p.
Focazio, M.J., Smith, R.A., Alexander, R.B., and Schwarz, G.E., 1998, A national model for assessing the sus-ceptibility of surface-water supplies to source-area contami-nation; Extended Abstract: Source Water Protection 98, A technical conference sponsored by the National Water Research Institute, U.S. Environmental Protection Agency, and U.S. Geological Survey, Dallas, Tex., April 1998, accessed October 27, 2003, at http://water.usgs.gov/nawqa/sparrow/drink/dwater.html
Hellweger, Ferdi, and Maidmont, David, 1997, “AGREE-DEM Surface reconditioning system.” University of Texas, accessed October 27, 2003, at http://www.crwr.utexas.edu/gis/gishyd98 /quality/agree/agree.htm
Hem, J.D., 1985, Study and interpretation of the chemical char-acteristics of natural water: U.S. Geological Survey Water-Supply Paper 2254, 3rd ed., 263 p.
Howarth, R.W., Billen, G., Swaney, D., Townsend, A., Jaworski, N., Lajtha, K., Downing, J.A., Elmgren, R., Caraco, N., Jordan, T., Berendse, F., Freney, J., Kudeyarov, V., Murdoch, P., and Zhu Zhao-Liang, 1996, Regional nitro-gen budgets and riverine N & P fluxes for the drainages to the North Atlantic Ocean: natural and human influences: Bio-geochemistry v. 35, p. 75-139.
Jobson, H.E., 1996, Prediction of traveltime and longitudinal dispersion in rivers and streams: U.S. Geological Survey Water-Resources Investigations Report 96-4013, 69 p.
Kelly, C.A., Rudd, J.W.M., Hesslein, R.H., Schindler, D.W., Dillon, P.J., Driscoll, C.T., Gherini, S.A., and Hecky, R.E., 1987, Prediction of biological acid neutralization in acid- sensitive lakes: Biogeochemistry, v. 3, p. 129-141.
Knopman, D.S., and Smith, R.A., 1993, 20 years of the Clean Water Act: Environment, v. 35, no. 1, p. 1741.
Litke, D.W., 1999, Review of phosphorus control measures in the United States and their effects on water quality: U.S. Geological Survey Water-Resources Investigations Report 99-4007, 38 p.
McMahon, Gerard, Roessler, Chris, Qian, Song, 2002, A regression-based approach to assessing stream nitrogen impairment probabilities [abstract] in American Geophysical Union, Program and Abstracts Spring Meeting, May 28-31, 2002, Washington D.C.: American Geophysical Union, accessed October 27, 2003, at http://www.agu.org/meetings/waissm02.html
McMahon, Gerard, Alexander, R.A., Qian, Song, 2003, Sup-port of TMDL Programs using spatially referenced regres-sion models: Journal of Water Resources Planning and Man-agement, v. 129, p. 315-329.
Molot, L.A., and Dillon, P.J., 1993, Nitrogen mass balances and denitrification rates in central Ontario Lakes: Biogeochem-istry, v. 20, p. 195-212.
Moore, R.B., Robinson, K.W., Simcox, A.C., Johnston, C.M., 2002, New England SPARROW water-quality modeling to assist with the development of total maximum daily loads in the Connecticut River Basin [abstract] in American Geo-physical Union, Program and Abstracts Spring Meeting, May 28-31, 2002, Washington D.C.: American Geophysical Union, accessed October 27, 2003, at http://www.agu.org/meetings/waissm02.html
Mullaney, J.R., Schwarz, G.E., Trench, E.T., 2002, Estimation of nitrogen yields and loads from basins draining to Long Island Sound, 1988-98: U.S. Geological Survey Water-Resources Investigations Report 02-4044, 85 p.
National Atmospheric Deposition Program, 2002, National atmospheric deposition program data networks, accessed October 27, 2003, at http://nadp.sws.uiuc.edu/
National Oceanic and Atmospheric Administration, 1987, Strategic assessment of near coastal waters-northeast case study: EPA/NOAA Team on Near Coastal Waters, interim draft, 56 p.
_____1993, National Coastal Pollutant Discharge Inventory (NCDPI) point source methods document, 251 p.
National Research Council, 2000, Clean coastal waters under-standing and reducing the effects of nutrient pollution: Washington, D.C., National Academy Press, 405 p.
_____2001, Assessing the TMDL approach to water quality management: Washington, D.C., National Academy Press, 109 p.
Natural Resources Canada, 2000, National Topographic Data Base (NTDB), (3rd ed.): Sherbrooke, Quebec, Natural Resources Canada Center for Topographic Information, Canada, 1:50,000 scale digital data.
New Hampshire Water Supply and Pollution Control Commis-sion, 1973, Eutrophication in Lake Winnisquam - through calendar year 1972: Concord, N.H., New Hampshire Water Supply and Pollution Control Commission, 167 p.
New York Department of Environmental Conservation/Con-necticut Department of Environmental Protection, 2000, A total maximum daily load analysis to achieve water-quality standards for dissolved oxygen in Long Island Sound: Albany, N.Y., and Hartford, Conn., 73 p., accessed October 27, 2003, at http://www.epa.gov/region01/eco/lis/pdf/Tmdl.pdf
Ollinger, S.V., Aber, J.D., Lovett, G.M., Millham, S.E., Lathrop, R.G., and Ells, J.M., 1993, A spatial model of atmo-spheric deposition for the northeastern United States: Ecological Applications, v. 3, no. 3, p. 459-472.
Preston, S.D., and Brakebill, J.W., 1999, Application of spa-tially referenced regression modeling for the evaluation of total nitrogen loading in the Chesapeake Bay watershed: U.S. Geological Survey Water-Resources Investigations Report 99-4054, 12 p.
Randall, A.D., 1996, Mean annual runoff, precipitation, and evapotranspiration in the glaciated northeastern United States, 1951-80: U.S. Geological Survey Open-File Report 96-395, scale 1:1,000,000, 2 sheets (available only as digital files).
42 Estimation of Total Nitrogen and Phosphorus in New England Streams Using Spatially Referenced Regression Models
Robinson, K.W., Campbell, J.P., and Jaworski, N.A., 2003, Water-quality trends in New England rivers during the 20th century: U.S. Geological Survey Water-Resources Investi-gations Report 03-4012, 20 p.
Roman, C.T., Jaworski, Norbert, Short, F.T., Findlay, Stuart, and Warren, R.S., 2000, Estuaries of the northeastern United States: habitat and land use signatures: Estuaries, v. 23, p. 743-764.
SAS Institute, Inc., 1999, SAS/ETS User's Guide, Version 8: Cary, N.C., 1,022 p.
Schwarz, G.E., 1998, SPARROW and the TMDL process, slides of talk presented at the USGS-EPA Total Maximum Daily Load Workshop, Denver, Colo., September 9-11, 1998, accessed October 27, 2003, at http://water.usgs.gov/nawqa/sparrow/tmdl/index.htm
Schwarz, G.E., and Alexander, R.B., 1995, State soil geo-graphic (STATSGO) database for the conterminous United States version 1.1: U.S. Geological Survey Open-File Report 95-449, scale 1:250,000, accessed October 27, 2003, at http://water.usgs.gov/GIS/metadata/usgswrd/ussoils.html
Shabman, Leonard, 2002, Implications of modeling uncertainty for water quality decision making [abstract] in American Geophysical Union, Program and Abstracts Spring Meeting, May 28-31, 2002, Washington D.C.: American Geophysical Union, accessed October 27, 2003, at http://www.agu.org/meetings/waissm02.html
Smith, R.A., Alexander, R.B., and Schwarz, G.E., 2002, Advantages of a Bayesian approach to making 303d listing decisions [abstract] in American Geophysical Union, Program and Abstracts Spring Meeting, May 28-31, 2002, Washington D.C.: American Geophysical Union, accessed October 27, 2003, at http://www.agu.org/meetings/waissm02.html
Smith, R.A., Alexander, R.B., Tasker, G.D., Price, C.V., Robinson, K.W., and White, D.A., 1993, Statistical modeling of water quality in regional watersheds, in Proceedings of Watershed ’93, A national conference on watershed manage-ment, Alexandria, Va., March 21-24, 1993: EPA-840-R-94-002, p. 751-754.
Smith, R.A., Schwarz, G.E., and Alexander, R.B., 1997, Regional interpretation of water-quality monitoring data: Water Resources Research, v. 33, no. 12, p. 2781-2798.
Soil Conservation Service, 1992, Agricultural waste manage-ment field handbook: Washington, D.C., U.S. Government Printing Office, chap. 4, 24 p.
U.S. Department of Agriculture, 1994, State soil geographic (STATSGO) database data use information: U.S. Depart-ment of Agriculture-Natural Resources Conservation Service Miscellaneous Publication 1492, 113 p.
U.S. Environmental Protection Agency, 1998a, National strat-egy for the development of regional nutrient criteria: Office of Water, EPA-822-F-98-002, 2 p.
_____1998b, Better assessment science integrating point and nonpoint sources, BASINS version 2.0—user’s manual: EPA-823-B-98-006, 584 p.
_____1999, Level III ecoregions of the continental United States: 1 sheet, scale 1:7,500,000.
_____2000a, Nutrient criteria technical guidance manual: Office of Water, EPA-822-B-00-002, variously paged.
_____2000b, State of the Environment, U.S. Environmental Protection Agency-New England, Boston, 38 p.
______2001, Total maximum daily load (TMDL) program, accessed October 27, 2003, at http://www.epa.gov/OWOW/tmdl/index.html
_____2003, Overview of current total maximum daily load—TMDL—program and regulations, assessed October 27, 2003 at http://www.epa.gov/owow/tmdl/over-viewfs.html
U.S. Geological Survey, 1978, Method for determining selected flow characteristics for streams in the state of Maine: U.S. Geological Survey Open-File Report 78-871, 31 p.
_____1999a, The quality of our nation’s waters—nutrients and pesticides, U.S. Geological Survey Circular 1225, 82 p.
_____1999b, The national elevation dataset, accessed July 23, 1999, at http://edcnts12.cr.usgs.gov/ned/fact-sheet.asp
_____1999c, The national hydrography dataset, U.S. Geologi-cal Survey Fact Sheet 106-99, accessed April 2000 to March, 2001, at http://nhd.usgs.gov/.
_____2000, National land cover data (NLCD) circa 1992, completed nationwide September 2000, accessed October 27, 2003, at http://seamless.usgs.gov/.
Valigura, R.A., Alexander, R.A., Castro, M.S., Meyers, T.P., Paerl, H.W., Stacey, P.E., and Turner, R.E., (eds.), 2001, Coastal and estuarine studies—nitrogen loading in coastal waterbodies—an atmospheric perspective: Washington, D.C., American Geophysical Union, 254 p.