Estimation of the Frontal Retreat Rate of the Pindari ...
12
Open access e-Journal Earth Science India eISSN: 0974 – 8350 v. 12 (III), July, 2019, pp. 146-157 http://www.earthscienceindia.info/ Estimation of the Frontal Retreat Rate of the Pindari Glacier, Central Himalaya Using Remote Sensing Technique Sheikh Nawaz Ali 1 , Rupendra Singh 2 and Pratima Pandey 3 1 Birbal Sahni Institute of Palaeosciences, Lucknow, India 2 CPS, School of Social Sciences, Jawaharlal Nehru University, New Delhi, India 3 Indian Institute of Remote Sensing, Dehradun, India Email: [email protected]; [email protected] ABSTRACT In the present scenario of climate change, climatologists are concerned with the soaring rates of deglaciation in high mountain areas. Being the most sensitive climate change indicators, there has been a phenomenal increase in the interpretation of changing glaciers using remote sensing images. However, the data generated needs to be validated and the inferences drawn must be supported by logical explanations to facilitate the understanding of the relevant processes. The present study investigates the frontal (snout) changes of Pindari glacier through a comprehensive analysis of remote sensing data and field validations. Regional case studies of glacier front changes demonstrate that the Himalayan glaciers are retreating; however, the rate of retreat is variable over time. The Pindari glacier has witnessed highest rate of retreat (73.27m) during 2009-2010. The in-situ measurements have recorded a high recession during 1845 to 1958, that significantly decreased during 1958-1966. Subsequently, a gradual increase in the rate of recession till 2010 has been reported and is evident in remote sensing data also. However, since 2010, the rate of retreat has again slowed down. The present observations may be interpreted as direct consequence of the rapidly changing climate wherein the glaciers are witnessing a negative mass balance and hence the retreat. Our data is in accordance with other local and regional studies and imply mass wasting of glaciers as a response to global climate warming. Keywords: Remote sensing; Rate of retreat; Pindari glacier; Central Himalaya INTRODUCTION The increasing interest of the scientific community and policy makers in the Himalayan cryosphere is because of the alarming rate of deglaciation (glacier melting) during the past few decades; making the situation complex for the planners and dependents. Fragile ‘edge of the range’ environments (Bellwood, 2013) like the Himalayas are the most vulnerable candidates of ongoing climate change and global warming (Safari, 2012). This warming has been attributed to a progressive increase in the atmospheric concentration of greenhouse gases (IPCC, 2014). The rapid climate change in the Himalayas is expected to have a significant impact on the freshwater resources, biodiversity, ecosystems and human well- being (Myers et al., 2000; Chaudhary and Bawa, 2011; Chand et al., 2019). Please cite this article as: Ali, Sheikh Nawaz, Singh, Rupendra and Pandey Pratima (2019) Estimation of the frontal retreat rate of the Pindari glacier, Central Himalaya using remote sensing technique. e-Journal Earth Science India, v. 12 (III), pp. 146-157 https://doi.org/10.31870/ESI.12.3.2019.11
Transcript of Estimation of the Frontal Retreat Rate of the Pindari ...

Open access e-Journal Earth Science India eISSN: 0974 – 8350 v. 12 (III), July, 2019, pp. 146-157 http://www.earthscienceindia.info/
Estimation of the Frontal Retreat Rate of the Pindari Glacier, Central Himalaya Using Remote Sensing
Technique
Sheikh Nawaz Ali1, Rupendra Singh2 and Pratima Pandey3 1Birbal Sahni Institute of Palaeosciences, Lucknow, India
2 CPS, School of Social Sciences, Jawaharlal Nehru University, New Delhi, India 3Indian Institute of Remote Sensing, Dehradun, India
Email: [email protected]; [email protected]
ABSTRACT
In the present scenario of climate change, climatologists are concerned with the soaring rates of deglaciation in high mountain areas. Being the most sensitive climate change indicators, there has been a phenomenal increase in the interpretation of changing glaciers using remote sensing images. However, the data generated needs to be validated and the inferences drawn must be supported by logical explanations to facilitate the understanding of the relevant processes. The present study investigates the frontal (snout) changes of Pindari glacier through a comprehensive analysis of remote sensing data and field validations. Regional case studies of glacier front changes demonstrate that the Himalayan glaciers are retreating; however, the rate of retreat is variable over time. The Pindari glacier has witnessed highest rate of retreat (73.27m) during 2009-2010. The in-situ measurements have recorded a high recession during 1845 to 1958, that significantly decreased during 1958-1966. Subsequently, a gradual increase in the rate of recession till 2010 has been reported and is evident in remote sensing data also. However, since 2010, the rate of retreat has again slowed down. The present observations may be interpreted as direct consequence of the rapidly changing climate wherein the glaciers are witnessing a negative mass balance and hence the retreat. Our data is in accordance with other local and regional studies and imply mass wasting of glaciers as a response to global climate warming. Keywords: Remote sensing; Rate of retreat; Pindari glacier; Central Himalaya
INTRODUCTION
The increasing interest of the scientific community and policy makers in the Himalayan
cryosphere is because of the alarming rate of deglaciation (glacier melting) during the past few decades; making the situation complex for the planners and dependents. Fragile ‘edge of the range’ environments (Bellwood, 2013) like the Himalayas are the most vulnerable candidates of ongoing climate change and global warming (Safari, 2012). This warming has been attributed to a progressive increase in the atmospheric concentration of greenhouse gases (IPCC, 2014). The rapid climate change in the Himalayas is expected to have a significant impact on the freshwater resources, biodiversity, ecosystems and human well-being (Myers et al., 2000; Chaudhary and Bawa, 2011; Chand et al., 2019).
Please cite this article as: Ali, Sheikh Nawaz, Singh, Rupendra and Pandey Pratima (2019) Estimation of the frontal retreat rate of the Pindari glacier, Central Himalaya using remote sensing technique. e-Journal Earth Science India, v. 12 (III), pp. 146-157 https://doi.org/10.31870/ESI.12.3.2019.11

Estimation of the frontal retreat rate of the Pindari glacier, Central Himalaya using remote sensing technique: Ali et al.
147
Explicit reports of significant warming trends in the Himalayan region (Hamid et al., 2014) leading to glacier mass loss (Bajracharya et al., 2015; Bolch et al., 2012; Lama et al., 2015;), increase in glacier lakes (number as well as area; Singh et al., 2018; Bajaracharya and Mool, 2009; Scherler et al., 2011; Riaz et al., 2014; Khanal et al., 2015; Nie et al., 2013), effects on the hydrological cycle (Immerzeel et al., 2010; Yang et al., 2011) of important river systems and the consequences on downstream populations (Sharma et al., 2009; Chaudhary et al., 2011; Vedwan et al., 2001) has been a concern of the scientific fraternity. The Himalayan glaciers have considerable influence on the climate, water resources and socio-economy of the region with large human concentration. This makes the monitoring of these glaciers imperative and help in assessing the overall reservoir health (Kulkarni et al., 2007). Being a significant source of stored fresh water (Immerzeel et al. 2010; Kaser et al., 2010) and one of the most important indicators of climate change (Kaser et al., 2006; Bolch et al., 2012), studies related to glacier health and its influence on the Himalayan rivers must be precisely addressed. Accuracy and authenticity in data must be well established and thoroughly cross-checked because the search for truth based on empirical data and its unbiased reporting are ultimate goals of conducting scientific research (Marco and Larkin, 2000).
The Himalayas, forming the largest mountain chain over the earth are the custodian
of the third largest ice reserves after the Polar Regions. However, the lack of data over this complex terrain (rugged topography, harsh climate and remote location of glaciers) is a major hurdle for establishing and predicting future glacier trends accurately. Satellite based remote sensing has proved to be an important tool for mapping and monitoring the changes in the area, length, surface elevation, surface flow fields, accumulation/ablation rates etc. (Konig et al., 2001). But, with the varying and conflicting dataset related to the estimation of glacier changes, the authenticity, accuracy, and sensitivity of the results derived from remote sensing data have become questionable, and influence all other inferences based on such dataset. Therefore, it is necessary to validate the remote sensing observations with ground data. The validation becomes important, otherwise the consequences of errors is (are) alarming. For example the Section on ‘The Himalayan glaciers’ (IPCC Fourth Assessment Report; IPCC, 2007), reporting that the Glaciers in the Himalaya would disappear by the year 2035 and perhaps sooner if the Earth keeps warming at the current rate. It is well established now that the Himalayan glacier have substantially receeded during the last century, however the rate of retreat is variable (Kulkarni et al., 2007; Immerzeel et al., 2009; Kargel et al., 2010). Keeping the above facts in view, the present study aims at estimating the retreat of Pindari glacier and validating our results with the previous observations (Strachy, 1847; Tewari and Jangpangi, 1958, 1966; Tewari, 1973; Bali et al., 2013; Raczkowska and Joshi, 2016; Pandey et al., 2018). Field validation of remote sensing data is mandatory to quantify the reliability of products/results (Justice et al., 2000; Zhang et al., 2010; Wang et al., 2016).
STUDY AREA
Pindari glacier (30°16'5ʺ–30°19'10ʺN and 79°59'00ʺ–80°01'55ʺE) is a ~9 km long south facing glacier located in the Indian summer monsoon-dominated (ISM) Central Himalaya, India (Fig. 1). This glacier is one of the few glaciers in the Indian Himalaya, which has long trail of historical observations dating back to 1845 (Strachy, 1847) and Cotter and Brown (1907).
The In-situ monitoring of snout positions of this glacier has been done by the
Geological Survey of India in 1958, 1962 and 1966 and further updated by Bali et al. (2013). Besides snout monitoring, the Pindar valley has preserved the moraines of different glacial stages and associated glacial geomorphological features (Bali et al., 2013; Fig. 2).

Estimation of the frontal retreat rate of the Pindari glacier, Central Himalaya using remote sensing technique: Ali et al.
148
Fig. 1: Map showing (a) the location of the study area i.e. the Central Himalaya in India, (b)
shuttle radar topographic mission (SRTM) digital elevation model (DEM) of Uttrakhand showing the study area in a yellow rectangle.
(a)
Estimation of the frontal retreat rate of the Pindari glacier, Central Himalaya using remote sensing technique: Ali et al.
149
Fig. 2: (a) Detailed geomorphological map of the Upper reaches of Pindar valley (b) Google Earth Pro Imagery of 2005 showing the Pindari glacier, adjoining Chhanguch valley, the medial moraine between them and the water fall.
DATA-SETS AND METHOD
The data used in our study include Landsat MSS/TM/ETM+/OLI, Sentinel-2A, Survey
of India (SOI) topographical map and Google Earth pro imagery. All the remote sensing data (Table-1) were obtained from the United States Geological Survey website (USGS; http://earthexplorer.usgs.gov). To reduce potential uncertainty in glacier area delineation, satellite scenes with minimum cloud cover (<10%) during the ablation season from 1976 to 2017 were selected. The bands, 1 to 5 are MSS (Multispectral bands) with a spatial resolution of 30 m (for Landsat 2 to 8), while the panchromatic band 8 (Landsat 7 and 8) has a spatial resolution of 15 m. To achieve a better MSS resolution we merged band 8 with MSS band using PAN-sharpening in Leica-Erdas Software. The resultant image with a 15 m spatial resolution gave better results (Bhambri et al., 2018). Besides this, High resolution (10m) Sentinel-2A satellite images acquired on 14 October 2017 were also used to for better results. We have used the Sentinel-2A satellite data because it has a Multi-Spectral Instrument (MSI), that scans the Earth’s objects at different spatial resolutions with a revisit time of 10 days. It operates on thirteen different bands of which four bands have a spatial resolution of 10m, six bands have a resolution of 20m, and rest three bands have a resolution of 60m. For the present study, 10 m spatial resolution band 8b- NIR, band 4-Red, band 3-Green, and band 2-Blue were used (Singh et al., 2018). The Sentinel-2A images have been processed using Sentinel Application Platform (SNAP), a free open-source platform jointly developed by Brockmann Consult, Array Systems Computing and C-S (SNAP; http://step.esa.int/main/toolboxes/snap/).
All the satellite images were co-registered and the error of co-registration is within ~1
RMSE. Glacier mapping was carried out in ArcGIS 10.2. The glacier boundaries were qualitatively validated using Google Earth Pro (3D) to fix any potential problems. Delineation of glacier boundaries is based on the strong spectral differences in the reflectance of snow, ice, and debris in the visible and near-infrared bands (VNIR) in comparison to the shortwave
Estimation of the frontal retreat rate of the Pindari glacier, Central Himalaya using remote sensing technique: Ali et al.
150
infrared band (SWIR) (Dozier 1989). Snow and ice have a very high reflectance in the VNIR whereas a very high absorption in SWIR. The band combination of 5, 4, 3 and 4, 3, 2 for Landsat ETM+ and OLI have been found to give better results of glacier delineation. This is because of the contrasting spectral characteristics of the snow, ice, and debris in VNIR and SWIR.
Since, the meteorological data from the higher Himalayan region is not available,
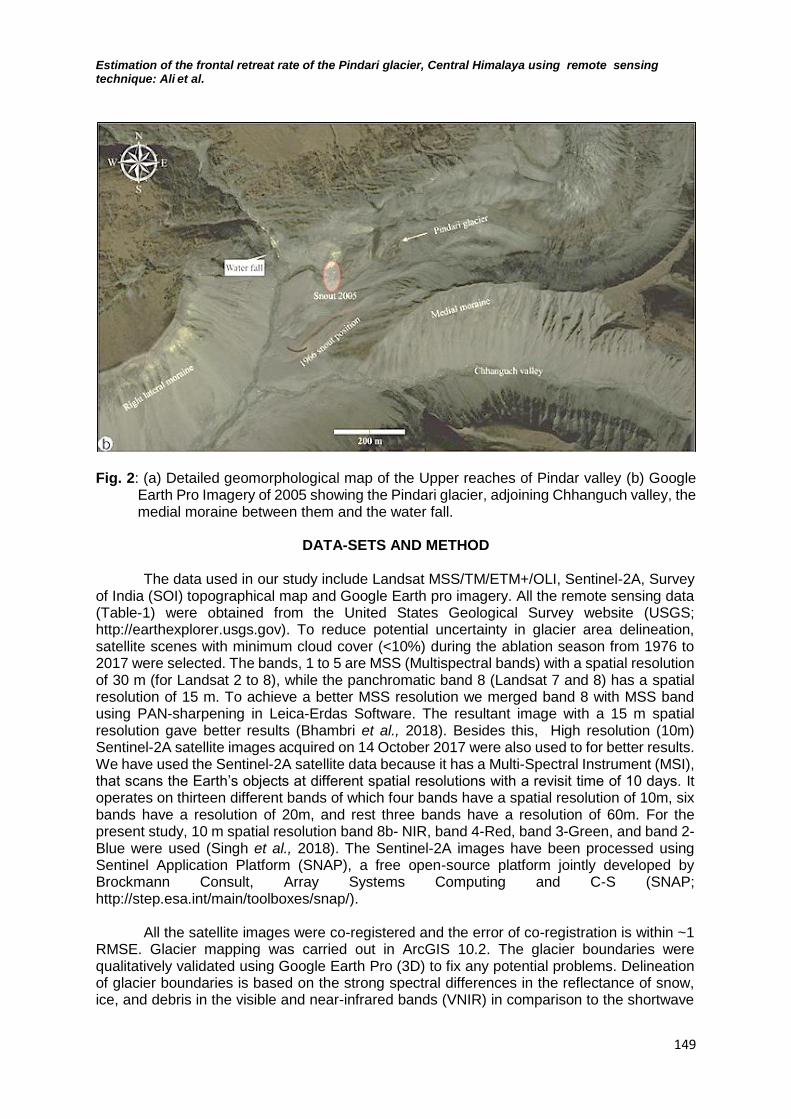
therefore, we used the the Climatic Research Unit Timeseries gridded temperature and precipitation datasets of nearest grid points (30.25 N, 80.25 E Pindari glacier) through Climatic Research Unit (CRU TS. 4.02, 0.5 latitude x 0.5 longitude, 1901-2017 CE; Harris et al., 2014). The analysis of CRU TS data suggests that the Mean annual temperature (MAT) are (is) around ~3.41°C while the mean annual precipitation (MAP) are(is) ~774 mm respectively (Fig. 3). It is clear from the data that temperature (all annual, summer and winter) show an increasing trend while the precipitation is decreasing during the study peiod (Fig. 3). Fig. 3: Line plot of CRU TS-4.02 data showing the Mean annual temperature (MAT),
Temperatuer of the summer (T-summer; JJAS), Temperatuer of the winter (T- winter; DJF), Mean annual precipitation (MAP), precipitation of the summer (P-summer; JJAS), precipitation of the winter (P- winter; DJF) and their linear trends.

Estimation of the frontal retreat rate of the Pindari glacier, Central Himalaya using remote sensing technique: Ali et al.
151
Table-1: Details of the remote sensing data used for the present study with date of acquisition, Path/Row, spatial resolution and Sensor. Rate of recession estimated for Pindari glacier in the present study, recessional rates recorded by different workers and comparison of the present recessional rate with that on Pandey et al., 2018.
Sr. No.
Data source Acquisition Date
Path / Row
spatial resolution (m)
Sensor
1. Landsat2 19 Nov. 1976 156-39 57 MSS
2. Landsat 4 09 Oct. 1989 145-39 30 TM, MSS
3. Landsat5 28 Sept. 1996 145-39 30 TM
4. Landsat7 15 Oct. 1999 145-39 15 ETM+
5. Landsat7 23 Oct. 2002 145-39 15 ETM+
6. Landsat5 02 Oct. 2009 145-39 30 TM
7. Landsat5 21 Oct. 2010 145-39 30 TM
8. Landsat8 29 Oct. 2013 145-39 15 OLI
9. Sentinel-2A 14 Oct. 2017 T44RLU 10 MSI
Recessional rates recorded by different workers
S. No.
years Recession (m)
No. of Years
Avg. recession per annum (m)
Reference
1 1845–1906 1600 61 26.23 Cotter, 1906
2 1906-1958 1040 52 20 Tiwari et al., 1958
3 1958-1966 61 8 6.62 Tiwari et al., 1966
4 1966-2007 262 41 6.39 Bali et al., 2013
5 2007-2008 15 1 15 Bali et al., 2013
6 2008-2009 32 1 32 Bali et al., 2013
7 2009-2010 70 1 70 Bali et al., 2013
8 1966-1976 257.11 12 21.42 Present study
9 1976-1989 50.36 13 3.87 Present study
10 1989-1996 40.86 7 5.83 Present study
11 1996-1999 28.19 3 9.4 Present study
12 1999-2002 21.08 3 7.02 Present study
13 2002-2009 87.18 7 12.45 Present study
14 2009-2010 73.27 1 73.27 Present study
15 2010-2013 40.01 3 13.34 Present study
16 2013-2017 39.29 4 9.82 Present study
Retreat rate comparison
1 1976-1999 1178.31 23 51.23 Pandey et al., 2018
2 1999-2014 390.70 15 26.05 Pandey et al., 2018
3 1976-1999 119.41 23 5.19 Present study
4 1999-2017 260.83 18 14.5 Present study
RESULTS, DISCUSSION AND COMPARISON
The Pindari glacier is one of the well-studied glaciers in Indian Himalayas for which
historical records of frontal changes (snout monitoring) are available since 1845 (Strachy, 1847). Strachy (1847) was the pioneer worker to document the snout position of the Pindari glacier and latter on Cotter and Brown (1907) studied it again and have reported a recession

Estimation of the frontal retreat rate of the Pindari glacier, Central Himalaya using remote sensing technique: Ali et al.
152
of aro und 1600 m during 1985 and 1906. After 1906, significant information on the retreat of Pindari glacier was provided by Tiwari and Jangpangi who have estimated a retreat rate of around 20 m/yr between 1906 and 1958 and around 6.62 m/yr during 1958 to 1966. Later on, field-based mapping of the Pindari glacier and snout monitoring revealed that the rate of retreat during 1966 and 2007 was around 6.39 m/yr (Bali et al., 2013). Continuous field-based measurements between 2007 and 2010 suggested a variable retreat rate (Bali et al., 2013). It has been estimated that the Pindari glacier retreated by around 15 m/yr during 2007-08; around 32 m/yr during 2008-09 and around 70 m/yr during 2009-10.
We have used high/medium resolution remote sensing data to document the frontal changes of this glacier. The results obtained from the analysis of remote sensing data in the present study are in-sync with the field observation (as evident from the rate of retreat of the glacier between 2009 and 2010; see Fig. 4 (a) - (h) and Table-1). Both field investigation and remote sensing analysis demonstrated a significant recession of Pindari glacier during 2009-2010 (70 m/yr and 73 m/yr respectively; Bali et al., 2013). The present analysis of remote sensing data (1976 and 2017) revealed that the Pindari glacier has receded with an average rate of around 9 m/yr. This is in agreement with the in-situ measeurements of Bali et al. (2013). The assessment and correlation of the results suggest that the Pindari glacier has retreated at a rate of around 5 m/yr between 1976 and 1999, and is contrary to a rate of retreat of around 51.23 m/yr shown by Pandey et al. (2018) during the same time period. We attribute this to the misinterpretation of snout position inferred from satellite data by Pandey et al. (2018). The remote sensing based estimation of the rate of retreat of the Pindari glacier during 1999 and 2017 by Pandey et al. (2018) is ten folds higher than the actual rate of retreat. Further, between 1999 and 2017 the glacier receded at a rate of around 14 m/yr, but Pandey et al. (2018) have reported a rate of around 26 m/yr between 1999 and 2014. Review of the previous works, field-observations, and present investigation (in-situ and remote sensing data) suggest that retreat of the Pindari glacier between 1976 and 2017 was around 9 m/yr and is contrary to the estimates of around 41 m/yr during the same period by Pandey et al. (2018).
It is clear from the snout position of 1980 that Pandey et al. (2018) have not reviewed the earlier published data and the snout position seems to be inaccurately marked (please see Bali et al., 2013). Their results, show the position of Pindari glacier snout far (downstream) from the medial moraine (Figs. 1 and 2) during 1958, however, a clear examination of the data (Tewari and Jangpangi, 1966; Bali et al., 2013; Raczkowska and Joshi, 2016) reveals that during 1958 the Pindari and the adjoining Chhanguch glaciers coalesced downhill and formed a single snout. While during 1966, the two glaciers (Pinadri and Chhanguch) have receded in their respective valleys and the snout of Pindari glacier was well above the frontal base of the medial moraine (Fig. 2). Futher, Pandey et al. (2018) have marked the snout position of 1976 near the snout marked for 1906 on the basis of field evidence/palne table survey (Tewari and Jangpangi, 1966). it has to be mentioned that the delineation of glacier boundaries in remote sensing data is based on the strong spectral differences in the reflectance of snow, ice, and debris in the visible and near-infrared bands (VNIR) in comparison to the shortwave infrared band (SWIR) (Dozier, 1989). Snow and ice have a very high reflectance in the VNIR, whereas a very high absorption in SWIR. The mapping of glacier area from the satellite images require conventional band combinations. The band combination of 5, 4, 3 and 4, 3, 2 for Landsat ETM+ and OLI have been found to give better results for glacier delineation. This is because of the contrasting spectral characteristics of the snow, ice, and debris in VNIR and SWIR. The example of the effect of proper band combination in the glacier delineation is shown in Fig. 5.

Estimation of the frontal retreat rate of the Pindari glacier, Central Himalaya using remote sensing technique: Ali et al.
153
Fig. 4: Figure compilation showing the demarcated snout position viz. a) The Snout position of Pindari glacier in 1976, (b) The Snout position of Pindari glacier in 1989, (c) The Snout position of Pindari glacier in 1996, (d) The Snout position of Pindari glacier in 2002, (e) The Snout position of Pindari glacier in 2009, (f) The Snout position of Pindari glacier in 2010, (g) The Snout position of Pindari glacier in 2013 and (h) The Snout position of Pindari glacier in 2017.
Fig. 5: Image showing a suitable band combination that significantly enhances the
identification of features on imagery and hence accurate delineation; a) Proper combination of viz. band combinations 5 4 3 for Landsat OLI; b) band combinations 1 2 3 for the same image and area (inappropriate).
Estimation of the frontal retreat rate of the Pindari glacier, Central Himalaya using remote sensing technique: Ali et al.
154
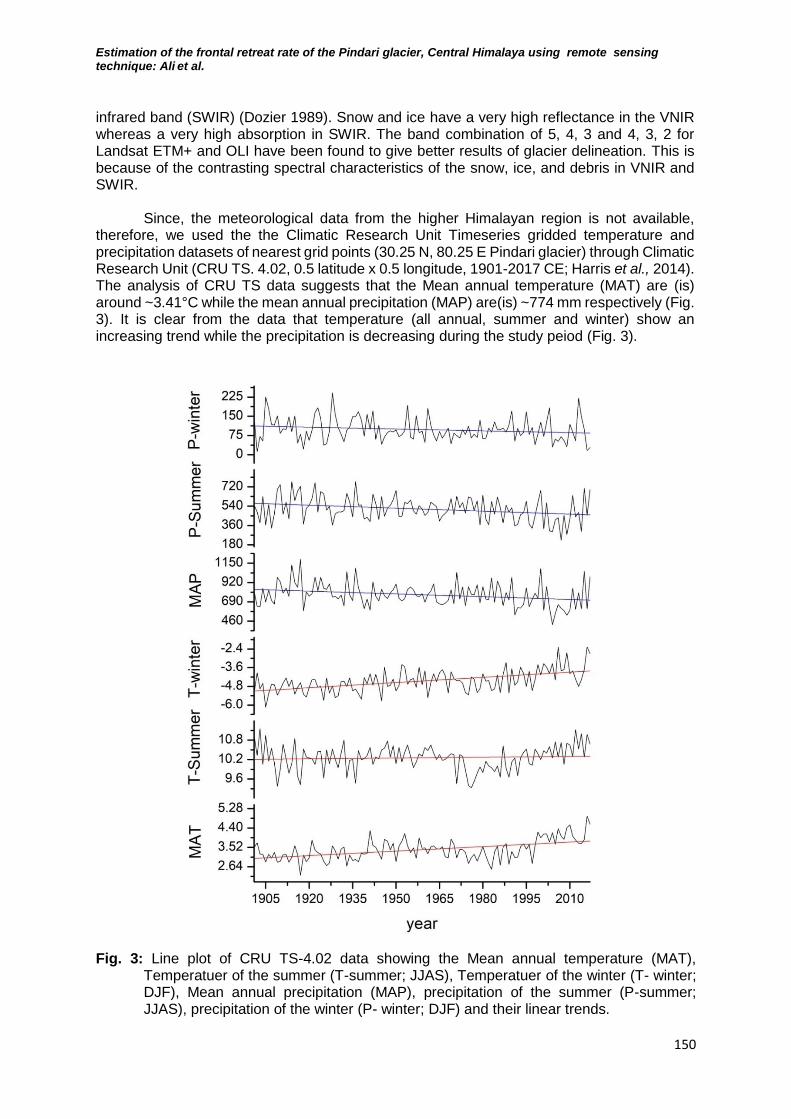
It is observed that majority of Himalayan glaciers are shrinking (retreating) and is consistent with atmospheric warming and decreasing precipitation (Kulkarni et al., 2007; Bolch et al., 2012; Azam et al., 2018). This progressively increasing temperature trend has been implicated for the accelerated melting of glaciers elsewhere (King et al., 2018; Wang et al., 2017; Xiang et al., 2018). The contemporary observations of the Pindari glacier, Central Himalaya also demonstrate glacier sensitivity to the ongoing climate warming (Fig. 6).
Fig, 6. A cross plot of average annual glacier retreat (grey bars) vis-a-vis mean annual
temperature (red line).
From both in-situ and remote sensing data, it is obvious that the Pindari glacier is retreating; however, the rate of retreat has been variable. Nevertheless, the glacier shows a continuous melting and the increase in temperature and decrease in snowfall seen under global climate change is implicated. As per the Intergovernmental Panel on Climate Change (IPCC, 2014), the “warming of the climate system is unequivocal, and since 1950, many of the observed changes are unprecedented over decades to millennia”. This has resulted into the warming of oceans and significantly diminished the snow and ice (glaciers). The situation is furthering worrisome, because the rate of mean annual maximum temperature in the Himalayas has shown a two-fold increase than the outer Himalayan belt and is more than the global averages (Shrestha et al., 1999). The winter temperatures are further disturbing as there is a general agreement on increased winter warming.
CONCLUSION
It is evident from the field as well as remote sensing data observations that the rate of recession/melting during the last five decades has increased. However, the rate is not as high as mentioned in the earlier remote sensing based study by Pandey et al. (2018). We suggest that the glacier melting data has manifold impacts on scientific as well social levels and has a high relevance to climate change, glacial hazards, and other socio-economic aspects. Therefore, researchers must be careful during their studies to have cross checks on the data many times so that one can provide a clear and accurate information to the society, the scientific community and the policy-makers. Acknowledgments: SNA and PP are thankful to the Directors of Birbal Sahni Institute of Palaeosciences, Lucknow, and Indian Institute of Remote Sensing, Dehradun, India respectively, for their support and providing infrastructural facilities.
2
2.5
3
3.5
4
4.5
5
0
10
20
30
40
50
60
70
80
19
01
19
08
19
15
19
22
19
29
19
36
19
43
19
50
19
57
19
64
19
71
19
78
19
85
19
92
19
99
20
06
20
13
MA
T (
°C)
Avg
. re
cessio
n p
er
ann
um
(m
)
Year
Avg. recessionper annum (m)

Estimation of the frontal retreat rate of the Pindari glacier, Central Himalaya using remote sensing technique: Ali et al.
155
REFERENCES Azam, M.F., Wagnon, P., Berthier, E., Vincent, C., Fujita, K. and Kargel, J.S. (2018) Review of the
status and mass changes of Himalayan-Karakoram glaciers. Journal of Glaciology, v. 64(243), pp. 61–74.
Bajracharya, S.R. and Mool, P.K. (2009) Glaciers, glacial lakes and glacial lake outburst floods in the Mount Everest region, Nepal. Annals of Glaciology, v. 50 (53), pp. 81–86.
Bajracharya, S.R., Maharjan, S.B., Shrestha, F., Guo, W., Liu, S., Immerzeel, W. and Shrestha, B. (2015) The glaciers of the Hindu Kush Himalayas: Current status and observed changes from the 1980s to 2010. International Journal of Water Resource Development, v. 31, pp. 161–173.
Bali, R., Ali, S.N., Agarwal, K.K., Rastogi, S.K., Krishna, K. and Srivastava, P. (2013) Chronology of Late Quaternary Glaciation in the Pindar Valley, Alaknanda Basin, Central Himalaya (India). Journal of Asian Earth Sciences, v. 66, pp. 224–233.
Bellwood, P. (2013) First migrants: Ancient migration in global perspective. Chichester and Malden, MA: Wiley Blackwell, 299 p.
Bhambri, R., Misra, A., Kumar, A., Gupta, A.K., Verma, A. and Tiwari, S.K. (2018) Glacier Lake inventory of Himachal Pradesh. Himalayan Geology, v. 39 (1), pp. 1–32.
Bolch, T., Kulkarni, A., Kaab, A., Huggel, C., Paul, F., Cogley, J.G., Frey, H., Kargel, J.S., Fujita, K., Scheel, M., Bajracharya, S. and Stoffel, M. (2012) The State and fate of Himalayan glaciers. Science, v. 336(6079), pp. 310–314.
Chand, M.B., Bhattarai, B.C., Baral, P. and Pradhananga, N.S. (2019) Trend analysis of temperature data for Narayani river basin, Nepal. Sci, v. 1, pp. 21.
Chaudhary, P. and Bawa, K.S. (2011) Local perceptions of climate change validated by scientific evidence in the Himalayas. Biology Letters, v. 7(5), pp.767-770.
Cotter, G. de P. and Brown, J. (1907) Notes on the glaciers in Kumaun. Records of the Geological Survey of India, v. 35, pp. 148–157.
Dozier, J. (1989) Spectral signature of Alpine snow cover from the Landsat Thematic Mapper. Remote sensing of Environment, v. 28, pp. 9–22.
Gruber, S., Fleiner, R., Guegan, E., Panday, P., Schmid, M.O., Stumm, D., Wester, P., Zhang, Y. and Zhao, L. (2017) Review article: Inferring permafrost and permafrost thaw in the mountains of the Hindu Kush Himalaya region. Cryosphere, v. 11, pp. 81–99.
Hamid, A., Sharif, M. and Archer, D. (2014) Analysis of temperature trends in Sutluj River Basin, India. Journal of Earth Science and Climatic Change, v. 5, pp. 222 DOI: 10.4172/2157-7617.1000222.
Harris, Jones, P.D., Osborn, T.J. and Lister, D.H. (2014) Updated high-resolution grids of monthly climatic observations – the CRU TS 3.10. Int. J. Climatol., v. 34, pp. 623-642.
Immerzeel, W. W., van Beek, L. P. H. and Bierkens, M. F. P. (2010) Climate change will affect the Asian water towers. Science, v. 328, pp. 1382–1385.
IPCC (2007) Climate Change 2007, Synthesis Report. Contribution of Working Groups I, II and III to the Fourth Assessment Report of the Intergovernmental Panel on Climate Change (Core writing team, R.K. Pachauri and A. Reisinger (eds.). IPCC, Geneva, Switzerland, 104 p.
IPCC Climate Change (2014) Synthesis Report. Contribution of Working Groups I, II and III to the Fifth Assessment Report of the Intergovernmental Panel on Climate Change; Technical Report; IPCC: Geneva, Switzerland, 151 p.
Justice, C.O., Belward, A., Morisette, J., Lewis, P. and Baret, F. (2000) Developments in the ‘validation’ of satellite sensor products for the study of the land surface. Int. J. Remote Sens., v. 21, pp. 3382–3390.
Kargel, J.S., Armstrong, R., Arnaud, Y., Bajracharya, S., Berthier, E., Bishop, M.P., Bolch, T., Bush, A., Cogley, G., Fujita, K., Furfaro, R., Gillespie, A., Haritashya, U., Kaser, G., Singh Khalsa, S.J., Leonard, G., Molnia, B., Racoviteanu, A., Raup, B., Shrestha, B., Shroder, J and Van der Veen, C. (2010) Satellite-era glacier changes in High Asia. Accessed on 23 April at 2012 http://web.hwr.arizona.edu/~gleonard/2009Dec-FallAGU-Soot-PressConference-Backgrounder-Kargel.pdf
Kaser, G., Cogley, J. G., Dyurgerov, M. B., Meier, M. F. and Ohmura, A. (2006) Mass balance of glaciers and ice caps, consensus estimates for 1961-2004. Geophy. Res. Lett., v. 33(19), pp. 1–5.
Kaser, G., Grosshauser, M. and Marzeion, B. (2010) Contribution potential of glaciers to water availability in different climate regimes. Proceedings of the National Academy of Sciences of the United States., v. 107(47), pp. 20223–20227.

Estimation of the frontal retreat rate of the Pindari glacier, Central Himalaya using remote sensing technique: Ali et al.
156
Khanal, N.R., Hu, J.M. and Mool, P. (2015) Glacial lake outburst flood risk in the poiqu/bhote koshi/sun koshi river basin in the central Himalayas. Mountain Research and Development, v. 35, pp. 351–364.
King, O., Dehecq, A., Quincey, D. and Carrivick, J. (2018) Contrasting geometric and dynamic evolution of lake and land-terminating glaciers in the central Himalaya. Global and Planetary Change, v. 167, pp. 46–60.
König, M., Winther, J.G. and Isaksson, E. (2001) Measuring snow and glacier ice properties from satellite. Reviews of Geophysics, v. 39(1), pp. 1–27.
Kulkarni, A.V., Bahuguna, I.M., Rathore, B.P., Singh, S.K., Randhawa, S.S., Sood, R.K. and Dhar, S. (2007) Glacial retreat in Himalaya using Indian Remote Sensing Satellite data. Current Science, v. 92(1), pp. 69–74.
Lama, L., Kayastha, R.B., Maharjan, S.B., Bajracharya, S.R., Chand, M.B. and Mool, P.K. (2015) Glacier area and volume changes of Hidden Valley, Mustang, Nepal from ˜1980s to 2010 based on remote sensing. Proc. IAHS, v. 368, pp. 57–62.
Marco, C.A. and Larkin, G.L. (2000) Research ethics, ethical issues of data reporting and the quest for authenticity. Acad. Emerg. Med., v. 7(6), pp. 691–694.
Myers, N., Mittermeier, R. A., Mittermeier, C. G., da-Fonseca, G. A. B. and Kent, J. (2000) Biodiversity hotspots for conservation priorities. Nature, v. 40, pp. 853–858.
Nie, Y., Liu, Q. and Liu, S. (2013) Glacial lake expansion in the central Himalayas by Landsat images, 1990–2010. PLoS ONE, v. 8, e83973.
Pandey, A., Mriganka, S.S., Kumar, M., Singh, G., Lingwal, S. and Rawat, J.S. (2018) Retreat of Pindari Glacier and detection of snout position Using Remote Sensing Technology. Remote Sensing Applications: Society and Environment. v. 11, pp. 4–69.
Rączkowska, Z. and Joshi, R. (2016) Deglaciation and impact of extreme rainfalls on recent relief transformation of the upper Pindari Valley, the Kumaun Himalaya, India. In: R. B. Singh and P. Prokop (e ds.). Environmental geography of South Asia. Contributions toward a future Earth initiative, Advances in Geographical and Environmental Sciences, Springer Japan, Tokyo, 67–82.
Riaz, S., Ali, A. and Baig. M.N. (2014) Increasing risk of glacial lake outburst floods as a consequence of climate change in the Himalayan region, Jàmbá. Journal of Disaster Risk Studies, v. 6, pp. 1–7.
Safari, B. (2012) Trend analysis of the Mean Annual Temperature in Rwanda during the last fifty two years. Journal of Environmental Protection, v. 3(6), pp. 538–551.
Scherler, D., Bookhagen, B. and Strecker, M.R. (2011) Spatially variable response of Himalayan glaciers to climate change affected by debris cover. Nature Geoscience, v. 4(3), pp. 156.
Sharma, E., Chettri, N., Tse-ring, K., Shrestha, A. B., Jing, F., Mool, P. and Eriksson, M. (2009) Climate change impacts and vulnerability in the Eastern Himalayas, ICIMOD, Kathmandu.
Shrestha, A.B., Wake, C.P., Mayewski, P.A. and Dibb, J.E. (1999) Maximum temperature trends in the Himalaya and its vicinity: an analysis based on temperature records from Nepal for the period 1971–94. Journal of Climatology, v. 12(9), pp. 2775–2786.
Singh, R., Shekhar, M., Pandey, V.K., Kumar, R. and Sharma, R.K. (2018) Causes and geomorphological effects of large debris flows in the lower valley areas of the Meru and Gangotri glaciers, Bhagirathi basin, Garhwal Himalaya (India). Remote Sensing Letters, v. 9(8), pp. 809–818.
Strachy, R. (1847) A description of the glaciers of the Pindur and Kaphnee Rivers in the Kumaun Himalaya. J. Asiatic Soc. Bengal, v. 16, pt. 2, pp. 794-812.
Tewari, A.P. (1973) Recent changes in the snout of Pindari glacier, Kumaun Himalayas, Almora Distt., UP, India. The role of snow and ice in hydrology. In: Proc. Banff Symp., September 1972, II UNESCO-WMO-IAHS, pp. 1144–1149.
Tewari, A.P. and Jangpangi, B.S. (1958) Glaciological study of Pindari and Kaphni glaciers in Almora district, UP. Rep. Geol. Sur. India.
Tewari, A.P. and Jangpangi, B.S. (1966) Recent changes in the position of the snout of the Pindari Glacier (Kumaon Himalaya), Almora District, UP., India. GSI, pp. 1144–1149.
Vedwan, N. and Rhoades, R. E. (2001) Climate change in the Western Himalayas of India: a study of local perception and response. Climate Research, v. 19, pp. 109–117.
Wang, X., Chai, K., Liu, S., Wei, J., Jiang, Z. and Liu, Q. (2017) Changes of glaciers and glacial lakes implying corridor-barrier effects and climate change in the Hengduan Shan, southeastern Tibetan Plateau. Journal of Glaciology, v. 63(239), pp. 535– 542.

Estimation of the frontal retreat rate of the Pindari glacier, Central Himalaya using remote sensing technique: Ali et al.
157
Xiang, Y., Yao, T., Gao, Y., Zhang, G., Wang, W. and Tian, L. (2018) Retreat rates of debris-covered and debris-free glaciers in the Koshi River Basin, central Himalayas, from 1975 to 2010. Environmental Earth Sciences, v. 77(7), pp.285.
Wang, S., Li, X., Ge, Y., Jin, R., Ma, M., Liu, Q., Wen, J. and Liu, S. (2016) Validation of regional-scale remote sensing products in China: From site to network. Remote Sensing, v. 8(12), pp.980.
Yang, X., Zhang, T., Qin, D., Kang, S. and Qin, X. (2011) Characteristics and Changes in Air Temperature and Glacier’s Response on the North Slope of Mt. Qomolangma (Mt. Everest). Arctic, Antarctic, and Alpine Research, v. 43, pp. 147–160.
Yao, X., Liu, S., Sun, M., Wei, J. and Guo, W. (2012) Volume calculation and analysis of the changes in moraine-dammed lakes in the north Himalaya: a case study of Longbasaba lake. Journal of Glaciology, v. 58 (210), pp. 753-760.
Zhang, R.H., Tian, J., Li, Z.L., Su, H.B., Chen, S.H. and Tang, X. Z. (2010) Principles and methods for the validation of quantitative remote sensing products. Science China Earth Sciences, v. 53, pp. 741–751.
(Submitted: 02.11.2018; Accepted: 09.05.2019)