Estimation of specific growth rate from agitation speed in DO-stat culture
6
BIOTECHNOLOGY TECHNIQUES Volume 10 No.5 (May 1996) p.303-308 Received as revised 1st March. ESTIMATION OF SPECIFIC GROWTH RATE FROM AGITATION SPEED IN DO-STAT CULTURE Tae Ho Lee, Yong Keun Chang*, and Bong Hyun Chung2 Department of Chemical Engineering and BioProcess Engineering Research Center, Korea Advanced Institute of Science and Technology, Taejon, 305-70 1, Korea ’ Korea Research Institute of Biotechnology and Bioengineering, Taejon, 305-600, Korea SUMMARY A simple and effective method to estimate the specific growth rate estimation has been developed based on the observation of time changes in the agitation speed in dissolved oxygen@O)-stat cultures of Brevibacreriutn kefoglutamicutn. The estimation was compared with that using carbon dioxide evolution rate (CER). Estimated values of specific growth rates by both methods agreed well with the data directly calculated from cell concentration change although the use of agitation speed gave a slightly better result than CER. INTRQDUCTION In many reports, the control of specific growth rate was investigated as a tool for the high cell density culture when cell growth and production were inhibited by byproducts which were formed due to overgrowth. It was very important, therefore, to maintain the specific growth rate under a threshold value for high density culture of Escherichia coli (Riesenberg et al., 1990; Riesenberg et al., 1991; Paalme et al., 1990). There were several reports on the control of specific growth rate in fed-batch cultures of yeast (Wu et al., 1985; Shimizu et al., 1989). Shimizu et al. optimized the production of glutathion by controlling the specific growth rate of yeast in a fed-batch culture (Shimizu et al., 1991). For the control of specific growth rate, on-line method of the specific growth rate is essential for determining feed rate with no time delay. There were several successful efforts to estimate specific growth rate from the time changes of certain process variables such as oxygen uptake rate (OUR) or CER in batch and/or fed-batch cultures (Konstantinov et al, 1990; Royce, 1992; Lee et al., 1992 ). Those gas data, OUR and CER are easy to measure on-line. However, it requires an expensive analytical device such as a mass spectrometer or requires frequent on-line calibrations of the equipments when, for example, a paramagnetic analyzer and an infrared (IR) spectrometer are used for OUR and CER, respectively. Therefore, we thought it would be useful to develop a simple and cost effective method for the estimation 303
-
Upload
tae-ho-lee -
Category
Documents
-
view
213 -
download
1
Transcript of Estimation of specific growth rate from agitation speed in DO-stat culture

BIOTECHNOLOGY TECHNIQUES Volume 10 No.5 (May 1996) p.303-308 Received as revised 1st March.
ESTIMATION OF SPECIFIC GROWTH RATE FROM
AGITATION SPEED IN DO-STAT CULTURE
Tae Ho Lee, Yong Keun Chang*, and Bong Hyun Chung2
Department of Chemical Engineering and BioProcess Engineering Research Center, Korea Advanced Institute of Science and Technology, Taejon, 305-70 1, Korea
’ Korea Research Institute of Biotechnology and Bioengineering, Taejon, 305-600, Korea
SUMMARY
A simple and effective method to estimate the specific growth rate estimation has been developed based on the observation of time changes in the agitation speed in dissolved oxygen@O)-stat cultures of Brevibacreriutn kefoglutamicutn. The estimation was compared with that using carbon dioxide evolution rate (CER). Estimated values of specific growth rates by both methods agreed well with the data directly calculated from cell concentration change although the use of agitation speed gave a slightly better result than CER.
INTRQDUCTION
In many reports, the control of specific growth rate was investigated as a tool for the high cell density
culture when cell growth and production were inhibited by byproducts which were formed due to
overgrowth. It was very important, therefore, to maintain the specific growth rate under a threshold value
for high density culture of Escherichia coli (Riesenberg et al., 1990; Riesenberg et al., 1991; Paalme et
al., 1990). There were several reports on the control of specific growth rate in fed-batch cultures of yeast
(Wu et al., 1985; Shimizu et al., 1989). Shimizu et al. optimized the production of glutathion by
controlling the specific growth rate of yeast in a fed-batch culture (Shimizu et al., 1991). For the control
of specific growth rate, on-line method of the specific growth rate is essential for determining feed rate
with no time delay. There were several successful efforts to estimate specific growth rate from the time
changes of certain process variables such as oxygen uptake rate (OUR) or CER in batch and/or fed-batch
cultures (Konstantinov et al, 1990; Royce, 1992; Lee et al., 1992 ). Those gas data, OUR and CER are
easy to measure on-line. However, it requires an expensive analytical device such as a mass
spectrometer or requires frequent on-line calibrations of the equipments when, for example, a
paramagnetic analyzer and an infrared (IR) spectrometer are used for OUR and CER, respectively.
Therefore, we thought it would be useful to develop a simple and cost effective method for the estimation
303

of specific growth rate from the time change of some other process variables which are easier to measure
than gas data.
ht this study, the behavior of agitation speed (RPM), a manipulated variable in the DO-stat batch
culture of B. ketoghrtnmicum, an omithine producer, was observed. The estimation of specilic growth
rate, from the relationships between oxygen uptake and cell growth, and the relationship between OUR
and RPM, was investigated. For the purpose of comparison, the estimation of specific growth from CER
which was used in the previous reports (Konstantinov et al, 1990; Paahue et al., 1990; Lee ef nl., 1992)
was carried out also.
MATERIALS AND METHODS
Strain The microorganism used in this study was BrevibacterizNn ketoglutamicum 1047, a L-citrulline
auxotrophic mutant. Stock culture was stored in glycerol solution at - 4°C.
Figure 1. Bioreactor system 1. Mass spectrometer 3. pH electrode 5. D/A converter 7. A/D converter
2. DO electrode 4. N&OH solution tank 6. Personal computer
Culture Medium and Conditions The seed culture medium was a YPD medium (glucose 2Og/L, yeast extract 10 g/L, peptone 10 g/L; pH
7.0). The seed was cultured in a 250 ml shake-flask for 12 hours. Fermentation was carried out in a computerized fermentor system (Bio Stat E, B.Braun Biotechnology) with 2.5 L culture volume (Fig. 1). The composition of femientation medium was as follows ; glucose, 100 g/L ; yeast extract, lOg& ; (NH.JSOd, 20 g/L; KHzPO+ 0.75 g/L; NazHPOd, 1.5 g/L; MgSOi7Hz0, 1.0 g/L ; MnS044H20, 0.05 g/L; and trace elements. The trace elements solution contains per liter; FeS047Hz0, 10 g/L;
304
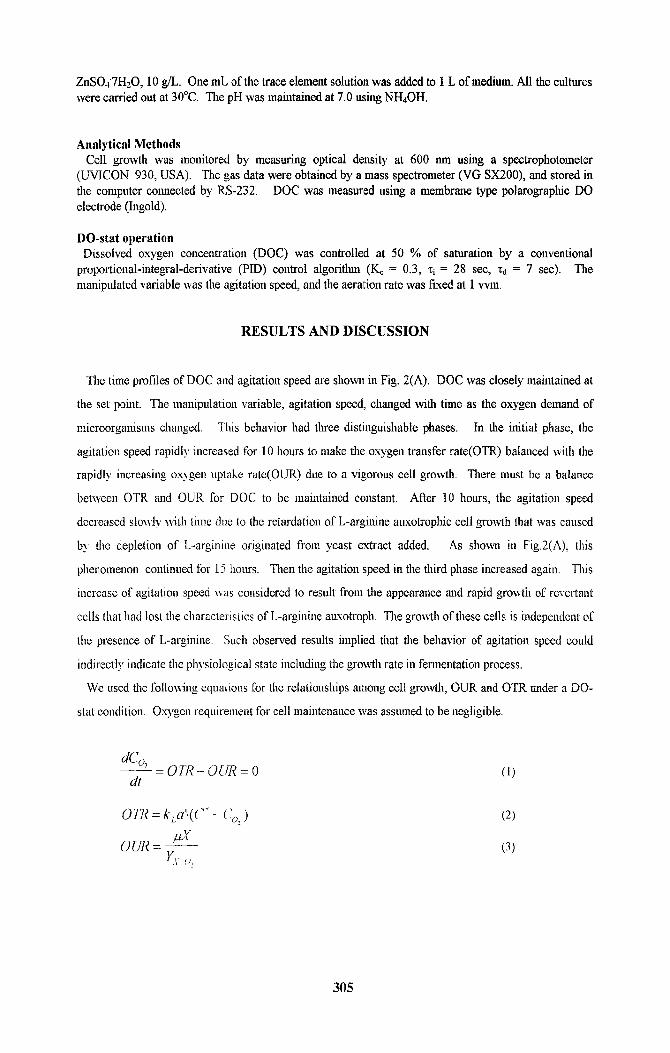
ZnS04’7Hz0, 10 g/L. One mL of the trace element solution was added to 1 L of medium. All the cultures were carried out at 30°C. The pH was maintained at 7.0 using NHdOH.
Analytictll Methods Cell growtll was monitored by measuring optical density at 600 mn using a spectropl1otometer
(UVICON 930, USA). The gas data were obtained by a mass spectrometer (VG SX200), and stored in the conlputer coimected by RS-232. DOC was measured using a nlembrane type polarographic DO electrode (Ingold).
DO-stat operation Dissolved oxygen concentration (DOC) was controlled at 50 % of saturatio11 by a conventional
proportional-integral-derivative (PID) control algorithm (& = 0.3, ti = 28 set, z,j = 7 set). The manipulated variable was tl1e agitation speed, and the aeratio11 rate was fixed at 1 wm.
RESULTS AND DISCUSSION
The time profiles of DOC and agitation speed are shown in Fig. 2(A). DOC was closely maintained at
the set point. The nlanipulation variable, agitation speed, changed with time as the oxygen demand of
n1icroorganisn1s cl1anged. TlUs behavior had three distinguishable phases. In the iuitial phase, the
agitation speed rapidly increased for 10 hours to n1ake the osygen transfer rate(OTR) balanced wit11 the
rapidly increasing osygen uptake rate(OUR) due to a vigorous cell growth. There n1ust be a balanee
between OTR and OUR for DOC to be maintained constant. After 10 hours, the agitation speed
decreased slowly with time due to the retardation of L-arginine auxotrophic cell growth that was caused
by- the depletion of L-arginiue originated from yeast extract added. As shown in Fig,2(A), this
phenomenon continued for 15 hours. Then the agitation speed in the third phase increased again. This
increase of agitation speed was considered to result fro111 the appearance and rapid growth of rerertant
cells tlrat had lost the characteristics of L-arginine ausotroph. The growth of tl1ese cells is independent of
I-lie presence of L-arginine. Such observed results implied that the bekavior of agitation speed could
indirectly indicate the physiological state including tl1e growtl1 rate in fen11entation process.
WC used tl1e following equations for the relationships among cell growth, OUR and OTR m1der a DO-
stat condition. Oxygen require111ent for cell n1aintenance was assun1ed to be negligible.
(1)
(2)
(3)
305

The term, (C* - Cr,? ) in Eq. (2) could be considered as a coustant, since co, was ma&a&d close to
C,, the set point. The mass transfer coefficient (kLa’) has been reported as a linear function of the
agitation speed in many studies (Gauthier et al., 1991). For these reasons, OTR was assumed to be a
linear function of agitation speed in our study (Eq. (4)).
OTR=y.RPM (4)
From Eq. (l), (3), and (4), Eq. (5) was derived.
By integration with an assumption that YXQ~ was constant, we obtained
(5)
(6)
An expression for the specific growth rate at certain time in terms of the agitation speed could be
obtained by division oFEq. (5) by Eq. (6).
(7)
The time course of CER is shown in Fig. 2 (B). An expression for the estimation of specific growth
rate from CER conld be obtained by a similar procedure for Eq. (7).
CER /I= [
CER( k)
j-o(cE@dt = i CER(k) . At k=@
(8)
The specific growth rates estimated from RPM and CER are shown in Fig. 2 (C). The results in both
cases agreed well with the experimental data although the use of RPM gave a slightly better result lhan
CER. The experimental data of specific growth rate were obtained by numerical differentiation of cell
concelitration data.
306
In conclusion, the proposed method of using the agitation speed can be a simple and effective method for
the estimation of the specific growth rate. However, we should note that this approach has some limitations
since we have assumed that the cell maintenance is negligible and the yield coefficient is constant.
Al
NOMENCLATURE
: Carbon dioxide evolution rate (mmol/sec) : Oxygen uptake rate (mmolkec) : Oxygen transfer rate (mmollsec) : Agitation speed (rev.&$ : Saturated dissolved oxygen concentration (mmol/L) : Dissolved oxygen concentration (mmol/L)
: Time indes : Mass transfer coefficient (set-‘) : Cellular yield based on oxygen consumed (g-cellirmnol 0,) : Specific growth rate (hr.‘) : Constant : Fermentation time : Sampling time for RPM and CER measurements
REFERENCE
Cardello, R. J. and San, K. Y. (19SS). Biofechol. Bioeng.l 32, 519-526.
Gautbier, L., Thibault. J., and LeDq,, A. (199 I). Biotechol. Bioeng., 37, 889-893.
Konstantinov, K.: Kishimoto, M.. Seki, T., and Yoshida, T. (1990). Biotechnol. Bioerzg., 36, 750-758.
Lee. S. C., Kim, C. G., Chang, 1’. K., and Chang, H. N. (1992). Pmt. ICCAFTMFACBIOZ, Keystone Colorado? March 29.
Riesenberg, D, Menzel, K., Schulz, V., Schulmam~, K., Veith, G., Zuber, G., and Knorre, W. A. (1990). Appl. Microbial. Biotechnol.~ 31. 77-82.
Riescoberg, D, Schulz, V., Knorre W. A., Pohi. H. D., Korz, D., Sanders, E.A., Ross, A., and Deckwer. W. D.(1991).J. Biurechol., 20, 17-25.
Royce P. N (1992). BioiechoL Bioeng., 40, 1129-I 138.
Paalme, T., Tiisma, I(.> Kahru. A., Vanatnlu, K. and Vilu R. (1990). Biorechnol. Bioeng.: 353 12-3 19
Shimizu, H., Shioyai S., Saga, K. I.. and Takamatsu, T. (1989). &pi. Microbial. Ri0fech~701.. 30, 276-252.
Shim& H.: Arakik. H., S., Shio!,a, S., and Uage, K. (1991). Biok&w/. Bioe~7g.. 38. 196-205
Wu, W. T., Chent K. -L.. and Chion. H. -W. (1985). B~otcchnol Rioer7g., 27. 756-760
307

0.25
0.20
0.15
0.10
0.05
0.00
1.0
0.8
0.6
0.4
0.2
0.0
0 5 IO 15 20 25 30 35 40 45
Time (h)
DO-stat culture oiL3. ~efog~~rtu~~ricz~~~z.
(A) Profiles of agitation speed and dissolved oxygen concentration in DO-stat cull
(B) Profile of carbon dioxide evolution rate
(C) Comparison of specific growth rates estimated from (a) agitation speed
carbon dioxide evolution rate with esperimenlal data ( l )
we
and (b)
308