Estimation of Secondary PM in China and the United States ...
36
1/36 Estimation of Secondary PM2.5 in China and the United States using a Multi-Tracer Approach Haoran Zhang 1 , Nan Li 1, * , Keqin Tang 1 , Hong Liao 1, * , Chong Shi 2, 3 , Cheng Huang 4 , Hongli Wang 4 , Song Guo 5 , Min Hu 5 , Xinlei Ge 1 , Mindong Chen 1 , Zhenxin Liu 1 , Huan Yu 6 , Jianlin Hu 1 5 1 Jiangsu Key Laboratory of Atmospheric Environment Monitoring and Pollution Control, Jiangsu Collaborative Innovation Center of Atmospheric Environment and Equipment Technology, School of Environmental Science and Engineering, Nanjing University of Information Science & Technology, Nanjing, 210044, China 10 2 National Institute for Environmental Studies,Center for Global Environmental Research, Tsukuba,Ibaraki,Japan 3 Institute of Remote Sensing and Digital Earth, Chinese Academy of Sciences, Beijing, 100094, China 4 State Environmental Protection Key Laboratory of Formation and Prevention of the Urban 15 Air Pollution Complex, Shanghai Academy of Environmental Sciences, Shanghai, 200233, China 5 College of Environmental Sciences and Engineering, Peking University, Beijing, 100871, China 6 Department of Atmospheric Science, School of Environmental Studies, China University of 20 Geosciences, Wuhan, 430074, China * Correspondence to: Nan Li, [email protected] and Hong Liao, [email protected] 25 https://doi.org/10.5194/acp-2021-683 Preprint. Discussion started: 5 October 2021 c Author(s) 2021. CC BY 4.0 License.
Transcript of Estimation of Secondary PM in China and the United States ...

1/36
Estimation of Secondary PM2.5 in China and the United States
using a Multi-Tracer Approach
Haoran Zhang 1, Nan Li 1, *, Keqin Tang 1, Hong Liao 1, *, Chong Shi 2, 3, Cheng Huang 4,
Hongli Wang 4, Song Guo 5, Min Hu 5, Xinlei Ge 1, Mindong Chen 1, Zhenxin Liu 1,
Huan Yu 6, Jianlin Hu 1 5
1 Jiangsu Key Laboratory of Atmospheric Environment Monitoring and Pollution Control,
Jiangsu Collaborative Innovation Center of Atmospheric Environment and Equipment
Technology, School of Environmental Science and Engineering, Nanjing University of
Information Science & Technology, Nanjing, 210044, China 10
2 National Institute for Environmental Studies,Center for Global Environmental Research,
Tsukuba,Ibaraki,Japan
3 Institute of Remote Sensing and Digital Earth, Chinese Academy of Sciences, Beijing,
100094, China
4 State Environmental Protection Key Laboratory of Formation and Prevention of the Urban 15
Air Pollution Complex, Shanghai Academy of Environmental Sciences, Shanghai, 200233,
China
5 College of Environmental Sciences and Engineering, Peking University, Beijing, 100871,
China
6 Department of Atmospheric Science, School of Environmental Studies, China University of 20
Geosciences, Wuhan, 430074, China
* Correspondence to:
Nan Li, [email protected] and Hong Liao, [email protected]
25
https://doi.org/10.5194/acp-2021-683Preprint. Discussion started: 5 October 2021c© Author(s) 2021. CC BY 4.0 License.

2/36
Abstract:
PM2.5, generated via both direct emissions and secondary formations, can have varying
environmental impacts due to different physical and chemical properties of its components.
However, traditional methods to quantify different PM2.5 components are often based on
online observations or lab analyses, which are generally high economic cost and labor-5
intensive. In this study, we develop a new method, named multi-tracer estimation algorithm
(MTEA), to identify the primary and secondary components from routine observation of
PM2.5. By comparing with the long-term and short-term measurements of aerosol chemical
components in China, as well as aerosol composition network in the United States, MTEA is
proved to be able to successfully capture the magnitude and variation of the primary PM2.5 10
(PPM) and secondary PM2.5 (SPM). Applying MTEA to China national air quality network,
we find that 1) SPM accounts for 63.5% of PM2.5 in southern cities of China averaged for
2014-2018, while in the North the proportion drops to 57.1%, and at the same time the
secondary proportion in regional background regions is ~19% higher than that in populous
regions; 2) the summertime secondary PM2.5 proportion presents a slight but consistent 15
increasing trend (from 58.5% to 59.2%) in most populous cities, mainly because of the recent
increase in O3 pollution in China; 3) the secondary PM2.5 proportion in Beijing significantly
increases by 34% during the COVID-19 lockdown, which might be the main reason of the
observed unexpected PM pollution in this special period; and at least, 4) SPM and O3 show
similar positive correlations in the BTH and YRD regions, but the correlations between total 20
PM2.5 and O3 in these two regions are quite different as PPM levels determines. In general,
MTEA is a promising tool for efficiently estimating PPM and SPM, and has huge potential
for the future PM mitigation.
Keywords: PM2.5; Primary and secondary sources; Air quality; O3; COVID-19 25
https://doi.org/10.5194/acp-2021-683Preprint. Discussion started: 5 October 2021c© Author(s) 2021. CC BY 4.0 License.

3/36
1 Introduction
Fine particulate matter (PM2.5, aerodynamic diameter less than 2.5 μm) has been the
dominant air pollutant in China in the past several years (An et al., 2019; Song et al., 2017;
Yang et al., 2016). One source of PM2.5 is the direct emission from combustion of
fossil/biomass fuel, dust blowing and sea spray, forming primary organic aerosol (POA), 5
elemental carbon (EC), sea salt and mineral dust. The other source is the secondary formation
from gaseous precursors emitted by anthropogenic and biogenic activities (Zhu et al., 2018;
Wang et al., 2019), generating secondary organic aerosol (SOA) and secondary inorganic
aerosol (SIA, sulfate, nitrate and ammonium).
The primary and secondary components of PM2.5 have different environmental impacts 10
on air quality, human health and climate change. For example, as a typical primary PM2.5
(PPM), EC can severely reduce atmospheric visibility and greatly influence weather and
climate due to its strong absorption of solar radiation (Bond et al., 2013; IPCC, 2013; Mao et
al., 2017). Sulfate, a critical hygroscopic component of secondary PM2.5 (SPM), can be fast
formed under high relative humidity condition and further leads to grievous air pollutions 15
(Cheng et al., 2016; Guo et al., 2014; Quan et al., 2015). Furthermore, the sulfate and other
hygroscopic PM2.5 have considerable influences on climate change mostly by changing cloud
properties (Leng et al., 2013; von Schneidemesser et al., 2015). In addition, different PM2.5
components also have various deleterious impacts on human health for their toxicities (Hu et
al., 2017; Khan et al., 2016; Maji et al., 2018). 20
Many studies have been conducted on PM2.5 components, however, most of them are
individual and/or short-term (Guo et al., 2014; Huang et al., 2014b; Ge et al., 2017; Huang et
al., 2017; Tao et al., 2017; Ye et al., 2017; Dai et al., 2018; Liu et al., 2018b; Wu et al., 2018;
Yu et al., 2019; Zhang et al., 2019). Some studies employed the online aerosol mass
spectrometer (AMS) to analyze different PM2.5 compositions in Beijing and found that 25
secondary aerosol was the dominant fraction of PM2.5 mass concentration during polluted
periods (Guo et al., 2014; Quan et al., 2015). Based on offline filter measurements and further
laboratory analysis, Liu et al. (2018b) investigated the characteristics of PM2.5 components in
12 sites in China (6 urban sites and 6 background sites) for the period of 2012-2013. The
result pointed out that the mass concentrations of PPM and SPM and their relative 30
proportions were quite changeable in different regions and seasons. Nevertheless, both the
online and offline measurements require a high level of manpower and economic cost, and
for this reason, these methods are expensive and rarely applied in large-scale regions or long-
https://doi.org/10.5194/acp-2021-683Preprint. Discussion started: 5 October 2021c© Author(s) 2021. CC BY 4.0 License.

4/36
term periods.
In this study, we develop a new method, Multi-Tracer Estimation Algorithm (MTEA),
with the aim of distinguishing the primary and secondary compositions of PM2.5 from routine
observation of PM2.5 concentration. This algorithm and its application are tested in China and
the United States. In section 3, we evaluate the MTEA results comparing with three PM2.5 5
composition data sets, (1) short-term measurements in 16 cities in China from 2012 to 2016
reported by previous studies, (2) continuous long-term measurements in Beijing and
Shanghai from 2014 to 2018, and (3) IMPROVE network in the United States during 2014
and 2018. Subsequently, we investigate the spatio-temporal characteristics of PPM and SPM
concentrations in China in Section 4.1 and 4.2, explain the unexpected haze event in several 10
cities of China during the COVID-19 lockdown in Section 4.3 and discuss the complicated
correlation between PM and O3 in Section 4.4. This study is different from previous works as
follows: (1) we develop an efficient approach to explore PPM and SPM with low economy-
and technique-cost, (2) we apply this approach to observation data from the MEE network,
offering an unprecedented opportunity to quantify the PM2.5 components on a large space and 15
time scale.
2 Methodology
2.1 The Multi-Tracer Estimation Algorithm (MTEA)
In order to distinguish PPM and SPM efficiently from the observed PM2.5, we develop a 20
new approach, named Multi-Tracer Estimation Algorithm (MTEA). The multi-tracer (X) is
defined to represent multiple primary contributions to PM2.5, mainly resulting from
incomplete combustion of carbonaceous material and flying dust. We select the typical
combustion product CO as one tracer to represent the combustion process, and the particles in
coarse mode (PMC, i.e. PM10 minus PM2.5) as the other tracer to track flying dust. Then, we 25
combine the CO and PMC to generate the multi-tracer X (Eq. 1), which can represent hybrid
primary contributions to PM2.5.
X = 𝑎 ∗ CO + 𝑏 ∗ PMC (𝑎 + 𝑏 = 100%) (1)
As shown in Eq. 1, we use a and b to quantify the relative contributions of combustion
and dust process to PPM. The values of the coefficients depend on the ratio of emission 30
intensities of POA+EC (combustion products) and fine mode dust, as shown in Eq. 2.
https://doi.org/10.5194/acp-2021-683Preprint. Discussion started: 5 October 2021c© Author(s) 2021. CC BY 4.0 License.

5/36
𝑎
𝑏=
EOA+ EEC
Efinedust=
1.2EOC+ EEC
EPM2.5−(1.2EOC+ EEC+ESO4+ ENO3) (2)
where, EOA, EEC, Efinedust, EOC, EPM2.5, ESO4 and ENO3 represent the emissions of OA, EC, fine
mode dust, OC, PM2.5, sulfate and nitrate, respectively. We obtain anthropogenic PM2.5, EC
and OC emissions in China from Multi-resolution Emission Inventory for China (MEIC,
http://meicmodel.org/, last access: 1 August 2021) developed by Tsinghua University (Li et 5
al., 2017c). For United States, we retrieve the emission data from the global inventory HTAP
(https://edgar.jrc.ec.europa.eu/htap_v2/index.php?SECURE=123, last access: 1 August 2021).
We further estimate POA emission using POC emission multiply by an empirical factor of 1.2
recommended in literature (Seinfeld and Pandis, 2006), and quantify sulfate and nitrate
emissions using PM2.5 emission multiply by an investigative coefficient of 0.1 (Zhang 2019). 10
However, the 0.1 might be relatively higher compared to empirical coefficients used in
previous simulation studies (0.01-0.05). We evaluated the potential effect of the coefficient,
by conducting a set of comparative simulation with the coefficient of 0.03, and found that the
final estimated SPM was not sensitive to this coefficient (Table S1). The fine mode dust
emission is inferred by the emission of PM2.5 deducting the emissions of EC, POA, sulfate 15
and nitrate. Based on Eq. 2, we establish a dynamic “a-b value” database, which can reflect
the specific changes of PM2.5 sources in terms of different years, seasons, hours and different
regions.
With the help of the multi-tracer X, we can descript secondary PM2.5 as follows:
−2.5SPM = PM PPM (3) 20
− 2.5
PPM= PM X
X (4)
Here, PM2.5 is the observed PM2.5 concentration, and the multi-tracer X can be
calculated from the observed CO, PM2.5 and PM10 concentrations. The original
concentrations of CO, PM2.5 and PM10 are normalized for avoiding the influences of their
initial levels. To calculate SPM, the key step is to find out the target ratio of PPM/X. In the 25
MTEA method, we give the PPM/X ratio a reasonable range (a range from 0 to 400 is used in
this work) and then scan the ratio with an interval of 1. For more precise results, a smaller
scanning step can be applied while it may take larger calculation cost. As a result, each
varying ratio may obtain a series of SPM, along with a coefficient of determination (R2)
between SPM and X (Fig. S1). If we assume that PPM and SPM came from different sources 30
or processes, then the appropriate PPM/X ratio should be the one that corresponds to weak
https://doi.org/10.5194/acp-2021-683Preprint. Discussion started: 5 October 2021c© Author(s) 2021. CC BY 4.0 License.

6/36
correlation between SPM and X-tracer. To better understand principle of the MTEA approach,
we show the flow chart in Fig. 1. We also provide the MTEA software package and input data
sets at http://nuistairquality.com/m_tea (last access: 1 August 2021).
The MTEA approach makes some improvement based on the similar principle and
assumptions with the modified EC-tracer method developed by Hu et al. (2012). They 5
estimated primary and secondary organic carbon (POC and SOC) concentrations by adopting
a proper POC/EC ratio when SOC correlated with EC worst. However, this assumption may
be too hard to exist in the real atmosphere. Therefore in the MTEA approach, we take a range
of proper ratios of PPM/X when SPM correlates with X-tracer non-significantly (with p-value
greater than 0.05). As a result, the calculated SPM concentration for each case is a range 10
(Table S2). We employed the concentration ranges to represent the severity of secondary
pollution and discussed its uncertainties in the following discussions. While for quantitative
calculation, the mean values of the concentration ranges stand for the final estimation.
2.2 PM2.5 measurements 15
2.2.1 PM2.5 concentration measurements from the MEE network in China
Focus on the PM2.5 pollution in China, MEE set up a comprehensive air quality
monitoring network for consistently accessing hourly concentrations of PM2.5 as well as SO2,
NO2, CO, O3 and PM10 since 2013. This network is the most advanced monitoring network
currently in China. In this study, we obtained surface observations of hourly PM2.5, PM10, CO 20
and O3 at 334 national monitoring sites in 50 cities from 2014 to 2018 from the MEE public
website (http://106.37.208.233:20035/, last access: 1 August 2021). 31 among the 50 cities
are provincial capital cities, employed to represent populous cities, while the rest 19
relatively small cities are categorized as regional background cities (Table S3). Geographical
distribution of those populous and regional background cities is shown in Fig. 2a. 25
Recently, the Chinese government carried out a series of control policies, such as
elimination of backward industry, desulfurization and denitration of flue gas, as well as
restriction on motor vehicles (Tang et al., 2019; Wu et al., 2017). Consequently, the
concentrations of the major gaseous and particle pollutants have been decreased year by year
(Zhai et al., 2019; Shen et al., 2020) . Take PM2.5 as an example, previous studies revealed 30
that annual mean PM2.5 decreased by 30-50% across China during the period of 2013-2018.
https://doi.org/10.5194/acp-2021-683Preprint. Discussion started: 5 October 2021c© Author(s) 2021. CC BY 4.0 License.
7/36
2.2.2 PM2.5 composition measurements in China
Numerous studies focused on the aerosol chemical composition in China employed
offline filter-based observations coupled with laboratory analysis to obtain detailed
information of PM2.5 compositions. For directly comparing the estimated PPM/SPM with the
measured ones in China, we made an evaluation via two long-term time series in-situ 5
measurements in Beijing (Peking University, PKU) and Shanghai (Shanghai Academy of
Environment Sciences, SAES) during 2014-2018 (Huang et al., 2019; Tan et al., 2018). The
chemical compositions of measurements include ions (NH4+, Na+, K+ Mg2+, Ca2+, SO4
2-, NO3-,
Cl-, by ion chromatography), elements (Al, Si, Ti, Ca, Ti, Mn, etc., through X-ray
fluorescence spectrometry), and carbonaceous components (EC and organic carbon, using the 10
thermal-optical transmittance carbon analyzer). After accessing the chemical compositions,
we categorized them into PPM and SPM for further evaluation.
In addition, we conducted an investigation about observation-based PM2.5 component
analyses in 16 cities of China during 2012-2016 from 32 published studies. This survey
offered an opportunity for comparing the estimation by MTEA with the past measurements in 15
the terms of the secondary fraction of PM2.5.
2.2.3 PM2.5 composition measurements from IMPROVE network in the United States
The Interagency Monitoring of Protected Visual Environments (IMPROVE) aerosol
network has continuous records of PM10, PM2.5 and its chemical speciation in the United 20
States since 1987. The specific aerosol chemical compositions include ammonium sulfate,
ammonium nitrate, organic/elemental carbon and soil/mineral dust. More detailed
descriptions about IMPORVE are available at http://vista.cira.colostate.edu/Improve/ (last
access: 1 August 2021). Here we extracted the measurements at 104 valid sites in the United
States from 2014 to 2018 for the evaluation of MTEA. The spatial distribution of IMPROVE 25
sites used in this work is shown in Fig. 2b. It is noted that IMPROVE program only provides
single aerosol component profile every three days. We lowered the time resolution into the
monthly average for further evaluation. However, CO is excluded in IMPROVE program. We
therefore adopted the Kriging interpolation of CO data based on the hourly archives from the
United States EPA (https://www.epa.gov/outdoor-air-quality-data, last access: 1 August 2021) 30
as an alternative for model input when running the MTEA.
https://doi.org/10.5194/acp-2021-683Preprint. Discussion started: 5 October 2021c© Author(s) 2021. CC BY 4.0 License.
8/36
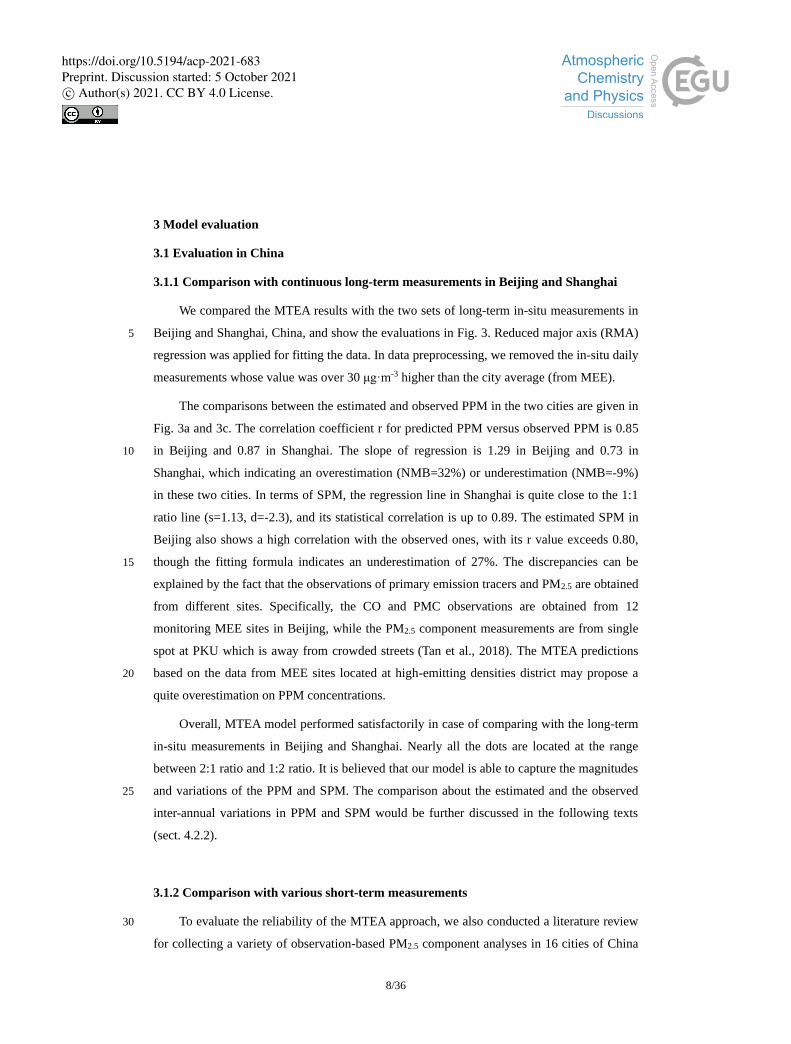
3 Model evaluation
3.1 Evaluation in China
3.1.1 Comparison with continuous long-term measurements in Beijing and Shanghai
We compared the MTEA results with the two sets of long-term in-situ measurements in
Beijing and Shanghai, China, and show the evaluations in Fig. 3. Reduced major axis (RMA) 5
regression was applied for fitting the data. In data preprocessing, we removed the in-situ daily
measurements whose value was over 30 μg·m-3 higher than the city average (from MEE).
The comparisons between the estimated and observed PPM in the two cities are given in
Fig. 3a and 3c. The correlation coefficient r for predicted PPM versus observed PPM is 0.85
in Beijing and 0.87 in Shanghai. The slope of regression is 1.29 in Beijing and 0.73 in 10
Shanghai, which indicating an overestimation (NMB=32%) or underestimation (NMB=-9%)
in these two cities. In terms of SPM, the regression line in Shanghai is quite close to the 1:1
ratio line (s=1.13, d=-2.3), and its statistical correlation is up to 0.89. The estimated SPM in
Beijing also shows a high correlation with the observed ones, with its r value exceeds 0.80,
though the fitting formula indicates an underestimation of 27%. The discrepancies can be 15
explained by the fact that the observations of primary emission tracers and PM2.5 are obtained
from different sites. Specifically, the CO and PMC observations are obtained from 12
monitoring MEE sites in Beijing, while the PM2.5 component measurements are from single
spot at PKU which is away from crowded streets (Tan et al., 2018). The MTEA predictions
based on the data from MEE sites located at high-emitting densities district may propose a 20
quite overestimation on PPM concentrations.
Overall, MTEA model performed satisfactorily in case of comparing with the long-term
in-situ measurements in Beijing and Shanghai. Nearly all the dots are located at the range
between 2:1 ratio and 1:2 ratio. It is believed that our model is able to capture the magnitudes
and variations of the PPM and SPM. The comparison about the estimated and the observed 25
inter-annual variations in PPM and SPM would be further discussed in the following texts
(sect. 4.2.2).
3.1.2 Comparison with various short-term measurements
To evaluate the reliability of the MTEA approach, we also conducted a literature review 30
for collecting a variety of observation-based PM2.5 component analyses in 16 cities of China
https://doi.org/10.5194/acp-2021-683Preprint. Discussion started: 5 October 2021c© Author(s) 2021. CC BY 4.0 License.

9/36
during 2012-2016 (Chen et al., 2016; Du et al., 2017; Cui et al., 2015; Dai et al., 2018; Gao et
al., 2018; Huang et al., 2014a; Huang et al., 2014b; Huang et al., 2017; Jiang et al., 2017; Li
et al., 2016; Li et al., 2017a; Lin et al., 2016; Liu et al., 2017; Liu et al., 2014; Liu et al.,
2018a; Liu et al., 2018b; Ming et al., 2017; Niu et al., 2016; Tan et al., 2016; Tang et al., 2017;
Tao et al., 2017; Tao et al., 2015; Tian et al., 2015; Wang et al., 2018; Wang et al., 2016a; 5
Wang et al., 2016b; Wu et al., 2016; Xu et al., 2019; Yu et al., 2019; Zhang et al., 2015;
Zhang et al., 2018; Zhao et al., 2015). Most field measurements focused on regions in eastern
China and on episodes during the winter. We listed the concentrations of observed PM2.5,
SO42-, NO3
-, NH4+, and SOA from these studies in Table S4. It should note that there may be
inconsistencies in the observation due to different sampling location, observational time and 10
analytical instruments in each study.
The estimated PPM and SPM from MTEA show a reasonable agreement with the
observation-based PM2.5 component analyses in China. The MTEA estimated secondary
proportions of PM2.5 (i.e. secondary PM2.5 / total PM2.5) vary in a range of 41% to 67%, and
are higher in eastern cities of China, consistent with the observational results. However, we 15
find that there are still a few discrepancies between the estimated and observation-based
results, and the main reasons might be (1) sea salts aerosol contributes a lot to the PM2.5 in
some coastal cities, but it is unable to be represented by the multi-tracer X, such as the case of
Haikou, (2) natural dust plays an important role in PM2.5 formation in some western cities,
however it cannot be accounted for by anthropogenic emission inventory, such as the case of 20
Lanzhou, and (3) the observation-based results are derived from too few samplers for some
cities, such as Lhasa.
3.2 Evaluation in the United States
Based on the chemical component measurements of IMPROVE network, we evaluated 25
the performance of the MTEA model in the United States. Figure 4 presents the scatter plots
of the evaluation results, with x-axis indicates the observed concentrations and the y-axis
indicates the estimated concentrations. The validation was done in the form of temporal,
spatial, as well as spatio-temporal. Each dot represents a monthly mean of either observed or
estimated PM concentration. 30
Almost all of the dots are located at the region between the 2:1 and 1:2 dotted line,
indicating that our model is capable of predicting the magnitudes of PPM/SPM in the United
https://doi.org/10.5194/acp-2021-683Preprint. Discussion started: 5 October 2021c© Author(s) 2021. CC BY 4.0 License.

10/36
States. Based on correlation analysis, we find that the correlation coefficient r for PPM ranges
from 0.69 (spatio-temporal validation) to 0.75 (temporal validation), while for SPM, the r is
even up to 0.98 (temporal validation). The results reveal that the MTEA approach
successfully captured the spatial and temporal variations of PPM and SPM in the United
States. 5
The majority of dots distribute around the 1:1 dotted line. Based on the fitting results,
the slopes for regression lines vary from 1.12 (spatial validation) to 1.15 (temporal validation)
for PPM and from 0.92 (temporal validation) to 0.93 (spatio-temporal validation) for SPM.
In general, PPM and SPM show a slight overestimation and underestimation respectively.
The discrepancies may result from the influences of emission inventory. It is reported that the 10
emissions of PMC and CO in the United States continuously declined over the past decade
(https://www.statista.com/statistics/501298/volume-of-particulate-matter-2-5-emissions-us/,
last access: 2 October 2021). Thus the coefficients a and b derived from HTAP global
emission inventory in 2010 overestimate the contribution of primary emissions during the
studying period. However, the impacts of emission are inevitable, and we will discuss the 15
uncertainty of emission inventory in Sect. 4.5. In addition, the intercepts of these regression
lines for both PPM and SPM are less than ±0.1 μg·m-3. The verification results strongly show
that our model can reasonably reproduce the monthly averaged concentration of PPM and
SPM in the United States.
20
4 Results and discussion
We used the MTEA approach and the MEE observation data to estimate PPM and SPM
concentrations in China for the period of 2014-2018. The observations during severe haze
events (top 10% CO and PMC polluted days) were excluded to avoid the influence of
extreme high primary emission cases. 25
4.1 Spatial distribution
Figure 5 shows spatial patterns of the MTEA estimated PPM and SPM concentrations
over China averaged for the period of 2014-2018. 16 populous cities and 9 regional
background cities in the north, and 15 populous cities and 10 regional background cities in 30
the south (North-South is separated by the Qinling-Huaihe line) are involved in the following
discussions.
https://doi.org/10.5194/acp-2021-683Preprint. Discussion started: 5 October 2021c© Author(s) 2021. CC BY 4.0 License.

11/36
In populous cities, the concentrations of both PPM and SPM in the north (5-year
averaged 21.5 μg·m-3 for PPM and 26.6 μg·m-3 for SPM) are 15-43% higher than those in the
south (15.0 μg·m-3 for PPM and 23.2 μg·m-3 for SPM). The North-South difference is mainly
caused by the higher energy consumption and consequent stronger pollutant emissions
occurring in northern populous regions. Nevertheless, in background regions, the difference 5
is relatively smaller for SPM. The SPM in the South (12.5 μg·m-3) is only 1% higher than that
in the North (12.4 μg·m-3).
In terms of the secondary proportion of PM2.5, the MTEA approach speculates it to be
higher in southern regions (63.5%) than that in northern regions (57.1%). The result confirms
the fact that atmospheric condition in the South is more favorable for secondary pollutant 10
formation than it is in the North. In addition, the MTEA approach reasonably captures the
difference of the secondary proportion of PM2.5 between populous and regional background
cities. As shown in Fig. 5e and 5f, the secondary proportions of PM2.5 in regional background
cities are 19% higher than those in populous cities, consistent with recent observational
studies (Liu et al., 2018b). Secondary aerosols can affect a larger area than primary aerosols, 15
mostly due to the diffusion of its gaseous precursors. Thus, for regional background regions,
the role of secondary PM2.5 tends to be more important, mainly caused by the transmitted
secondary pollutants from surrounding populous regions.
4.2 Temporal variation 20
4.2.1 Seasonal variation
We compare seasonal mean concentrations of the MTEA estimated PPM and SPM in 31
populous cities and 19 regional background cities in Table 1. Both the concentrations of PPM
and SPM are the highest in winter, with the seasonal mean concentration of 16.6 μg·m-3 for
PPM and 24.9 μg·m-3 for SPM across China. This phenomenon can be mainly explained by 25
adverse diffusion conditions, such as low boundary layer height and strong temperature
inversion (Zhao et al., 2013), as well as fossil-fuel and biofuel usage for winter home heating
(Zhang et al., 2009; Zhang and Cao, 2015). Summer is the least polluted season in the year,
with the seasonal mean PPM is 10.2 μg·m-3 and SPM is 15.8 μg·m-3 nationwide, largely
benefiting from the higher boundary layer (Guo et al., 2019) and abundant precipitations. 30
In terms of the secondary proportion of PM2.5, we also compared the secondary
contributions in different seasons and in the 50 different Chinese cities (Table 1). The MTEA
https://doi.org/10.5194/acp-2021-683Preprint. Discussion started: 5 October 2021c© Author(s) 2021. CC BY 4.0 License.
12/36
approach estimates that the secondary proportion tends to be the lowest in fall, with seasonal
mean value to be 56.1% nationwide, while for the other three seasons, the seasonal
proportions stay around 61%. At the same time, the seasonality of the secondary proportion
varies among different regions. In the north of China, the secondary proportions are higher in
spring and summer, which is attributed to the stronger atmospheric oxidizing capacity (AOC) 5
in the warmer seasons. But in the south of China, the highest secondary proportions occur in
winter, which is mainly explained by the tremendous pollutants (secondary particles and its
gaseous precursors) transported from northern China in presence of the monsoon.
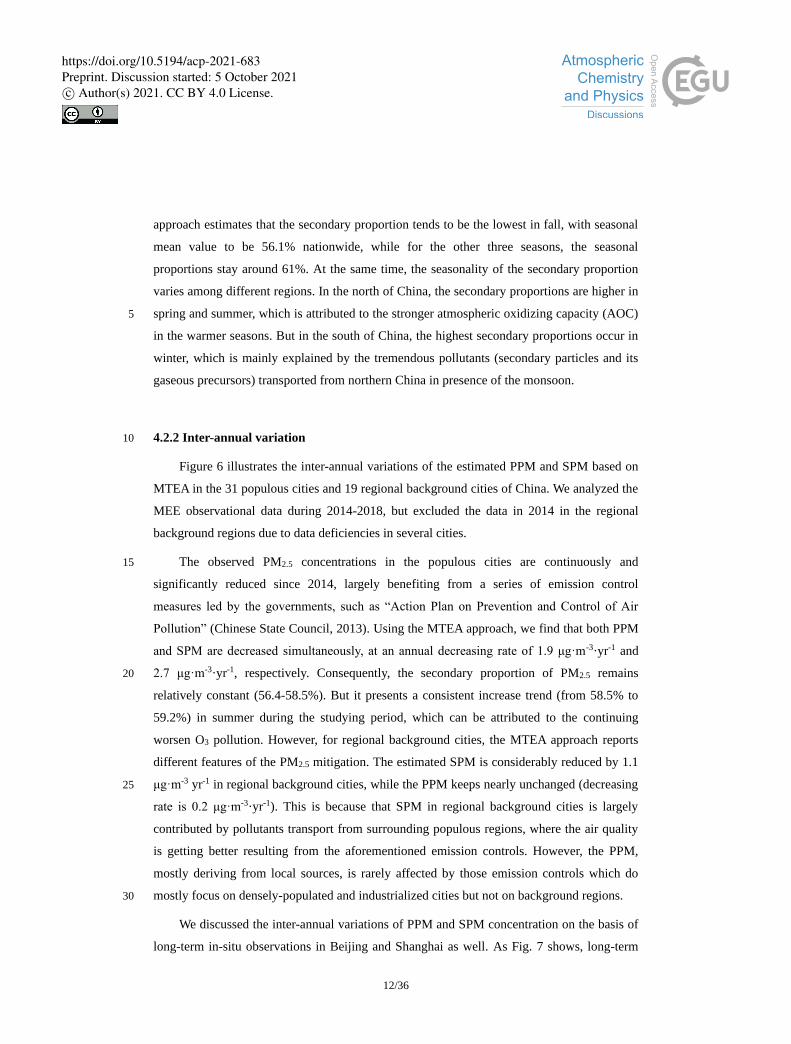
4.2.2 Inter-annual variation 10
Figure 6 illustrates the inter-annual variations of the estimated PPM and SPM based on
MTEA in the 31 populous cities and 19 regional background cities of China. We analyzed the
MEE observational data during 2014-2018, but excluded the data in 2014 in the regional
background regions due to data deficiencies in several cities.
The observed PM2.5 concentrations in the populous cities are continuously and 15
significantly reduced since 2014, largely benefiting from a series of emission control
measures led by the governments, such as “Action Plan on Prevention and Control of Air
Pollution” (Chinese State Council, 2013). Using the MTEA approach, we find that both PPM
and SPM are decreased simultaneously, at an annual decreasing rate of 1.9 μg·m-3·yr-1 and
2.7 μg·m-3·yr-1, respectively. Consequently, the secondary proportion of PM2.5 remains 20
relatively constant (56.4-58.5%). But it presents a consistent increase trend (from 58.5% to
59.2%) in summer during the studying period, which can be attributed to the continuing
worsen O3 pollution. However, for regional background cities, the MTEA approach reports
different features of the PM2.5 mitigation. The estimated SPM is considerably reduced by 1.1
μg·m-3 yr-1 in regional background cities, while the PPM keeps nearly unchanged (decreasing 25
rate is 0.2 μg·m-3·yr-1). This is because that SPM in regional background cities is largely
contributed by pollutants transport from surrounding populous regions, where the air quality
is getting better resulting from the aforementioned emission controls. However, the PPM,
mostly deriving from local sources, is rarely affected by those emission controls which do
mostly focus on densely-populated and industrialized cities but not on background regions. 30
We discussed the inter-annual variations of PPM and SPM concentration on the basis of
long-term in-situ observations in Beijing and Shanghai as well. As Fig. 7 shows, long-term
https://doi.org/10.5194/acp-2021-683Preprint. Discussion started: 5 October 2021c© Author(s) 2021. CC BY 4.0 License.
13/36
measurements demonstrate a decline of total PM2.5 by 4.0 μg·m-3 yr-1 in Beijing (1.6 μg·m-3
yr-1 for PPM and 2.4 μg·m-3 yr-1for SPM) and by 3.9 μg·m-3 yr-1 in Shanghai (1.7 μg·m-3 yr-1
for PM and 2.2 μg·m-3 yr-1for SPM). The observed secondary proportion of PM2.5 shows a
slight decrease of -0.4% yr-1 in Beijing, but a small increase of 0.8% yr-1 in Shanghai.
Applying the MTEA model to this case, we are delighted to find that our model not only 5
successfully reproduces the consistent decreasing trends of PPM and SPM in Beijing and
Shanghai, but also captures the different trends in secondary proportions of PM2.5 in the two
cities (-0.6% yr-1 in Beijing and 0.3% yr-1 in Shanghai).
4.3 Application during the COVID-19 lockdown 10
To curb the spread of the novel Coronavirus Disease 2019 (COVID-19) pandemic,
China conducted the entire city’s lockdown firstly in Wuhan, Hubei on January 23, 2020.
Other provinces gradually implemented this restriction in the following three weeks (Le et al.,
2020). The lockdown greatly limited the traffic and outdoor activities, which directly reduced
the emissions of primary pollutants (Huang et al., 2020). Through analyzing the MEE 15
monitoring data before (1~23 Jan 2020) and during (24-Jan ~ 17-Feb 2020) the nationwide
lockdown (Fig. 8 and Fig. S2), we show that the national mean NO2, PM2.5 and CO
concentrations were decreased by 56%, 30% and 24%, respectively, while O3 posed an
increase (34%) in general which would promote the AOC efficiently. However, the surface
monitoring network still observed an unexpected PM2.5 pollution in cities over BTH region 20
during the lockdown. Especially in Beijing, the mean PM2.5 concentration was increased by
~100% compared to its averaged value (41 μg·m-3) before the nationwide lockdown.
To explore this unexpected air pollution, we find that the enhanced secondary pollution
could be the major factor, which even offset the reduction of primary emissions in the BTH
region during the lockdown. With the help of MTEA, we tracked variations of the secondary 25
proportions of PM2.5 in East China before and during the COVID-19 lockdown (Fig. 8 d-f).
The secondary proportions in the BTH region show an evident increase, at the level of 7%-
34%, which highlights the importance of the secondary formation during the lockdown. Our
result is consistent with recent observation and simulation studies (Chang et al., 2020; Huang
et al., 2020; Le et al., 2020), which suggested that the reduced NO2 resulted in O3 30
enhancement, further increasing the AOC and facilitating secondary aerosol formation. In
addition, another cause of the air pollution is the unfavorable atmospheric diffusion
https://doi.org/10.5194/acp-2021-683Preprint. Discussion started: 5 October 2021c© Author(s) 2021. CC BY 4.0 License.

14/36
conditions. CO, a nonreactive pollutant, was increased by 22% in Beijing during the
lockdown even under considerable reduction on its emission.
For other regions of China, the MTEA approach suggests the secondary proportions of
PM2.5 to be increased by 20% over the YRD region, but to be decreased by 32% over the
Central China. Although O3 and AOC had enhanced in all these regions, the unprecedented 5
reductions on precursors ultimately resulted in a net drop of secondary pollution.
4.4 Correlation analysis with O3
PM2.5 and O3 are closely correlated with each other. One reason is that PM2.5 and O3
have similar precursors, i.e. NOx and VOCs. Besides, PM2.5 can impact O3 formation through 10
adjusting radiation balance (Li et al., 2018) and affecting radical level via aerosol chemistry
(Li et al., 2019). There is therefore a complicated interaction between PM2.5 and O3. Our
study utilized MTEA approach for exploring the relationship between PM versus O3 from the
perspective of exploring the statistical correlation.
Figure S3 illustrates the hourly correlations between the estimated SPM versus the 15
observed O3 averaged for 31 populous cities in China (cities which failed to pass the
significant test were excluded) in summer. In general, SPM and O3 shows a nationwide
positive relationship, especially during the afternoon (14:00~18:00, r up to 0.56). This
phenomenon might be explained that productions of both O3 and SPM are simultaneously
affected by AOC; thus the higher correlation tend to occur at time of stronger AOC. Moreover, 20
the hourly correlations between SPM and O3 are higher than that between PPM and O3
throughout the day, suggesting that secondary oxidation processes may be well captured by
the MTEA method.
A series of recent studies have focused on the correlation between PM2.5 and O3, and
many of them agreed that the correlation varies greatly in different regions of China, 25
specifically, the correlation is stronger positive in southern cities compared to that in northern
cities. Because of this significant difference, a question raises: is the difference mostly caused
by PPM, or SPM, or both of them? To address this question, we compare the correlations
between daily PPM, SPM and total PM2.5 versus O3 in Beijing-Tianjin-Hebei (BTH) and
Yangtze River Delta (YRD) region during the studying period, with the help of META 30
approach. For avoiding the cleaning effects of wet deposition, the days when precipitation
took place were removed. Precipitation data is based on the ERA5 reanalysis database from
https://doi.org/10.5194/acp-2021-683Preprint. Discussion started: 5 October 2021c© Author(s) 2021. CC BY 4.0 License.
15/36
the European Centre for Medium-Range Weather Forecasts (ECMWF, https://www.ecmwf.int/,
last access, 1 August 2021).
As shown in Fig. 9, the correlations between total PM2.5 and O3 are positive and are
stronger in YRD (r=0.14) than in BTH (r=0.09). However, compared with total PM2.5, the
correlations between SPM and O3 are much stronger (r=0.21-0.24) and shows minor regional 5
differences, but for PPM, its correlation with O3 is not significant (p-value>0.05) in both
regions. The higher correlation between SPM and O3 is mostly because that both of them are
secondary oxidation products. Higher ambient O3 concentration indicates stronger AOC, and
further lead to more SPM generation. However, for PPM, its effect on O3 is mainly to inhibit
the production of O3 via adjusting radiation balance and affecting radical level. Hence, we 10
suggest that the regional differences in the correlation between total PM2.5 and O3 are mainly
caused by the different PPM levels in BTH and YRD regions.
4.5 Uncertainties
Based on the previous evaluation and discussions, we believe that the MTEA can 15
successfully capture the magnitudes and spatio-temporal variations of PPM and SPM in
China. However, these are still some uncertainties in the model estimation and its application
in China.
Firstly, the assumption of non-significant correlation between PPM versus SPM may be
violated by the fact that SO2 and NOx emitted from combustions which will further generate 20
secondary sulfate and nitrate particulates. Nevertheless, the combustion processes for
generating SO2/NOx and PPM are still different. PPM, i.e. BC and POC, mainly comes from
incomplete combustion of residential activities, such as burning biofuels and coal (Long et al.,
2013), but SO2 and NOx mainly come from the complete combustion process of industrial
and transportation sources, such coal, gasoline and diesel (Lu et al., 2011; Li et al., 2017b; 25
Tang et al., 2019). In addition, the MTEA approach uses the assumption of non-significant
correlation rather than irrelevance. Such processing also reduces the uncertainty to a certain
extent.
Secondly, natural sources of PPM, such as fine dust from desert and sea salt, are not
taken into account in the MTEA approach. As a result, PPM in the city near a desert or sea 30
could be underestimated. For example, the PM2.5 components observational campaign
conducted in 2015 showed that the contribution of sea salt aerosols to ambient PM2.5 mass
https://doi.org/10.5194/acp-2021-683Preprint. Discussion started: 5 October 2021c© Author(s) 2021. CC BY 4.0 License.
16/36
concentration in Haikou is 3.6-8.3% (Liu et al., 2017).
Thirdly, current bottom-up emission inventories are generally outdated with a time lag
of at least 1-2 years, mainly due to the lack of timely and accurate statistics. Consequently,
the adjoint uncertainty in MTEA estimation is inevitable. To evaluate the uncertainty, a
comparison test was conducted by changing the emission coefficient (the a and b in Eq. 1) 5
with ±10%. The results are presented in Table S5 and point out that the estimated secondary
proportions of PM2.5 varied less than ±3% in most Chinese cities causing by the changes of
the emission coefficient.
5 Conclusions 10
In this study, we developed a new approach MTEA to distinguish the primary and
secondary compositions of PM2.5 efficiently from routine observation of PM2.5 concentration.
By comparing with long-term and short-term measurements of aerosol chemical components
in China as well as aerosol composition network in the United States, we showed that MTEA
was able to capture variations of PPM and SPM concentrations. 15
The method was then applied to the surface air pollutant concentrations from MEE
observation network in China, and offered an effective way to understand the characteristics
of PPM and SPM covering a wide area. In terms of spatial pattern, MTEA reveals that SPM
accounts for 63.5% of total PM2.5 in southern cities averaged for 2014-2018, while in the
North the proportion drops to 57.1%. It should be noted that the secondary proportion in 20
regional background regions is ~19% higher than that in populous regions. In terms of
seasonality, the estimated national averaged secondary proportion is the lowest in fall
(56.1%), and for the other three seasons it stays among 61%.
Moreover, we applied MTEA to explore the changes of secondary proportion in PM2.5 in
China. In recent years, the PM2.5 pollution in China has been significantly alleviated 25
benefiting from a series of emission control measures. The MTEA results suggest that both
PPM and SPM are decreased simultaneously in populous regions, while for regional
background regions, the reduction of secondary PM2.5 are much more notable than the PPM.
The secondary proportion of PM2.5 in populous cities during 2014-2018 keeps constant (56.4-
58.5%) in general on an annual average scale, but it poses a slight but consistent increase in 30
summer, mostly due to the elevated O3 and stronger photochemistry pollution in China. In
addition, with the help of MTEA, we found that the secondary PM2.5 proportion in Beijing
https://doi.org/10.5194/acp-2021-683Preprint. Discussion started: 5 October 2021c© Author(s) 2021. CC BY 4.0 License.
17/36
significantly increased by 34% during the COVID-19 lockdown, which might be the main
reason of the observed unexpected PM pollution in this special period.
Finally, we applied MTEA to explore the synergistic correlation between PM2.5 and O3.
Estimated results demonstrate that PPM is weakly correlated with O3, its effect on O3 is
mainly to inhibit the production of O3 via adjusting radiation balance and affecting radical 5
level. While SPM is positive correlated with O3 in presence of the effect of AOC. Higher
ambient O3 concentration indicates stronger AOC, and further lead to more SPM generation.
We suggested that the regional differences in the correlation between total PM2.5 and O3 are
mainly caused by the different PPM levels in BTH and YRD regions.
China has been plagued by PM2.5 pollution in recent years. Different PM2.5 compositions 10
may have varying impacts on environment, climate and health, due to the different sources
and generation pathways. Therefore, it’s of great importance to quantify PPM and SPM for
the pollution recognition and prevention. Traditional methods to quantify different PM2.5
components are often based on either lab analysis of offline filter samplings or online
observation instruments such as AMS. However, these methods are often labor-intensive, 15
strict technical and high economic cost. Our study develops an efficient approach to explore
PPM and SPM with low economy- and technique-cost, and applying this approach to large-
scale observation networks, such as the MEE network, can offer an unprecedented
opportunity to quantify the PM2.5 components on a large space and time scale.
20
Code and Data availability. The MTEA software package and input datasets are available at
http://nuistairquality.com/m_tea. Observational datasets and modeling results in the text are
available upon request to the corresponding author ([email protected]).
Author contribution. NL designed this study. NL and HL supervised this work. HRZ and 25
KQT established, performed and improved MTEA model. HRZ and NL interpreted the data
and wrote the original draft. CH, HLW, SG and MH provided the long-term measurements of
aerosol compositions. HL, CS, JLH, XLG, MDC, ZXL and HY provided useful comments on
the paper, and all authors contributed to the revision of the manuscript.
30
Competing interests. The authors declare that they have no conflict of interest.
https://doi.org/10.5194/acp-2021-683Preprint. Discussion started: 5 October 2021c© Author(s) 2021. CC BY 4.0 License.

18/36
Acknowledgements. This work was supported by the National Key Research and
Development Program of China (2018YFC0213802 and 2019YFA0606804), the National
Natural Science Foundation of China (41975171), and the Major Research Plan of the
National Social Science Foundation (18ZDA052). The numerical calculations in this paper 5
have been done on the supercomputing system in the Supercomputing Center of Nanjing
University of Information Science & Technology.
https://doi.org/10.5194/acp-2021-683Preprint. Discussion started: 5 October 2021c© Author(s) 2021. CC BY 4.0 License.

19/36
References
Action Plan on Air Pollution Prevention and Control: available at :
http://www.mee.gov.cn/gkml/hbb/bwj/201407/t20140725_280516.htm, 2013.
An, Z., Huang, R. J., Zhang, R., Tie, X., Li, G., Cao, J., Zhou, W., Shi, Z., Han, Y., Gu, Z.,
and Ji, Y.: Severe haze in northern China: A synergy of anthropogenic emissions and 5
atmospheric processes, Proc. Natl. Acad. Sci., 116, 8657-8666,
10.1073/pnas.1900125116, 2019.
Bond, T. C., Doherty, S. J., Fahey, D. W., Forster, P. M., Berntsen, T., DeAngelo, B. J.,
Flanner, M. G., Ghan, S., Kärcher, B., Koch, D., Kinne, S., Kondo, Y., Quinn, P. K.,
Sarofim, M. C., Schultz, M. G., Schulz, M., Venkataraman, C., Zhang, H., Zhang, S., 10
Bellouin, N., Guttikunda, S. K., Hopke, P. K., Jacobson, M. Z., Kaiser, J. W., Klimont,
Z., Lohmann, U., Schwarz, J. P., Shindell, D., Storelvmo, T., Warren, S. G., and Zender,
C. S.: Bounding the role of black carbon in the climate system: A scientific assessment, J.
Geophys. Res. , 118, 5380-5552, 10.1002/jgrd.50171, 2013.
Chang, Y., Huang, R. J., Ge, X., Huang, X., Hu, J., Duan, Y., Zou, Z., Liu, X., and Lehmann, 15
M. F.: Puzzling Haze Events in China During the Coronavirus (COVID‐19) Shutdown,
Geophys. Res. Lett., 47, 10.1029/2020gl088533, 2020.
Chen, W., Wang, X., Zhou, S., Cohen, J., Zhang, J., Wang, Y., Chang, M., Zeng, Y., Liu, Y.,
Lin, Z., Liang, G., and Qiu, X.: Chemical Composition of PM2.5 and its Impact on
Visibility in Guangzhou, Southern China, Aerosol Air Qual. Res., 16, 20
10.4209/aaqr.2016.02.0059, 2016.
Cheng, Y., Zheng, G., Wei, C., Mu, Q., Zheng, B., Wang, Z., Gao, M., Zhang, Q., He, K.,
Carmichael, G., Pöschl, U., and Su, H.: Reactive nitrogen chemistry in aerosol water as
a source of sulfate during haze events in China, Sci. Adv., 2, e1601530,
10.1126/sciadv.1601530, 2016. 25
Cui, H., Chen, W., Dai, W., Liu, H., Wang, X., and He, K.: Source apportionment of PM2.5 in
Guangzhou combining observation data analysis and chemical transport model
simulation, Atmos. Environ., 116, 262-271, 10.1016/j.atmosenv.2015.06.054, 2015.
Dai, Q., Bi, X., Liu, B., Li, L., Ding, J., Song, W., Bi, S., Schulze, B. C., Song, C., Wu, J.,
Zhang, Y., Feng, Y., and Hopke, P. K.: Chemical nature of PM2.5 and PM10 in Xi'an, 30
China: Insights into primary emissions and secondary particle formation, Environ.
Pollut., 240, 155-166, 10.1016/j.envpol.2018.04.111, 2018.
Du, W., Zhang, Y., Chen, Y., Xu, L., Chen, J., Deng, J., Hong, Y., and Xiao, H.: Chemical
Characterization and Source Apportionment of PM2.5 during Spring and Winter in the
Yangtze River Delta, China, Aerosol Air Qual. Res., 17, 2165-2180, 35
10.4209/aaqr.2017.03.0108, 2017.
Gao, J., Wang, K., Wang, Y., Liu, S., Zhu, C., Hao, J., Liu, H., Hua, S., and Tian, H.:
Temporal-spatial characteristics and source apportionment of PM2.5 as well as its
associated chemical species in the Beijing-Tianjin-Hebei region of China, Environ.
Pollut., 233, 714-724, 10.1016/j.envpol.2017.10.123, 2018. 40
Ge, X., Li, L., Chen, Y., Chen, H., Wu, D., Wang, J., Xie, X., Ge, S., Ye, Z., Xu, J., and Chen,
M.: Aerosol characteristics and sources in Yangzhou, China resolved by offline aerosol
mass spectrometry and other techniques, Environ. Pollut., 225, 74-85,
10.1016/j.envpol.2017.03.044, 2017.
Guo, J., Li, Y., Cohen, J. B., Li, J., Chen, D., Xu, H., Liu, L., Yin, J., Hu, K., and Zhai, P.: 45
https://doi.org/10.5194/acp-2021-683Preprint. Discussion started: 5 October 2021c© Author(s) 2021. CC BY 4.0 License.

20/36
Shift in the Temporal Trend of Boundary Layer Height in China Using Long-Term
(1979–2016) Radiosonde Data, Geophys. Res. Lett., 46, 6080-6089,
10.1029/2019gl082666, 2019.
Guo, S., Hu, M., Zamora, M. L., Peng, J., Shang, D., Zheng, J., Du, Z., Wu, Z., Shao, M.,
Zeng, L., Molina, M. J., and Zhang, R.: Elucidating severe urban haze formation in 5
China, Proc. Natl. Acad. Sci., 111, 17373-17378, 10.1073/pnas.1419604111, 2014.
Hu, J., Huang, L., Chen, M., Liao, H., Zhang, H., Wang, S., Zhang, Q., and Ying, Q.:
Premature Mortality Attributable to Particulate Matter in China: Source Contributions
and Responses to Reductions, Environ. Sci. Technol., 51, 9950-9959,
10.1021/acs.est.7b03193, 2017. 10
Hu, W. W., Hu, M., Deng, Z. Q., Xiao, R., Kondo, Y., Takegawa, N., Zhao, Y. J., Guo, S., and
Zhang, Y. H.: The characteristics and origins of carbonaceous aerosol at a rural site of
PRD in summer of 2006, Atmos. Chem. Phys., 12, 1811-1822, 10.5194/acp-12-1811-
2012, 2012.
Huang, G., Cheng, T., Zhang, R., Tao, J., Leng, C., Zhang, Y., Zha, S., Zhang, D., Li, X., and 15
Xu, C.: Optical properties and chemical composition of PM2.5 in Shanghai in the spring
of 2012, Particuology, 13, 52-59, 10.1016/j.partic.2013.10.005, 2014a.
Huang, L., An, J., Koo, B., Yarwood, G., Yan, R., Wang, Y., Huang, C., and Li, L.: Sulfate
formation during heavy winter haze events and the potential contribution from
heterogeneous SO<sub>2</sub> + NO<sub>2</sub> reactions in 20
the Yangtze River Delta region, China, Atmospheric Chemistry and Physics, 19, 14311-
14328, 10.5194/acp-19-14311-2019, 2019.
Huang, R. J., Zhang, Y., Bozzetti, C., Ho, K. F., Cao, J. J., Han, Y., Daellenbach, K. R.,
Slowik, J. G., Platt, S. M., Canonaco, F., Zotter, P., Wolf, R., Pieber, S. M., Bruns, E. A.,
Crippa, M., Ciarelli, G., Piazzalunga, A., Schwikowski, M., Abbaszade, G., Schnelle-25
Kreis, J., Zimmermann, R., An, Z., Szidat, S., Baltensperger, U., El Haddad, I., and
Prevot, A. S.: High secondary aerosol contribution to particulate pollution during haze
events in China, Nature, 514, 218-222, 10.1038/nature13774, 2014b.
Huang, X., Liu, Z., Liu, J., Hu, B., Wen, T., Tang, G., Zhang, J., Wu, F., Ji, D., Wang, L., and
Wang, Y.: Chemical characterization and source identification of PM2.5 at multiple sites 30
in the Beijing–Tianjin–Hebei region, China, Atmos. Chem. Phys., 17, 12941-12962,
10.5194/acp-17-12941-2017, 2017.
Huang, X., Ding, A., Gao, J., Zheng, B., Zhou, D., Qi, X., Tang, R., Wang, J., Ren, C., Nie,
W., Chi, X., Xu, Z., Chen, L., Li, Y., Che, F., Pang, N., Wang, H., Tong, D., Qin, W.,
Cheng, W., Liu, W., Fu, Q., Liu, B., Chai, F., Davis, S. J., Zhang, Q., and He, K.: 35
Enhanced secondary pollution offset reduction of primary emissions during COVID-19
lockdown in China, Nat. Sci. Rev., 10.1093/nsr/nwaa137, 2020.
IPCC: Climate Change 2013: The Physical Science Basis, Cambridge University Press,
United Kingdom and New York, NY, USA, 2013.
Jiang, N., Guo, Y., Wang, Q., Kang, P., Zhang, R., and Tang, X.: Chemical Composition 40
Characteristics of PM2.5 in Three Cities in Henan, Central China, Aerosol Air Qual. Res.,
17, 2367-2380, 10.4209/aaqr.2016.10.0463, 2017.
Khan, M. F., Latif, M. T., Saw, W. H., Amil, N., Nadzir, M. S. M., Sahani, M., Tahir, N. M.,
and Chung, J. X.: Fine particulate matter in the tropical environment: monsoonal effects,
source apportionment, and health risk assessment, Atmos. Chem. Phys., 16, 597-617, 45
https://doi.org/10.5194/acp-2021-683Preprint. Discussion started: 5 October 2021c© Author(s) 2021. CC BY 4.0 License.

21/36
10.5194/acp-16-597-2016, 2016.
Le, T., Wang, Y., Liu, L., Yang, J., Yung, Y. L., Li, G., and Seinfeld, J. H.: Unexpected air
pollution with marked emission reductions during the COVID-19 outbreak in China,
Science, eabb7431, 10.1126/science.abb7431, 2020.
Leng, C., Cheng, T., Chen, J., Zhang, R., Tao, J., Huang, G., Zha, S., Zhang, M., Fang, W., Li, 5
X., and Li, L.: Measurements of surface cloud condensation nuclei and aerosol activity
in downtown Shanghai, Atmos. Environ., 69, 354-361, 10.1016/j.atmosenv.2012.12.021,
2013.
Li, H., Wang, Q. g., Yang, M., Li, F., Wang, J., Sun, Y., Wang, C., Wu, H., and Qian, X.:
Chemical characterization and source apportionment of PM2.5 aerosols in a megacity of 10
Southeast China, Atmos. Res., 181, 288-299, 10.1016/j.atmosres.2016.07.005, 2016.
Li, K., Jacob, D. J., Liao, H., Shen, L., Zhang, Q., and Bates, K. H.: Anthropogenic drivers of
2013-2017 trends in summer surface ozone in China, Proc. Natl. Acad. Sci., 116, 422-
427, 10.1073/pnas.1812168116, 2019.
Li, L., Tan, Q., Zhang, Y., Feng, M., Qu, Y., An, J., and Liu, X.: Characteristics and source 15
apportionment of PM2.5 during persistent extreme haze events in Chengdu, southwest
China, Environ. Pollut., 230, 718-729, 10.1016/j.envpol.2017.07.029, 2017a.
Li, M., Liu, H., Geng, G., Hong, C., Liu, F., Song, Y., Tong, D., Zheng, B., Cui, H., Man, H.,
Zhang, Q., and He, K.: Anthropogenic emission inventories in China: a review, Natl. Sci.
Rev., 4, 834-866, 10.1093/nsr/nwx150, 2017b. 20
Li, M., Zhang, Q., Kurokawa, J. I., Woo, J. H., He, K., Lu, Z., Ohara, T., Song, Y., Streets, D.
G., Carmichael, G. R., Cheng, Y., Hong, C., Huo, H., Jiang, X., Kang, S., Liu, F., Su, H.,
and Zheng, B.: MIX: a mosaic Asian anthropogenic emission inventory under the
international collaboration framework of the MICS-Asia and HTAP, Atmos. Chem.
Phys., 17, 935-963, 10.5194/acp-17-935-2017, 2017c. 25
Li, N., He, Q., Greenberg, J., Guenther, A., Li, J., Cao, J., Wang, J., Liao, H., Wang, Q., and
Zhang, Q.: Impacts of biogenic and anthropogenic emissions on summertime ozone
formation in the Guanzhong Basin, China, Atmos. Chem. Phys., 18, 7489-7507,
10.5194/acp-18-7489-2018, 2018.
Lin, Y. C., Hsu, S. C., Chou, C. C., Zhang, R., Wu, Y., Kao, S. J., Luo, L., Huang, C. H., Lin, 30
S. H., and Huang, Y. T.: Wintertime haze deterioration in Beijing by industrial pollution
deduced from trace metal fingerprints and enhanced health risk by heavy metals,
Environ. Pollut., 208, 284-293, 10.1016/j.envpol.2015.07.044, 2016.
Liu, B., Li, T., Yang, J., Wu, J., Wang, J., Gao, J., Bi, X., Feng, Y., Zhang, Y., and Yang, H.:
Source apportionment and a novel approach of estimating regional contributions to 35
ambient PM2.5 in Haikou, China, Environ. Pollut., 223, 334-345,
10.1016/j.envpol.2017.01.030, 2017.
Liu, J., Li, J., Zhang, Y., Liu, D., Ding, P., Shen, C., Shen, K., He, Q., Ding, X., Wang, X.,
Chen, D., Szidat, S., and Zhang, G.: Source apportionment using radiocarbon and
organic tracers for PM2.5 carbonaceous aerosols in Guangzhou, South China: contrasting 40
local- and regional-scale haze events, Environ. Sci. Technol., 48, 12002-12011,
10.1021/es503102w, 2014.
Liu, W., Xu, Y., Liu, W., Liu, Q., Yu, S., Liu, Y., Wang, X., and Tao, S.: Oxidative potential of
ambient PM2.5 in the coastal cities of the Bohai Sea, northern China: Seasonal variation
and source apportionment, Environ. Pollut., 236, 514-528, 10.1016/j.envpol.2018.01.116, 45
https://doi.org/10.5194/acp-2021-683Preprint. Discussion started: 5 October 2021c© Author(s) 2021. CC BY 4.0 License.
22/36
2018a.
Liu, Z., Gao, W., Yu, Y., Hu, B., Xin, J., Sun, Y., Wang, L., Wang, G., Bi, X., Zhang, G., Xu,
H., Cong, Z., He, J., Xu, J., and Wang, Y.: Characteristics of PM2.5 mass concentrations
and chemical species in urban and background areas of China: emerging results from the
CARE-China network, Atmos. Chem. Phys., 18, 8849-8871, 10.5194/acp-18-8849-2018, 5
2018b.
Long, C. M., Nascarella, M. A., and Valberg, P. A.: Carbon black vs. black carbon and other
airborne materials containing elemental carbon: physical and chemical distinctions,
Environ. Pollut., 181, 271-286, 10.1016/j.envpol.2013.06.009, 2013.
Lu, Z., Zhang, Q., and Streets, D. G.: Sulfur dioxide and primary carbonaceous aerosol 10
emissions in China and India, 1996–2010, Atmos. Chem. Phys., 11, 9839-9864,
10.5194/acp-11-9839-2011, 2011.
Maji, K. J., Ye, W. F., Arora, M., and Shiva Nagendra, S. M.: PM2.5-related health and
economic loss assessment for 338 Chinese cities, Environ. Int., 121, 392-403,
10.1016/j.envint.2018.09.024, 2018. 15
Mao, Y.-H., Liao, H., and Chen, H.-S.: Impacts of East Asian summer and winter monsoons
on interannual variations of mass concentrations and direct radiative forcing of black
carbon over eastern China, Atmos. Chem. Phys., 17, 4799-4816, 10.5194/acp-17-4799-
2017, 2017.
Ming, L., Jin, L., Li, J., Fu, P., Yang, W., Liu, D., Zhang, G., Wang, Z., and Li, X.: PM2.5 in 20
the Yangtze River Delta, China: Chemical compositions, seasonal variations, and
regional pollution events, Environ. Pollut., 223, 200-212, 10.1016/j.envpol.2017.01.013,
2017.
Niu, X., Cao, J., Shen, Z., Ho, S. S. H., Tie, X., Zhao, S., Xu, H., Zhang, T., and Huang, R.:
PM2.5 from the Guanzhong Plain: Chemical composition and implications for emission 25
reductions, Atmos. Environ., 147, 458-469, 10.1016/j.atmosenv.2016.10.029, 2016.
Quan, J., Liu, Q., Li, X., Gao, Y., Jia, X., Sheng, J., and Liu, Y.: Effect of heterogeneous
aqueous reactions on the secondary formation of inorganic aerosols during haze events,
Atmos. Environ., 122, 306-312, 10.1016/j.atmosenv.2015.09.068, 2015.
Seinfeld, J. H., and Pandis, S. N.: Atmospheric chemistry and physics: From air pollution to 30
climate change, Third edition, John Wiley, New York, 2006.
Shen, F., Zhang, L., Jiang, L., Tang, M., Gai, X., Chen, M., and Ge, X.: Temporal variations
of six ambient criteria air pollutants from 2015 to 2018, their spatial distributions, health
risks and relationships with socioeconomic factors during 2018 in China, Environ. Int.,
137, 10.1016/j.envint.2020.105556, 2020. 35
Song, C., Wu, L., Xie, Y., He, J., Chen, X., Wang, T., Lin, Y., Jin, T., Wang, A., Liu, Y., Dai,
Q., Liu, B., Wang, Y. N., and Mao, H.: Air pollution in China: Status and spatiotemporal
variations, Environ. Pollut., 227, 334-347, 10.1016/j.envpol.2017.04.075, 2017.
Tan, J., Xiang, P., Zhou, X., Duan, J., Ma, Y., He, K., Cheng, Y., Yu, J., and Querol, X.:
Chemical characterization of humic-like substances (HULIS) in PM2.5 in Lanzhou, 40
China, Sci. Total Environ., 573, 1481-1490, 10.1016/j.scitotenv.2016.08.025, 2016.
Tan, T., Hu, M., Li, M., Guo, Q., Wu, Y., Fang, X., Gu, F., Wang, Y., and Wu, Z.: New insight
into PM2.5 pollution patterns in Beijing based on one-year measurement of chemical
compositions, Sci. Total Environ., 621, 734-743, 10.1016/j.scitotenv.2017.11.208, 2018.
https://doi.org/10.5194/acp-2021-683Preprint. Discussion started: 5 October 2021c© Author(s) 2021. CC BY 4.0 License.

23/36
Tang, L., Qu, J., Mi, Z., Bo, X., Chang, X., Anadon, L. D., Wang, S., Xue, X., Li, S., Wang,
X., and Zhao, X.: Substantial emission reductions from Chinese power plants after the
introduction of ultra-low emissions standards, Nat. Energy, 4, 929-938, 10.1038/s41560-
019-0468-1, 2019.
Tang, X., Chen, X., and Tian, Y.: Chemical composition and source apportionment of PM2.5 – 5
A case study from one year continuous sampling in the Chang-Zhu-Tan urban
agglomeration, Atmos. Pollut. Res., 8, 885-899, 10.1016/j.apr.2017.02.004, 2017.
Tao, J., Zhang, L., Gao, J., Wang, H., Chai, F., and Wang, S.: Aerosol chemical composition
and light scattering during a winter season in Beijing, Atmos. Environ., 110, 36-44,
10.1016/j.atmosenv.2015.03.037, 2015. 10
Tao, J., Zhang, L., Cao, J., Zhong, L., Chen, D., Yang, Y., Chen, D., Chen, L., Zhang, Z., Wu,
Y., Xia, Y., Ye, S., and Zhang, R.: Source apportionment of PM2.5 at urban and suburban
areas of the Pearl River Delta region, south China - With emphasis on ship emissions,
Sci. Total Environ., 574, 1559-1570, 10.1016/j.scitotenv.2016.08.175, 2017.
Tian, P., Wang, G., Zhang, R., Wu, Y., and Yan, P.: Impacts of aerosol chemical compositions 15
on optical properties in urban Beijing, China, Particuology, 18, 155-164,
10.1016/j.partic.2014.03.014, 2015.
von Schneidemesser, E., Monks, P. S., Allan, J. D., Bruhwiler, L., Forster, P., Fowler, D.,
Lauer, A., Morgan, W. T., Paasonen, P., Righi, M., Sindelarova, K., and Sutton, M. A.:
Chemistry and the Linkages between Air Quality and Climate Change, Chem. Rev., 115, 20
3856-3897, 10.1021/acs.chemrev.5b00089, 2015.
Wang, H., Tian, M., Chen, Y., Shi, G., Liu, Y., Yang, F., Zhang, L., Deng, L., Yu, J., Peng, C.,
and Cao, X.: Seasonal characteristics, formation mechanisms and source origins of
PM2.5 in two megacities in Sichuan Basin, China, Atmos. Chem. Phys., 18, 865-881,
10.5194/acp-18-865-2018, 2018. 25
Wang, H. L., Qiao, L. P., Lou, S. R., Zhou, M., Ding, A. J., Huang, H. Y., Chen, J. M., Wang,
Q., Tao, S. K., Chen, C. H., Li, L., and Huang, C.: Chemical composition of PM2.5 and
meteorological impact among three years in urban Shanghai, China, J. of Clean. Prod.,
112, 1302-1311, 10.1016/j.jclepro.2015.04.099, 2016a.
Wang, Y., Jia, C., Tao, J., Zhang, L., Liang, X., Ma, J., Gao, H., Huang, T., and Zhang, K.: 30
Chemical characterization and source apportionment of PM2.5 in a semi-arid and
petrochemical-industrialized city, Northwest China, Sci. Total Environ., 573, 1031-1040,
10.1016/j.scitotenv.2016.08.179, 2016b.
Wang, Y., Chen, J., Wang, Q., Qin, Q., Ye, J., Han, Y., Li, L., Zhen, W., Zhi, Q., Zhang, Y.,
and Cao, J.: Increased secondary aerosol contribution and possible processing on 35
polluted winter days in China, Environ. Int., 127, 78-84, 10.1016/j.envint.2019.03.021,
2019.
Wu, J., Xu, C., Wang, Q., and Cheng, W.: Potential Sources and Formations of the PM2.5
Pollution in Urban Hangzhou, Atmosphere, 7, 100, 10.3390/atmos7080100, 2016.
Wu, X., Vu, T. V., Shi, Z., Harrison, R. M., Liu, D., and Cen, K.: Characterization and source 40
apportionment of carbonaceous PM2.5 particles in China - A review, Atmos. Environ.,
189, 187-212, 10.1016/j.atmosenv.2018.06.025, 2018.
Wu, Y., Zhang, S., Hao, J., Liu, H., Wu, X., Hu, J., Walsh, M. P., Wallington, T. J., Zhang, K.
M., and Stevanovic, S.: On-road vehicle emissions and their control in China: A review
and outlook, Sci. Total Environ., 574, 332-349, 10.1016/j.scitotenv.2016.09.040, 2017. 45
https://doi.org/10.5194/acp-2021-683Preprint. Discussion started: 5 October 2021c© Author(s) 2021. CC BY 4.0 License.
24/36
Xu, H., Xiao, Z., Chen, K., Tang, M., Zheng, N., Li, P., Yang, N., Yang, W., and Deng, X.:
Spatial and temporal distribution, chemical characteristics, and sources of ambient
particulate matter in the Beijing-Tianjin-Hebei region, Sci. Total Environ., 658, 280-293,
10.1016/j.scitotenv.2018.12.164, 2019.
Yang, Y., Liao, H., and Lou, S.: Increase in winter haze over eastern China in recent decades: 5
Roles of variations in meteorological parameters and anthropogenic emissions, J.
Geophys. Res., 121, 13,050-013,065, 10.1002/2016jd025136, 2016.
Ye, Z., Liu, J., Gu, A., Feng, F., Liu, Y., Bi, C., Xu, J., Li, L., Chen, H., Chen, Y., Dai, L.,
Zhou, Q., and Ge, X.: Chemical characterization of fine particulate matter in Changzhou,
China, and source apportionment with offline aerosol mass spectrometry, Atmos. Chem. 10
Phys., 17, 2573-2592, 10.5194/acp-17-2573-2017, 2017.
Yu, S., Liu, W., Xu, Y., Yi, K., Zhou, M., Tao, S., and Liu, W.: Characteristics and oxidative
potential of atmospheric PM2.5 in Beijing: Source apportionment and seasonal variation,
Sci. Total Environ., 650, 277-287, 10.1016/j.scitotenv.2018.09.021, 2019.
Zhai, S., Jacob, D. J., Wang, X., Shen, L., Li, K., Zhang, Y., Gui, K., Zhao, T., and Liao, H.: 15
Fine particulate matter (PM2.5) trends in China, 2013–2018: separating contributions
from anthropogenic emissions and meteorology, Atmos. Chem. Phys., 19, 11031-11041,
10.5194/acp-19-11031-2019, 2019.
Zhang, H., Cheng, S., Li, J., Yao, S., and Wang, X.: Investigating the aerosol mass and
chemical components characteristics and feedback effects on the meteorological factors 20
in the Beijing-Tianjin-Hebei region, China, Environ. Pollut., 244, 495-502,
10.1016/j.envpol.2018.10.087, 2019.
Zhang, Q., G. Streets, D., Carmichael, G., B. He, K., Huo, H., Kannari, A., Klimont, Z., S.
Park, I., Reddy, E. S., Fu, J., Chen, D., Duan, L., Lei, Y., Wang, L., and L. Yao, Z.: Asian
emissions in 2006 for the NASA INTEX-B mission, Atmos. Chem. Phys., 9, 5131-5153, 25
10.5194/acpd-9-5131-2009, 2009.
Zhang, Q., Shen, Z., Cao, J., Zhang, R., Zhang, L., Huang, R. J., Zheng, C., Wang, L., Liu, S.,
Xu, H., Zheng, C., and Liu, P.: Variations in PM2.5, TSP, BC, and trace gases (NO2, SO2,
and O3) between haze and non-haze episodes in winter over Xi'an, China, Atmos.
Environ., 112, 64-71, 10.1016/j.atmosenv.2015.04.033, 2015. 30
Zhang , Q.: R & D and Application Demonstration of Dynamic Grid Emission Source
Information Platform (in Chinese), The Fourth Technical Seminar on Emission
Inventory of Air Pollution Sources in China, Nanjing, China, 18-19 September 2019,
2019.
Zhang, Y., Lang, J., Cheng, S., Li, S., Zhou, Y., Chen, D., Zhang, H., and Wang, H.: Chemical 35
composition and sources of PM1 and PM2.5 in Beijing in autumn, Sci. Total Environ.,
630, 72-82, 10.1016/j.scitotenv.2018.02.151, 2018.
Zhang, Y. L., and Cao, F.: Fine particulate matter (PM2.5) in China at a city level, Sci. Rep., 5,
14884, 10.1038/srep14884, 2015.
Zhao, M., Huang, Z., Qiao, T., Zhang, Y., Xiu, G., and Yu, J.: Chemical characterization, the 40
transport pathways and potential sources of PM2.5 in Shanghai: Seasonal variations,
Atmos. Res., 158-159, 66-78, 10.1016/j.atmosres.2015.02.003, 2015.
Zhao, X. J., Zhao, P. S., Xu, J., Meng, W., Pu, W. W., Dong, F., He, D., and Shi, Q. F.:
Analysis of a winter regional haze event and its formation mechanism in the North
China Plain, Atmos. Chem. Phys., 13, 5685-5696, 10.5194/acp-13-5685-2013, 2013. 45
https://doi.org/10.5194/acp-2021-683Preprint. Discussion started: 5 October 2021c© Author(s) 2021. CC BY 4.0 License.

25/36
Zhu, Y., Huang, L., Li, J., Ying, Q., Zhang, H., Liu, X., Liao, H., Li, N., Liu, Z., Mao, Y.,
Fang, H., and Hu, J.: Sources of particulate matter in China: Insights from source
apportionment studies published in 1987-2017, Environ. Int., 115, 343-357,
10.1016/j.envint.2018.03.037, 2018.
5
https://doi.org/10.5194/acp-2021-683Preprint. Discussion started: 5 October 2021c© Author(s) 2021. CC BY 4.0 License.

26/36
Table 1. Seasonal mean concentrations of the primary and secondary PM2.5 in 31 populous
cities and 19 regional background cities of China.
City
PPM (μg·m-3) SPM (μg·m-3) SPM/PM2.5 (%) M A M
J J A
S O N
D J F
M A M
J J A
S O N
D J F
M A M
J J A
S O N
D J F
Populous cities in the Northern China
Beijing 31.0 28.4 30.6 34.1 25.0 23.7 20.1 16.2 44.7 45.4 39.6 32.2
Tianjin 17.8 13.7 21.9 28.2 42.0 35.3 32.9 29.0 70.2 72.1 60.0 50.7
Shijiazhuang 35.0 22.4 41.5 54.0 36.7 35.5 32.1 37.7 51.2 61.3 43.6 41.1
Taiyuan 22.0 20.2 32.7 32.3 28.4 22.2 21.0 25.0 56.3 52.3 39.1 43.6
Hohhot 13.1 11.4 18.2 20.1 19.2 13.1 16.0 20.7 59.5 53.6 46.8 50.7
Shenyang 21.0 16.7 24.4 27.8 26.1 17.4 20.8 28.0 55.3 51.0 46.0 50.2
Changchun 21.3 15.8 20.2 28.9 18.3 12.3 17.2 25.0 46.2 43.9 46.0 46.4
Harbin 14.1 9.3 15.5 27.2 25.5 15.2 20.9 38.9 64.4 61.9 57.3 58.9
Jinan 25.6 23.0 29.9 32.4 38.2 30.7 30.7 38.3 59.9 57.1 50.7 54.2
Zhengzhou 24.8 20.2 28.6 34.1 45.2 28.8 33.9 44.1 64.6 58.7 54.3 56.4
Lhasa 6.6 5.9 8.2 5.8 13.0 9.2 9.3 13.6 66.3 61.2 53.2 70.1
Xian 24.1 15.3 31.3 37.1 31.5 20.1 24.5 41.3 56.7 56.7 44.0 52.7
Lanzhou 14.1 10.1 17.8 21.3 29.3 24.1 24.8 33.2 67.6 70.4 58.2 60.9
Xining 14.8 12.4 18.3 17.9 26.4 19.3 21.0 34.5 64.1 60.8 53.4 65.9
Yinchuan 12.9 8.2 16.1 18.7 22.8 21.8 21.1 27.0 63.8 72.8 56.7 59.1
Urumqi 15.2 9.5 16.5 27.9 30.9 19.1 32.0 63.6 67.1 66.9 66.0 69.5
Average 19.6 15.2 23.2 28.0 28.7 21.7 23.6 32.3 59.4 58.9 50.4 53.5
Regional background cities in the Northern China
Weihai 8.1 7.1 8.6 10.7 23.8 18.5 14.9 13.7 74.6 72.2 63.4 56.0
Jiayuguan 7.8 7.0 7.5 7.0 16.6 11.4 14.5 19.2 68.1 61.9 65.9 73.4
Zhangjiakou 10.8 11.0 10.7 10.7 14.2 14.4 12.8 14.4 56.8 56.6 54.5 57.4
Daxinganling 4.3 3.6 4.6 5.7 9.2 7.7 9.3 11.6 68.0 67.9 67.0 66.9
Xilingol 2.3 2.3 2.8 3.1 10.2 9.3 7.7 9.1 81.8 80.1 73.1 74.7
Yanbian 9.9 5.6 9.4 11.7 15.3 9.1 13.5 17.4 60.7 62.1 58.9 59.7
Guyuan 12.3 9.0 11.9 13.1 19.0 13.1 14.7 20.1 60.7 59.2 55.4 60.6
Yushu 4.3 2.1 4.2 3.9 10.0 9.6 7.1 9.9 69.8 82.3 62.7 71.5
Altay 2.0 1.3 1.7 2.7 6.3 6.3 6.0 8.0 76.1 83.5 77.5 74.7
Average 6.9 5.5 6.8 7.6 13.8 11.1 11.2 13.7 66.9 67.0 62.1 64.2
Populous cities in the Southern China
Shanghai 12.4 11.1 11.7 15.8 29.5 22.5 20.8 25.4 70.4 67.0 64.1 61.6
Nanjing 19.1 16.0 19.9 24.3 29.2 18.7 19.9 28.5 60.4 53.9 50.1 54.0
Hangzhou 21.1 17.8 21.5 23.6 24.9 14.5 18.9 28.5 54.1 45.0 46.8 54.7
Hefei 16.4 14.6 17.9 23.2 39.8 26.7 30.1 39.8 70.9 64.6 62.7 63.2
Fuzhou 9.0 7.5 7.5 7.6 18.0 12.9 13.7 19.7 66.6 63.3 64.7 72.2
Nanchang 14.8 9.8 13.2 15.8 20.6 13.6 22.3 28.8 58.2 58.1 62.9 64.6
Wuhan 18.5 15.6 18.9 25.3 36.4 19.9 30.0 45.3 66.3 56.1 61.3 64.2
Changsha 17.6 13.2 17.5 21.9 31.5 21.1 31.2 40.0 64.1 61.5 64.1 64.6
Guangzhou 11.6 9.5 12.1 12.7 22.6 16.3 23.4 26.6 66.0 63.3 65.9 67.7
Nanning 11.7 9.7 14.9 13.3 22.0 12.9 19.9 28.7 65.3 57.1 57.1 68.3
Haikou 5.8 4.7 8.1 6.0 11.5 6.9 8.7 15.8 66.3 59.4 51.8 72.6
Chongqing 17.9 14.0 18.6 21.6 24.1 19.4 25.0 38.8 57.5 58.0 57.3 64.2
Chengdu 29.6 20.0 27.1 31.7 23.6 15.0 18.2 39.1 44.3 42.8 40.1 55.2
Guiyang 13.5 10.6 12.2 9.9 21.3 12.2 18.5 29.8 61.2 53.6 60.4 75.0
Kunming 9.3 6.5 6.9 8.1 21.1 13.5 16.1 18.4 69.5 67.6 69.9 69.3
https://doi.org/10.5194/acp-2021-683Preprint. Discussion started: 5 October 2021c© Author(s) 2021. CC BY 4.0 License.
27/36
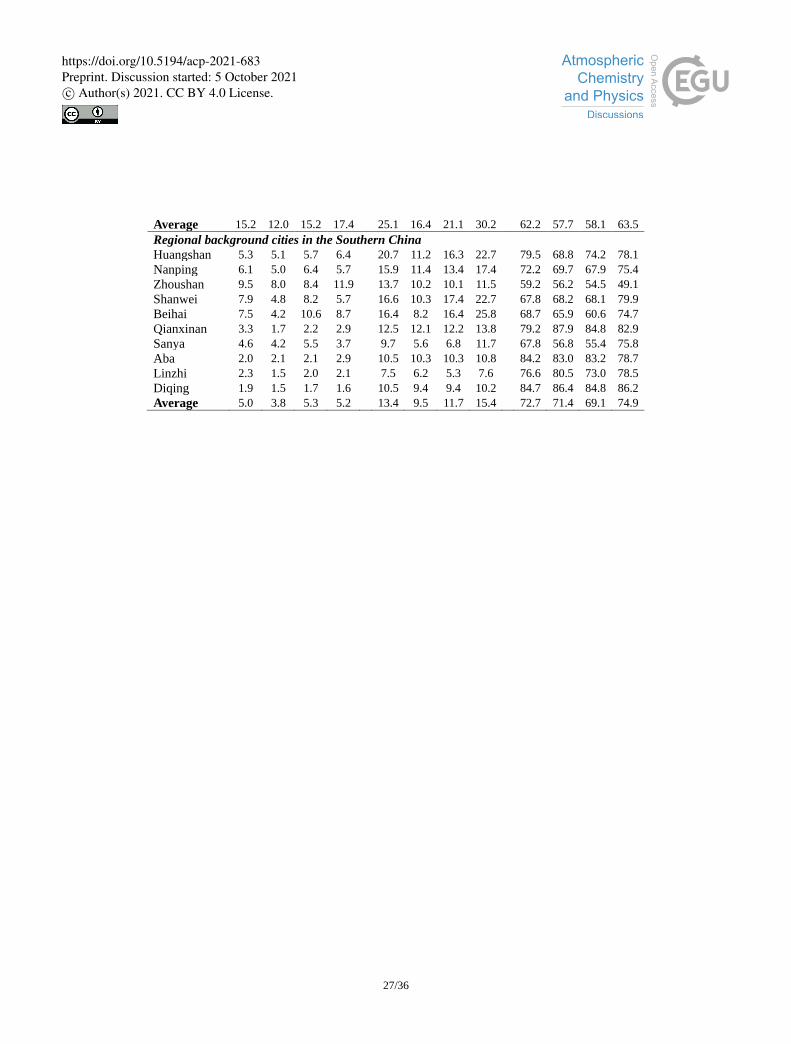
Average 15.2 12.0 15.2 17.4 25.1 16.4 21.1 30.2 62.2 57.7 58.1 63.5
Regional background cities in the Southern China
Huangshan 5.3 5.1 5.7 6.4 20.7 11.2 16.3 22.7 79.5 68.8 74.2 78.1
Nanping 6.1 5.0 6.4 5.7 15.9 11.4 13.4 17.4 72.2 69.7 67.9 75.4
Zhoushan 9.5 8.0 8.4 11.9 13.7 10.2 10.1 11.5 59.2 56.2 54.5 49.1
Shanwei 7.9 4.8 8.2 5.7 16.6 10.3 17.4 22.7 67.8 68.2 68.1 79.9
Beihai 7.5 4.2 10.6 8.7 16.4 8.2 16.4 25.8 68.7 65.9 60.6 74.7
Qianxinan 3.3 1.7 2.2 2.9 12.5 12.1 12.2 13.8 79.2 87.9 84.8 82.9
Sanya 4.6 4.2 5.5 3.7 9.7 5.6 6.8 11.7 67.8 56.8 55.4 75.8
Aba 2.0 2.1 2.1 2.9 10.5 10.3 10.3 10.8 84.2 83.0 83.2 78.7
Linzhi 2.3 1.5 2.0 2.1 7.5 6.2 5.3 7.6 76.6 80.5 73.0 78.5
Diqing 1.9 1.5 1.7 1.6 10.5 9.4 9.4 10.2 84.7 86.4 84.8 86.2
Average 5.0 3.8 5.3 5.2 13.4 9.5 11.7 15.4 72.7 71.4 69.1 74.9
https://doi.org/10.5194/acp-2021-683Preprint. Discussion started: 5 October 2021c© Author(s) 2021. CC BY 4.0 License.

28/36
Figure 1. The flow chart of the M-TEA approach. The part in red indicates the air
quality data and emission input. The part in green stands for the key process for
predicting PPM/SPM based on the routine PM2.5 observation. In this part, S.T. means
the significant test. The significant level α is set to 0.05. The part in orange indicates
the final output.
https://doi.org/10.5194/acp-2021-683Preprint. Discussion started: 5 October 2021c© Author(s) 2021. CC BY 4.0 License.

29/36
Figure 2. The geographical locations for the observational data used in this study. (a)
Geographical locations of 31 populous cities (red circles) and 19 regional background
cities (blue triangles) of China in this study. (b) Spatial distribution of the IMPROVE
aerosol monitoring network (pink pentagrams) in the United States.
https://doi.org/10.5194/acp-2021-683Preprint. Discussion started: 5 October 2021c© Author(s) 2021. CC BY 4.0 License.

30/36
Figure 3. The scatter evaluation between the monthly mean of observed PM versus
that of estimated PM in Beijing (a-b) and Shanghai (c-d), China. Panel (a, d), (b, e)
denotes PPM and SPM. The red numbers in each panel indicate the Pearson
correlation coefficient (r), the slope (s) and the intercept of fitting line (d). The fitting
lines in red were based on the Reduced Major Axis (RMA) regression. The black
dotted line in each panel from left to right represents 2:1, 1:1 and 1:2 ratio
respectively.
https://doi.org/10.5194/acp-2021-683Preprint. Discussion started: 5 October 2021c© Author(s) 2021. CC BY 4.0 License.

31/36
Figure 4. The scatter evaluation between the monthly mean of observed PPM(a-
c)/SPM(d-f) versus that of estimated PPM/SPM in the United States. Panel (a, d), (b, e)
and (c, f) denotes temporal, spatial and spatio-temporal mixed validation respectively.
The red numbers in each panel indicate the Pearson correlation coefficient (r), the
slope (s) and the intercept of fitting line (d). The fitting lines in red were based on the
RMA regression. The black dotted line in each panel from left to right represents 2:1,
1:1 and 1:2 ratio respectively.
https://doi.org/10.5194/acp-2021-683Preprint. Discussion started: 5 October 2021c© Author(s) 2021. CC BY 4.0 License.

32/36
Figure 5. Spatial distributions of PPM (a, b), SPM (c, d) and total PM2.5 concentration
(e, f) averaged for the studying period. The secondary proportions of PM2.5
(SPM/total PM2.5) are also shown in (e, f). The left column (a, c, e) indicates populous
cities. The right column (b, d, f) is for the regional background cities. The black
dotted line in each panel shows the Qinling-Huaihe line.
https://doi.org/10.5194/acp-2021-683Preprint. Discussion started: 5 October 2021c© Author(s) 2021. CC BY 4.0 License.
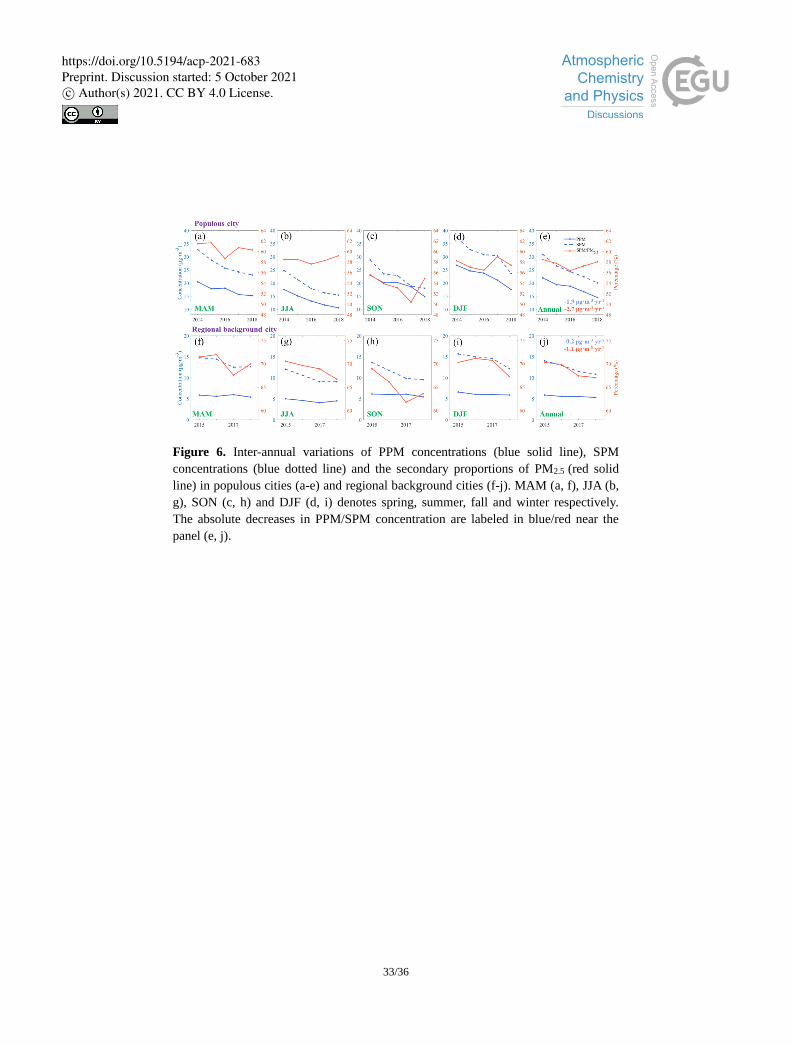
33/36
Figure 6. Inter-annual variations of PPM concentrations (blue solid line), SPM
concentrations (blue dotted line) and the secondary proportions of PM2.5 (red solid
line) in populous cities (a-e) and regional background cities (f-j). MAM (a, f), JJA (b,
g), SON (c, h) and DJF (d, i) denotes spring, summer, fall and winter respectively.
The absolute decreases in PPM/SPM concentration are labeled in blue/red near the
panel (e, j).
https://doi.org/10.5194/acp-2021-683Preprint. Discussion started: 5 October 2021c© Author(s) 2021. CC BY 4.0 License.

34/36
Figure 7. The monthly time series variation of PM in Beijing (a-b) and Shanghai (c-
d). Panel (a, d), (b, e) denotes PPM, SPM respectively. In each panel, in-situ
observation and MTEA estimation is shown in blue and red dots. Meanwhile, bule
and red dotted line stands for the long-term trend in concentration changes. The
values of the decrease rates in PPM and SPM concentrations as well as the relative
changes in the secondary proportions of PM2.5 (SPM %) are also provided at the upper
right corner of each panel.
https://doi.org/10.5194/acp-2021-683Preprint. Discussion started: 5 October 2021c© Author(s) 2021. CC BY 4.0 License.
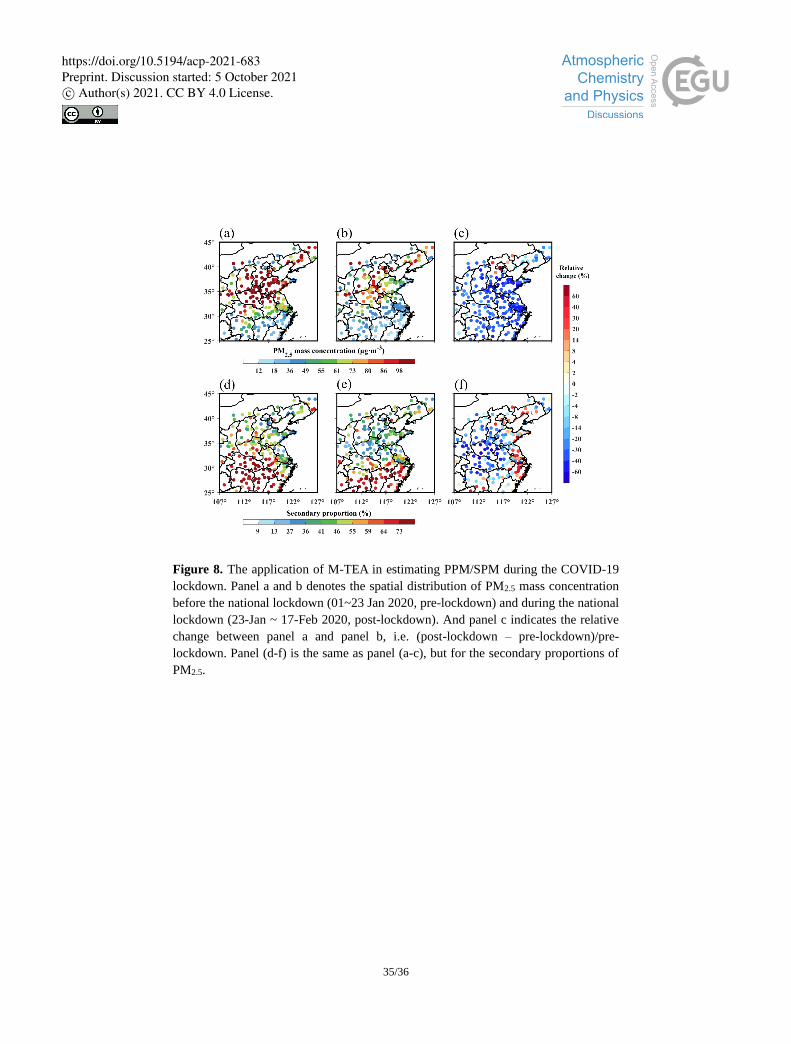
35/36
Figure 8. The application of M-TEA in estimating PPM/SPM during the COVID-19
lockdown. Panel a and b denotes the spatial distribution of PM2.5 mass concentration
before the national lockdown (01~23 Jan 2020, pre-lockdown) and during the national
lockdown (23-Jan ~ 17-Feb 2020, post-lockdown). And panel c indicates the relative
change between panel a and panel b, i.e. (post-lockdown – pre-lockdown)/pre-
lockdown. Panel (d-f) is the same as panel (a-c), but for the secondary proportions of
PM2.5.
https://doi.org/10.5194/acp-2021-683Preprint. Discussion started: 5 October 2021c© Author(s) 2021. CC BY 4.0 License.

36/36
Figure 9. Scatter plot about the correlation between daily PM concentration and MDA8 O3
concentration in Beijing (blue) and Shanghai (red). Based on the reanalysis dataset ERA5
from ECMWF, those days when precipitation took place were removed. Panel a-c indicates
PPM, SPM and total PM2.5 respectively. In each panel, solid-colored lines represent the fitting
line based on Least Squares method. The Peason correlation coefficient (r) are also given at
the bottom right of the panels.
https://doi.org/10.5194/acp-2021-683Preprint. Discussion started: 5 October 2021c© Author(s) 2021. CC BY 4.0 License.