Estimation of macrophytes using single-beam and...
6
Estimation of macrophytes using single-beam and multibeam echosounding for environmental monitoring of arctic fjords (Kongsfjord, West Svalbard Island) A. Kruss a , P. Blondel b , J. Tegowski a , J. Wiktor a and A. Tatarek a a Institute of Oceanology Polish Academy of Sciences, Powstancow Warszawy 55, 81-712 Sopot, Poland b University of Bath, Department of Physics, Claverton Down, BA2 7AY Bath, UK [email protected]
Transcript of Estimation of macrophytes using single-beam and...

Estimation of macrophytes using single-beam andmultibeam echosounding for environmental monitoring
of arctic fjords (Kongsfjord, West Svalbard Island)
A. Krussa, P. Blondelb, J. Tegowskia, J. Wiktora and A. Tatareka
aInstitute of Oceanology Polish Academy of Sciences, Powstancow Warszawy 55, 81-712Sopot, Poland
bUniversity of Bath, Department of Physics, Claverton Down, BA2 7AY Bath, [email protected]
Abstract: This paper presents results of a study on the spatial distribution and biomass of macrophytobentos in a fjord of Arctic Svalbard. Kongsfjord represents a periglacial environment with intense morphodynamic processes and rapidly progressing changes in the biotic environment, making it one of the most promising areas to research climate impact on ecosystems. The main objective was to provide an acoustic tool for the evaluation of benthic habitats. The 2007 field survey included systematic, co-registered, single-beam and multibeam echosounder measurements. Acoustic observations were verified by biological samplings and observations for the classification algorithm development and verification. Analyses of acoustic signals scattered on bottoms covered by algae providing a map of phytobenthos distribution and biomass estimation in Kongsfjord. The algorithms designed and tested for processing single- and multibeam data allow extracting the morphological forms of the bottom and determine the areas covered by algae. This survey was the first instance where a multibeam imager was used to map macrophytes in an Arctic environment, in a wide variety of depths and ranges.
1 Introduction
Single-beam (SBES), down-looking echosounders have long been the tool of choice for underwater habitat mapping, because they are simple to use and widespread on nearly all vessels. The shape of the echo carries a lot of information about bottom hardness and roughness. New or developed techniques of acoustic signal analysis allow to differentiate all collected data and distinguish benthic habitats using various processing methods [1-4,9]. Single-beam echosounders are good acoustic tools but have also disadvantages, the most important for this research being a rather small swath width, so it was reasonable to use multibeam echosounder for complementary measurements. Multibeam sonar systems (MBES) are the most advanced acoustical tools for remote observations and characterizations of the seafloor. They are capable of mapping backscattering strength coinciding with fine bathymetry, improving its usefulness to discriminate different types of seafloor habitats [5-7]. The small size of modern shallow-water multibeam transducers enables small-boat deployment in difficult, Arctic conditions. All data were collected in Kongsfjord (79˚N) which is a part of Spitsbergen Island and is an excellent example of the Arctic environment. The presence of the international polar station in Ny-Ålesund makes research easier and safer. More importantly, it means there is good, long term documentation of the changing environment. Our acoustic habitat mapping project has added an innovative approach and interesting results to this pool of knowledge, providing much useful and new information about algae distribution and biomass changes. Until now, new and improved algorithms have been tested using wavelet transformation and statistical echo parameters as base for fuzzy logic and genetic algorithms classification [7]. Efficient and precise distinction of echo signals coming from vegetation-covered and bare bottoms allowed us to create accurate maps of the spatial distribution of macrophytobentos in the research area.
2 Methods and study area
The survey presented here was conducted in summer 2007 with logistical support from the Alfred-Wegener Institute and Paul-Emile Victor (AWIPEV) Polar Station in Ny-Ålesund. The short time available for the field survey
restricted algae investigations to the inner part of Kongsfjord. The main point of interest was the euphotic zone down to 25-m deep and along about 42Nm of shore line. All acoustical equipment was mounted on a small, aluminium-hull boat (Buster-type). Research transects were taken perpendicular to the coast and placed every 30-60m. During 11 days of effective survey time (because of the weather conditions), we investigated more than 20 Nm along the shore, covering the entire southern part of the fjord. In addition, biological samples were taken in 4 different locations, thanks to a group of German divers, confirming our acoustic recognition of macroalgae height and density. Kongsfjord, as many Arctic fjords, is surrounded by melting glaciers and replete with underwater rocks and icebergs which makes research conditions difficult and hard to predict. Water state is very variable; transparent areas become cloudy very fast because of suspensions from glacier rivers (a strongly limiting factor for other types of remote sensing, such as aerial photography). The fjord’s bottom is partly sandy and flat but can be very steep or rocky in some places. This difficult environment requires special methods of acoustic data analysis, extracting the most significant information for habitat mapping independently of water condition [3]. Our measurements of macroalgae spatial distribution in particular showed that algae could be found even on the fjord’s bottom very close to the glacier, in very poor water visibility and with dense sediments suspensions, proving the definite advantage of acoustic techniques in these conditions.
3 Data acquisition
3.1 Single-beam echosounder
The primary tool for this study was a Biosonics DTX single-beam echosounder (SBES). It operates at 420 kHz with a narrow 3-dB beamwidth of 5.2˚. At a range of 0.5-30 m and with a pulse length of 0.1ms, it performs with a resolution of ~0.3–0.9 m (according to depth) x 0.08m, making it an efficient device for algae investigation. The transducer was mounted on the port side of the Buster boat and connected to a surface unit. A GPS antenna was placed exactly over the transducer and the signal NMEA was sent to the Biosonics Visual Acquisition software, which managed all single-beam data acquisition. Research transects were taken perpendicular to the coast, depending on the shores’ shape. Especially near the glaciers, the

bottom could be very steep, reaching 30-m depths a few meters from the shore. In other places, rocks go down straight to the sea and algae grow on vertical underwater walls, hard to investigate by SBES. As shown on the typical SBES echogram in Fig.1, algae are acoustically visible as weaker backscattering areas on the hard bottom. The horizontal scale of this echogram is the pulse number, i.e. along-track position as moving at constant speed. The colour bar (greyscale in the printed version of this article) shows the amplitude of the backscattered signal in dB. The individual echoes above the seabed are in red (darker), and the smaller acoustic intensities are identified as macrophytes, in green (lighter). This was confirmed by visual inspection, made possible by the high clarity of the water in this particular area. Results of measurements conducted by the echosounder show that the average height of macrophytes is varying here from 1 to 1.5 m. Areas with bare seabed are also clearly visible.
Fig.1 Typical echogram taken with the single-beam echosounder BioSonics DTX. Left: bottom profiles along-track, imaged ping by ping with backscattering intensity. Right: ping analysis (in this case ping no.1) is also done
sample by sample. Macroalgae (framed) are green (lighter) on the hard bottom, orange (darker).
3.2 Multi-beam echosounder
The Imagenex 837 Delta-T multibeam sonar is operating with 120 beams and working at a frequency of 260kHz. Beamwidths are 1° across-track and 20˚ along-track. Innovative digital signal processing is used to optimise data usage from all channels to achieve the best possible resolution at every point in the field of view. The range-resolution is 0.2% of the range selected by the user (i.e. 1 cm at 5 m, 16 cm at 80 m). Multibeam profiles are acquired at rates higher than 20 per second, giving an excellent coverage of the seabed at all depths and allowing comparisons of series of pings (for example to detect transient signals or shoals of fish). The acquisition gain was kept fixed at 20 dB. The MBES was pole-mounted (on the starboard side of the boat) and connected to a GPS antenna mounted directly on top of the pole for accurate positioning, enabling accurate co-registration with the SBES measurements. No Motion-Reference Unit was used, for logistical reasons, but as the survey was conducted only in very flat sea (Beaufort Sea States 0-2, and Sea State 3 in
one event), this did not prove a problem to calculate the bio-areas in individual snapshots (ping by ping) and to deduce the corresponding bio-volumes. The MBES was successfully used in water depths as small as 0.5 m, with excellent correlation with SBES measurements and optical checks in clear water, validating its shallowest deployment ever. This MBES principally acquires bathymetry measurements for each beam, but backscatter strengths can also be derived from the individual measurements, and the returns from the centre beam(s) can create an echosounder-like profile (Fig. 2). This figure shows a typical case in very shallow water (2.2 m). The range of the sonar can be dynamically altered (here to 5 m) to be optimised for the current depth. Strong reflections from the flat seabed are clearly visible as red dots (smeared as the imaging angle increases, for the outer beams). Because of the high pulse-repetition rate, 5 shots are averaged for the current display. Additional echoes in the water column are attributed to Laminaria algae, and confirmed with visual checks from the survey vessel. Echoes below the seabed are in fact secondary reflections from previous pings: smaller and more variable from ping to ping, they can be safely disregarded.
Fig.2 Typical MBES display during acquisition. The number of windows is usually reduced to allow a better visibility of the raw multibeam bathymetry (background
image). Clockwise from top, the superposed images correspond to GPS navigation, centre-beam returns, and
sidescan-like processing.
Multibeam bathymetry has already been used with success to map the coverage and bio-characteristics of seagrass, for example on the coast of Japan (e.g. [10]). Although their study was limited to specific seagrass types, rather different from the Laminaria kelps studied here, their raw multibeam measurements showed strong similarities. The raw multibeam imagery acquired in the present survey was similar but with a higher resolution. Fig. 3 shows an interpreted profile, where one can note the high resolution of individual macrophytes even at far-range. The nominal vertical resolution of the MBES at this range is 1 cm, enough to resolve the broad, flat leaves typical of the Laminaria witnessed below the boat. Interestingly enough, the thick stalks cannot be resolved (although they could be seen on the Biosonics echosounder measurements, demonstrating the complementarities of the two approaches). At far range, the flat leaves are still visible, although their apparent tilt is more likely increased by the
angle of ensonification. The out-of-range echoes are not used during data acquisition, but their range (twice the depth of the macrophytes) shows clearly they are secondary reflections from the sea surface, arriving 1 ping later on the multibeam receiver. Post-processing could look at their significance as “pseudo-bistatic” echoes, similar to those studied by [11] with echosounder data.
Fig.3 MBES echoes from Laminaria and gravelly bottom. Note the resolution of individual leaves even at far range.
It is possible to approximate sidescan sonar imagery by adequate processing of multibeam data. Biological constructs on the seabed can be accurately delineated on sidescan imagery alone (e.g. [3, 4, 9]) and it was worth checking what could be achieved by processing the multibeam data to mimic sidescan sonar imagery. The seabed looks rather homogeneous at this high frequency (although iceberg scours or large algal clumps can be seen in places), and macrophytes generally have very subtle expressions, unless the range selection means they are visible in the water column. The combinations of range and gain best suited to detect the macrophytes in the bathymetry were usually not ideal for the sidescan-like processing. The returns from the centre beam(s) can also be processed to give SBES-like profiles (Fig.2). Measured depths match exactly what was observed with the other instruments, namely the Biosonics echosounder and the survey vessel’s own echosounder. Individual returns correctly identify the macrophytes observed with the SBES and areas of bare seabed (including mud, correctly identified when also looking at wider ranges across-track). Current processing efforts are focusing on the 3-D identification of algae from ping to ping, and their matching with what is known from centre-beam returns, using traditional image processing.
4 Data processing and classification
The single-beam echosounder writes backscattered signals in BioSonics DT4 format using 1728 samples per ping. These were corrected for TVG (Time-Varying Gain) and converted into ASCII format before further processing. Each echo signal contains information from several bottom returns, due to repeated reflections of the signal between the shallow bottom and the water surface. To characterize benthic habitats, only the first part of the return echo is needed, so the most useful first 160 samples were cut out from the echogram [8]. Fig.4 shows an example of the envelope of a return ping and its limitation to 160 samples. The highest peak, about –23 dB, represents part of the first echo returned from the bottom.
The first step of the discrimination procedure was to divide all echoes into bare-bottom areas and areas with algae. It was then possible to look for different height or species distribution of the macrophytobentos present.
Fig.4. Example of the return echo from one ping of the BioSonics DTX SBES. Backscattering strengths of each sample value are colour-coded. The 160 samples cut out
around the first bottom return are marked by arrows.
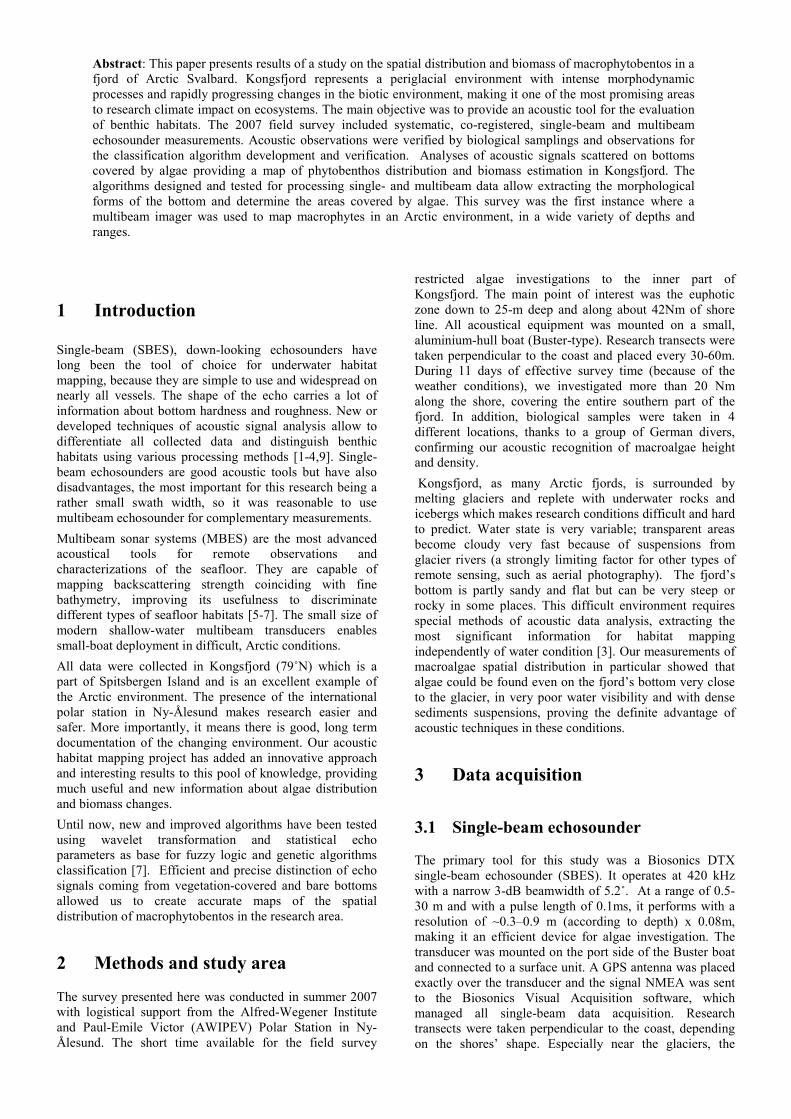
Fig.5. Preliminary map of algae distribution and height variability in Kongsfjord, based on BioSonics DTX
measurements. The colourbar intensity is related to the height [m] of algae, which reaches 1.5m in some places.
Using theSonar5 Balk&Lindem software, a preliminary map of algae distribution was computed (Fig.5). Presence/absence of algae and heights were calculated from the backscattering strength. “First bottom” is found from maximum backscatter amplitudes and then a threshold for the tops of algae is selected after visual study of the echograms. These method provides good and fast results for a first analysis of the entire, large dataset. However, parts of the signal from deeper places, below 20m, were often recognized as algae although they correspond in fact to a muddy bottom. Preliminary results (Fig. 5) show estimated algal coverage of 44% on the area investigated, with a mean height of around 1m. Taking this into consideration, more advanced classification techniques were then used to find seafloor properties significant for habitat discrimination. Referring to known methods [e.g. 1,3-5], we chose cluster analysis based on various features. Two sets of parameters were calculated based on single beam echo data. The first one contained statistical features [4] of each cut ping, corresponding to morphological and physical properties of benthic habitats. The second set
SSaammpplleess
116600 ssaammpplleess 11sstt bboottttoomm rreettuurrnn

consisted in continuous wavelet-transformation coefficients (with a Coiflet mother wavelet of the 4th order), showing the frequency components of signal intensity and their spatial position [7]. All parameters were normalized and put into a Matlab-based classification system based on fuzzy logic and cluster analysis. The diagram of both methods is shown in Fig.6. So far, statistical parameters mostly used for single-beam echosounder echo classification [1,3-5,6] were, for each ping, kurtosis, maximum, mean value, second-order moment from origin, skewness, standard deviation and minimum, calculated and normalized. This set of features was divided into 3 classes during fuzzy-logic cluster analysis. Each data point belongs to a cluster to some degree specified by a membership grade; after many iterations, the optimal centers of the clusters are obtained and the data set is classified for the assigned number of classes.
Fig.6. Classification algorithm.
Fig.7 shows classification result based on wavelet energy features. A portion of an echogram is shown with a line beneath representing 3 classes: bare bottom, medium-high algae (up to 0.6 m) and very high algae (over 0.6 m). These results were validated with visual biological inspection. This kind of parameters allows avoiding misclassification of muddy bottoms as algae-covered, recognizing mud instead as a bare bottom. Similar results are obtained from habitats discrimination characterized by statistical features (Fig. 8). The same 3 classes were used as previously and classification efficiency is similar, the difference being about 7%. These misclassifications are mostly between bare bottom and low algae, especially at higher depth. Simultaneous biological samples were taken from 4 points. They confirm the acoustical characterizations of the seafloor and gave input values for biomass estimation in selected areas. For now, the biomass of algae can be calculated from their spatial distribution, obtained from acoustical data, and the biological quantitative information from samples. The next step is to create methods for completely acoustically-based estimations.
Fig.7. Portion of an echogram with classification line. The dark part is a hard, rocky bottom, lighter rough shapes are
algae. The line beneath the echogram contains 3 colours for each class of data: black – bare bottom, green – high algae
(over 0.6m), yellow – medium-high algae (up to 0.6m).
Fig.8. Portion of an echogram with classification line based on statistical parameters. The dark part is a hard, rocky
bottom, lighter rough shapes are algae. The line beneath the echogram contains 3 colours for each class of data: black –
bare bottom, green – high algae (over 0.6m), yellow – medium-high algae (up to 0.6m).
Work on further analysis is in progress, but even now, these new algorithms give promising results and suggest SBES and MBES systems can be effectively used for mapping benthic habitats and support biological and ecological studies.
5 Discussion – Conclusion
The main goal of this project was to research the range of existence and biomass assessment of macrophytobentos using acoustical methods. Pre-processing and signal analysis allow to distinguish echoes from areas with and without algae what resulted in preliminary map of algae height and spatial distribution. Biomass estimation of algae could be done after finishing work on efficient algorithm based only on acoustical data and needs more biological samples from areas of interest. Using earlier experiences we chose wavelet and envelope parameters as input arguments for fuzzy logic cluster analysis classification. Genetic algorithms [5] were also used for clusters center optimization using mentioned parameters but long operating time and huge amount of data forced us to live this method for farther work, although first results are very promising. More SBES and MBES signal processing and algorithms verification is needed to create comparable results.
W l t E F t (i) Σ C 2
CONTINUOUS WAVELET ANALYSIS
Cut Out Echo
Signal Input
STATISTICAL PREPROCESSING kurtosis, maximum, mean, second-order moment from origin, skewness, standard, deviation, minimum
Signal*Mother Wavelet (scaled (i) and shifted) Wavelet Coefficient (Ci) =
FEATURES EXTRACTION
FUZZY CLUSTERING
Pings No

Acknowledgments
We would like to thanks ARCFAC-026129-70 project for financial support, German Divers Team: Max Schwanitz (leader), Anita Flohr, Mark Olischläger, Peter Leopold for samples collecting, and the Ny-Alesund staff for their support, In-kind support from the European distributor of Imagenex Inc., Hydro-Product UK, Balk&Lindem Sonar5 Software for Echosounder Signal Analysis and Biosonics and Zbigniew Burczyński for Biosonics DTX, are all gratefully acknowledged.
References
[1] N.G. Pace, H. Gao, "Swathe Seabed Classification", IEEE Journal of Oceanic Engineering, 13(2), 83-90, (1988)
[2] Preston J.M., Christney A.C., Beran L.S., and Collins W.,T., “Statistical Seabed Segmentation-from images and echoes to objectiv clustering”, In Proc. of the 7th European Conference on Underwater Acoustics, ECUA 2004, Delft, The Netherlands, pp. 813- 818 (July 2004)
[3] J. Tegowski, A. Kruss, “Parametrical Analysis of Acoustic Echoes from Macrophytes”, In Proc. of the 7th European Conference on Underwater Acoustics, ECUA 2006, Carvoeiro, Portugal (June 2006)
[4] J.Tegowski, N. Gorska, Z. Klusek, “Statistical Analysis of acoustic echoes from underwater meadows in the eutrophick Puck Bay (Southern Baltic Sea)”, Aquatic Living Resources, 16, 215-221 (2003)
[5] S. Silva, Y.T. Tseng, “Classification of Seafloor Habitats using Genetic Programming”, GECCO’05, Late-Breaking Papers, Washington (June 2005)
[6] J. Simmonds, D. MacLenan, “Fisheries Acoustics”, Blackwell Publishing, Oxford (2005)
[7] J. Tegowski, “Acoustical Classification of Bottom Sediments”, Institute of Oceanology PAS, Sopot, Poland(2006)
[8] I.M. Parnum, P.J.W. Siwabessy, A.N. Gavrilov, “Identification of Seafloor Habitats in Coastal Shelf Waters Using a Multibeam Echosounder”, Proceedings of Acoustics 2004, Gold Coast, Australia(2004)
[9] Ph. Blondel, B.J. Murton, "Handbook of Seafloor Sonar Imagery", PRAXIS-Wiley & Sons, 314 pp. (1997)
[10] Komatsu T., C. Igarashi, K. Tatsukawa, S. Sultana, Y. Matsuoka and S. Harada, Use of multi-beam sonar to map seagrass beds in Otsuchi Bay on the Sanriku Coast of Japan, Aquatic Living Resources, 16 (2003), 223–230
[11] Heald G.J., N.G. Pace: An analysis of 1st and 2nd backscatter for seabed classification. Proc. ECUA, 649-654 (1996), Heraklion (1996)