Estimation of Internal Phosphorus Loading … of Internal Phosphorus . Loading Contributions to the...
42
Estimation of Internal Phosphorus Loading Contributions to the Lake of the Woods, Minnesota 01 February, 2012 William F. James ERDC Eau Galle Aquatic Ecology Laboratory W. 500 Eau Galle Dam Road Spring Valley, Wisconsin 54767 1
Transcript of Estimation of Internal Phosphorus Loading … of Internal Phosphorus . Loading Contributions to the...
Estimation of Internal Phosphorus Loading Contributions to the
Lake of the Woods, Minnesota
01 February, 2012
William F. James ERDC Eau Galle Aquatic Ecology Laboratory
W. 500 Eau Galle Dam Road Spring Valley, Wisconsin 54767
1
SUMMARY
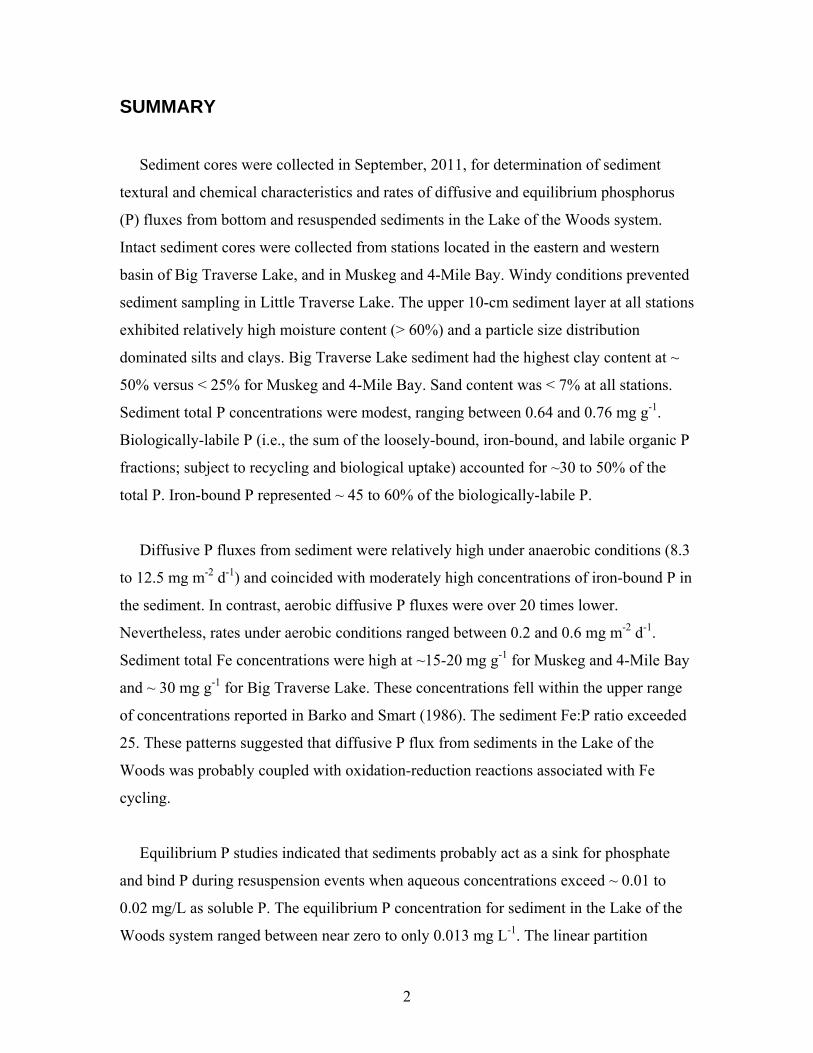
Sediment cores were collected in September, 2011, for determination of sediment
textural and chemical characteristics and rates of diffusive and equilibrium phosphorus
(P) fluxes from bottom and resuspended sediments in the Lake of the Woods system.
Intact sediment cores were collected from stations located in the eastern and western
basin of Big Traverse Lake, and in Muskeg and 4-Mile Bay. Windy conditions prevented
sediment sampling in Little Traverse Lake. The upper 10-cm sediment layer at all stations
exhibited relatively high moisture content (> 60%) and a particle size distribution
dominated silts and clays. Big Traverse Lake sediment had the highest clay content at ~
50% versus < 25% for Muskeg and 4-Mile Bay. Sand content was < 7% at all stations.
Sediment total P concentrations were modest, ranging between 0.64 and 0.76 mg g-1.
Biologically-labile P (i.e., the sum of the loosely-bound, iron-bound, and labile organic P
fractions; subject to recycling and biological uptake) accounted for ~30 to 50% of the
total P. Iron-bound P represented ~ 45 to 60% of the biologically-labile P.
Diffusive P fluxes from sediment were relatively high under anaerobic conditions (8.3
to 12.5 mg m-2 d-1) and coincided with moderately high concentrations of iron-bound P in
the sediment. In contrast, aerobic diffusive P fluxes were over 20 times lower.
Nevertheless, rates under aerobic conditions ranged between 0.2 and 0.6 mg m-2 d-1.
Sediment total Fe concentrations were high at ~15-20 mg g-1 for Muskeg and 4-Mile Bay
and ~ 30 mg g-1 for Big Traverse Lake. These concentrations fell within the upper range
of concentrations reported in Barko and Smart (1986). The sediment Fe:P ratio exceeded
25. These patterns suggested that diffusive P flux from sediments in the Lake of the
Woods was probably coupled with oxidation-reduction reactions associated with Fe
cycling.
Equilibrium P studies indicated that sediments probably act as a sink for phosphate
and bind P during resuspension events when aqueous concentrations exceed ~ 0.01 to
0.02 mg/L as soluble P. The equilibrium P concentration for sediment in the Lake of the
Woods system ranged between near zero to only 0.013 mg L-1. The linear partition
2
coefficient (kd) was high (~700 to 3,200 L kg-1), suggesting a high buffering capacity for
soluble P during P disequilibrium (i.e., deviations from the equilibrium P concentration).
Binding sites on sediment particles were also undersaturated with respect to P, as
suggested by Langmuir isotherm analysis.
Simulated resuspension experiments indicated that sediment critical shear stress (i.e.,
force required to initiate sediment resuspension; dynes cm-2) was relatively low (1.3 - 2.3
dynes cm-2), indicating a high potential for resuspension during wind-generated shear
stress. Soluble P concentrations in the overlying water column were ~ 0.020 mg L-1
during simulated resuspension and close to the independently measured equilibrium P
concentration.
OBJECTIVES
The objectives of this investigation were to quantify potential sources of internal
phosphorus (P) loading from sediments in the Lake of the Woods, Minnesota. These
sources included diffusive P fluxes from deposited sediment and equilibrium P fluxes
from resuspended sediment. The results will be important in evaluating the overall P
budget of the lake complex.
APPROACH
Determination of sediment textural characteristics and biologically labile and
refractory phosphorus fractions
The objectives of this task were to quantify sediment textural characteristics and
biologically labile (i.e., subject to recycling) and refractory (i.e., low recycling potential
and subject to burial) P fractions for sediment samples collected in Big Traverse Lake,
Muskeg Bay, and 4-Mile Bay of the Lake of the Woods (Figure 1). An intact sediment
core was collected at each station for determination of sediment moisture content, bulk
density, organic matter content, and particle size distribution (sand, ≥ 63µ; silt, < 63 µ
3
and ≥ 2 µ; clay, < 2 µ) in the upper 10-cm layer. A gravity corer (Aquatic Research
Instruments; Hope, ID), equipped with an acrylic core liner (6.5-cm ID and 50-cm
length), was used to collect sediment. A known volume of sediment was dried at 105 oC
for determination of moisture content and sediment density and burned at 550 oC for
determination of loss-on-ignition organic matter (Håkanson and Jansson 2002). The
percentages of sand (> 63 μ), silt (<63 μ and > 2 μ), and clay (<2 μ) were estimated using
settling columns and pipette techniques (Plumb 1981).
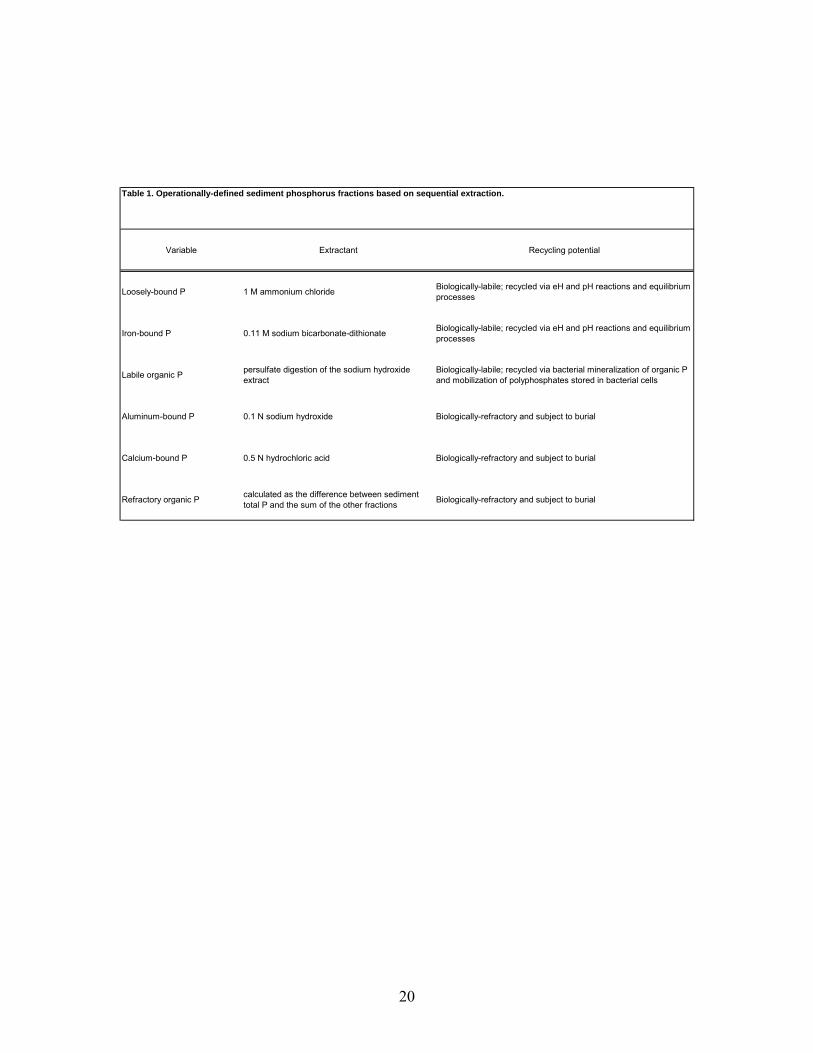
Sequential P fractionation was conducted according to Hieltjes and Lijklema (1980),
Psenner and Puckso (1988), and Nürnberg (1988) for the determination of ammonium-
chloride-extractable P (loosely-bound P), bicarbonate-dithionite-extractable P (i.e., iron-
bound P), sodium hydroxide-extractable P (i.e., aluminum-bound P), and hydrochloric
acid-extractable P (i.e., calcium-bound P; Table 1). A subsample of the sodium
hydroxide extract was digested with potassium persulfate to measure nonreactive sodium
hydroxide-extractable P (Psenner and Puckso 1988). Labile organic P was calculated as
the difference between reactive and nonreactive sodium hydroxide-extractable P.
Refractory organic P was estimated as the difference between sediment total P and the
sum of the other measured fractions.
The loosely-bound and iron-bound P fractions are readily mobilized at the sediment-
water interface under anaerobic conditions that result in desorption of P from bacterially-
reduced iron compounds (i.e., Fe+3 to Fe+2) in the sediment and diffusion into the
overlying water column (Mortimer 1971, Boström 1984, Nürnberg 1988). The sum of the
loosely-bound and iron-bound P fractions is referred to as redox-sensitive P (i.e., the P
fraction that is active in P release under anaerobic and reducing conditions). In addition,
labile organic P can be converted to soluble P via bacterial mineralization (Jensen and
Andersen 1992) or hydrolysis of bacterial polyphosphates to soluble phosphate under
anaerobic conditions (Gächter et al. 1988; Gächter and Meyer 1993; Hupfer et al. 1995).
The sum of redox-sensitive P and labile organic P is collectively referred to a
biologically-labile P. This fraction is generally active in recycling pathways that result in
exchanges of phosphate from the sediment to the overlying water column and potential
4
assimilation by algae. In contrast, aluminum-bound, calcium-bound, and refractory
organic P fractions are more chemically inert and subject to burial rather than recycling.
Additional sediment was dried and ground for determination of total P, total iron (Fe),
total manganese (Mn), and total calcium (Ca; expressed as mg/g dry mass). Samples for
total P were digested with red mercuric oxide under acidic conditions prior to
colorimetric analysis. For metals, sediment was digested with nitric acid, hydrochloric
acid, and peroxide (30%) and analyzed using atomic absorption spectroscopy (EPA
Method 3050B).
Diffusive phosphorus flux from deposited sediment
Methods for determining rates of diffusive P flux from intact sediment cores were
according to James et al. (1995). Six replicate cores were collected at each station for
measurement of rates of P release under aerobic (3 replicates) and anaerobic (3 replicate)
conditions. The core liners, containing both sediment and overlying water, were
immediately sealed with stoppers and stored in protective carrying cases that were cooled
during transport to the laboratory. Additional lake water was collected for later
incubation with the sediment.
In the laboratory, sediment cores were carefully drained of overlying water and the
upper 10 cm of sediment was transferred intact to a smaller acrylic core liner (6.5-cm dia
and 20-cm ht) using a core extruder. The additional lake water was filtered through a
glass fiber filter (Gelman A-E) and 300 mL was siphoned onto the sediment contained in
the small acrylic core liner without causing sediment resuspension. Sediment incubation
systems consisted of the upper 10-cm of sediment and filtered overlying water contained
in acrylic core liners that were sealed with rubber stoppers. The sediment incubation
systems were placed in a darkened environmental chamber and incubated at 20oC. The
oxidation-reduction environment in the overlying water of each system was controlled by
5
gently bubbling either air (oxic or aerobic) or nitrogen (anoxic or anaerobic) through an
air stone placed just above the sediment surface. Bubbling action insured complete
mixing of the water column but did not disrupt the sediment. Anoxic conditions were
verified using a dissolved oxygen electrode.
Water samples for soluble reactive phosphorus (SRP) were collected from the center
of each sediment incubation system using an acid-washed syringe and immediately
filtered through a 0.45 µm membrane syringe filter. The water volume (8 mL) removed
from each system during sampling was replaced by addition of filtered lake water
preadjusted to the proper oxidation-reduction condition. These volumes were accurately
measured to account for dilution effects. SRP was determined colorimetrically using the
ascorbic acid method (APHA 2005). Rates of diffusive P flux from deposited sediment
(mg m-2 d-1) were calculated as the linear change in concentration in the overlying water
divided by time and the area of the incubation core liner.
Equilibrium phosphorus characteristics
For each station, wet sediment subsamples (500 mg L-1 dry weight equivalent) were
subjected to soluble P (as KH2PO4) standards ranging from 0 to 1.0 mg L-1 for
examination of P adsorption and desorption after 24 h of exposure. Water obtained from
the Lake of the Woods and filtered through a glass fiber filter (Gelman A-E) was used for
preparing the P standards to maintain ionic composition. Centrifuge tubes (conical 50 mL
capacity) containing sediment and P-amended water were shaken uniformly in a
darkened environment at a temperature of ~ 20 oC, then filtered and analyzed for SRP
(APHA 2005).
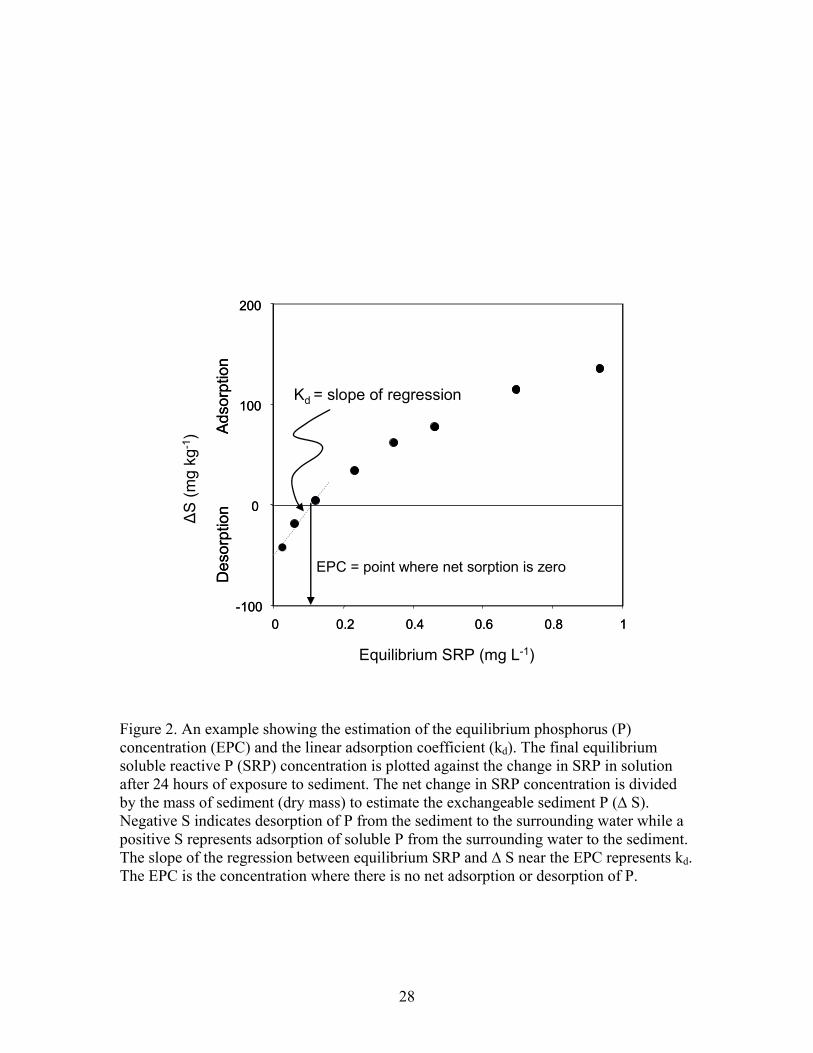
The change in SRP mass (i.e., initial SRP - final SRP; mg) after 24 h of exposure was
divided by the dry mass equivalent of the sediment to determine the mass of P desorbed
or adsorbed (S; mg P kg-1 sediment). These data were plotted as a function of the final
equilibrium SRP (i.e., the SRP concentration after 24 h of exposure) to determine the
linear adsorption coefficient (kd; L kg-1) and the equilibrium P concentration (EPC; mg P
6
L-1; the point where net sorption is zero; Froelich 1988). The kd and EPC were calculated
via regression analysis (SAS 1994) from linear relationships between final SRP
concentration and the quantity of P adsorbed or desorbed at low equilibrium
concentrations. An example of kd determination is shown in Figure 2.
Equilibrium data were also fitted to various Langmuir and Freundlich sorption models
using the spreadsheet developed by Bolster and Hornberger (2007) to estimate a P
sorption maximum for sediment (Smax; the maximum amount of P that can be adsorbed to
binding sites on sediment surfaces). Models in the Bolster and Hornberger spreadsheet
analysis include the traditional Langmuir, a Langmuir-Freundlich, a 2-surface layer
Langmuir, and the Freundlich relationships. The degree of P saturation (DSP; %) for
sediments collected in Lake of the Woods was calculated as the redox-P fraction divided
by Smax estimated from the Bolster and Hornberger spreadsheet. The redox-P was chosen
as a surrogate measure of the sediment native exchangeable P pool.
Phosphorus equilibrium concentrations were also determined independently using a
water extraction procedure. Water-soluble P was extracted for 1 h using 10 mL of local
P-free tap water (to simulate ionic composition) to 1 g dry mass equivalent of wet
sediment (modification of Pierzynski 2000). Extractions were centrifuged at 500 g and
filtered through a 0.45 μ membrane filter for analysis of SRP using standard colorimetric
methods (APHA 2005).
Equilibrium P fluxes during sediment resuspension
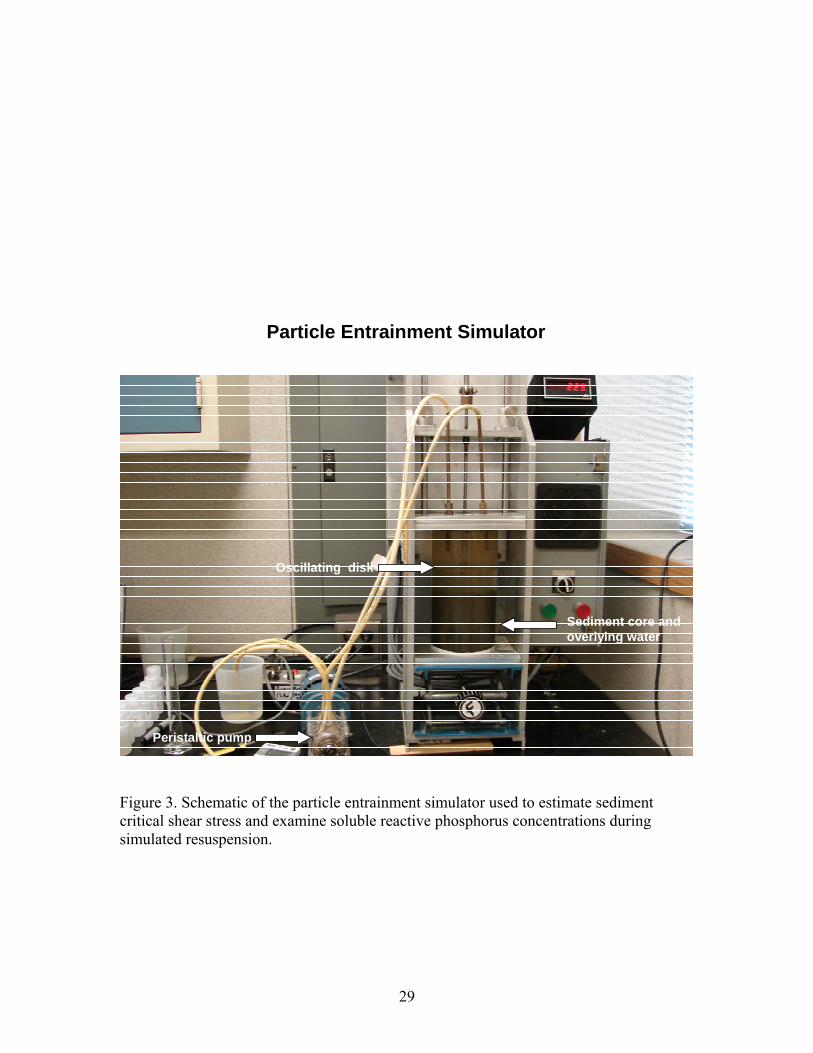
Additional intact sediment cores (10 cm in depth) were collected at each station using
a 15 by 15 cm box corer (Wildco Wildlife Supply Co., Saginaw, Michigan) for laboratory
simulation of sediment resuspension and P equilibrium over a range of shear stresses. A
vertically oscillating particle entrainment simulator (PES) developed by Tsai and Lick
(1986) was used to subject intact cores to various shear stresses (Figure 3). The PES was
programmed to oscillate an acrylic perforated disk above the sediment interface in a
stepwise manner from 0 to ~ 4 dynes cm-2 at 10-min intervals. At 8 min into each cycle, a
7
50 mL sample from the overlying water column was collected using a peristaltic pump.
Water removed as a result of sampling was simultaneously replaced with filtered lake
water using the pump. Samples were analyzed for total suspended sediment, turbidity,
and SRP using standard analytical procedures (APHA 2005). Changes in SRP as a
function of shear stress were evaluated to estimate soluble P mass transfer and
equilibrium SRP due to wind-driven sediment resuspension. The critical bottom shear
stress (τc; dynes cm-2) of sediments was estimated as the inflection point where TSS and
turbidity increased in the water column above background conditions. The inflection
point was interpreted using a segmented linear-linear regression analysis (NLIN; SAS
1994). Natural forces such as wave activity and flow velocity causing a shear stress (τ) at
the sediment interface that is greater than τc will result in sediment resuspension (τ > τc).
This information will be useful for future modeling of potential sediment resuspension in
the system.
RESULTS
Sediment Characteristics
Moisture content in the upper 10-cm layer exceeded 75% and density was relatively
low at stations in Big Traverse Lake and Muskeg Bay, indicating fine-grained, flocculent
sediment (Table 2). In contrast, sediment moisture content was much lower at ~ 60%,
with correspondingly higher sediment density, in 4-Mile Bay compared to the other
stations in the Lake of the Woods. Sediment organic matter content was moderately low,
ranging between ~ 11 and 16%. The particle size distribution was co-dominated by silt
(~48%) and clay (~ 50%) in Big Traverse Lake while silt represented 70% of the particle
size range versus 25% clay in Muskeg Bay. For 4-Mile Bay, the silt fraction accounted
for ~ 80% and the clay fraction represented ~ 14% of the sediment particle size
distribution. The sand fraction constituted less than 8% of the particle size distribution at
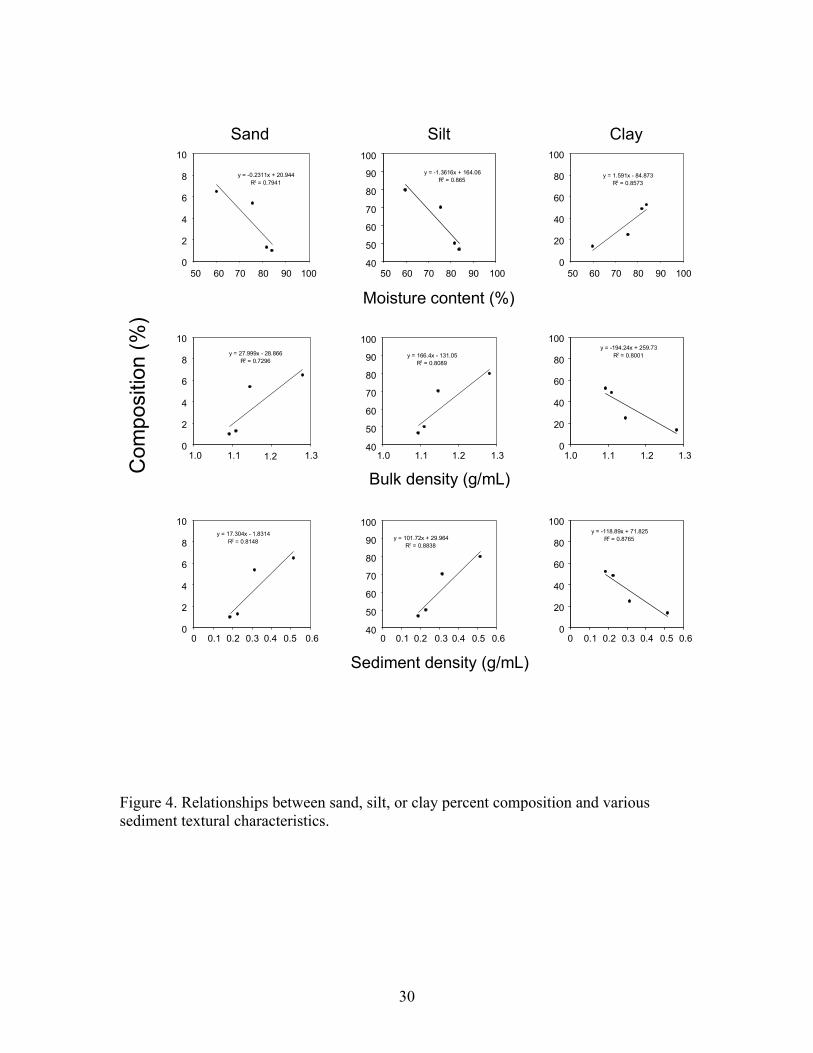
all stations. Overall, there were strong relationships between sediment moisture content
and density versus the percent particle size distribution (Figure 4). Sand and silt
8
percentages decreased, while the clay percentage increased, as a function of higher
moisture content and low density.
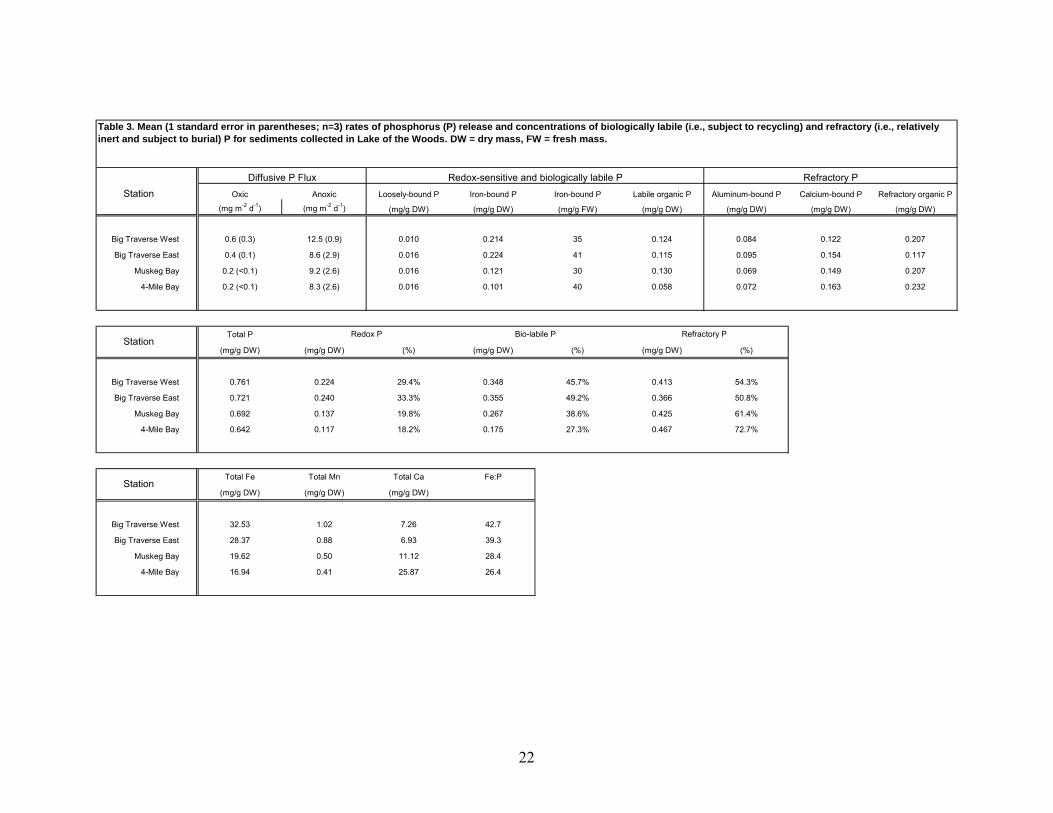
In general, sediment total P concentrations for the upper 10-cm layer were modest at
the four stations in the Lake of the Woods system (Table 3). Sediments collected in Big
Traverse Lake exhibited total P concentrations of ~ 0.7 mg g-1, while Muskeg and 4-Mile
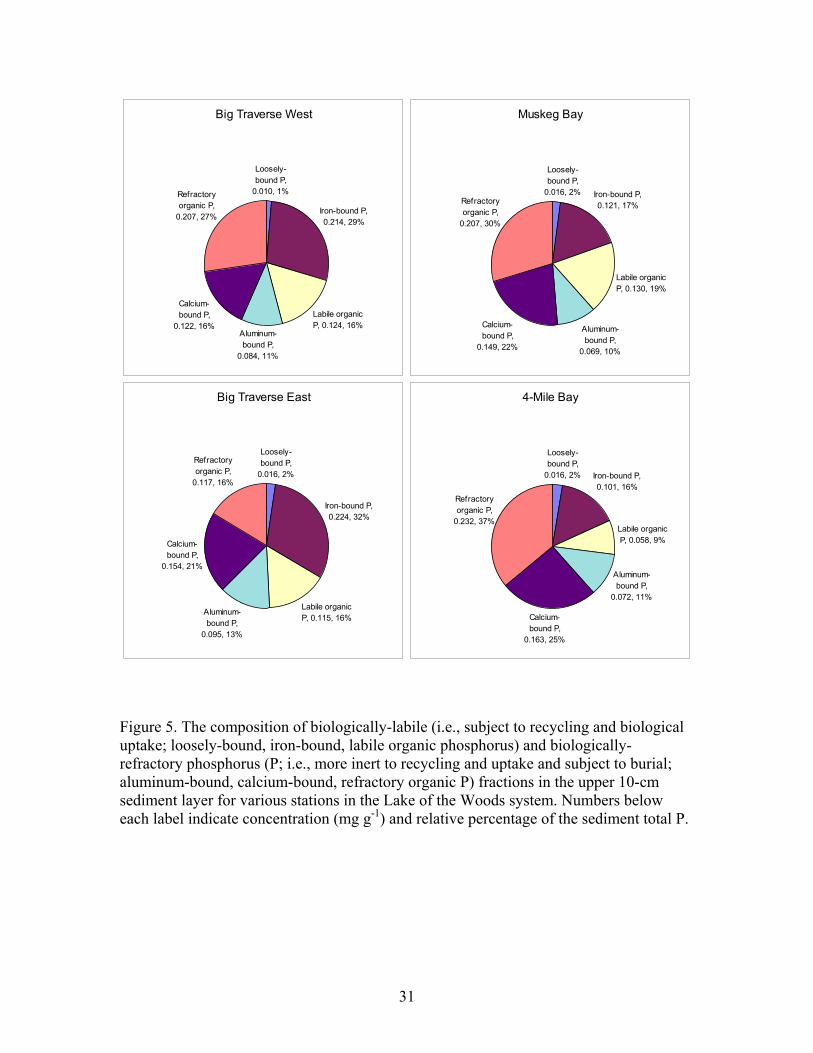
Bay sediments ranged between 0.64 and 0.69 mg g-1 total P. Biologically-labile P (i.e.,
the sum of the loosely-bound, iron-bound, and labile organic P fractions) accounted for
27 to 49% of the total sediment P (Figure 5). Muskeg Bay sediments exhibited the lowest
percentage of biologically-labile P while nearly half of the P composition of Big Traverse
Lake sediments was biologically-labile (Table 3). Redox-sensitive P (i.e., the sum of the
loosely-bound and iron-bound P fractions) accounted for greater than 50% of the
biologically-labile P. In contrast, labile organic P represented ~ 32 to 49% of this
fraction. The iron-bound P fraction dominated redox-sensitive P (Figure 5) and sediments
from Big Traverse Lake generally exhibited highest concentrations of this fraction at
~0.22 mg g-1 versus lower concentrations of ~ 0.11 mg g-1 for sediments in Muskeg and
4-Mile Bay (Figure 5). When normalized with respect to sediment fresh mass (i.e., a
reflection of sediment wet volume concentration), iron-bound P concentrations were
relatively high, ranging between 20 and 40 μg g-1, and fell within the upper range of
concentrations reported in Nürnberg (1988) for a variety of North American lake
sediments. Biologically-refractory sediment P represented greater than 50% of the
sediment total P composition at all stations (Table 3). Refractory organic P accounted for
the much of this fraction, followed by calcium-bound and aluminum-bound P.
Total sediment metals concentrations in the Lake of the Woods system indicated that
iron was high relative to phosphorus, resulting in Fe:P ratios that ranged between ~ 25
and 40. Sediment iron concentrations were highest in Big Traverse Lake at ~ 30 mg g-1
versus lower concentrations of 15-20 mg g-1 in Muskeg and 4-Mile Bay. Overall, these
concentrations were very similar to those measured in nearby Jessie and Swan Lakes,
Minnesota (James 2006, 2008). Sediment calcium concentrations were modest in the lake
9
system; however, they were 2 to 3 times higher in 4-Mile bay versus the other stations.
Total manganese concentrations ranged between 0.4 and 1.0 mg g-1.
Diffusive Phosphorus Fluxes
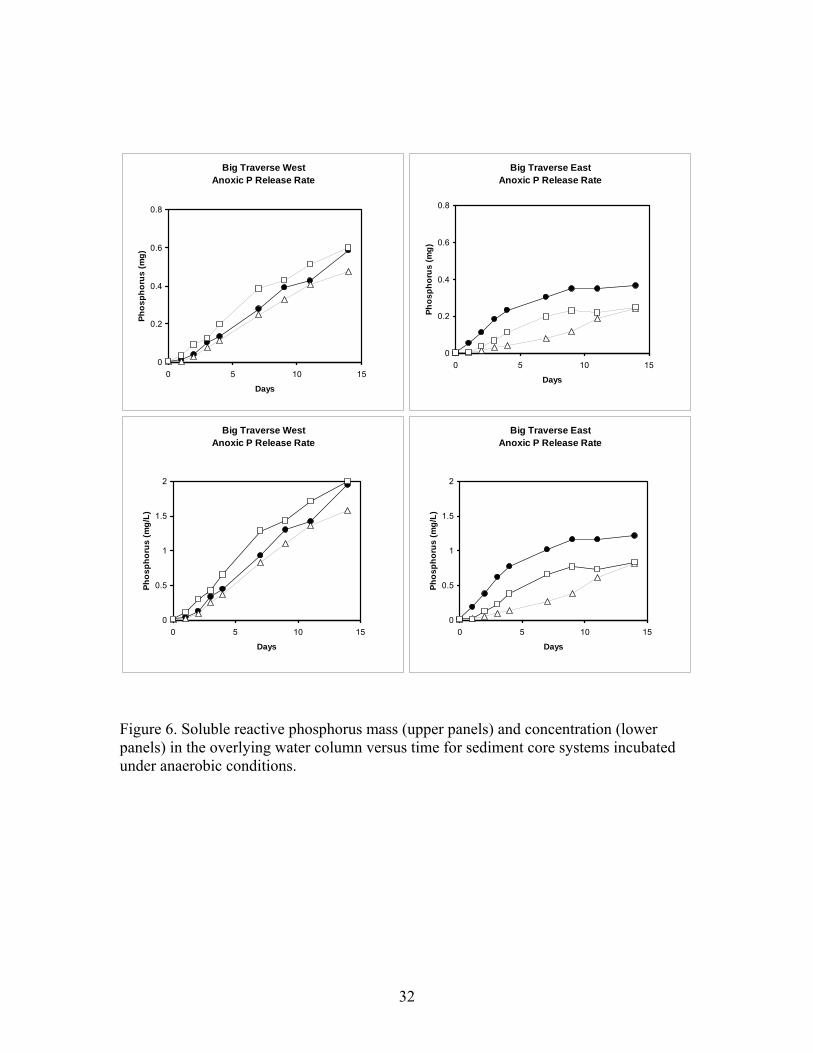
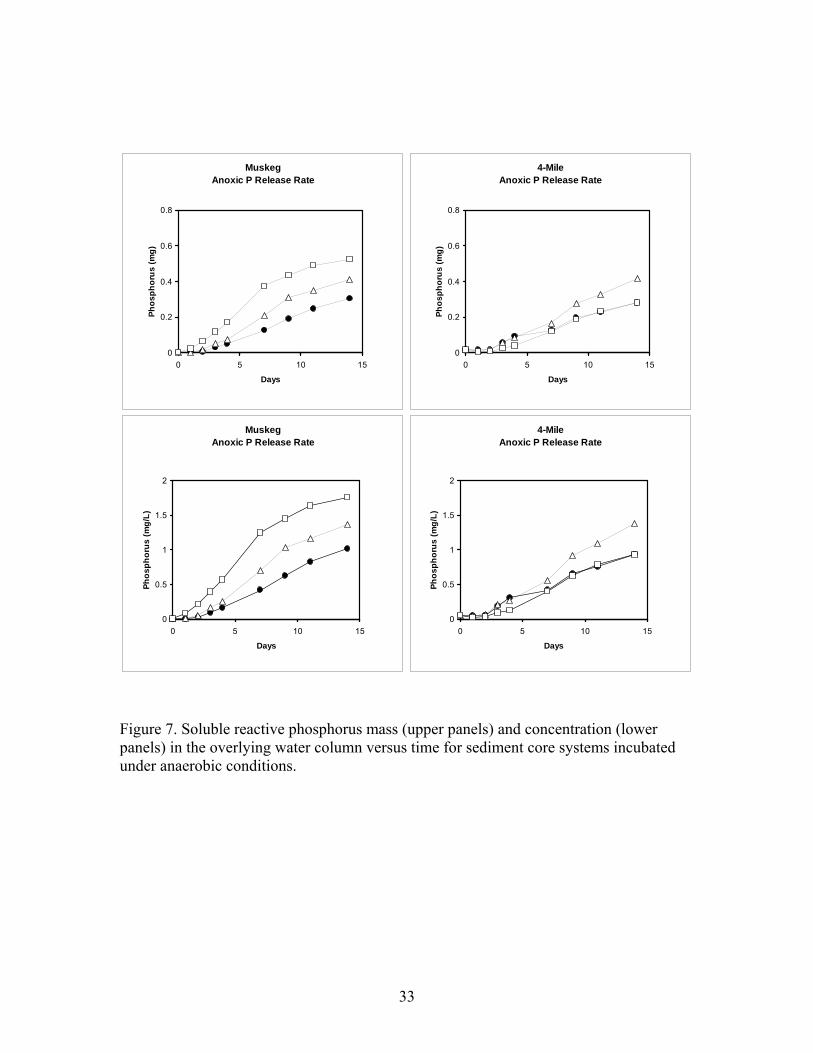
P (as SRP) mass increased rapidly in the overlying water column of replicate sediment
incubation systems subjected to anaerobic conditions (Figure 6 and 7; upper panels). P
increases were linear throughout the incubation period for sediment cores collected from
Big Traverse West and 4-Mile Bay. In contrast, P mass increased linearly over the first 4
to 7 days then exhibited a nonlinear pattern of less increase between days 7 and 14. This
pattern is not unusual and likely due to diminishing P concentration gradients at the
sediment-water interface that resulted in lower diffusive P fluxes over time. P
concentrations in the overlying water column generally approached or exceeded 1.0 mg/L
in all systems toward the end of the incubation period (Figures 6 and 7; lower panels).
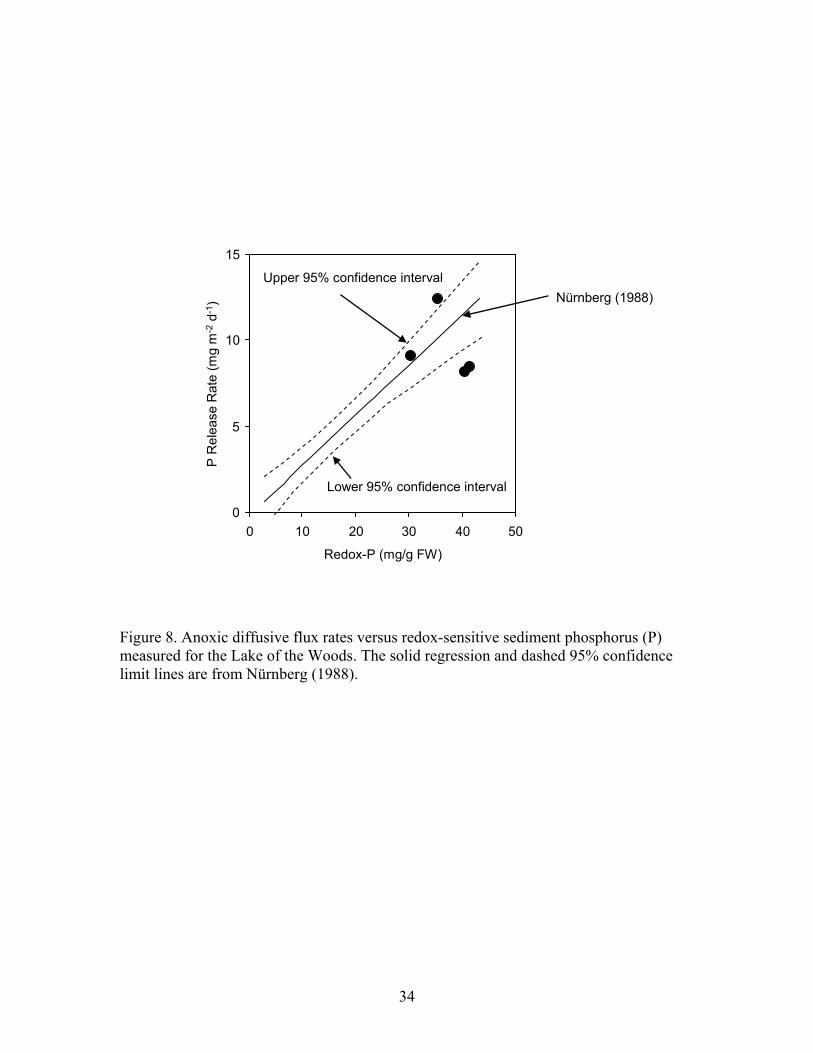
Mean rates of diffusive P flux under anaerobic conditions ranged between 8.3 and
12.5 mg m-2 d-1 (Table 3). These rates were high and fell within the high range of P fluxes
measured for eutrophic systems in North America (Figure 8; Nürnberg 1988). Sediment
collected from Big Traverse West exhibited the highest anoxic P release rate at 12.5 mg
m-2 d-1 (± 0.9 SE). Rates were similar at ~ 8.5-9.0 mg m-2 d-1 for sediment cores collected
from Big Traverse East, Muskeg Bay, and 4-Mile Bay.
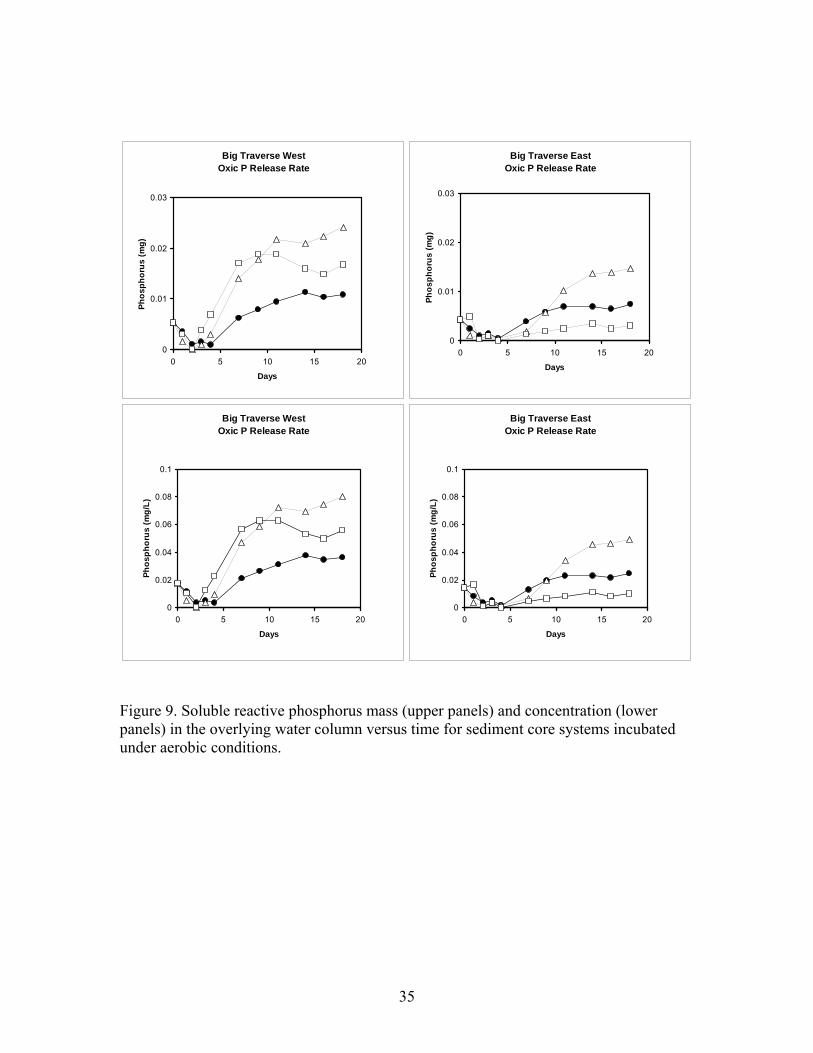
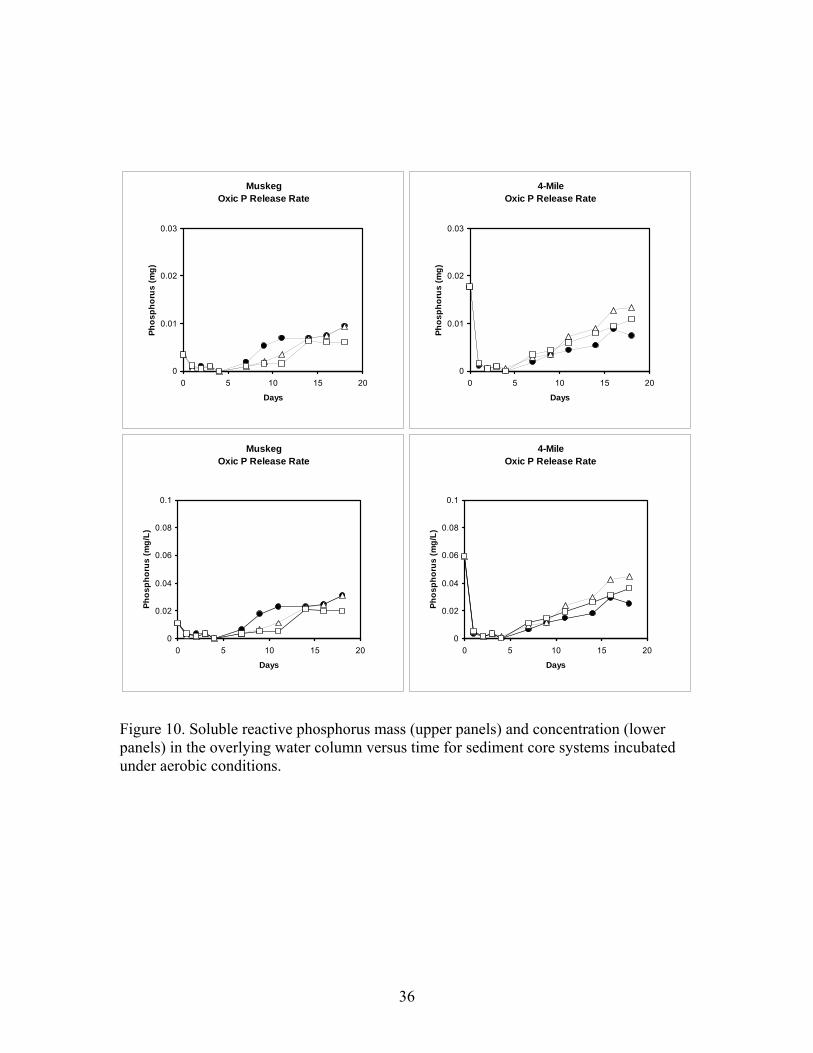
Under aerobic conditions, P mass increases in the overlying water column were much
less compared to sediment cores incubated under anaerobic conditions (Figure 9 and 10;
upper panels). In addition, P concentrations were an order of magnitude lower near the
end of the incubation period under aerobic versus anaerobic conditions (Figure 9 and 10;
lower panels). Nevertheless, P mass and concentrations increased linearly in the
overlying water column over the first 10 days of incubation, indicating some net P
diffusion out of the sediments and into the overlying water column even under aerobic
conditions. P declined from relatively low initial concentrations of ~ 0.02 mg L-1 to near
zero by day 2 then increased linearly until ~ day 10. This initial decline in concentration
10
may have been due to equilibration and adsorption of P onto the sediment surface during
initial aeration of the incubation systems (Penn et al. 2000). Although P increases were
much lower under aerobic conditions, concentrations approached 0.05 mg L-1 in nearly
all the systems by the end of the incubation period (Figure 9 and 10; lower panels).
Mean rates of diffusive P flux from sediments under aerobic conditions ranged
between ~ 0.2 and 0.6 mg m-2 d-1 (Table 3). Lake Traverse sediment exhibited the highest
aerobic diffusive P fluxes at 0.4 (±0.1 SE) and 0.6 (± 0.3 SE) mg m-2 d-1 for the East and
West station, respectively. By comparison, aerobic diffusive P fluxes were only 0.2 mg
m-2 d-1 for Muskeg and 4-Mile Bay. Although much lower compared to rates under
anaerobic conditions, aerobic diffusive P fluxes on the order of ~ 0.5 mg m-2 d-1 can
represent an important contribution to the P budget of these lakes.
Phosphorus Equilibrium Characteristics
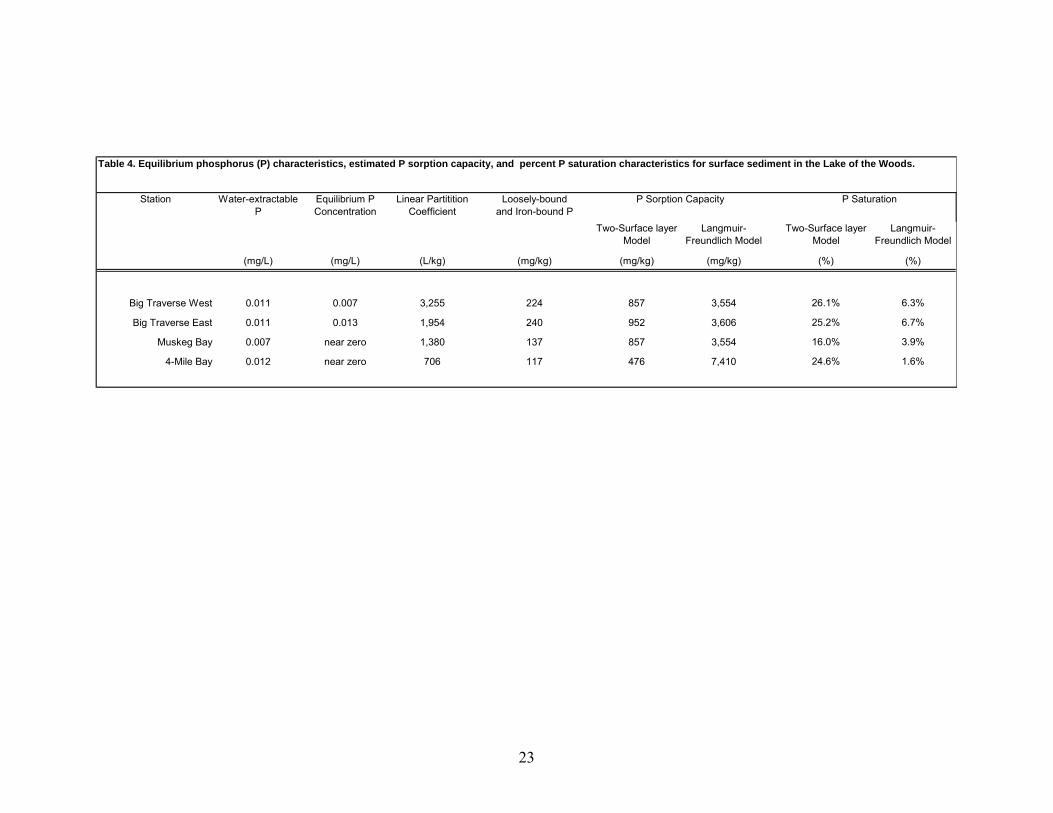
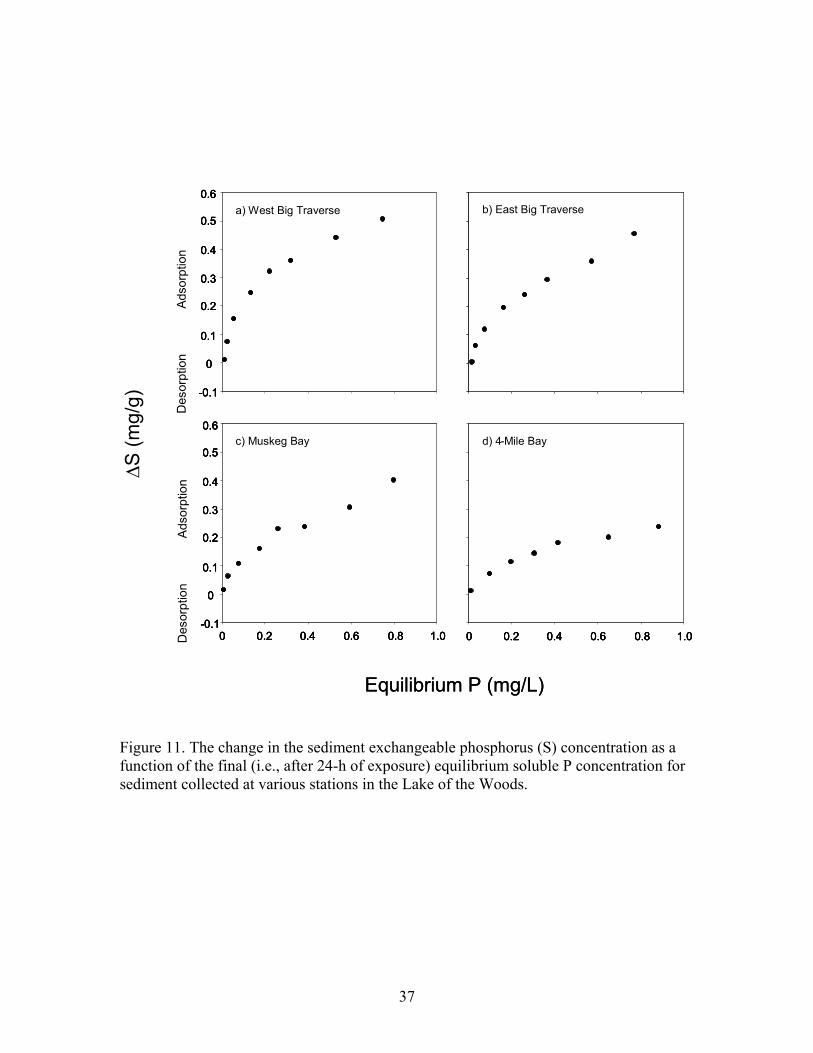
Overall, sediments from the Lake of the Woods exhibited undetectable P desorption
when subjected to low aqueous P concentrations (Figure 11). As aqueous P concentration
increased, sediments strongly adsorbed P from solution. This pattern suggested that
resuspended sediments are mostly likely a sink for phosphate and sequester P rather than
desorb it under conditions of P disequilibrium. The EPC (equilibrium P concentration)
was ~ 0.01 mg L-1 for Big Traverse Lake (Table 4) and similar to the measured SRP
concentration in the lake at the time of sediment collection in September. The equilibrium
P concentration for Muskeg and 4-Mile Bay was below detection limits (i.e., 0.002 mg L-
1). Similarly, water-extractable P concentrations were relatively low at ~0.010 mg L-1
(Table 4). The linear adsorption coefficient reflects the phosphate concentration required
to change the equilibrium P concentration by 1 mol L-1 (Froelich 1988). It was near 1000
L kg-1 or higher for all stations, suggesting that sediment can rapidly adsorb aqueous
phosphate in the water column with little change in the equilibrium P concentration (i.e.,
well buffered with respect to equilibrium P).
11
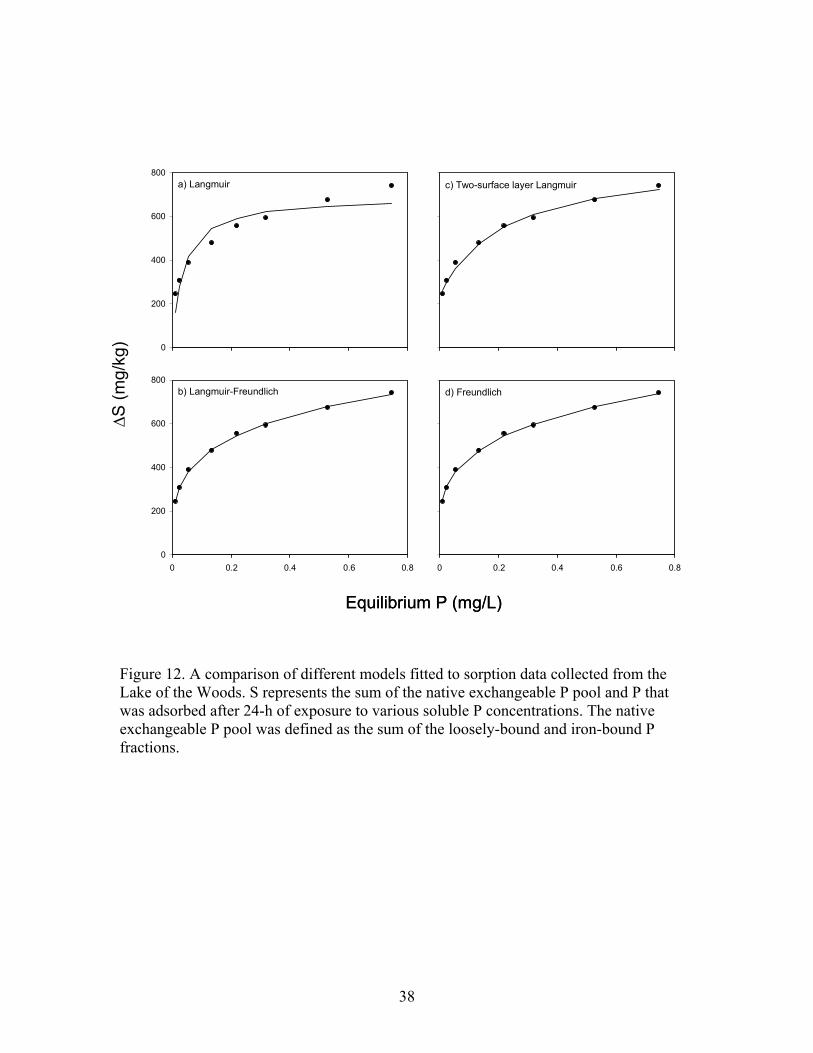
Patterns of P sorption by sediment did not appear to follow a linearized Langmuir
model that would indicate a P saturation maximum (i.e., a point at which all binding sites
are filled with P; Figure 12). Instead, P sorption tended to follow a Langmuir multi-
surface layer, a Langmuir-Freundlich, or Freundlich model in which binding is regulated
by P concentration in solution and by diffusion of P to interior sites on particles and
polymers (Figure 12). Assuming that the combined loosely-bound and iron-bound P
fraction approximated the exchangeable P pool of the sediment, the degree of P saturation
ranged from ~ 16 to 26% for the two-surface layer model (i.e., 224 mg/kg / 857 mg/kg
for Big Traverse West) to ~ 2 to 7% for the Langmuir-Freundlich model. These ranges
suggested that P saturation of binding sites on the sediments of the Lake of the Woods
was currently modest (Table 4).
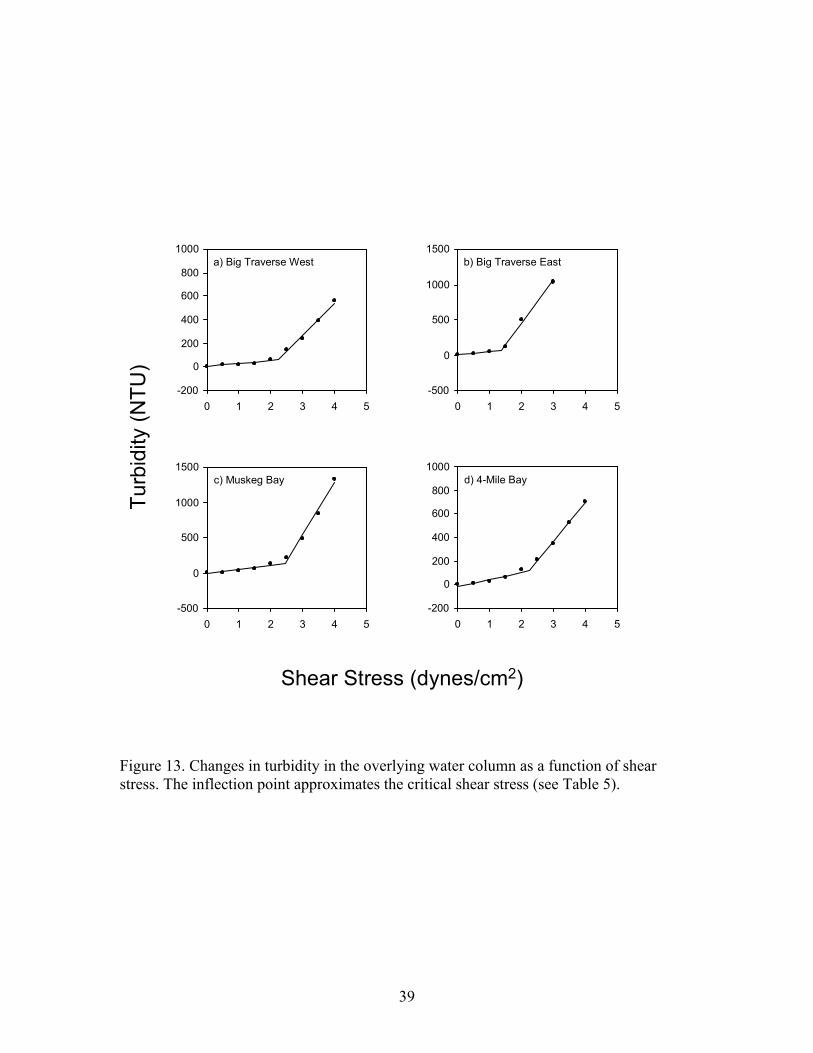
Phosphorus Dynamics during Simulated Sediment Resuspension
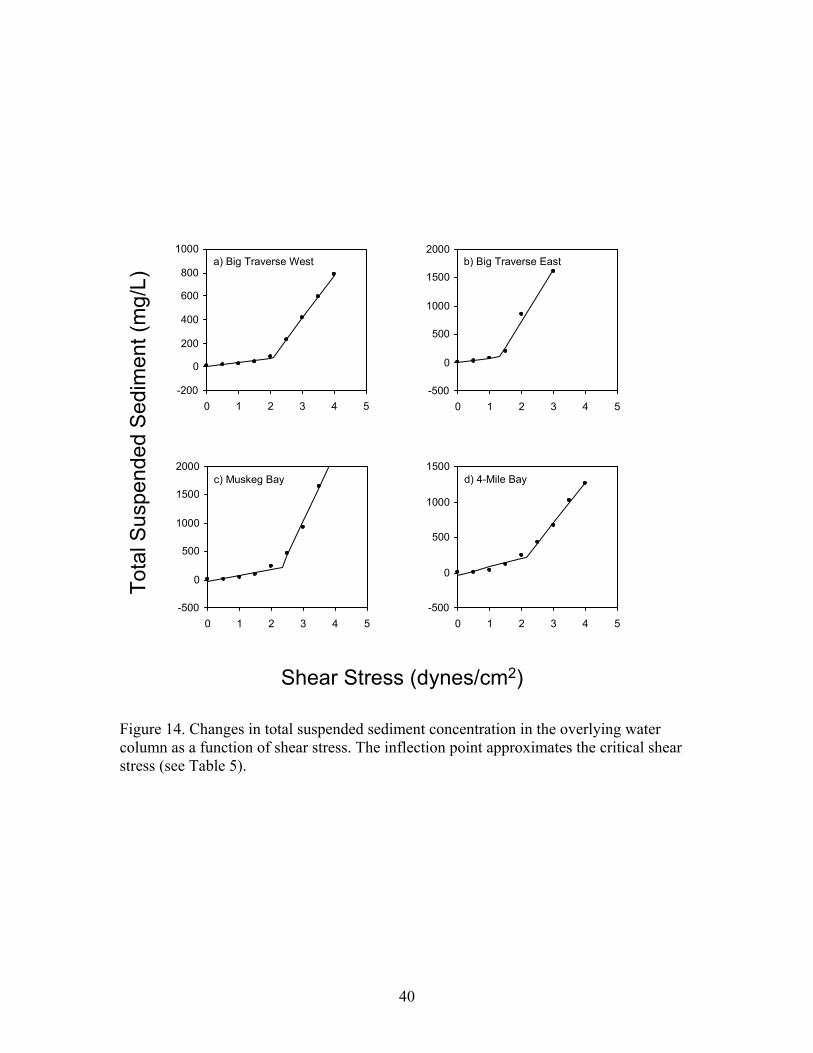
Turbidity and TSS concentrations were relatively low at shear stresses < ~ 1.5 dynes
cm-2 and increased substantially above this value for all sediments (Figure 13 and 14).
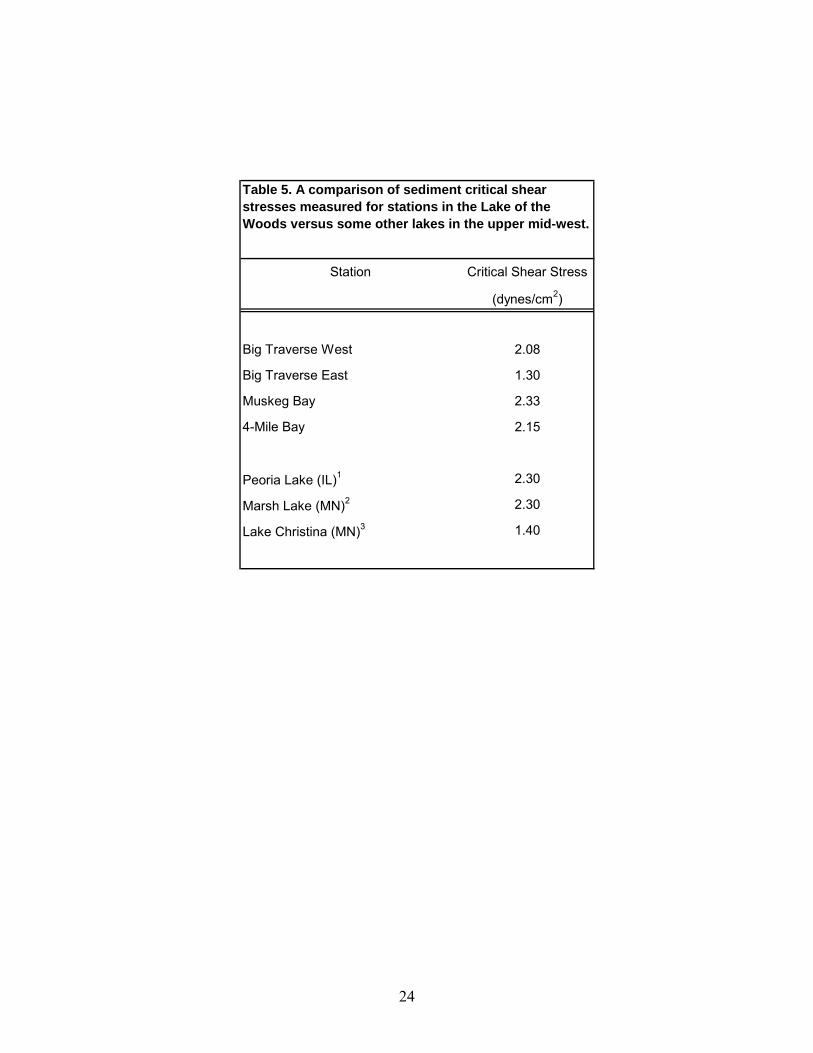
Big Traverse East sediment exhibited the lowest critical shear stress at 1.3 dynes cm-2
while the other stations ranged from ~ 2.1 to 2.3 dynes cm-2 (Table 5). Reasons for the
lower critical shear stress at Big Traverse East are not precisely known and variations in
sediment textural characteristics and particle size distribution did not appear to explain
the differences in critical shear stress. Perhaps differences in critical shear stresses were
due to variations in particle sorting and fine-scale (mm scale) gradients in sediment
properties at the sediment-water interface that were not captured from the composite 10-
cm sediment section used for analysis. Critical shear stresses for the Lake of the Woods
sediments also fell within ranges measured for some other nearby lakes and
impoundments that exhibit frequent sediment resuspension (Table 5).
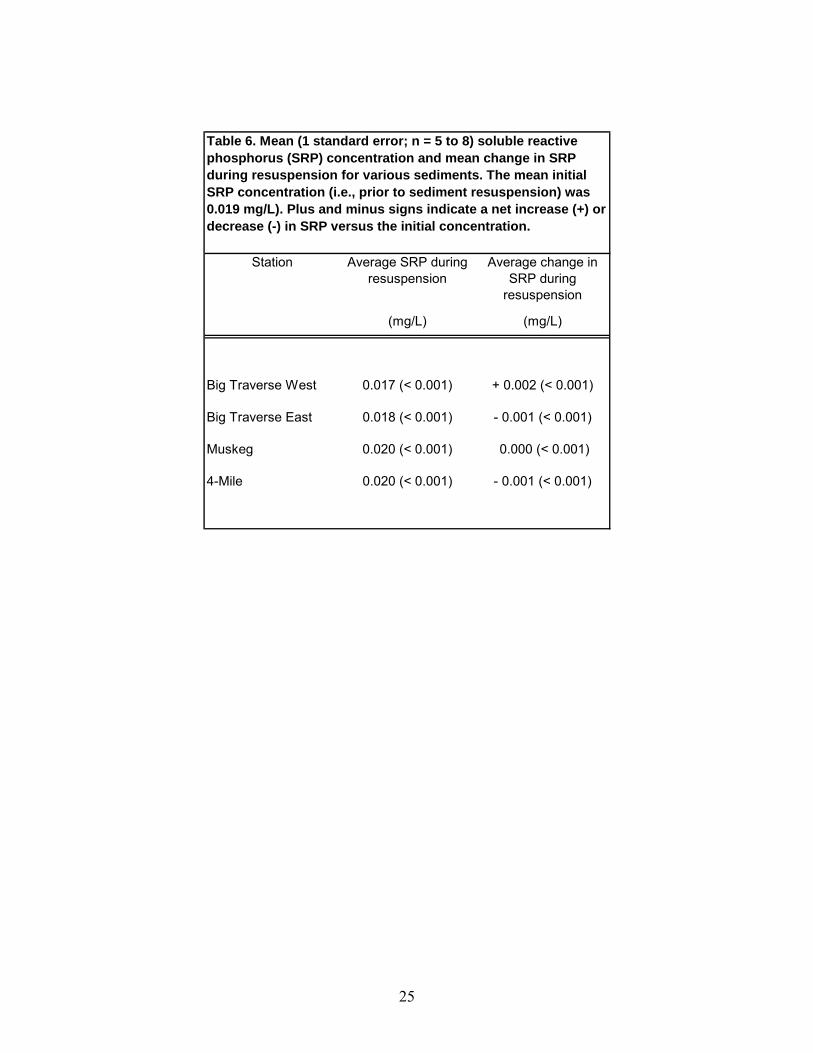
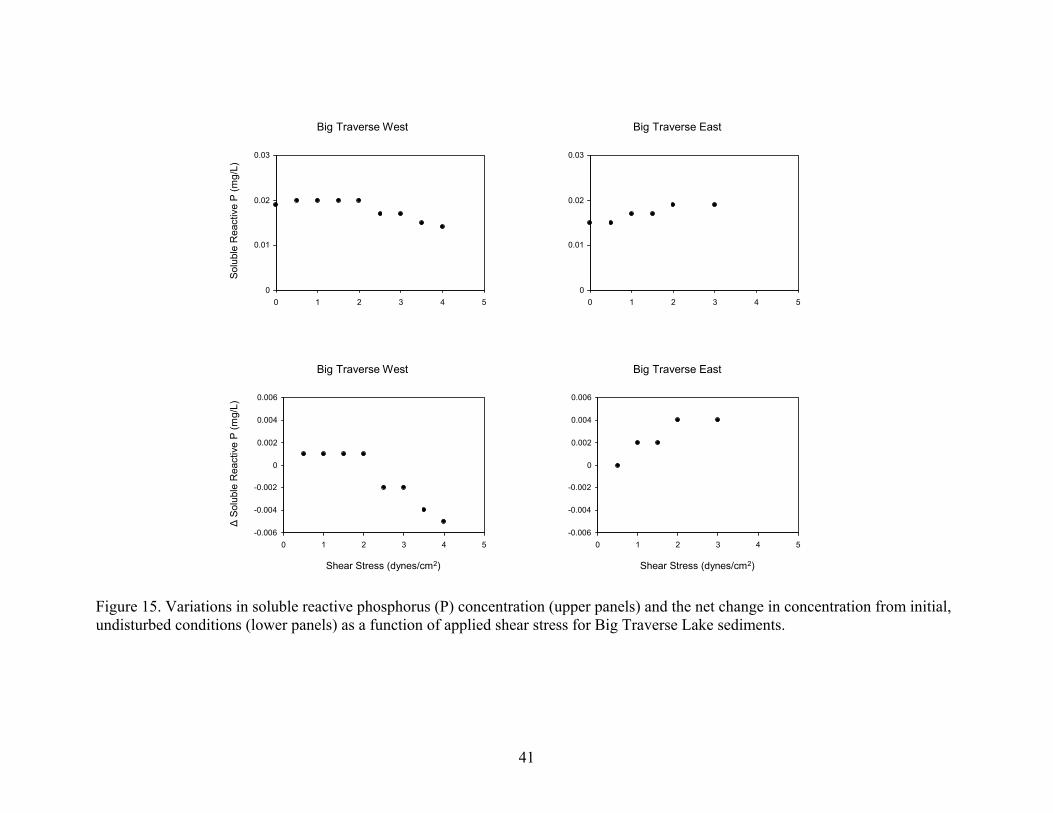
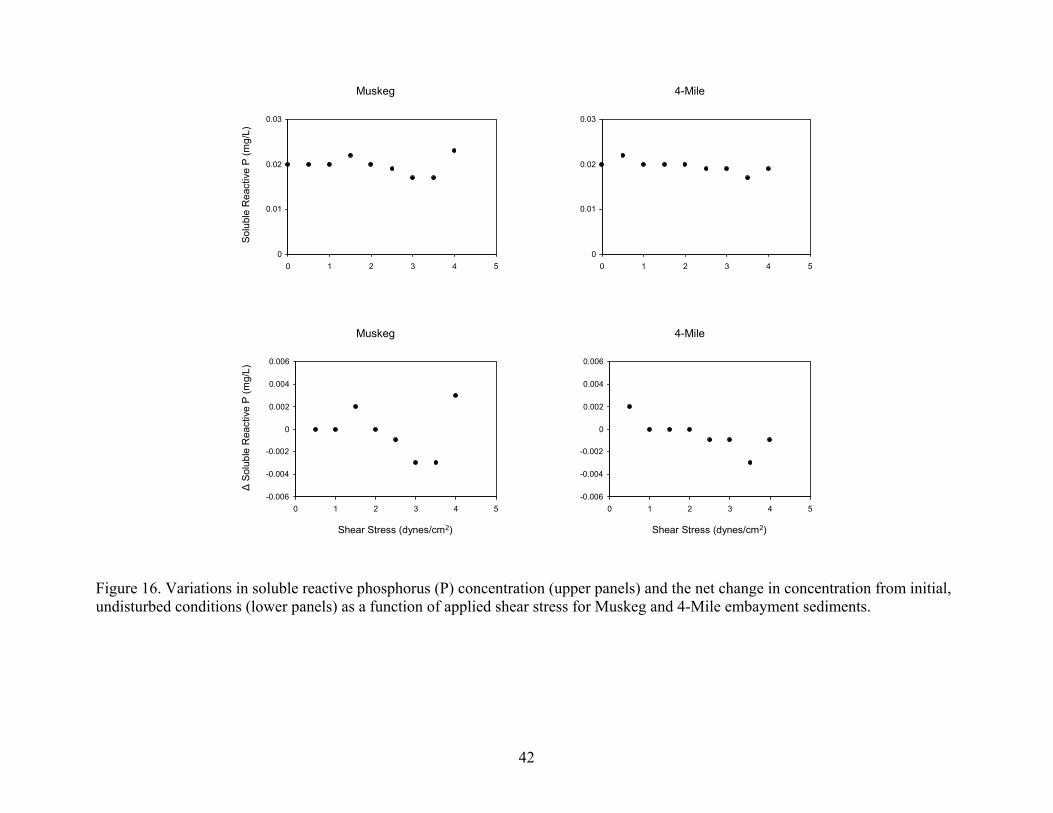
SRP concentrations in the overlying water column of sediment systems ranged
between ~ 0.015 and 0.020 mg L-1 before initiation of shear stress turbulence (Figures 15
and 16). The concentration generally declined as a function of sediment resuspension for
the Big Traverse West, Muskeg, and 4-Mile sediment systems. Net declines in SRP
12
concentration ranged between 0.002 and 0.005 mg L-1 in these systems. Notably, SRP
concentrations increased slightly during resuspension in the Big Traverse East sediment
system and the net increase in SRP concentration was ~ 0.004 mg L-1 at shear stresses of
2 to 3 dynes cm-2. SRP concentrations also increased at the greatest shear stress in the
Muskeg and 4-Mile Bay sediment systems. Overall, mean net SRP concentrations during
resuspension estimated over all shear stresses were 0.017 to 0.020 mg L-1 with negligible
net change in concentration from the initial 0.019 mg L-1 (Table 6). These general
patterns corroborated findings from the P equilibrium experiments and water-extractable
P determinations; namely, that the EPC achieved between resuspended sediment and the
surrounding water was relatively low.
DISCUSSION
Diffusive P fluxes were relatively high under anaerobic conditions and coincided with
moderately high concentrations of redox-sensitive sediment P. In contrast, aerobic
diffusive P fluxes were over 20 times lower. Sediment total Fe concentrations were high,
falling within the upper range of concentrations reported in Barko and Smart (1986), and
the sediment Fe:P ratio exceeded 25. These patterns suggested that diffusive P flux from
sediments in the Lake of the Woods was probably coupled with Fe cycling. Under
oxygenated conditions, Fe is in an oxidized state (Fe+3) as an Fe-oxyhydroxide
(Fe(OOH); solid precipitate) and strongly adsorbs phosphate, resulting in low diffusive P
flux from sediments (Mortimer 1971). Fe(OOH) becomes reduced to Fe+2 in conjunction
with bacterial metabolism under anaerobic conditions, resulting in desorption of
phosphate and much higher rates of diffusive P flux, as observed for the Lake of the
Woods sediments incubated under anaerobic conditions.
The high Fe:P ratio in the sediment also indicated that binding sites for P on Fe(OOH)
complexes were well below saturation and excess Fe(OOH) was available to efficiently
bind P in the oxidized microzone. Jensen et al. (1992) found a negative relationship
between diffusive P fluxes under aerobic conditions and the sediment Fe:P ratio (i.e.,
aerobic P fluxes decreased with increasing Fe:P ratio in the sediment) for a variety of
13
Danish lake sediments, suggesting that the sediment Fe:P ratio could be used as an
indicator to evaluate the binding capability for P under aerobic conditions. They
suggested that a higher Fe:P ratio reflected greater free sorption sites for P binding and
that a sediment Fe:P ratio of 10 to 15 was associated with regulation of diffusive P flux
from sediments under aerobic conditions.
Because the Lake of the Woods system is very large and shallow, frequent wind-
generated mixing probably resulted in oxygenated conditions in the bottom waters and
maintenance of an oxidized microzone at the sediment interface throughout the summer,
driving diffusive P flux primarily under aerobic conditions. Although aerobic P fluxes
were much lower versus those under anaerobic conditions, this source may, nevertheless,
be important in the P economy and should be considered in an overall P budget of the
system. A basin- or embayment-wide aerobic P flux for different areas of the system
could be estimated by multiplying the measured laboratory-derived P flux by sediment
areas characterized by fine-grained particle accumulation. These accumulation zones
could be characterized by moisture content, density, or grain-size compositional
characteristics (i.e., moisture content > 75%, sand composition < 10%, etc). Although
more labor intensive, estimates for incorporation into a P budget could also be derived
from distributional maps of sediment textural characteristics (moisture content, particle-
size distribution, etc) and relationships between sediment textural characteristics versus
diffusive P flux. A similar analysis was conducted by James and Larson (2008) for the
lower Minnesota River system. More data collection would be needed for this approach.
Water temperature, not considered in this research, probably also played an important
role in regulating sediment bacterial transformations and, thus, aerobic diffusive P fluxes.
For instance, rates would be expected to increase as bottom water temperature increases.
James and Barko (2004) found that rates increased exponentially as a function of
temperature for sediment collected in Lake Pepin, Upper Mississippi River. Future
research on diffusive P fluxes from sediment in the Lake of the Woods should address
temperature effects on rates.
14
Surficial sediments collected from stations in the Lake of the Woods were composed
primarily of silts and clays and exhibited a moderately low critical shear stress,
suggesting strong susceptibility to wind-generated resuspension. Indeed, Big Traverse
Lake, Muskeg, and 4-Mile Bays were very turbid during the September sampling period
in conjunction with very windy conditions and wave activity. Equilibrium studies
indicated that sediments probably act as a sink for phosphate and bind P during
resuspension events when aqueous concentrations exceed ~ 0.01 to 0.02 mg/L as soluble
P. This finding was supported by several factors: the Fe concentration and the Fe:P ratio
of the sediment was high, implying binding of soluble P onto Fe(OOH) complexes; P
binding sites were undersaturated with respect to an estimated Smax; the kd was high,
suggesting high buffering capability by resuspended sediment for soluble P; the
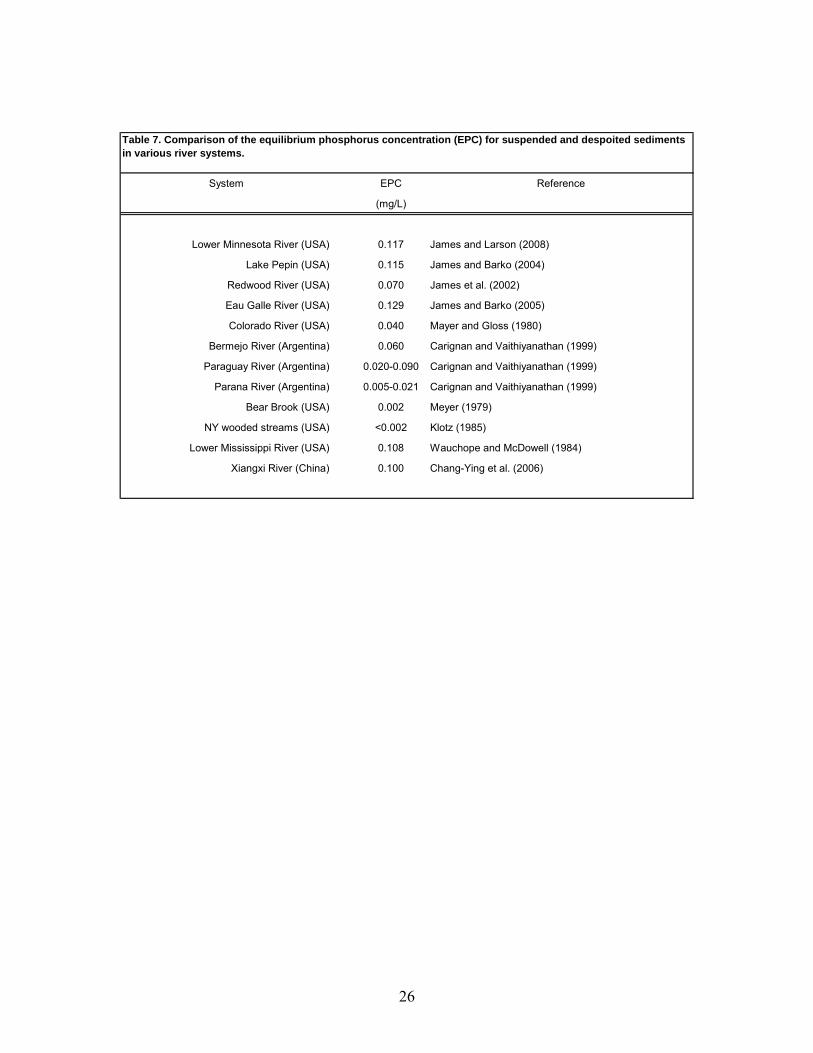
equilibrium P concentration was low compared to other systems that drain agriculturally-
managed watersheds (Table 7); and SRP tended to declined or exhibit minor net change
as a function of resuspended sediment concentrations and applied shear stress in
laboratory sediment systems. In particular, these patterns indicated that periods of
sediment resuspension in the Lake of the Woods probably control a relatively low
aqueous soluble P concentration. However, equilibrium P flux during resuspension
represents a potential P source for algal uptake and growth and could be significant when
ambient SRP concentrations fall below the EPC. For instance, P desorption from
resuspended sediment might occur during a wind event that was preceded by periods
where ambient SRP was near zero due to an algal bloom.
Future P budgetary and modeling analyses probably need to consider the role of
sediment resuspension in regulating total P concentrations in the water column of the
Lake of the Woods and potential availability for algal uptake. Sediment critical shear
stresses determined in this study could be combined with bathymetric information on
fetch and wind speed and direction monitoring data to estimate sediment resuspension
and resulting total P concentrations using empirical or mechanistic models (Hamilton and
Mitchell 1996, Bailey and Hamilton 1997, CHL-ERDC 2011). Concentrations of
sediment P (mg kg-1) as a function of particle size distribution are not currently known
and might be important in accurately predicting resuspended total P concentrations. For
15
instance, finer-grained particles (i.e., fine silts and clays) are most susceptible to
resuspension and binding sites can be enriched with P due to greater surface areas per
unit particle volume. James (2010) found that sediment particles < 0.4 μ exhibited four
times higher concentrations of exchangeable P than coarse silts in the range of 16 to 63 μ
for sediments in the Lower Minnesota River system. Because wind-generated bottom
shear stresses probably frequently drive resuspension in areas with long fetches, particle
sorting has likely resulted in the establishment of a sediment surficial layer composed of
very fine-grained P-enriched silts and clays.
Preliminary total P budgets for the Lake of the Woods have suggested that tributary P
loadings do not account for total P concentration and mass balance, implying that internal
P loading sources to the system that may be driving algal productivity. The present
research provides findings and insights on internally-derived P sources to the system via
diffusive fluxes from bottom sediments and equilibrium fluxes from resuspended
sediment. A portion of the P imbalance may likely be due to frequent resuspension that
contributes to high total P concentrations in the water column and the total P composition
is probably dominated at times by resuspended inorganic sediment P as well as P in algal
cells. Thus, future P budgetary and modeling analysis perhaps needs to consider the
availability of both tributary loads and internally-derived P sources for algal uptake (i.e.,
soluble versus total P flux to the water column). The findings from the present study
suggested that diffusive and equilibrium soluble P fluxes from sediments are relatively
low, implying that a large portion of the total P imbalance could be due to sources that
are not directly available for algal uptake (for instance, the fraction of resuspended
sediment that is not a part of the exchangeable P pool). In addition, more detailed
information is needed on tributary soluble P loading (versus total P) in order to better
understand and target P sources that are driving algal productivity in the Lake of the
Woods.
16
REFERENCES
APHA (American Public Health Association). 2005. Standard Methods for the Examination of Water and Wastewater. 21th ed. American Public Health Association, American Water Works Association, Water Environment Federation. Bailey MC, Hamilton DP. 1997. Wind induced sediment resuspension: A lakewide model. Ecol Model 99: 217-228. Barko JW, Smart RM 1986. Sediment-related mechanisms of growth limitation in submersed macrophytes. Ecology 67: 1328-1340. Bolster CH, Hornberger GM. 2007. On the use of linearized Langmuir equations. Soil Sci Soc Am J 71:1796-1806 Boström B, Jansson M, Forsberg C. 1982. Phosphorus release from lake sediments. Arch Hydrobiol Beih Ergebn Limnol 18:5-59. Carignan R, Vaithiyanathan P. 1999. Phosphorus availability in the Paraná lakes (Argentina): Influence of pH and phosphate buffering by fluvial sediments. Limnol Oceanogr 44:1540-1548.
Chang-Ying F, Fang T, Sheng Deng N (2006) The research of phosphorus of Xiangxi River nearby Three Gorges, China. Environ Geol 49:923-928
CHL-ERDC (Coastal and Hydraulics Laboratory Engineer Research and Development Center). 2011. Surface water modeling system, Version 11. http://chl.erdc.usace.army.mil/
Froelich PN. 1988. Kinetic control of dissolved phosphate in natural rivers and estuaries: A primer on the phosphate buffer mechanism. Limnol Oceanogr 33:49-668 Gächter R, Meyer JS, Mares A. 1988. Contribution of bacteria to release and fixation of phosphorus in lake sediments. Limnol Oceanogr 33:1542-1558. Gächter R, Meyer JS. 1993. The role of microorganisms in mobilization and fixation of phosphorus in sediments. Hydrobiologia 253:103-121. Håkanson L, Jansson M. 2002. Principles of lake sedimentology. The Blackburn Press, Caldwell, NJ USA Hamilton DP, Mitchell SF. 1996. An empirical model for sediment resuspension in shallow lakes. Hydrobiologia 317: 209-220.
17
Hjieltjes AH, Lijklema L. 1980. Fractionation of inorganic phosphorus in calcareous sediments. J Environ Qual 8:130-132. Hupfer M, Gächter R, Giovanoli R. 1995. Transformation of phosphorus species in settling seston and during early sediment diagenesis. Aquat Sci 57:305-324. James WF. 2006. Laboratory-based rates of phosphorus release as a function of initial sulfate concentration for profundal sediments of Swan Lake, Minnesota. Letter report, 2006. James WF. 2009. Internal phosphorus loading and sediment phosphorus fractionation analysis for profundal sediments in Jessie Lake, Minnesota. Letter Report, 2009. James WF. 2010. Exchangeable phosphorus pools and equilibrium characteristics for river sediment as a function of particle size. Engineer Research and Development Center System-wide Water Resources Program Technical Notes Collection, ERDC TN-SWWRP-10-5. http://el.erdc.usace.army.mil/elpubs/pdf/swwrp-10-5.pdf. James WF, Barko JW. 2004. Diffusive and equilibrium processes in relation to phosphorus dynamics in the upper Mississippi River. River Res Appl 20:473-484.
James WF, Larson CE. 2008. Phosphorus dynamics and loading in the turbid Minnesota River (USA): controls and recycling potential. Biogeochemistry 90:75-92. James WF, Barko JW, Eakin HL. 1995. Internal phosphorus loading in Lake Pepin, Upper Mississippi River. J Freshwat Ecol 10:269-276. Jensen HS, Andersen FØ. 1992. Importance of temperature, nitrate, and pH for phosphate release from aerobic sediments of four shallow, eutrophic lakes. Limnol Oceanogr 37:577-589. Jensen HS, Kristensen P, Jeppesen E, Skytthe A. 1992. Iron:phosphorus ratio in surface sediment as an indicator of phosphate release from aerobic sediments in shallow lakes. Hydrobiologia 235/236:731-743. Klotz RL. 1985. Factors controlling phosphorus limitation in stream sediments. Limnol Oceanogr 30:543-553. Mayer LM, Gloss SP. 1980. Buffering of silica and phosphate in a turbid river. Limnol Oceanogr 25:12-25. Meyer JL. 1979. The role of sediments and bryophytes in phosphorus dynamics in a headwater stream ecosystem. Limnol Oceanogr 24:365-375. Mortimer CH. 1971. Chemical exchanges between sediments and water in the Great Lakes - speculations on probable regulatory mechanisms. Limnol Oceanogr 16:387-404.
18
Nürnberg GK. 1988. Prediction of phosphorus release rates from total and reductant-soluble phosphorus in anoxic lake sediments. Can J Fish Aquat Sci 45:453-462. Penn MR, Auer MT, Doerr SM, Driscoll CT, Brooks CM, Effler SW. 2000. Seasonality in phosphorus release rates from the sediments of a hypereutrophic lake under a matrix of pH and redox conditions. Can J Fish Aquat Sci 57:1033-1041. Pierzynski GM (Ed). 2000. Methods of phosphorus analysis for soils, sediments, residuals, and waters. Southern Cooperative Series Bulletin 396. http://www.soil.ncsu.edu/sera17/publications/sera17-2/pm_cover.htm Plumb RH. 1981. Procedures for handling and chemical analysis of sediment and water samples. Technical Report EPA/CE-81-1. U.S. Army Engineer Waterways Experiment Station, Vicksburg, Mississippi Psenner R, Puckso R. 1988. Phosphorus fractionation: Advantages and limits of the method for the study of sediment P origins and interactions. Arch Hydrobiol Biel Erg Limnol 30:43-59. SAS (Statistical Analysis System). 1994. SAS/STAT User’s Guide, version 6. 4th edition, SAS Institute, Cary, NC. Tsai CH, Lick W. 1986. A portable device for measuring sediment resuspension. J. Great Lakes Res. 12:314-321.
Wauchope RD, McDowell LL. 1984. Adsorption of phosphate, arsenate, methanocarsonate and cacodylate by lake and stream sediments. Comparisons with soils. J Environ Qual 13:499-504.
19
Variable Extractant Recycling potential
Loosely-bound P 1 M ammonium chlorideBiologically-labile; recycled via eH and pH reactions and equilibrium processes
Iron-bound P 0.11 M sodium bicarbonate-dithionateBiologically-labile; recycled via eH and pH reactions and equilibrium processes
Labile organic Ppersulfate digestion of the sodium hydroxide extract
Biologically-labile; recycled via bacterial mineralization of organic P and mobilization of polyphosphates stored in bacterial cells
Aluminum-bound P 0.1 N sodium hydroxide Biologically-refractory and subject to burial
Calcium-bound P 0.5 N hydrochloric acid Biologically-refractory and subject to burial
Refractory organic Pcalculated as the difference between sediment total P and the sum of the other fractions
Biologically-refractory and subject to burial
Table 1. Operationally-defined sediment phosphorus fractions based on sequential extraction.
20

Moisture Content Bulk Density Sediment Density Loss-on-ignition Sand Silt Clay
(%) (g/cm3) (g/cm3) (%) (%) (%) (%)
Big Traverse West 83.9 1.093 0.187 14.0 1.0 46.7 52.3
Big Traverse East 81.7 1.110 0.227 12.4 1.3 50.0 48.6
Muskeg Bay 75.5 1.146 0.314 15.8 5.4 70.0 24.7
4-Mile Bay 59.9 1.282 0.516 10.8 6.5 79.7 13.8
Table 2. Textural characteristics for sediments collected in Lake of the Woods.
Station
21
Station Oxic Anoxic Loosely-bound P Iron-bound P Iron-bound P Labile organic P Aluminum-bound P Calcium-bound P Refractory organic P
(mg m-2 d-1) (mg m-2 d-1) (mg/g DW) (mg/g DW) (mg/g FW) (mg/g DW) (mg/g DW) (mg/g DW) (mg/g DW)
Big Traverse West 0.6 (0.3) 12.5 (0.9) 0.010 0.214 35 0.124 0.084 0.122 0.207
Big Traverse East 0.4 (0.1) 8.6 (2.9) 0.016 0.224 41 0.115 0.095 0.154 0.117
Muskeg Bay 0.2 (<0.1) 9.2 (2.6) 0.016 0.121 30 0.130 0.069 0.149 0.207
4-Mile Bay 0.2 (<0.1) 8.3 (2.6) 0.016 0.101 40 0.058 0.072 0.163 0.232
Total P
(mg/g DW) (mg/g DW) (%) (mg/g DW) (%) (mg/g DW) (%)
Big Traverse West 0.761 0.224 29.4% 0.348 45.7% 0.413 54.3%
Big Traverse East 0.721 0.240 33.3% 0.355 49.2% 0.366 50.8%
Muskeg Bay 0.692 0.137 19.8% 0.267 38.6% 0.425 61.4%
4-Mile Bay 0.642 0.117 18.2% 0.175 27.3% 0.467 72.7%
Total Fe Total Mn Total Ca Fe:P
(mg/g DW) (mg/g DW) (mg/g DW)
Big Traverse West 32.53 1.02 7.26 42.7
Big Traverse East 28.37 0.88 6.93 39.3
Muskeg Bay 19.62 0.50 11.12 28.4
4-Mile Bay 16.94 0.41 25.87 26.4
Station
StationRedox P Bio-labile P Refractory P
Table 3. Mean (1 standard error in parentheses; n=3) rates of phosphorus (P) release and concentrations of biologically labile (i.e., subject to recycling) and refractory (i.e., relatively inert and subject to burial) P for sediments collected in Lake of the Woods. DW = dry mass, FW = fresh mass.
Diffusive P Flux Redox-sensitive and biologically labile P Refractory P
22
23
Station Water-extractable P
Equilibrium P Concentration
Linear Partitition Coefficient
Loosely-bound and Iron-bound P
Two-Surface layer Model
Langmuir-Freundlich Model
Two-Surface layer Model
Langmuir-Freundlich Model
(mg/L) (mg/L) (L/kg) (mg/kg) (mg/kg) (mg/kg) (%) (%)
Big Traverse West 0.011 0.007 3,255 224 857 3,554 26.1% 6.3%
Big Traverse East 0.011 0.013 1,954 240 952 3,606 25.2% 6.7%
Muskeg Bay 0.007 near zero 1,380 137 857 3,554 16.0% 3.9%
4-Mile Bay 0.012 near zero 706 117 476 7,410 24.6% 1.6%
P Sorption Capacity P Saturation
Table 4. Equilibrium phosphorus (P) characteristics, estimated P sorption capacity, and percent P saturation characteristics for surface sediment in the Lake of the Woods.
Station Critical Shear Stress
(dynes/cm2)
Big Traverse West 2.08
Big Traverse East 1.30
Muskeg Bay 2.33
4-Mile Bay 2.15
Peoria Lake (IL)1 2.30
Marsh Lake (MN)2 2.30
Lake Christina (MN)3 1.40
Table 5. A comparison of sediment critical shear stresses measured for stations in the Lake of the Woods versus some other lakes in the upper mid-west.
24
Station Average SRP during resuspension
Average change in SRP during
resuspension
(mg/L) (mg/L)
Big Traverse West 0.017 (< 0.001) + 0.002 (< 0.001)
Big Traverse East 0.018 (< 0.001) - 0.001 (< 0.001)
Muskeg 0.020 (< 0.001) 0.000 (< 0.001)
4-Mile 0.020 (< 0.001) - 0.001 (< 0.001)
Table 6. Mean (1 standard error; n = 5 to 8) soluble reactive phosphorus (SRP) concentration and mean change in SRP during resuspension for various sediments. The mean initial SRP concentration (i.e., prior to sediment resuspension) was 0.019 mg/L). Plus and minus signs indicate a net increase (+) or decrease (-) in SRP versus the initial concentration.
25
System EPC Reference
(mg/L)
Lower Minnesota River (USA) 0.117 James and Larson (2008)
Lake Pepin (USA) 0.115 James and Barko (2004)
Redwood River (USA) 0.070 James et al. (2002)
Eau Galle River (USA) 0.129 James and Barko (2005)
Colorado River (USA) 0.040 Mayer and Gloss (1980)
Bermejo River (Argentina) 0.060 Carignan and Vaithiyanathan (1999)
Paraguay River (Argentina) 0.020-0.090 Carignan and Vaithiyanathan (1999)
Parana River (Argentina) 0.005-0.021 Carignan and Vaithiyanathan (1999)
Bear Brook (USA) 0.002 Meyer (1979)
NY wooded streams (USA) <0.002 Klotz (1985)
Lower Mississippi River (USA) 0.108 Wauchope and McDowell (1984)
Xiangxi River (China) 0.100 Chang-Ying et al. (2006)
Table 7. Comparison of the equilibrium phosphorus concentration (EPC) for suspended and despoited sediments in various river systems.
26
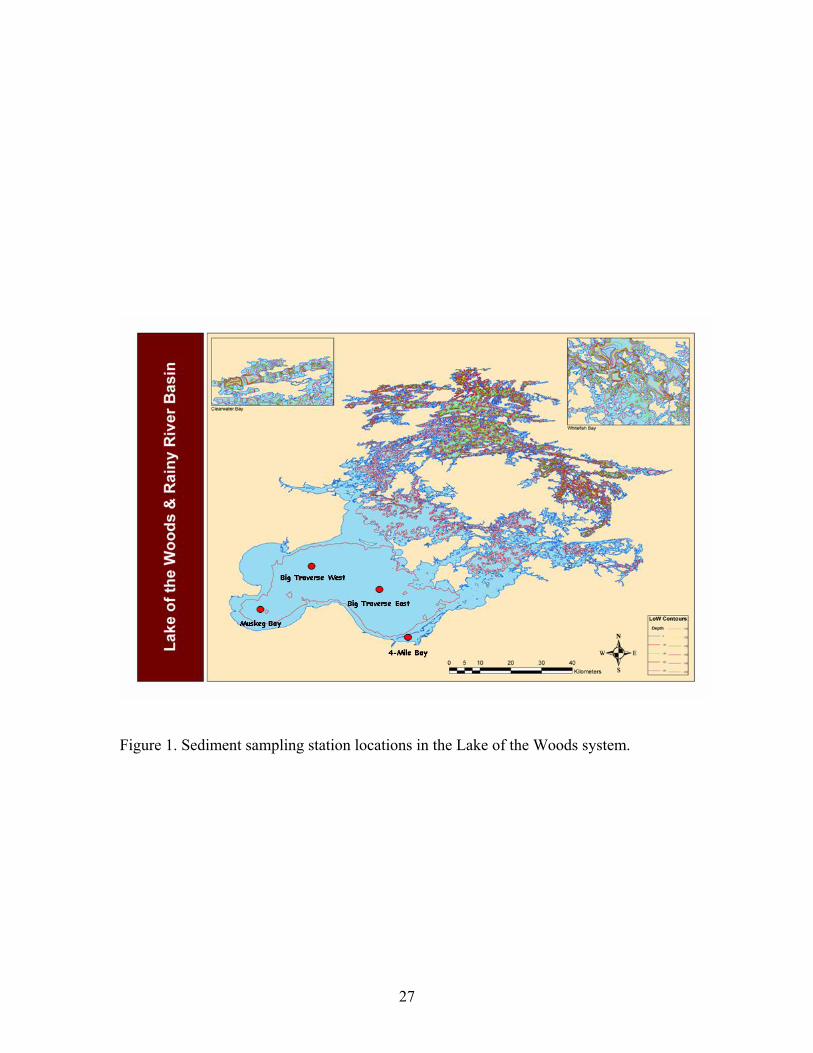
Figure 1. Sediment sampling station locations in the Lake of the Woods system.
27
Equilibrium P concentration
-100
0
100
200
0 0.2 0.4 0.6 0.8 1
Ad
sorp
tion
De
sorp
tion
-100
0
100
200
0 0.2 0.4 0.6 0.8 1
Equilibrium SRP (mg L-1)
ΔS
(m
g kg
-1) A
dso
rptio
nD
eso
rptio
n
EPC = point where net sorption is zero
Kd = slope of regression
Figure 2. An example showing the estimation of the equilibrium phosphorus (P) concentration (EPC) and the linear adsorption coefficient (kd). The final equilibrium soluble reactive P (SRP) concentration is plotted against the change in SRP in solution after 24 hours of exposure to sediment. The net change in SRP concentration is divided by the mass of sediment (dry mass) to estimate the exchangeable sediment P (∆ S). Negative S indicates desorption of P from the sediment to the surrounding water while a positive S represents adsorption of soluble P from the surrounding water to the sediment. The slope of the regression between equilibrium SRP and ∆ S near the EPC represents kd. The EPC is the concentration where there is no net adsorption or desorption of P.
28
Oscillating disk
Peristaltic pump
Particle Entrainment Simulator
Sediment core andoverlying water
Figure 3. Schematic of the particle entrainment simulator used to estimate sediment critical shear stress and examine soluble reactive phosphorus concentrations during simulated resuspension.
29
y = -1.3616x + 164.06R2 = 0.865
40
50
60
70
80
90
100
50 60 70 80 90 100
y = -0.2311x + 20.944R2 = 0.7941
0
2
4
6
8
10
50 60 70 80 90 100
y = 1.591x - 84.873R2 = 0.8573
0
20
40
60
80
100
50 60 70 80 90 100
y = 166.4x - 131.05R2 = 0.8089
40
50
60
70
80
90
100
1.0 1.1 1.2 1.3
y = 27.999x - 28.866R2 = 0.7296
0
2
4
6
8
10
1.0 1.1 1.2 1.3
y = -194.24x + 259.73R2 = 0.8001
0
20
40
60
80
100
1.0 1.1 1.2 1.3
y = 101.72x + 29.964R2 = 0.8838
40
50
60
70
80
90
100
0 0.1 0.2 0.3 0.4 0.5 0.6
y = 17.304x - 1.8314R2 = 0.8148
0
2
4
6
8
10
0 0.1 0.2 0.3 0.4 0.5 0.6
y = -118.89x + 71.825R2 = 0.8765
0
20
40
60
80
100
0 0.1 0.2 0.3 0.4 0.5 0.6
Sand Silt ClayC
ompo
sitio
n (%
)
Moisture content (%)
Bulk density (g/mL)
Sediment density (g/mL)
Figure 4. Relationships between sand, silt, or clay percent composition and various sediment textural characteristics.
30
Big Traverse West
Loosely-bound P,
0.010, 1%
Iron-bound P, 0.214, 29%
Labile organic P, 0.124, 16%
Aluminum-bound P,
0.084, 11%
Calcium-bound P,
0.122, 16%
Refractory organic P,
0.207, 27%
Big Traverse East
Loosely-bound P,
0.016, 2%
Iron-bound P, 0.224, 32%
Labile organic P, 0.115, 16%
Aluminum-bound P,
0.095, 13%
Calcium-bound P,
0.154, 21%
Refractory organic P,
0.117, 16%
Muskeg Bay
Loosely-bound P,
0.016, 2% Iron-bound P, 0.121, 17%
Labile organic P, 0.130, 19%
Aluminum-bound P,
0.069, 10%
Calcium-bound P,
0.149, 22%
Refractory organic P,
0.207, 30%
4-Mile Bay
Loosely-bound P,
0.016, 2% Iron-bound P, 0.101, 16%
Labile organic P, 0.058, 9%
Aluminum-bound P,
0.072, 11%
Calcium-bound P,
0.163, 25%
Refractory organic P,
0.232, 37%
Figure 5. The composition of biologically-labile (i.e., subject to recycling and biological uptake; loosely-bound, iron-bound, labile organic phosphorus) and biologically-refractory phosphorus (P; i.e., more inert to recycling and uptake and subject to burial; aluminum-bound, calcium-bound, refractory organic P) fractions in the upper 10-cm sediment layer for various stations in the Lake of the Woods system. Numbers below each label indicate concentration (mg g-1) and relative percentage of the sediment total P.
31
Big Traverse EastAnoxic P Release Rate
0
0.2
0.4
0.6
0.8
0 5 10 15
Days
Ph
os
ph
oru
s (
mg
)
Big Traverse WestAnoxic P Release Rate
0
0.2
0.4
0.6
0.8
0 5 10 15
Days
Ph
os
ph
oru
s (
mg
)
Big Traverse WestAnoxic P Release Rate
0
0.5
1
1.5
2
0 5 10 15
Days
Ph
os
ph
oru
s (
mg
/L)
Big Traverse EastAnoxic P Release Rate
0
0.5
1
1.5
2
0 5 10 15
Days
Ph
os
ph
oru
s (
mg
/L)
Figure 6. Soluble reactive phosphorus mass (upper panels) and concentration (lower panels) in the overlying water column versus time for sediment core systems incubated under anaerobic conditions.
32
MuskegAnoxic P Release Rate
0
0.2
0.4
0.6
0.8
0 5 10 15
Days
Ph
os
ph
oru
s (
mg
)
MuskegAnoxic P Release Rate
0
0.5
1
1.5
2
0 5 10 15
Days
Ph
os
ph
oru
s (
mg
/L)
4-MileAnoxic P Release Rate
0
0.2
0.4
0.6
0.8
0 5 10 15
Days
Ph
os
ph
oru
s (
mg
)4-Mile
Anoxic P Release Rate
0
0.5
1
1.5
2
0 5 10 15
Days
Ph
os
ph
oru
s (
mg
/L)
Figure 7. Soluble reactive phosphorus mass (upper panels) and concentration (lower panels) in the overlying water column versus time for sediment core systems incubated under anaerobic conditions.
33
0
5
10
15
0 10 20 30 40 50
Redox-P (mg/g FW)
P R
elea
se R
ate
(mg
m-2
d-1 )
Nürnberg (1988)
Upper 95% confidence interval
Lower 95% confidence interval
Figure 8. Anoxic diffusive flux rates versus redox-sensitive sediment phosphorus (P) measured for the Lake of the Woods. The solid regression and dashed 95% confidence limit lines are from Nürnberg (1988).
34
Big Traverse EastOxic P Release Rate
0
0.01
0.02
0.03
0 5 10 15 20
Days
Ph
os
ph
oru
s (
mg
)
Big Traverse WestOxic P Release Rate
0
0.01
0.02
0.03
0 5 10 15 20
Days
Ph
os
ph
oru
s (
mg
)
Big Traverse WestOxic P Release Rate
0
0.02
0.04
0.06
0.08
0.1
0 5 10 15 20
Days
Ph
os
ph
oru
s (
mg
/L)
Big Traverse EastOxic P Release Rate
0
0.02
0.04
0.06
0.08
0.1
0 5 10 15 20
Days
Ph
os
ph
oru
s (
mg
/L)
Figure 9. Soluble reactive phosphorus mass (upper panels) and concentration (lower panels) in the overlying water column versus time for sediment core systems incubated under aerobic conditions.
35
MuskegOxic P Release Rate
0
0.01
0.02
0.03
0 5 10 15 20
Days
Ph
os
ph
oru
s (
mg
)
MuskegOxic P Release Rate
0
0.02
0.04
0.06
0.08
0.1
0 5 10 15 20
Days
Ph
os
ph
oru
s (
mg
/L)
4-MileOxic P Release Rate
0
0.01
0.02
0.03
0 5 10 15 20
Days
Ph
os
ph
oru
s (
mg
)4-Mile
Oxic P Release Rate
0
0.02
0.04
0.06
0.08
0.1
0 5 10 15 20
Days
Ph
os
ph
oru
s (
mg
/L)
Figure 10. Soluble reactive phosphorus mass (upper panels) and concentration (lower panels) in the overlying water column versus time for sediment core systems incubated under aerobic conditions.
36
-0.1
0
0.1
0.2
0.3
0.4
0.5
0.6
-0.1
0
0.1
0.2
0.3
0.4
0.5
0.6
0 0.2 0.4 0.6 0.8 1.00 0.2 0.4 0.6 0.8 1.0
Equilibrium P (mg/L)
-0.1
0
0.1
0.2
0.3
0.4
0.5
0.6
-0.1
0
0.1
0.2
0.3
0.4
0.5
0.6
0 0.2 0.4 0.6 0.8 1.00 0.2 0.4 0.6 0.8 1.0
a) West Big Traverse b) East Big Traverse
c) Muskeg Bay d) 4-Mile Bay
-0.1
0
0.1
0.2
0.3
0.4
0.5
0.6
-0.1
0
0.1
0.2
0.3
0.4
0.5
0.6
0 0.2 0.4 0.6 0.8 1.00 0.2 0.4 0.6 0.8 1.0
Equilibrium P (mg/L)
-0.1
0
0.1
0.2
0.3
0.4
0.5
0.6
-0.1
0
0.1
0.2
0.3
0.4
0.5
0.6
0 0.2 0.4 0.6 0.8 1.00 0.2 0.4 0.6 0.8 1.0
a) West Big Traverse b) East Big Traverse
c) Muskeg Bay d) 4-Mile Bay
Ads
orpt
ion
Des
orpt
ion
Ads
orpt
ion
Des
orpt
ion
∆S
(mg/
g)
Figure 11. The change in the sediment exchangeable phosphorus (S) concentration as a function of the final (i.e., after 24-h of exposure) equilibrium soluble P concentration for sediment collected at various stations in the Lake of the Woods.
37
0
200
400
600
800
0
200
400
600
800
0 0.2 0.4 0.6 0.8 0 0.2 0.4 0.6 0.8
∆S
(mg/
kg)
Equilibrium P (mg/L)Equilibrium P (mg/L)
a) Langmuir
b) Langmuir-Freundlich
c) Two-surface layer Langmuir
d) Freundlich
Figure 12. A comparison of different models fitted to sorption data collected from the Lake of the Woods. S represents the sum of the native exchangeable P pool and P that was adsorbed after 24-h of exposure to various soluble P concentrations. The native exchangeable P pool was defined as the sum of the loosely-bound and iron-bound P fractions.
38
a) Big Traverse West
-200
0
200
400
600
800
1000
0 1 2 3 4 5
b) Big Traverse East
-500
0
500
1000
1500
0 1 2 3 4 5
d) 4-Mile Bay
-200
0
200
400
600
800
1000
0 1 2 3 4 5
c) Muskeg Bay
-500
0
500
1000
1500
0 1 2 3 4 5
Tur
bidi
ty (
NT
U)
Shear Stress (dynes/cm2)
Figure 13. Changes in turbidity in the overlying water column as a function of shear stress. The inflection point approximates the critical shear stress (see Table 5).
39
-200
0
200
400
600
800
1000
0 1 2 3 4 5
-500
0
500
1000
1500
2000
0 1 2 3 4 5
-500
0
500
1000
1500
0 1 2 3 4 5
-500
0
500
1000
1500
2000
0 1 2 3 4 5
a) Big Traverse West b) Big Traverse East
d) 4-Mile Bayc) Muskeg Bay
Tot
al S
uspe
nded
Sed
imen
t (m
g/L
)
Shear Stress (dynes/cm2)
Figure 14. Changes in total suspended sediment concentration in the overlying water column as a function of shear stress. The inflection point approximates the critical shear stress (see Table 5).
40
Big Traverse West
0
0.01
0.02
0.03
0 1 2 3 4 5
Sol
uble
Rea
ctiv
e P
(m
g/L)
Big Traverse West
-0.006
-0.004
-0.002
0
0.002
0.004
0.006
0 1 2 3 4 5
Shear Stress (dynes/cm2)
ΔS
olub
le R
eact
ive
P(m
g/L)
Big Traverse East
0
0.01
0.02
0.03
0 1 2 3 4 5
Big Traverse East
-0.006
-0.004
-0.002
0
0.002
0.004
0.006
0 1 2 3 4 5
Shear Stress (dynes/cm2)
Figure 15. Variations in soluble reactive phosphorus (P) concentration (upper panels) and the net change in concentration from initial, undisturbed conditions (lower panels) as a function of applied shear stress for Big Traverse Lake sediments.
41
42
Figure 16. Variations in soluble reactive phosphorus (P) concentration (upper panels) and the net change in concentration from initial, undisturbed conditions (lower panels) as a function of applied shear stress for Muskeg and 4-Mile embayment sediments.
Muskeg
0
0.01
0.02
0.03
0 1 2 3 4 5
Sol
uble
Rea
ctiv
e P
(m
g/L)
Muskeg
-0.006
-0.004
-0.002
0
0.002
0.004
0.006
0 1 2 3 4 5
Shear Stress (dynes/cm2)
4-Mile
0
0.01
0.02
0.03
0 1 2 3 4 5
4-Mile
-0.006
-0.004
-0.002
0
0.002
0.004
0.006
0 1 2 3 4 5
Shear Stress (dynes/cm2)
ΔS
olub
le R
eact
ive
P(m
g/L)