ESTIMATION OF ELECTRICAL CONDUCTIVITY OF … 1 - ESTIMATION OF ELECTRICAL CONDUCTIVITY OF...
10
- 1 - ESTIMATION OF ELECTRICAL CONDUCTIVITY OF LCF-PP/PANI-COMPLEX BLENDS R. Taipalus and K. Friedrich Institute for Composite Materials Ltd. Erwin-Schrödinger-Strasse 58, D-67663 Kaiserslautern GERMANY SUMMARY: The aim of this study is to model the electrical conductivity of long carbon fibre (LCF) reinforced polypropylene (PP) composites and their blends with an electrically conductive polyaniline-complex (PANI-complex). A Fibre Contact Model is used to describe the electrical conductivity and to model the synergy effect between the two conductive components. This structure-oriented theory also considers the microstructural parameters, such as fibre length, orientation and concentration. The studied PANI-complex network is supposed to originate from processing induced PANI-complex fibrils, which are characterised in their dimensions and orientation. The predicted data for LCF-PP and PP/PANI-complex blends are in good agreement with the experimental results. By using an “increased conductive pathways” method, it is possible to model the synergy effect between LCF and PANI-complex. In this method it is assumed that the LCFs build a backbone of conductivity and the PANI-complex forms additional conductive pathways between them. Again the predictions are in good agreement with the experimental data. KEYWORDS: CFRP, electrical properties, modelling, synergy effect, PANI-complex INTRODUCTION Thermoplastic polymers are traditionally used as electrically insulating materials. In order to make them electrically conductive, continuous pathways of electrically conductive particles in them must be established. For this purpose electrically conductive fillers, such as carbon black, carbon fibres, metal powder and metal fibres can be used. Another way for making normal insulating polymers electrically conductive is blending them with another electrically conductive polymer. At a low filler loading, the particles are homogeneously distributed in the insulating matrix without any contacts between adjacent filler particles. The conductivity of this composite is comparable to that of the matrix polymer. With rising filler concentration, however, clusters of filler particles begin to form and in these clusters the filler particles are in contact with each other. At a certain critical filler concentration, the growing clusters reach a size which enables a contact between them; a continuous network structure of the conducting filler is formed. This network formation can be detected as a drastic increase in the electrical conductivity of the composite. The abrupt increase in electrical conductivity is called the
Transcript of ESTIMATION OF ELECTRICAL CONDUCTIVITY OF … 1 - ESTIMATION OF ELECTRICAL CONDUCTIVITY OF...

- 1 -
ESTIMATION OF ELECTRICAL CONDUCTIVITY OFLCF-PP/PANI-COMPLEX BLENDS
R. Taipalus and K. Friedrich
Institute for Composite Materials Ltd.Erwin-Schrödinger-Strasse 58, D-67663 Kaiserslautern
GERMANY
SUMMARY: The aim of this study is to model the electrical conductivity of long carbonfibre (LCF) reinforced polypropylene (PP) composites and their blends with an electricallyconductive polyaniline-complex (PANI-complex). A Fibre Contact Model is used to describethe electrical conductivity and to model the synergy effect between the two conductivecomponents. This structure-oriented theory also considers the microstructural parameters,such as fibre length, orientation and concentration. The studied PANI-complex network issupposed to originate from processing induced PANI-complex fibrils, which are characterisedin their dimensions and orientation. The predicted data for LCF-PP and PP/PANI-complexblends are in good agreement with the experimental results. By using an “increasedconductive pathways” method, it is possible to model the synergy effect between LCF andPANI-complex. In this method it is assumed that the LCFs build a backbone of conductivityand the PANI-complex forms additional conductive pathways between them. Again thepredictions are in good agreement with the experimental data.
KEYWORDS: CFRP, electrical properties, modelling, synergy effect, PANI-complex
INTRODUCTION
Thermoplastic polymers are traditionally used as electrically insulating materials. In order tomake them electrically conductive, continuous pathways of electrically conductive particles inthem must be established. For this purpose electrically conductive fillers, such as carbonblack, carbon fibres, metal powder and metal fibres can be used. Another way for makingnormal insulating polymers electrically conductive is blending them with another electricallyconductive polymer. At a low filler loading, the particles are homogeneously distributed inthe insulating matrix without any contacts between adjacent filler particles. The conductivityof this composite is comparable to that of the matrix polymer. With rising filler concentration,however, clusters of filler particles begin to form and in these clusters the filler particles are incontact with each other. At a certain critical filler concentration, the growing clusters reach asize which enables a contact between them; a continuous network structure of the conductingfiller is formed. This network formation can be detected as a drastic increase in the electricalconductivity of the composite. The abrupt increase in electrical conductivity is called the
- 2 -
percolation threshold of the (filler) material. At loadings above the critical level, theconductivity reaches a plateau and does not rise significantly with further addition of filler.
The existing models for predicting the electrical conductivity of this kind of materials can besubdivided into percolation theories and non-percolation theories (thermodynamic models,geometrical models and structure-oriented models). The general basis of the percolationtheory is the fact that the conductivity of a composite dramatically increases at a certain fibreconcentration (the percolation threshold). It can be used for modelling the electrical behaviourof a composite material and for predicting the percolation threshold itself [1-7]. Thepercolation theory is a statistical method and it calculates whether particles have contact witheach other or not. A similar theoretical model can also be used to model e.g. the progress of aforest fire.
From the engineer’s point of view the most promising models for predicting the electricalconductivity are the structure-oriented ones. The latter are based on microstructural data suchas fibre orientation, length, and packing arrangement [8-16]. Most of these theories predicteither the conductivity of the matrix or of the filler, but they do not take into account thepercolation threshold. Weber and Kamal [14, 16] have evaluated new models which usemicrostructural data to predict the volume resistivity of a composite. The End-to-End Model(EEM) relates resistivity to the concentration and orientation of fibres by assuming a perfectfibre to fibre contact. In the Fiber Contact Model (FCM) the effects of both fibre to fibrecontact and fibre length on the composite resistivity are additionally taken into account. Agood agreement between predictions and experimental data for polypropylene compositesreinforced with nickel-coated graphite fibres has been found [16].
The aim of this study is to model the electrical conductivity of long carbon fibre (LCF)reinforced polypropylene (PP) / polyaniline-complex (PANI-complex) blends. Of specialconsideration is the synergy effect between two electrically conductive components (LCF andPANI-complex) with regards to the electrical conductivity of their blends.
MODEL FOR PREDICTING THE ELECTRICAL CONDUCTIVITY
The Fibre Contact Model (FCM) of Weber and Kamal [16] can be used for calculating thevolume resistivity of fibre reinforced composites. The model is based on the studies ofBatchelor and O’Brian [15] of thermal and electrical conductivities of particle-filledmaterials. Weber and Kamal [16] have developed the model further for fibre reinforcedmaterials. It takes into account microstructural parameters, such as filler concentration anddimensions, aspect ratio and orientation of fibres. In the model of Weber and Kamal theconductivity of the matrix is estimated to be so low that it does not have any influence on theconductivity of the composites. In this study the equations are further developed so that theyenable the calculation of electrical conductivity of the composite by taking into account alsothe electrical conductivity of the matrix. The latter is necessary when the synergy effectbetween fibres and PANI-complex has to be considered. The electrical conductivity can bedefined as
( )
+= Xdl
dd
fpc
mc **cos***4 2 σφθπ
σσ (1)
in whichσc = conductivity of composite
- 3 -
σm= conductivity of matrixσf = conductivity of fibresdc = diameter of circle of contactd = diameter of fibrel = average fibre lengthθ = orientation angle of fibre(φp and X are explained below)
In the model it is assumed that a contact between fibres is not a perfect end-to-end contact,but rather an end-to-body or body-to-body type. The area of contact for these two cases ismuch smaller than in perfect end-to-end alignment, which therefore has an effect on theglobal conductivity of the composite. Besides, the FCM (Fibre Contact Model) is based on thefact that the particles have a flat circle of contact. The diameter of this contact circle dc, isobviously a small number, but it is not possible to accurately measure this value. The valuecan be estimated by fitting the experimental data to the model calculations and then using thisvalue for all other samples with different fibre loadings.
The symbol φp shows the volume fraction of fibres participating in the formation of electricalconductive pathways. Only the fibres forming the conducting network have an influence onthe electrical conductivity. The rest of the fibres are surrounded by the matrix and do notimprove the conductivity. The term φp can be written
fp βφφ = (2)
where φf is the volume fraction of fibres and β is a factor showing which parts of the fibresare participating in the conductive network. At volume fractions below the percolationthreshold (critical concentration φcrit), β is zero, because the fibres do not have contact witheach other. A “saturated” volume fraction φt, in which sufficient enough fibres areparticipating to create at least one perfectly conductive pathway, is estimated by using theresults of electrical conductivity measurements obtained with higher fibre content. At volumefractions greater than φt, β is 1 and φp will be equal to φf. For concentrations within the rangeof φcrit < φf < φt, β can be calculated in the following way:
critt
critf
φφφφ
β−−
= (3)
A value of φt, at which β will be equal to 1, and φcrit is obtained from the experimental data.
The symbol X is a factor depending on the contact number of fibres. Weber et. al. [16] havefound a mathematical relation between X and m
mX *15.059.0 += (4)
where m is the number of contacts. It can be calculated by
=
t
pmmφφ
max (5)
For all cases, the maximum number of contacts mmax is assumed to be 15 [16].

- 4 -
EXPERIMENTAL
Samples of LCF-PP/PANI-complex blends with different concentrations of LCF and PANI-complex were injection moulded into plates (with the dimensions of 80*80*2 mm3) and intotest bars according to DIN EN61. The barrel temperatures were kept in all cases under 225°Cin order to prevent degradation of the PANI-complex. The injection moulding parameterswere maintained on a constant level in order to obtain similar fibre orientation patterns andfibre length distributions.
The electrical conductivity of the composites was determined with a 2-point technique, afterremoving the thin polymer skin layer, due to the injection moulding process. In addition,surface resistivity measurements on original samples (without removal of the polymer skinlayer) were carried out (according to ASTM D-257). For the simulation purpose, the fibrecontent, length and orientation as well as the dimensions and orientation of PANI-complexdroplets in the samples were studied. The fibre content was determined by burning samples at500°C, and the fibre length was measured from the residue of the combustion by using lightoptical microscopy. Fibre orientation studies on polished cross-sections of the samples werecarried out using light optical microscopy linked to an image analyser. The same analysistechnique was used for determining the dimensions and orientation of PANI-complex dropletsin thin sections, cut from the test bars by the use of a microtome.
RESULTS AND DISCUSSION
LCF-PP-Composites and PP/PANI-Complex-Blends
The electrical conductivities of LCF- and PANI-complex-blends are of different types. LCFsare fibres functioning as reinforcement in the matrix and increasing the electrical conductivityof the composites. The PANI-complex forms together with the matrix an immiscible polymerblend. The high shear forces near the surface region during injection moulding cause thedispersed PANI-droplets to deform into elongated droplets or fibrils, which finally form theconductive network [17]. This network structure can be seen in Fig. 1.
50 µm
Fig. 1: Electrically conductive PANI-complex network structure in a PP-matrix.

- 5 -
These elongated droplets are assumed to function like fibres, and their orientation anddimensions can be measured. Table 1 presents these values as well as the values of theconstant parameters used in the modelling of the electrical conductivity of LCF- and PANI-complex-blends.
Table 1: Values of parameters used in Fibre Contact Model.
Parameter Abbr. LCF PANI-complex
Electrical conductivity of PP [S/cm] σm 5*10-14 5*10-14
Electrical conductivity of LCF [S/cm] σf 1*103
Electrical conductivity of PANI [S/cm] σPANI 1*100
Critical filler content [vol.-%] φcrit 2,7 6.3Fibre diameter [µm] d 7 1Average fibre length [µm] l 50 100Orientation angle of filler [°] θ 7 10
The critical filler contents were measured experimentally. Different authors have studied thecritical fibre concentration theoretically by using percolation models and Monte-Carlosimulations [2-4]. They have shown that the percolation threshold depends on the fibre aspectratio in the case of a random fibre orientation; the longer the fibres are, the lower is thepercolation threshold. When all the fibres are aligned in one direction, the criticalconcentration has a constant value of 22 vol.-%. In the case studied here, carbon fibres areoriented nearly aligned and have an aspect ratio of about 7 (l/d = 50/7). According toMunson-McGee [4] that equals to a critical concentration of 13.5 vol.-%, which is, however,much higher than the critical concentration measured in these experiments. To reach theexperimental threshold, the fibre aspect ratio should be about 80, which means an averagefibre length of 560 µm would be needed. In fact, in the fibre length measurements also fibresof this length were found, although the majority of fibres was clearly shorter [18]. On theother hand, also longer fibres up to 3000 µm survived during the injection moulding process,which obviously compensated the negative contribution of the shorter fibres, so that, at theend, the measured percolation threshold could be verified. Besides the fibres, theexperimental critical concentration of the PANI-complex is in agreement with the theoreticalstudies of Tanner [19].
From the theory, the saturated fibre content φt was estimated to be 11.5 vol.-% in the case ofLCF and 26 vol.-% in the case of the PANI-complex [19, 20]. The number of contacts, m,was assumed to vary from a minimum of 2 to a maximum of 15. At loadings near thepercolation threshold, each fibre has to have a minimum number of contacts, which is two.The maximum is reached at the saturated fibre content. For the ratio of the contact diameter tothe fibre diameter, dc/d, a value of 3*10-6 for all of the LCF-composites and a value of 3*10-7
for all of the PANI-complex –blends was used.
Fig. 2 compares the experimental electrical conductivity values with the model predictions.The experimental results of the electrical conductivity measurements verify the expectedincrease in conductivity with increasing filler content. When the percolation threshold isreached, the conductivity increases quickly, but maintains on a rather constant level afterfurther addition of the filler components. In the case of LCF it was raised from the level of10-13 S/cm (for neat PP) to 10-5 S/cm for PP with 4.3 vol.-% LCF (equal to 8 wt-% LCF). Anabrupt percolation threshold of LCF could be observed at 2.7 vol.-% LCF. The experimental

- 6 -
percolation threshold of the PANI-complex was much smoother than that of the LCF. It wasobserved at 7.5 vol.-% of the PANI-complex. By using 21.5 vol.-% PANI-complex (equal to25 wt.-% PANI-complex) an electrical conductivity of 5*10-6 S/cm was reached. This is closeto the volume fraction for “saturation”, φt, which was calculated as to be 26 vol.-%.
! " #! #" $! $" %!#!&#'
#!&#(
#!&#$
#!&#!
#!&)
#!&'
#!&(
#!&$
#!!
*+,-*./0**1,+*+,-*./0*2345*67890:*1,+*67890:*2345
6;9<=0><?;*,/@AB<=>C>=D*EFG<HI
+>;;90*,/@=9@=*EC/;:&JI
Fig. 2: Comparison between fibre contact model predictions and experimentaldata for LCF-PP-composites and PP/PANI-complex-blends.
The theoretical predictions of the electrical conductivity are in good agreement with theexperimental results. In the theoretical predictions below the percolation threshold, theconductivity was assumed to be on the level of the non-filled PP-matrix. In the case of LCF,the increase of electrical conductivity was accurately predicted, but in the case of the PANI-complex the model did not take into account the “smoother” percolation threshold (subject offuture consideration). Yet, the model showed good agreement of the electrical conductivitybelow and above the percolation threshold. It can be concluded that this model can also beused for the PANI-complex, when microstructural parameters of the blend can be defined.
Electrical Conductivity and Synergy Effects in LCF-PP/PANI-Complex-Composites
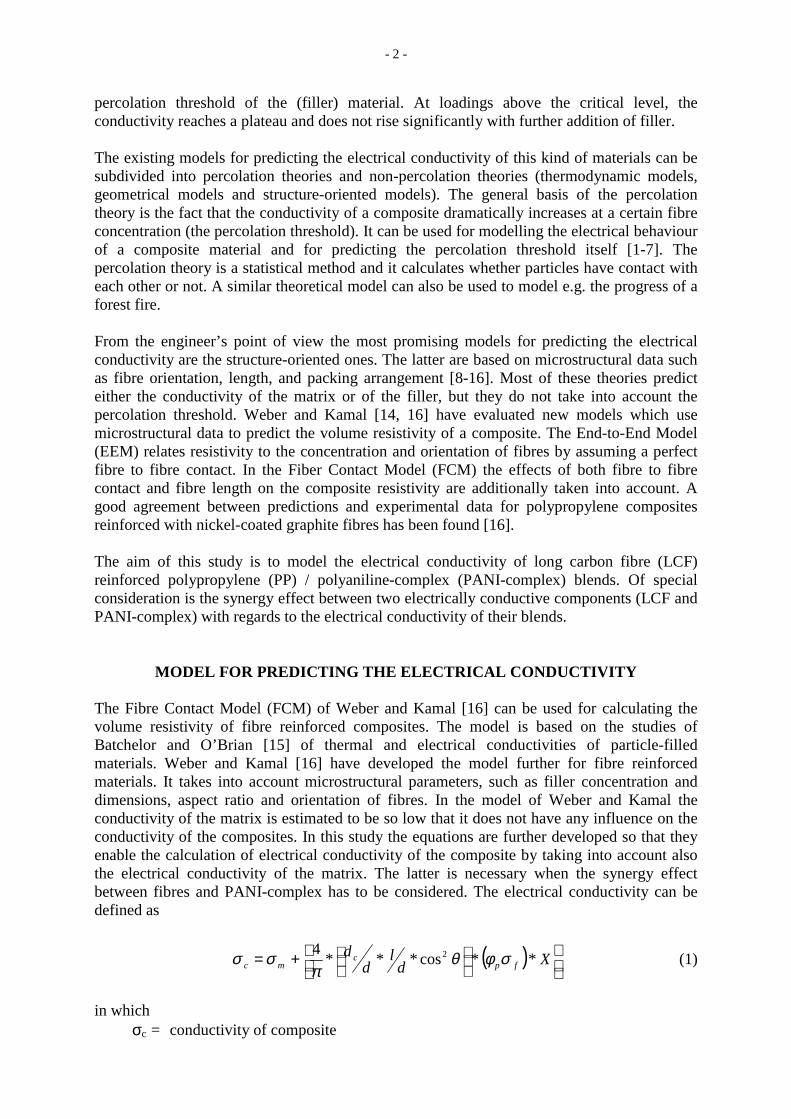
Fig. 3 shows for the PP-composites, filled with both LCF and PANI-complex, the specificsurface resistivity measurements after transforming the data into electrical conductivityvalues. The results show a synergy effect between the PANI-complex and the LCF; the abruptincrease in the conductivity between 2.1 and 3.2 vol.-% was significantly reduced, and theconductivity of samples with 3.2 and 4.3 vol.-% CF could be increased by two orders ofmagnitude, using the additional PANI-complex. Furthermore, the percolation threshold couldbe moved towards a reduced fibre content. Already a low amount of the PANI-complex (4.1vol.-%) was enough to increase the electrical conductivity.
The model was also used for blends consisting of two electrically conductive parts in order tomodel the synergy effect mentioned above. When the materials are examined in the

- 7 -
longitudinal direction, two different network structures can be observed; one was produced bythe carbon fibres, while the other one originated from the PANI-complex. In the modelling itis assumed that these two network structures overlap. In the double network the electriccharges have more possibilities to move. The levels of the conductivities of the carbon fibres(103 S/cm), the PANI-complex (100 S/cm) and the insulating matrix (10-13 S/cm) showsignificant differences. Due to the high conductivity of the carbon fibres it is assumed thatthey are mainly responsible for the conductivity of the composite. Therefore themicrostructural parameters of LCF, such as fibre length, diameter and orientation, are used inthe modelling of the synergy effect. Furthermore, the PP/PANI-complex-blend is assumed toform the electrically conductive matrix of the composite with LCF. In this point thedeveloped model is different from the model of Weber and Kamal [16]. The latter assumesthat the matrix does not contribute to the conductivity of the composite.
! $ ( '#!&#'
#!&#(
#!&#$
#!&#!
#!&)
#!&'
#!&(
#!&$
*2345*!*C/;:&J*2345*(:#*C/;:&J*2345*':%*C/;:&J*2345*):(*C/;:&J
6;9<=0><?;*,/@AB<=>C>=D*EFG<HI
1,+*EC/;:&JI
Fig. 3: Electrical conductivity of LCF-PP/PANI-complex-blends.
It is further assumed that the PANI-complex forms additional conducting pathways betweencarbon fibres and thus increases the number of conductive pathways in the LCF-composite.That means also that the percolation concentration is shifted, correspondingly, towardssmaller concentrations. The critical percolation threshold for LCF-PP/PANI-complex-blendswas determined experimentally at 1.8 vol.-%, compared to 2.7 vol.-% for LCF only and 6.3vol.-% for the PANI-complex only. The shifted percolation threshold can be determined alsotheoretically by using the two latter concentrations and the theory of the multiple percolation[6]. According to this theory, the critical concentration can be shifted towards lower fibrecontents when the number of components in a polymer matrix increases. The new criticalvolume fraction of LCF φf* in the PP/PANI-complex blend can be calculated in the followingway:
PANIff φφφ =* (6)
The experimentally measured value of critical concentration (1.8 vol.-%) is in agreement withthe theoretical value of 1.7 vol.-%.

- 8 -
An increase in the number of electrically conductive pathways is taken into account in thefactors φ, β and m in the following way (φ > φcrit):
PANICFtot φφφ += (7)
PANICFtot βββ += (8)
PANICFmmm tot maxmaxmax += (9)
The values of βPANI and mmaxPANI were determined at PANI-complex contents of 4.1, 6.3 and8.4 vol.-%.
With these assumptions it is possible to model the synergy effect regarding the electricalconductivity, and the results of the modelling are shown in Fig. 4.
! $ ( ' ) #!#!&#'
#!&#(
#!&#$
#!&#!
#!&)
#!&'
#!&(
#!&$
*+,-*2345*!*C/;:&J*+,-*2345*(K#*C/;:&J*+,-*2345*'K%*C/;:&J*+,-*2345*)K(*C/;:&J*67890>H:*2345*!*C/;:&J*67890>H:*2345*(K#*C/;:&J*67890>H:*2345*'K%*C/;:&J*67890>H:*2345*)K(*C/;:&J6;9<=0><?;*,/@AB<=>C>=D*EFG<HI
1,+*EC/;:&JI
Fig. 4: Comparison between theoretical predictions and experimental resultsof electrical conductivity of LCF-PP/PANI-complex-blends.
Below the percolation threshold the model shows a constant conductivity value of the matrix,in the case 0 and 4.1 vol.-% PANI-complex the value of PP, and in the two other cases thevalue of the PP/PANI-complex-blend. Within this range of carbon fibre content, the CF donot form a conductive network. The synergy effect became evident when the percolationthreshold was moved towards a reduced carbon fibre content when using the PANI-complex.The developed “increased conductive pathways”-method can predict the electricalconductivity very well, and the predictions are again in agreement with the experimentalresults. It suggests the validity of the basic approach employed in developing the model andestimating the critical parameters on the basis of detailed material characterisation.
- 9 -
CONCLUSIONS
The electrical conductivity of LCF-PP/PANI-complex-blends was studied. A synergy effectregarding the electrical conductivity was observed; the abrupt increase in the conductivity wasreduced and the conductivity could be increased by two orders of magnitude, using PANI-complex. Furthermore, the percolation threshold could be moved towards a reduced fibrecontent.
The Fibre Contact Model was used to model the electrical conductivity of the blends studied.This model takes into account the microstructural parameters, such as fibre length, orientationand concentration. At first it was used to predict the conductivity of LCF-PP-composites andPP/PANI-complex-blends, separately. The PANI-complex network was a structure consistingof processing induced fibre like PANI-complex-chains, whose orientation and dimensionscould be measured. The theoretical predictions were in agreement with the experimentalresults.
Furthermore, the model was developed to predict the conductivity of LCF-PP/PANI-complexblends and the synergy effects in them. The carbon fibre network was assumed to be thebackbone of the electrical conductivity. The PANI-complex was supposed to form additionalconductive pathways between the carbon fibres, which would make a charge transportpossible already below the percolation threshold of LCF. By using an ”increased conductivepathways”-method, the synergy effect between LCF and PANI-complex regarding theconductivity could be predicted.
ACKNOWLEDGEMENTS
The financial support of the Neste Foundation (scholarship of R. Taipalus) and NesteChemicals (materials) is gratefully acknowledged. Further thanks are due to the Fonds derChemische Industrie, Frankfurt, for support of Prof. K. Friedrich’s research activities in 1999.
REFERENCES
1. Stauffer, D. and Aharony, A., Perkolationstheorie, Eine Einführung. VCH, Weinheim,1995.
2. Dani, A. and Ogale, A. A., “Electrical Percolation Behavior of Short-FiberComposites: Experimental Characterization and Modeling”, Composite Science andTechnology, Vol. 56, 1996, pp. 911-920.
3. Wang, S. F. and Ogale, A. A., “Simulation of Percolation Behavior of AnisotropicShort-Fiber Composites with a Continuum Model and Non-Cubic Control Geometry”,Composite Science and Technology, Vol. 46, 1993, pp. 389-398.
4. Munson-McGee, S. H., “Estimation of the Critical Concentration in an AnisotropicPercolation Network”, Physical Review B., Vol. 43, 1991, pp. 3331-3336.
5. Kirkpatrick, S., “Percolation and Conduction”, Reviews of Modern Physics, Vol. 45,1973, pp. 574-588.
- 10 -
6. Levon, K., Margolina, A. and Patashinsky, A. Z., “Multiple Percolation in ConductingPolymer Blends”, Macromolecules, Vol. 26, 1993, pp. 4061-4063.
7. Lux, F., “Models Proposed to Explain the Electrical Conductivity of Mixtures Madeof Conductive and Insulating Materials”, Journal of Materials Science, Vol. 28, 1993, pp.285-301.8. Bueche, F., “Electrical Resistivity of Conducting Particles in an Insulating Matrix”,Journal of Applied Physics, Vol. 43, 1972, pp. 4837-4838.
9. Nielsen, L. E., “The Thermal and Electrical Conductivity of Two-Phase Systems”,Industrial and Engineering Chemistry Fundamentals, Vol. 13, 1974, pp. 17-20.
10. Bigg, D. M., “Conductive Polymeric Compositions”, Polymer Engineering andScience, Vol. 17, 1977, pp. 842-847.
11. McCollough, R. L., “Generalized Combining Rules for Predicting TransportProperties of Composite Materials”, Composites Science and Technology, Vol. 22, 1985, pp.3-21.
12. Berger, M. A. and McCollough, R. L., “Characterization and Analysis of the ElectricalProperties of a Metal-filled Polymer”, Composites Science and Technology, Vol. 22, 1985,pp. 81-106.
13. Ondracek, G., “The Quantitative Microstructure-Field Property Correlation ofMultiphase and Porous Materials”, Reviews on Powder Metallurgy and Physical Ceramics,Vol. 3, 1987, pp. 205-322.
14. Weber, M., The Processing and Properties of Electrically Conductive FiberComposites, PhD Thesis, McGill University, Montreal, Canada, 1995.
15. Batchelor, G. K. and O’Brien, R. W., “Thermal or Electrical Conduction Through aGranular Material”, Proc. R. Soc. Lond, Vol. A. 355, 1977, pp. 313-333.
16. Weber, K. and Kamal, M. R., “Estimation of the Volume Resistivity of ElectricallyConductive Composites”, Polymer Composites, Vol. 18, 1997, pp. 711-725.
17. Taipalus, R., Harmia, T. and Friedrich, K., “Short Fibre Reinforced PP/PANI-Complex-Blends and Their Mechanical and Electrical Properties”, Accepted for AppliedComposite Material, 1999.
18. Taipalus, R., Harmia, T. and Friedrich, K., “Influence of PANI-Complex on theMechanical and Electrical Properties of Carbon Fibre Reinforced PolypropyleneComposites”, Submitted to Polymer Composites, March 1999
19. Tanner, J., Rheology and Conductivity of the Blends of Polyaniline and Polyolefines.Licentiate’s Thesis, Helsinki University of Technology (1998).
20. Gerteisen, S. R., “Carbon Fibre Reinforced Thermoplastics with Controlled SurfaceResistivity”, Engineering Plastics, Vol. 9, 1992, 2, pp.126-134.