ESTIMATION OF CRITICAL HEADWAY AT SMALL URBAN …
15
Maslać D, Cvitanić D, Lovrić I. Estimation of Critical Headway at Small Urban Roundabout Traffic Planning Preliminary Communication Submitted: 7 Jan. 2019 Accepted: 26 June 2019 Promet – Traffic&Transportation, Vol. 32, 2020, No. 1, 103-117 103 ABSTRACT Before choosing an intersection project design, an important step is to examine the justification of the construction on the basis of defined criteria. One of the key criteria is the analysis of capacity. Large numbers of roundabout capacity models are present in the world, most of them adapted to the conditions of the country they originate from and they need to be calibrated for local conditions. Key parameters for calibration are crit- ical headway and follow-up headway. Follow-up head- way can be measured directly in the field, while critical headway cannot be measured, but is estimated. Many critical headway estimation methods exist (over 30) and each of them provides different values. Different values of critical headway result in different capacity estimation values. This raises the question which method provides more realistic estimations under certain conditions. In this paper, four most frequently used critical headway estimation methods (Raff, Maximum likelihood method, Wu, Logit) were selected to be tested by comparison of theoretical capacity models and actual measured capac- ity at a small urban roundabout. KEY WORDS small urban roundabout; estimation of critical headway; measured capacity; model testing; 1. INTRODUCTION The use of roundabouts in the cities is becom- ing increasingly popular due to urban sustainability. Roundabouts have, namely, a positive impact on the environment due to lower fuel consumption, wait- ing time, and noise. Space is often a limiting factor in the cities, so the use of small urban roundabouts of a diameter of 10-12 m is acceptable if it meets other criteria. Therefore, this paper researches the functioning of a small urban roundabout, in order to provide its input to the analysis of the capacity, and the possibility of its application and contribution to urban sustainability. On the occasion of selecting a project solution at a given location it is necessary to conduct a traf- fic analysis, which will confirm the selection of the project solution. One of the key criteria is the ca- pacity which is in correlation with delays, gas emis- sions and fuel consumption at the roundabout. The delay model is very sensitive to capacity values, so as accurate as possible estimation of the capacity is necessary [1]. The intersection approach capaci- ty represents the maximum number of vehicles that can pass through the intersection approach section over a predetermined time period under prevailing conditions. There is a large number of roundabout capacity models in the world, which are grouped into three key groups [2]: 1) Empirical models based on the relationships be- tween geometry and actual measured capacity in certain traffic and road conditions; 2) Analytical gap acceptance models based on un- derstanding the driver behaviour; 3) Microscopic simulation models based on the modelling of vehicle kinematics and interactions. None of these model groups fully describes the behaviour of drivers and processes at a roundabout, so the model parameters need to be calibrated to local conditions. In this paper, the analytical mod- els of capacity were analysed on the basis of gap acceptance theory. They are the easiest to adapt to country-specific conditions, because they have DANIJELA MASLAĆ, B.Sc. 1 E-mail: [email protected] DRAŽEN CVITANIĆ, Ph.D. (Corresponding author) E-mail: [email protected] IVAN LOVRIĆ, Ph.D. 1 E-mail: [email protected] 1 Faculty of Civil Engineering University of Mostar, Matice hrvatske bb, 88000 Mostar, Bosnia and Herzegovina 2 Faculty of Civil Engineering, Architecture and Geodesy, University of Split Ulica Matice hrvatske 15, 21000 Split, Croatia ESTIMATION OF CRITICAL HEADWAY AT SMALL URBAN ROUNDABOUT
Transcript of ESTIMATION OF CRITICAL HEADWAY AT SMALL URBAN …

Maslać D, Cvitanić D, Lovrić I. Estimation of Critical Headway at Small Urban Roundabout
Traffic Planning Preliminary Communication
Submitted: 7 Jan. 2019 Accepted: 26 June 2019
Promet – Traffic&Transportation, Vol. 32, 2020, No. 1, 103-117 103
ABSTRACTBefore choosing an intersection project design,
an important step is to examine the justification of the construction on the basis of defined criteria. One of the key criteria is the analysis of capacity. Large numbers of roundabout capacity models are present in the world, most of them adapted to the conditions of the country they originate from and they need to be calibrated for local conditions. Key parameters for calibration are crit-ical headway and follow-up headway. Follow-up head-way can be measured directly in the field, while critical headway cannot be measured, but is estimated. Many critical headway estimation methods exist (over 30) and each of them provides different values. Different values of critical headway result in different capacity estimation values. This raises the question which method provides more realistic estimations under certain conditions. In this paper, four most frequently used critical headway estimation methods (Raff, Maximum likelihood method, Wu, Logit) were selected to be tested by comparison of theoretical capacity models and actual measured capac-ity at a small urban roundabout.
KEY WORDSsmall urban roundabout; estimation of critical headway; measured capacity; model testing;
1. INTRODUCTIONThe use of roundabouts in the cities is becom-
ing increasingly popular due to urban sustainability. Roundabouts have, namely, a positive impact on the environment due to lower fuel consumption, wait-ing time, and noise. Space is often a limiting factor in the cities, so the use of small urban roundabouts of a diameter of 10-12 m is acceptable if it meets
other criteria. Therefore, this paper researches the functioning of a small urban roundabout, in order to provide its input to the analysis of the capacity, and the possibility of its application and contribution to urban sustainability.
On the occasion of selecting a project solution at a given location it is necessary to conduct a traf-fic analysis, which will confirm the selection of the project solution. One of the key criteria is the ca-pacity which is in correlation with delays, gas emis-sions and fuel consumption at the roundabout. The delay model is very sensitive to capacity values, so as accurate as possible estimation of the capacity is necessary [1]. The intersection approach capaci-ty represents the maximum number of vehicles that can pass through the intersection approach section over a predetermined time period under prevailing conditions. There is a large number of roundabout capacity models in the world, which are grouped into three key groups [2]: 1) Empirical models based on the relationships be-
tween geometry and actual measured capacity in certain traffic and road conditions;
2) Analytical gap acceptance models based on un-derstanding the driver behaviour;
3) Microscopic simulation models based on the modelling of vehicle kinematics and interactions.None of these model groups fully describes the
behaviour of drivers and processes at a roundabout, so the model parameters need to be calibrated to local conditions. In this paper, the analytical mod-els of capacity were analysed on the basis of gap acceptance theory. They are the easiest to adapt to country-specific conditions, because they have
DANIJELA MASLAĆ, B.Sc.1 E-mail: [email protected]ŽEN CVITANIĆ, Ph.D. (Corresponding author)E-mail: [email protected] LOVRIĆ, Ph.D.1 E-mail: [email protected] Faculty of Civil Engineering University of Mostar, Matice hrvatske bb, 88000 Mostar, Bosnia and Herzegovina2 Faculty of Civil Engineering, Architecture and Geodesy, University of Split Ulica Matice hrvatske 15, 21000 Split, Croatia
ESTIMATION OF CRITICAL HEADWAY AT SMALL URBAN ROUNDABOUT

Maslać D, Cvitanić D, Lovrić I. Estimation of Critical Headway at Small Urban Roundabout
104 Promet – Traffic&Transportation, Vol. 32, 2020, No. 1, 103-117
in Portugal (two single-lane roundabouts, one with two lanes at the entry and three lanes in the circle and three standard two-lane roundabouts). For ca-pacity estimation the Tanner general capacity model is used.
2. EXISTING CAPACITY MODELS AND CALIBRATION PARAMETERSAnalytical models of capacity, based on the gap
acceptance theory are sensitive to the value of crit-ical headways and follow-up headways, as well as to the distribution of headways in the main flow [2]. The occurrences of headways in the main flow for the analysed period are described by probability distribution functions [6]. The key objective is to achieve as realistic a description of the occurrence of headways in the main flow as possible, and mod-elling of the traffic queues generation in the main flow.
The most frequently used headway distributions in the main flow are represented by negative expo-nential distribution (M1), shifted negative exponen-tial distribution (M2), and “bunched” exponential distribution (M3), shown graphically in Figure 2.
The M1 distribution assumes that vehicles pass one by one accidentally regardless of when the pre-vious vehicle passed. When traffic load of the main flow is close to the capacity value, this distribution is somewhat less adapted to actual observations and there is no possibility to describe the generation of queues in the main flow [6].
The shifted exponential distribution with M2 designation assumes the minimum headway be-tween the passing of two vehicles tm, and therefore it does not start from 0, but is shifted by tm, thereby achieving a description of the length of the vehi-cle i.e. the minimum time during which no other vehicle can use that headway. This distribution de-scribes the distribution of headways in a somewhat better manner than the exponential distribution, but
fewest parameters that need to be and can be cal-ibrated. These models are based on the measuring of individual movement parameters between the vehicles in circular flow and in entry flow. The key parameters to determinate the input capacity are critical headway (tc), follow-up headway (tf) and distribution of headways inside the roundabout [2].
Critical headway cannot be measured directly in the field, but is estimated on the basis of accepted and rejected headways [3]. Neither in Bosnia and Herzegovina nor in the neighbouring Republic of Croatia are there any calibration parameters for roundabouts, but the project engineers use a cer-tain capacity model with parameters adapted to other countries and by doing so obtain unrealistic values of capacity and delay. The current scientific knowledge of critical headways obtained by using the methods which were applied on the estimation under the observed local conditions of individual countries is presented in Table 1.
The value of critical headway significantly af-fects the capacity, so it is important to evaluate it as reliably as possible. About 30 evaluation meth-ods are mentioned in References. All these methods provide different results, so the question is imposed regarding which procedure provides the most reli-able estimation. This is the question this paper is trying to answer. Four most frequently used critical headway estimation methods (RAFF, MLM, WU, LOGIT) were selected to be tested to determine which of them provides the most realistic estima-tion of the critical headway under the conditions of a small urban roundabout. The testing was per-formed by comparing the measured capacity in the field and the results of the capacity models in which the estimated values of the critical headway tc were used, which were obtained by using the abovemen-tioned methods.
The method for critical headway estimation, roundabout capacity model and delay model must create an integrated system which is consistent with the use of definitions and model assumptions [6].
In this paper, the methodology for testing results of the methods for estimating the critical headway by comparison of the modelled and measured ca-pacity was used as shown in Figure 1.
In this paper the emphasis is only on a small ur-ban roundabout (geometry is limited to use diam-eter 20-22 m). The Portugal studies presented in the literature [5] do not use the limited geometry for research. They used six different roundabouts
Table 1 – Critical headways of individual countries for single-lane roundabout [4, 5]
Country Critical headway [s]Slovenia 4.8
Israel 4.00Denmark 5.12
Italy 3.54-4.10Portugal 3.23-4.50Germany 4.12
US 4.50-5.30

Maslać D, Cvitanić D, Lovrić I. Estimation of Critical Headway at Small Urban Roundabout
Promet – Traffic&Transportation, Vol. 32, 2020, No. 1, 103-117 105
Modelled capacity
Modelled capacity
Calibrationparameters
Criticalheadway
tc
Follow-upheadway
tf
EstimatedDirectly
measured
RAFFmethod
tc1
MLMmethod
tc2
WUmethod
tc3
LOGITmethod
tc4
Comparing Measurablecapacity
Figure 1 – Applied methodology of testing
traffic flow. The most frequently used distribution is Cowan’s M3 headway distribution, which mod-els the participation of free-moving vehicles φ by shifted exponential headway distribution, while the remaining (1- φ) vehicles driving in queues have the same time interval Δ [7].
In this paper, the analytical gap acceptance ca-pacity models based on the understanding the driv-er’s behaviour (Highway Capacity Manual 2010 and Brilon-Wu model) were used to test the results of the critical headway estimation methods, for the purpose of an easier adaptation to local conditions.
The American Highway Capacity Manual 2010 (HCM 2010) model of the capacity of a single-lane roundabout, defined by Expression 1, was established as an exponential regression model of experimental research in the USA [8].
c e1130 ( . )v1 0 10 c3= $- - (1)
It is evident from Expression 1 that this model form requires only the data on the circulating flow. Due to the adaptation to the local conditions, HCM 2010 generalizes the capacity expression form to Ex-pression 2.
c Ae( )Bvc= - (2)
it does not have the ability to model the generation of queues in the main flow. Therefore, it also de-scribes the participation of time headways in the conditions of a higher traffic density in somewhat poorer manner and is rarely used [6].
The distribution with M3 designation assumes that in one traffic flow there is a certain number of vehicles driving in a queue, while the rest of the vehicles drive freely without interaction with other vehicles, which is a more realistic description of a
F (t)
1
0.9
0.8
0.7
0.6
0.5
0.4
0.3
0.2
0.1
0
t [s]0 5 10 15 20 25 30
M1M2M3
Figure 2 – Negative exponential distribution (M1), shifted negative exponential distribution (M2), and “bunched”
exponential distribution (M3) [1]

Maslać D, Cvitanić D, Lovrić I. Estimation of Critical Headway at Small Urban Roundabout
106 Promet – Traffic&Transportation, Vol. 32, 2020, No. 1, 103-117
Critical headway (tc) represents the minimum time headway in the main flow which will be ac-cepted by the vehicle from the secondary flow [3], as shown in Figure 3. It cannot be measured directly in the field, but is estimated based on the recorded ac-cepted and rejected headways by application of one of the statistical estimation methods [3]. The critical headway can be described by an arbitrary function of time headways acceptance that assumes that the accepted headways are oriented in accordance with some probability distribution. Usually, the normal or log-normal distribution is used. The log-normal distribution describes the accepted headways in a more realistic manner, because it only receives pos-itive values and is positively asymmetric [6].
tc
Figure 3 – Critical headway (tc) [3]
It is considered that a headway is accepted if the vehicle entered from a minor flow into the main stream during the headway, and if not, if the vehicle is still waiting for another time headway, then this is a rejected headway. If two or more vehicles enter the main flow during the same headway, then this headway will not be taken into consideration [3].
Figure 4 shows a follow-up headway (tf), defined as average time between two passing of two or more vehicles in a sequence from a minor flow in the same headway into the main flow [3]. It can be determined directly from the measuring in the field as an average value.
where:
,A t Bt
t3600
36002
f
cf
= =- a k
vc - circulating flow [veh/h]; tc - critical headway [s]; andtf - follow-up headway [s].
Therefore, HCM 2010 model can be calibrated by using only two parameters: critical headway tc and follow-up headway tf [8]. The parameter values of the model for the US conditions are presented in Table 2.
Table 2 – Calibration parameters for HCM2010 US
tc tfModel HCM 2010 5.19 3.20
The HCM 2010 model of the capacity of a sin-gle-lane roundabout is an empirical model with a form of theoretical Siegloch M1 capacity model [9], which is defined by Expression 3.
c te t
t2
f
vc
fc
=-- a k
(3)
Therefore, model HCM2010 is an empirical model with the form of a theoretical model.
The roundabout capacity model Brilon-Wu was derived from the gap acceptance principles and the queuing theory [10], defined by Expression 4.
c nv
tn e3600 1 3600c
cn
fe v t
t3600 2
c cc
f
$D= - D- -b a bl k l (4)
where:nc - number of lanes in a roundabout;ne - number of entry lanes;Δ - minimum headway between vehicles on the circular lane [s].
This model uses the Cowan’s M3 headway dis-tribution of the main flow [2].
According to the Brilon-Wu model, the cali-bration parameters are not fixed and depend on the geometry i.e. on the diameter of the round-about . . ,d1 57 18 6D = + so the values for a small compact roundabout of 22 m diameter would be: tc=4.2 s , tf=2.9 s, Δ=2.41 s.
The analytical gap acceptance models do not di-rectly quantify the relationship between geometry (the only factor that can be controlled by the project engineer for the roundabout) and capacity directly, but indirectly through the calibration parameters, which are described below.
tf
Figure 4 – Follow-up headway (tf)
Maslać D, Cvitanić D, Lovrić I. Estimation of Critical Headway at Small Urban Roundabout
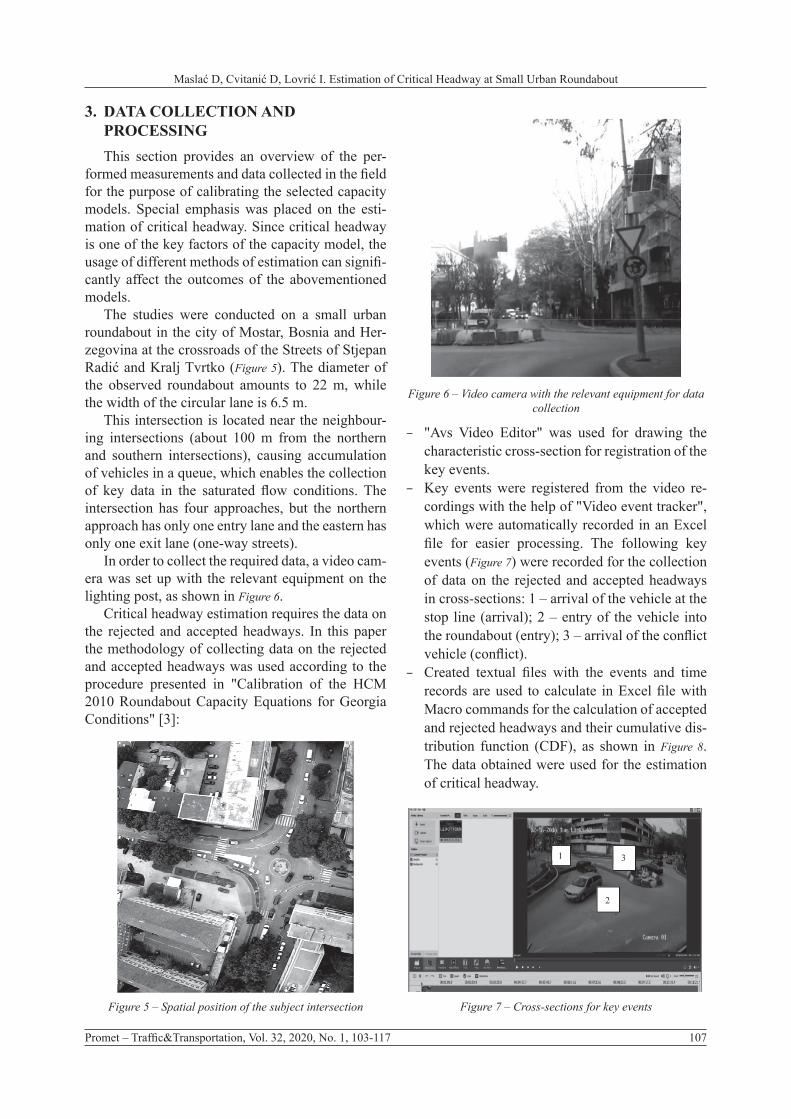
Promet – Traffic&Transportation, Vol. 32, 2020, No. 1, 103-117 107
– "Avs Video Editor" was used for drawing the characteristic cross-section for registration of the key events.
– Key events were registered from the video re-cordings with the help of "Video event tracker", which were automatically recorded in an Excel file for easier processing. The following key events (Figure 7) were recorded for the collection of data on the rejected and accepted headways in cross-sections: 1 – arrival of the vehicle at the stop line (arrival); 2 – entry of the vehicle into the roundabout (entry); 3 – arrival of the conflict vehicle (conflict).
– Created textual files with the events and time records are used to calculate in Excel file with Macro commands for the calculation of accepted and rejected headways and their cumulative dis-tribution function (CDF), as shown in Figure 8. The data obtained were used for the estimation of critical headway.
3. DATA COLLECTION AND PROCESSING This section provides an overview of the per-
formed measurements and data collected in the field for the purpose of calibrating the selected capacity models. Special emphasis was placed on the esti-mation of critical headway. Since critical headway is one of the key factors of the capacity model, the usage of different methods of estimation can signifi-cantly affect the outcomes of the abovementioned models.
The studies were conducted on a small urban roundabout in the city of Mostar, Bosnia and Her-zegovina at the crossroads of the Streets of Stjepan Radić and Kralj Tvrtko (Figure 5). The diameter of the observed roundabout amounts to 22 m, while the width of the circular lane is 6.5 m.
This intersection is located near the neighbour-ing intersections (about 100 m from the northern and southern intersections), causing accumulation of vehicles in a queue, which enables the collection of key data in the saturated flow conditions. The intersection has four approaches, but the northern approach has only one entry lane and the eastern has only one exit lane (one-way streets).
In order to collect the required data, a video cam-era was set up with the relevant equipment on the lighting post, as shown in Figure 6.
Critical headway estimation requires the data on the rejected and accepted headways. In this paper the methodology of collecting data on the rejected and accepted headways was used according to the procedure presented in "Calibration of the HCM 2010 Roundabout Capacity Equations for Georgia Conditions" [3]:
Figure 5 – Spatial position of the subject intersection
Figure 6 – Video camera with the relevant equipment for data collection
1
2
3
Figure 7 – Cross-sections for key events

Maslać D, Cvitanić D, Lovrić I. Estimation of Critical Headway at Small Urban Roundabout
108 Promet – Traffic&Transportation, Vol. 32, 2020, No. 1, 103-117
On the occasion of evaluating each method, the same driver samples were used, i.e. for each driver their accepted and maximum rejected headways were registered. Inconsistent drivers with the maximum rejected headways higher than the eventually accept-ed headway were excluded from the calculation.
4.1 Raff methodThe Raff method provides a graphical presenta-
tion of the solution and it is the most frequently used method due to the simplicity of the procedure. The method is non-parametric, i.e. it does not require pre-determined critical headway distribution parameters, but constructs the empirical distribution functions by which the solution is sought directly from the data on the accepted and rejected time headways [5]. The headway that has the same number of accepted and
The follow-up headway measuring was per-formed directly from the video recordings using auxiliary tools. A queue of vehicles was observed, and the entry of the first and each subsequent vehi-cle from the queue was registered, which used the same time headway for entering the roundabout. The registered events with time records were auto-matically recorded in an Excel file. As a result there-of, the average time between the passing of two or more subsequent vehicles from the minor flow into the same headway in the main flow was determined. For the selected sample, the average time of fol-low-up headway tf=2.9 s was obtained.
In this paper, the value of the minimum headway within the main flow D was not determined, but the value D=2.41 s was used depending on diameter
,. .d1 57 18 6D = +c m recommended by Brilon [11].
4. ESTIMATION OF THE CRITICAL HEADWAYAn overview of the selected statistical methods
for the critical headway estimation (RAFF, MLM, WU, LOGIT) and their application in the selected sample for the morning peak hour is presented in Table 3.
Import events
Concept of accepted and rejected gap (headway) used by NCHRP572
Results
Figure 8 – The applied concept of accepted and rejected gaps (headways)
Table 3 – Traffic flow of selected sample, morning peak hour (07:00-08:00h)
Approach Entry flow (Ve) [vehicle per hour]
Circulating flow (Vc)[vehicle per hour]
North 817 234South 410 424West 384 799

Maslać D, Cvitanić D, Lovrić I. Estimation of Critical Headway at Small Urban Roundabout
Promet – Traffic&Transportation, Vol. 32, 2020, No. 1, 103-117 109
rd - rejected headway;Fa(ad)- probability function accepted headways;Fr(rd) - probability function rejected headways.
In this model, only the maximum rejected headways are taken into consideration, which are smaller than the corresponding accepted headways. Therefore, for an individual driver d at a secondary flow (intersect approach) the following is observed: the accepted headway ad and the corresponding maximum rejected headway rd. The MLM meth-od is based on the assumption that all drivers at the secondary intersection approach are consistent and homogeneous (ad ≥ rd), which means that each minor driver will reject each headway which is smaller than their critical headway and will accept the first headway which is larger than the critical headway [5]. Figure 10 shows the results of the crit-ical headway estimation (tc) by the MLM method for the selected sample. For the critical headway, the mean value of the lognormal function is taken, and is calculated for the optimal distribution param-eters (µ and σ2) which are calculated according to the expression:
t ec 22
= n v+ (6)
rejected headways is taken as the critical headway (tc). Figure 9 presents the graphical solution for the se-lected sample.
4.2 MLM methodThe MLM method (Maximum Likelihood Meth-
od) uses the log-normal distribution of time head-ways in the main flow. This distribution describes headways very well, because the function is posi-tive and asymmetrical and that way it describes the drivers’ real behaviour [12]. The likelihood function is defined as the likelihood that the distribution of the critical headway is found between the observed distribution of maximum rejected headways and the accepted headways and is calculated according to the expression:
( ) ( )lnL F a F ra d r dd
n
1=
=6 @/ (5)
where:L - logarithm of the highest probability function;d - minor driver (sample size n);ad - accepted headway;
Rejected headways Accepted headways
NORTH1
0.8
0.6
0.4
0.2
00 2 4 6 8 10 12 14 16 18 20 22 24 26 28 30 32 34 36 38 40 42 44 46 48 50 52 54 56 58 60 62 64 66 68 70 72 74 76
tc=4.0 s
SOUTH1
0.8
0.6
0.4
0.2
00 1 2 3 4 5 6 7 8 9 10 11 12 13 14 15 16 17 18 19 20 21 22 23 24 25 26 27 28 29 30 31 32
tc=4.4 s
WEST1
0.8
0.6
0.4
0.2
00 1 2 3 4 5 6 7 8 9 10 11 12 13 14 15 16 17 18 19 20 21 22 23 24 25 26 27 28 29 30 31
tc=4.41 s
Figure 9 – Results of Raff method of tc by approach for the selected sample

Maslać D, Cvitanić D, Lovrić I. Estimation of Critical Headway at Small Urban Roundabout
110 Promet – Traffic&Transportation, Vol. 32, 2020, No. 1, 103-117
iteration. All relevant headways can be taken into account, and not just the maximum rejected head-ways, as for example in the MLM method [5].
The average value of the estimated values is tak-en as critical headway (tc) [7].
Figure 11 shows the parameters and the results of tc for the selected sample.
4.4 LOGIT methodThis method uses a negative likelihood func-
tion logarithm (Likelihood) [5]. Several approach-es have been developed that can be summarized as logit models. Logit is basically a linear regression model with a mathematical form as presented in Ex-pression 8:
( )P e1 (i 10 1a = + b b+- -^ ^ hh (8)
where: P(α) - probability of accepting headway of size i;β0, β1 - regression coefficients;
This model is frequently used to check the influ-ence of various independent variables on a critical headway, such as waiting time, average speed, etc. [14]. Figure 12 shows the results of tc of the LOGIT method for the selected sample.
4.3 WU method
The Wu method does not require a predeter-mined function of critical headways distribution nor the assumption of consistency or homogeneity of drivers. It is a cumulative distribution function (CDF) of critical headways. This method is based on the theoretical background of equilibrium of probability between the accepted and rejected time headways [13], defined according to the expression:
( ) ( ) ( )( )
( ) ( )( )
F t F t F tF t
F t F tF t
1 1 11
tca r
a
a r
r= + = +- - --
(7)
The equilibrium is established from the cumula-tive distribution of the rejected and accepted head-ways.
The observed likelihood of accepting the head-way with length t is Fa(t) and the likelihood of re-jecting is 1-Fa(t) [12]. The observed probability of rejection of the headway with length t is Fr(t) and the probability of non-rejection is 1-Fr(t). The ad-vantages of this model refer to a good theoretical background (Markov chain and the equilibrium of probability) and simplicity of the procedure without
0 1 2 3 4 5 6 7 8 9 10 11 12 13 14 15 16 17 18 19 20
Negativelog-likelihood
NORTH1
0.8
0.6
0.4
0.2
0
Log- transformed Original
Mean 1.42
0.28
15.77
4.28
1.22
tc
Std.dev
Original
4.20
1.25
tc
0 1 2 3 4 5 6 7 8 9 10 11 12 13 14 15 16 17 18 19 20
Negativelog-likelihood
SOUTH1
0.8
0.6
0.4
0.2
0
Log- transformed
Mean 1.39
0.29
18.38
Std.dev
4.59
1.05
tc
0 1 2 3 4 5 6 7 8 9 10 11 12 13 14 15 16 17 18 19 20
1
0.8
0.6
0.4
0.2
0
Negativelog-likelihood
WEST
Log- transformed Original
Mean 1.50
0.22
47.0
Std.dev
Rejected headways Accepted headwaysCritical headway
Figure 10 – Results of MLM method of tc by approach for the selected sample

Maslać D, Cvitanić D, Lovrić I. Estimation of Critical Headway at Small Urban Roundabout
Promet – Traffic&Transportation, Vol. 32, 2020, No. 1, 103-117 111
0 1 2 3 4 5 6 7 8 9 10 11 12 13 14 15 16 17 18 19 20
NORTH1
0.8
0.6
0.4
0.2
0
Negativelog-likelihood
Mean6.85
-1.63
17.61
4.21
1.11
tc
Std.dev
a
b
0 1 2 3 4 5 6 7 8 9 10 11 12 13 14 15 16 17 18 19 20
SOUTH1
0.8
0.6
0.4
0.2
0
Negativelog-likelihood
Mean5.95
-1.44
20.36
4.13
1.26
tc
Std.dev
a
b
0 1 2 3 4 5 6 7 8 9 10 11 12 13 14 15 16 17 18 19 20
10.80.60.40.2
0
WEST
Negativelog-likelihood
Mean7.00
-1.54
44.85
Std.dev
a
b
Rejected headways Accepted headwaysCritical headway
4.56
1.18
tc
WEST
0 1 2 3 4 5 6 7 8 9 10 11 12 13 14 15 16 17 18 19 20
1
0.8
0.6
0.4
0.2
0
Mean
Std.dev
4.26
1.05
tc
0 1 2 3 4 5 6 7 8 9 10 11 12 13 14 15 16 17 18 19 20
NORTH1
0.8
0.6
0.4
0.2
0
Mean
Std.dev
0 1 2 3 4 5 6 7 8 9 10 11 12 13 14 15 16 17 18 19 20
SOUTH1
0.8
0.6
0.4
0.2
0
Mean 4.47
0.89
tc
Std.dev
4.64
0.84
tc
Rejected headways Accepted headwaysCritical headway
Figure 11 – Results of WU method of tc by approach for the selected sample
Figure 12 – Results of LOGIT method of tc by approach for the selected sample

Maslać D, Cvitanić D, Lovrić I. Estimation of Critical Headway at Small Urban Roundabout
112 Promet – Traffic&Transportation, Vol. 32, 2020, No. 1, 103-117
– At the western intersection approach, where the entry flow is low (ventry=384 veh/h, vconflict= 799 veh/h) the highest values were obtained on average tc-a (4.55 s). Drivers do not wait for a long time, so they are less impatient and are ready to wait for a longer headway to enter the roundabout. The above results show that the crit-ical headway is sensitive to the relationship of the entry flow and the conflict flow. Considering that the RAFF method does not
have a cumulative distribution of the critical head-way, Figure 14 shows a comparison of the critical headway distribution curve for the southern in-tersection approach according to MLM, WU and LOGIT method. In MLM and LOGIT methods, the distribution is parameter-based, i.e. it is necessary to predetermine the distribution parameters (for MLM log-normal and for LOGIT logistic distribution), so the "mean" value of those distributions is taken as the average value of tc.
The WU method is a non-parametric method and the obtained distribution of the critical head-ways is empirical (stepped as well as the function of accepted / rejected headways). It does not require a predetermined critical headway distribution func-tion nor the assumptions on drivers’ consistency or homogeneity, but the function is calculated directly on the basis of the data on the accepted and rejected headways. Precisely this is the key advantage of this method, so the empirical distribution follows the distribution of the accepted and rejected headways.
The obtained average critical headway values per intersection approach of the selected sample were tested by a comparison of the measured ca-pacity in the field and calibrated theoretical models. For the calibration of the capacity model, the mean values of all intersection approaches of tc were used,
In the LOGIT method, the average value of tc is at 50% of probability of acceptance.
5. ANALYSIS AND RESULTS OF TESTING
Figure 13 shows the values of critical headways (tc) as obtained by intersection approach for the se-lected sample of the morning peak hour using the abovementioned four methods.
From the presented results obtained from the se-lected sample, the following can be noticed:
– The average values of tc with all three intersec-tion approaches obtained by using four different methods (RAFF, MLM, WU, LOGIT) do not feature large deviations (4.19 s, 4.36 s, 4.46 s, 4.30 s). On average, the RAFF method provides the lowest values of tc because it does not use the cumulative distribution of critical headways, but takes the headway that has the same number of accepted and rejected headways as the crit-ical headway. The MLM and LOGIT methods provide approximately the same values of tc, while the WU method provides somewhat high-er tc values on average.
– At the northern intersection approach, where the entry flow is extremely high (ventry=817 veh/h, vconflict=234 veh/h) and vehicles wait for a long time due to the degree of saturation of that in-tersection approach, the lowest values were ob-tained on average tc (4.18 s).
– The reason thereof is the behaviour of drivers coming from the queue. The drivers become impatient due to driving in a queue and accept shorter headways for entering the main flow.
Ve=817[veh/h]
Ve=384[veh/h]
Ve=410[veh/h]
Vc=799[veh/h]
Vc=234[veh/h]
Vc=424[veh/h]
MethodMeantc [s]
Northtc [s]
Southtc [s]
Westtc [s]
Mean by approach
RAFF
RAFF
MLM
MLM
WU
WU
LOGIT
LOGIT
4.18 4.24 4.55
44.284.264.21
4.404.24.474.13
4.414.594.644.56
4.194.364.464.30
Crit
ical
hea
dway
[s]
4.84.64.44.2
43.83.6
North South West
Figure 13 – Results of tc by approach by four estimated methods for the selected sample

Maslać D, Cvitanić D, Lovrić I. Estimation of Critical Headway at Small Urban Roundabout
Promet – Traffic&Transportation, Vol. 32, 2020, No. 1, 103-117 113
roundabout intersection approach cannot realisti-cally estimate the capacity under the conditions of small urban roundabouts of the saturated flow in Bosnia and Herzegovina. The reason is that this model was developed on the basis of empirical re-search in the USA, where the vehicle length and the age as well as the driver’s behaviour are differ-ent. By analysing the regression coefficient values from Figure 17 (0.624, 0.684, 0.706, 0.670) it can be concluded that the Brilon-Wu model provides sig-nificantly better, i.e. satisfactory estimations of ca-pacity values compared to the measured capacity.
The deviations of the exponential estima-tion curve of the measured capacity in the field
, .c e1 235 9 . v0 001 c= - compared to the results of the calibrated models HCM 2010 and Brilon-Wu are shown in Figure 18. A large deviation of the HCM 2010 model from the measured capacity in the field can be noted, particularly in the zone of large conflict flow, regardless of which method of es-timation of critical headway is used. The reason is in the mathematical form, i.e. in the inclination of the exponential curve and its coefficient 1,130 from Expression 1 of HCM 2010 model, which is a
because the testing was performed in relation to the measured capacity of all intersection approaches of the roundabout.
The measured capacity in the field, defined as ac-tual capacity measured at a certain location is used in this paper as the basis for capacity model testing, but also for determining a more reliable method for the critical headway estimation.
The measured capacity in the field at the subject roundabout was measured directly under the condi-tions of saturated flow at intersection approaches by counting the vehicles in 1-2-minute intervals [15], at all three intersection approaches to obtain as wide a range of conflicts as possible. Thus, by using the Avs and Video Event software the number of vehicles that have entered from the observed approach to a circu-lar stream at 1-2-minute intervals are automatically registered in the Excel file. Also, the number of ve-hicles that passed through a roundabout as a conflict flow to an observed approach is registered.
After that, the data of the veh/min are projected in the veh/h.
Figure 15 shows the measured capacity of the in-tersection approach of the subject roundabout under saturated conditions. The obtained measured capac-ity can be described well by exponential regression expression:
.c e1235 9 . v0 001 c= - (9)
The measured capacity in the field was com-pared with the results of calibrated theoretical mod-els for all the critical headway estimation methods, as shown in Figures 16 and 17.
Extremely low values of the regression coeffi-cient of determination (0.037, 0.207, 0.291, and 0.151) are noted in Figure 16, and it can be conclud-ed that the HCM 2010 model of the capacity of the
LOGIT (tc=4.13 s)
WU (tc=4.47 s)
MLM (tc=4.20 s)
0 1 2 3 4 5 6 7 8 9 10 11 12 13 14 15 16 17 18 19 20 21 22 23 24 25 26 27 28 29 30
1
0.8
0.6
0.4
0.2
0
Prob
abili
ty o
f suc
cess
Headway t [s]
Figure 14 – Comparison of critical headway distribution curves in MLM, WU, and LOGIT methods for the Southern intersection approach of the selected sample
Ente
ring
flow
[veh
/h]
1,400
1,200
1,000
800
600
200
0
Circulating flow [veh/h]0 500 1,000 1,500
Measured capacity [veh/h] Expon. (Measured capacity)
y=1235.9e-0.001x
R2=0.7588
Figure 15 – Measured capacity by all approaches

Maslać D, Cvitanić D, Lovrić I. Estimation of Critical Headway at Small Urban Roundabout
114 Promet – Traffic&Transportation, Vol. 32, 2020, No. 1, 103-117
1,600
1,400
1,200
1,000
800
600
400
200
0
Mod
elle
d ca
paci
ty [v
eh/h
]
1,600
1,400
1,200
1,000
800
600
400
200
0
Mod
elle
d ca
paci
ty [v
eh/h
]
1,600
1,400
1,200
1,000
800.
600
400
200
0
Mod
elle
d ca
paci
ty [v
eh/h
]
1,600
1,400
1,200
1,000
800
600
400
200
0
Mod
elle
d ca
paci
ty [v
eh/h
]
0 500 1,000 1,500Measured capacity [veh/h]
0 500 1,000 1,500Measured capacity [veh/h]
0 500 1,000 1,500Measured capacity [veh/h]
0 500 1,000 1,500Measured capacity [veh/h]
y=1.0926xR2=0.6246
y=1.0645xR2=0.6847
y=1.0717xR2=0.6706
y=1.0526xR2=0.7061
tc=4.36 s MLM method
Linear (tc=4.36 s MLM method)
tc=4.19 s RAFF method
Linear (tc=4.19 s RAFF method)
tc=4.30 s LOGIT method
Linear (tc=4.30 s LOGIT method)
tc=4.46 s WU method
Linear (tc=4.46 s WU method)
1,6001,4001,2001,000
800600400200
0Mod
elle
d ca
paci
ty [v
eh/h
]
1,600
1,400
1,200
1,000
800
600
400
200
0
Mod
elle
d ca
paci
ty [v
eh/h
]
1,600
1,400
1,200
1,000
800
600
400
200
0M
odel
led
capa
city
[veh
/h]
1,6001,4001,2001,000
800600.400200
0.
Mod
elle
d ca
paci
ty [v
eh/h
]
tc=4.46 s WU method
Linear (tc=4.46 s WU method
tc=4.19 s RAFF method
Linear (tc=4.19 s RAFF method)
tc=4.30 s LOGIT method
Linear (tc=4.30 s LOGIT method
tc=4.36 s MLM method
Linear (tc=4.36 s MLM method)
0 500 1,000 1,500Measured capacity [veh/h]
0 500 1,000 1,500Measured capacity [veh/h]
0 500 1,000 1,500
Measured capacity [veh/h]
0 500 1,000 1,500Measured capacity [veh/h]
y=1.1647xR2=-0.037
y=1.1197xR2=0.2912
y=1.1331xR2=0.2072
y=1.1412xR2=0.151
Figure 16 – Testing HCM2010 capacity model
Circulating flow [veh/h] Circulating flow [veh/h]
Entry
flow
[veh
/h]
1,400
1,200
1,000
800
600
400
200
0
Entry
flow
[veh
/h]
1,400
1,200
1,000
800
600
400
200
00 200 400 600 800 1,000 1,200 0 200 400 600 800 1,000 1,200
y=1235,9e-0.001x y=1235,9e-0.001x
Measured capacity RAFF MLM WU LOGIT
Figure 17 – Testing Brilon-Wu capacity model
Figure 18 – Comparison of HCM 2010 and Brilon-Wu model with the measured capacity

Maslać D, Cvitanić D, Lovrić I. Estimation of Critical Headway at Small Urban Roundabout
Promet – Traffic&Transportation, Vol. 32, 2020, No. 1, 103-117 115
Measured capacity (verify sample)Measured capacity (main sample)HCM2010 tc=4.15, RAFFHCM2010 tc=4.50, MLMHCM2010 tc=4.54 WUHCM2010 tc=4.52, LOGITBrilon-Wu tc=4.15, RAFFBrilon-Wu tc=4.50, MLMBrilon-Wu tc=4.54, WUBrilon-Wu tc=4.52 LOGIT
Entry
flow
[veh
/h]
Circulating flow [veh/h]
0 200 400 600 800 1,000 1,200
1,400
1,200
1,000
800
600
400
200
0
y=1320.5e-0.001x
R2=0.8283
y=1235.9e-0.001x
R2=0.7588
Figure 19 – Verification of the results
Even though the model uses tc and tf which can be estimated in local conditions, it does not pro-vide realistic results outside the USA due to the empirical background of the model.
– In the conditions of a small urban roundabout, it is better to use the Brilon-Wu model of the in-tersection approach capacity of the roundabout, since it has a theoretical base (concept based on the queuing theory), and thus it is better adapted to local conditions by calibration of parameters. This model uses Cowan's M3 headway distri-bution within the main flow, providing a more realistic description of the prevailing traffic con-ditions and has the ability of model queues in the main flow. The specific advantage of Brilon-Wu model is that the minimum headway D between successive vehicles in the circle is taken into ac-count.
– Results of tc show the impact of driver’s be-haviour on the critical headway values depend-ing on the size of the entry flow and the conflict flow. The drivers are more aggressive if they reached the stop line from a traffic queue and therefore accept shorter time headways to enter the main flow.
– The RAFF method of estimation of tc is the sim-plest one for conducting the evaluation of tc, since it is graphical and does not have iteration, and on average it provides the lowest values.
– In the analysed conditions, MLM, LOGIT and WU methods have small deviations in the values of tc, while the WU method provides somewhat higher results.
– On the basis of this research, the WU non-para-metric method is preferred. Namely, for a reli-able estimation of the critical headway of a small urban roundabout, it is recommended to use the
regression model developed in the US conditions. The deviations are considerably smaller in the theoretical Brilon-Wu model and are more easily adapted to local conditions by calibration of model parameters.
For the model verification a small urban round-about of similar geometric characteristics and sim-ilar distribution of traffic flows was taken. The Brilon-Wu model of the capacity combined with Wu's estimation method for tc gives the closest data to the measured capacity, which confirms the values of regression coefficients obtained by model testing (Figure 19 and Table 4).
Table 4 – Value of regression coefficient of determination R2
Method HCM2010 Brilon-WuRAFF -0.25 0.45MLM 0.13 0.57WU 0.16 0.59
LOGIT 0.14 0.58
6. CONCLUSIONOn the basis of the results of the conducted stud-
ies, limited to the conditions of a small urban round-about 20-22 m in diameter, the following conclu-sions and recommendations can be made:
– The HCM 2010 model of the intersection ap-proach capacity of the roundabout (which has the form of Siegloch M1 model) is not recom-mended to be used under the conditions of a small urban roundabout in Bosnia and Herze-govina, due to unrealistic capacity values in re-lation to field measurement values. The differ-ences are particularly noticed in the conditions of a larger conflict flow within the roundabout.

Maslać D, Cvitanić D, Lovrić I. Estimation of Critical Headway at Small Urban Roundabout
116 Promet – Traffic&Transportation, Vol. 32, 2020, No. 1, 103-117
analiza propusne moći (kapaciteta). U svijetu postoji velik broj modela kapaciteta kružnih raskrižja koji su uglavnom prilagođeni uvjetima zemlje iz koje potječu, te ih je potrebno kalibrirati za lokalne uvjete. Ključni parametri za kalibraciju su kritična vremenska praznina i vrijeme slijeda. Vrijeme slijeda se može direktno mjeriti na terenu, a kritična praznina ne može, već se procjen-juje. Postoji veliki broj metoda procjene kritične vremen-ske praznine (preko 30) i sve daju različite vrijednosti. Različite vrijednosti kritične vremenske praznine rezul-tiraju različitim vrijednostima procjene kapaciteta. Sto-ga se nameće pitanje koja metoda daje realnije procjene u određenim uvjetima. U ovom su radu odabrane četiri najčešće korištene metode procjene kritične vremenske praznine (Raff, Maximum likelihood method, Wu, Logit) kako bi se testirale usporedbom rezultata teorijskih mod-ela kapaciteta i stvarnog mjerenog kapaciteta na malom urbanom kružnom raskrižju.
KLJUČNE RIJEČImalo gradsko kružno raskrižje; procjena kritične vremenske praznine; mjereni kapacitet; testiranje modela;
REFERENCES[1] Hagring O. Vehicle-Vehicle Interactions at roundabouts
and their Implications for the Entry Capacity. PhD The-sis. Lund University; 1998.
[2] Yap YH, Gibson HM, Waterson BJ. An International Review of Roundabouts Capacity Modeling. Transport Reviews. 2013;33(5): 593-616. Available from: doi:10.1080/01441647.2013.830160
[3] Barry CD. Calibration of the HCM 2010 Roundabout Capacity Equations for Georgia Conditions. Master The-sis. Georgia Institute of Technology; 2012.
[4] Giuffrè O, Granà A, Tumminello ML. Gap-Acceptance Parameters for Roundabouts: A Systematic Review. Eu-ropean Transport Research Review. 2016;8(1). Available from: doi:10.1007/s12544-015-0190-4
[5] Pimentel Vasconcelos AL, Maia Seco Álvaro J, César Bastos Silva AM. Comparison of Procedures to Estimate Critical Headways at Roundabouts. Promet – Traffic & Transportation. 2013;25 (1): 43-53. Available from: doi: 10.7307/ptt.v25i1.1246
[6] Cvitanić D. Modeliranje kapaciteta i razine usluge ne-semaforiziranih raskrižja [Modelling of capacity and level of service at unsignalized intersections]. Magistar-ski rad. Sveučilište u Splitu; 2000. Croatian
[7] Pimentel Vasconcelos AL, Maia Seco Álvaro J, César Bastos Silva AM, Abreu T, Silva J. Comparison of Roundabout Capacity Models. In: Proceedings of the IASTED International Conference on Modeling: Simula-tion and Optimatization, 3-5 July 2012, Banff, Canada. Available from: doi:10.2316/P.2012.783-023
[8] Highway Capacity Manual, HCM 2010. Washington DC, USA: Transportation Research Board (TRB), National Research Council; 2010.
[9] Akcelik R. An Assessment of the Highway Capacity
WU method. This method combined with the Brilon-WU model creates an integrated system which is consistent in using definitions and as-sumptions of the model.
– The advantage is in the theoretical background of this model, which, directly from cumulative functions of the accepted and rejected head-ways, based on the equilibrium of the probability constructs the cumulative distribution of critical headways, and by doing so, describes the pre-vailing conditions in a more reliable manner.
– The advantage of the WU model is also high-lighted in a simpler calculation in relation to MLM and LOGIT methods, since data collection and estimation process form a very complex and long-lasting assignment.
– The research has also shown that measuring the roundabout capacity under the conditions of sat-urated flow is relatively simple and provides a re-liable value of the measured capacity in the field, suitable for a comparison with the capacities ob-tained from the theoretical models. Therefore, the final conclusion would be that the estimation methodology of the critical headway described in this paper provides the possibility of a realis-tic comparison and reliable results, as shown in the example of a small urban roundabout with a diameter of 22 m. This research could help in the microsimulation of roundabout models for the setup distribution type considering the driv-ing behaviour and the vehicle classification local conditions.
DANIJELA MASLAĆ, dipl. ing. građ.1 E-mail: [email protected]. dr. sc. DRAŽEN CVITANIĆ2
E-mail: [email protected]. prof. dr. sc. IVAN LOVRIĆ1
E-mail: [email protected] Građevinski fakultet Sveučilišta u Mostaru Matice hrvatske bb, 88000 Mostar, Bosna i Hercegovina2 Fakultet građevinarstva arhitekture i geodezije, Sveučilište u Splitu Ulica Matice hrvatske 15, 21000 Split, Hrvatska
PROCJENA KRITIČNE VREMENSKE PRAZNINE NA MALOM URBANOM KRUŽNOM RASKRIŽJU
SAŽETAKPrije odabira projektnog rješenja raskrižja važan
korak jeste provjera opravdanosti izgradnje temel-jem definiranih kriterija. Jedan od ključnih kriterija je

Maslać D, Cvitanić D, Lovrić I. Estimation of Critical Headway at Small Urban Roundabout
Promet – Traffic&Transportation, Vol. 32, 2020, No. 1, 103-117 117
Driver’s Critical Gap. Transportation Research. Part A: Policy and Practice. 1999;33(3-4): 187-197. Available from: doi:10.1016/S0965-8564(98)00044-5
[13] Wu N. Estimating Distribution Function of Critical Gaps at Unsignalized Intersections Based on Equilibrium of Probabilities. Transportation Research Record. 2012;2286(2286). Available from: doi: 10.3141/2286-06
[14] Abishai P, Yoram S, Sitvanit SL. Evaluation of the Wait-ing-Time Effect on Critical Gaps at Roundabouts by a Logit Model. European Journal of Transport and Infra-structure Research. 2005;5(1): 1-12.
[15] Johnsons TM. Synthesis of Roundabout Geometric Ca-pacity Measurement: Calibration and Validations to US Field Measurement. Transportation Research Board An-nual Meeting, TRB 2012, Washington, D.C.
Manual 2010 Roundabout Capacity Model. Proceedings of the 3rd International Conference on Roundabouts, Carmel, Indiana. Washington DC, USA: Transportation Research Board of the National Academies; 2011.
[10] Wu N. A universal procedure for capacity determina-tion at unsignalized (priority-controlled) intersections. Transportation Research Part B: Methodological. 2001;35(6): 593-623. Available from: doi:10.1016/S0191-2615(00)00012-6
[11] Brilon W. Roundabouts: A State of the Art in Germany. International Roundabout Conference, Transportation Research Board, 18-20 May 2011, Carmel, Indiana, USA.
[12] Tian Z, Vandehey M, Robinson BW, Kittelson W, Kyte M, Troutbeck R, Brilon W, Wu N. Implementing the Maximum Likelihood Methodology to Measure a