Estimating the Magnitude of Annual Peak Discharges with ...
78
U.S. Department of the Interior U.S. Geological Survey Estimating the Magnitude of Annual Peak Discharges with Recurrence Intervals between 1.1 and 3.0 Years for Rural, Unregulated Streams in West Virginia By JEFFREY B. WILEY, JOHN T. ATKINS, JR., and DAWN A. NEWELL Water-Resources Investigations Report 02-4164 In cooperation with the WEST VIRGINIA DEPARTMENT OF TRANSPORTATION, DIVISION OF HIGHWAYS; WEST VIRGINIA SOIL CONSERVATION AGENCY; and the WEST VIRGINIA GEOLOGICAL AND ECONOMIC SURVEY Charleston, West Virginia 2002
Transcript of Estimating the Magnitude of Annual Peak Discharges with ...

U.S. Department of the Interior U.S. Geological Survey
Estimating the Magnitude of Annual Peak Discharges with Recurrence Intervals between 1.1 and 3.0 Years for Rural, Unregulated Streams in West Virginia
By JEFFREY B. WILEY, JOHN T. ATKINS, JR., and DAWN A. NEWELL
Water-Resources Investigations Report 02-4164
In cooperation with the WEST VIRGINIA DEPARTMENT OF TRANSPORTATION, DIVISION OF HIGHWAYS; WEST VIRGINIA SOIL CONSERVATION AGENCY; and the WEST VIRGINIA GEOLOGICAL AND ECONOMIC SURVEY
Charleston, West Virginia 2002

U.S. DEPARTMENT OF THE INTERIOR GALE A. NORTON, Secretary
U.S. GEOLOGICAL SURVEY Charles G. Groat, Director
Any use of trade, product, or firm names is for descriptive purposes only and does not imply endorsement by the U.S. Government.
For additional information write to: Copies of this report can be purchased from: District Chief U.S. Geological Survey U.S. Geological Survey Branch of Information Services 11 Dunbar Street Box 25286 Charleston, WV 25301 Denver, CO 80225-0286

CONTENTS
Abstract ................................................................................................................................................................................. 1Introduction ........................................................................................................................................................................... 1Description of Study Area........................................................................................................................................... 2Physiographic Provinces ................................................................................................................................... 2Climate .............................................................................................................................................................. 2Background ....................................................................................................................................................... 4
Acknowledgments ....................................................................................................................................................... 5Development of Low-Recurrence-Interval Peak-Discharge Estimating Equations .............................................................. 6
Peak-Discharge Data ................................................................................................................................................... 6Basin-Characteristics Data .......................................................................................................................................... 6Magnitude and Frequency Analysis ............................................................................................................................ 8Data Correlation .......................................................................................................................................................... 10Regional Regression Analysis..................................................................................................................................... 11
Estimating Discharges for Gaged and Ungaged Locations................................................................................................... 13Accuracy of Low-Recurrence-Interval Peak-Discharge Estimating Equations .................................................................... 15Limitations of Low-Recurrence-Interval Peak-Discharge Estimating Equations ................................................................. 17Summary ............................................................................................................................................................................... 17References Cited ................................................................................................................................................................... 18Appendix 1. Fortran Program for Calculating Frequency Factors ........................................................................................ 63Appendix 2. Accuracy of Estimating Equations ................................................................................................................... 67
PLATE (Plate is in pocket)
1. Map showing low-recurrence-interval peak-discharge regions in West Virginia and locations of streamflow-gaging stations.
FIGURES
1, 2. Maps showing 1. Physiographic provinces and Climatic Divide in West Virginia ................................................................... 32. Regional boundaries for the low-recurrence-interval peak-discharge estimating equations for
rural, unregulated streams ............................................................................................................................. 133. Graph showing range of differences for the indicated drainage areas (shaded) of the individual standard
errors of prediction from the average prediction errors ......................................................................................... 16
TABLE
1. Equations and regression statistics determined in the regional regression analysis of peak discharges................. 122. Basin-characteristics data used in the regression analysis to develop low-recurrence-interval
peak-discharge estimating equations for rural, unregulated streams in West Virginia ........................................... 233. Peak-discharge statistics from the frequency analysis of the gaging station systematic and historical
record used to develop low-recurrence-interval peak-discharge estimating equations for rural, unregulated streams .................................................................................................................................................................... 34
4. Magnitude and frequency of peak discharges for gaging stations in West Virginia and surrounding States ......... 44
Contents III

CONVERSION FACTORS AND VERTICAL DATUM
CONVERSION FACTORS
Temperature in degrees Fahrenheit (°F) can be converted to degrees Celsius (°C) as follows:°C = (°F –32) / 1.8
VERTICAL DATUM
Vertical Datum: In this report “sea level” refers to the National Geodetic Vertical Datum of 1929 (NDVD of 1929)—a geodetic datum derived from a general adjustment for the first-order level nets of the United States and Canada, formerly called Sea Level Datum of 1929.
Multiply By To Obtain
acre-foot (acre-ft) 1,233 cubic meters (m3)cubic foot per second (ft3/s) 0.02832 cubic meter per second (m3/s)
cubic foot per second per square mile [(ft3/s)/mi2]
0.01093 cubic meter per second per square kilometer [(m3/s)/km2]
foot (ft) 0.3048 meter (m)inch (in.) 25.4 millimeter (mm)mile (mi) 1.609 kilometer (km)
square mile (mi2) 2.590 square kilometer (km2)
IV Contents

Estimating the Magnitude of Annual Peak Discharges with Recurrence Intervals between 1.1 and 3.0 Years for Rural, Unregulated Streams in West Virginia
By Jeffrey B. Wiley, John T. Atkins, Jr., and Dawn A. Newell
Abstract
Multiple and simple least-squares regression models for the log10-transformed 1.5- and 2-year recurrence intervals of peak discharges with inde-pendent variables describing the basin characteris-tics (log10-transformed and untransformed) for 236 streamflow-gaging stations were evaluated, and the regression residuals were plotted as areal distributions that defined three regions in West Virginia designated as East, North, and South. Regional equations for the 1.1-, 1.2-, 1.3-, 1.4-, 1.5-, 1.6-, 1.7-, 1.8-, 1.9-, 2.0-, 2.5-, and 3-year recurrence intervals of peak discharges were deter-mined by generalized least-squares regression. Log10-transformed drainage area was the most significant independent variable for all regions.
Equations developed in this study are appli-cable only to rural, unregulated streams within the boundaries of West Virginia. The accuracies of estimating equations are quantified by measuring the average prediction error (from 27.4 to 52.4 percent) and equivalent years of record (from 1.1 to 3.4 years).
INTRODUCTION
Engineers commonly use low-recurrence-interval (between 1.1 and 3.0 years) peak discharges as design components for developing stream-restoration plans. Stream restoration is the moving or stabilizing of the stream channel as a result of pre-existing or antici-pated disturbance. Streams may be restored at locations where the stream is not in equilibrium because of natu-ral processes, such as catastrophic flooding and land-slides, that affect stream-channel stability. Determining discharge frequencies at locations where streamflow-gaging stations have been present for more than 10 years can be accomplished by analyzing the stream-flow record. Determining discharge frequencies at stream locations where gaging stations are not present can be more difficult. Generally, discharge frequencies at an ungaged location are estimated from the stream-flow records at nearby gaging stations. This estimating procedure can become time-consuming and expensive. A less expensive method for determining the discharge frequencies at ungaged locations is using regionalized equations. If desirable accuracies are not achievable from regionalized equations, at least cursory estimates are possible.
Introduction 1

The U.S. Geological Survey (USGS), in coopera-tion with the West Virginia Department of Transporta-tion, Division of Highways, the West Virginia Soil Conservation Agency, and the West Virginia Geologi-cal and Economic Survey, developed equations for esti-mating low-recurrence-interval peak discharges for rural, unregulated streams in West Virginia. This report presents peak discharges at gaging stations and equa-tions for estimating the peak discharges at ungaged locations for the 1.1-, 1.2-, 1.3-, 1.4-, 1.5-, 1.6-, 1.7-, 1.8-, 1.9-, 2-, 2.5-, and 3-year recurrence intervals. The statistical methods used in the analyses and the result-ing uncertainties in peak discharges are described to support the reliability of the application of the resulting equations to West Virginia streams. This report uses the same data as Wiley and others (2000), where equations were determined for estimating the 2-, 5-, 10-, 25-, 50-, 100-, 200-, and 500-year peak discharges.
The equations should not be applied to urban areas with paved surfaces, concrete channels, or cul-verts. The equations should not be applied to streams regulated by dams, or large lakes and ponds. Equations are not applicable to heavily mined areas if excessive runoff is diverted into or outside the basin, retained along strip benches, or retained underground. Equa-tions are not applicable to karst areas if excessive runoff is diverted into, outside, or within the basin through solution channels or other cavities in carbonate (limestone and dolomite) rocks.
Description of Study Area
West Virginia is in the mid-Atlantic region of the eastern United States (fig. 1), and can be differentiated by three physiographic provinces and two climatic regions. The three physiographic provinces are the Appalachian Plateaus, Valley and Ridge, and Blue Ridge. Air masses move across the State such that a line defined in this report as the Climatic Divide can identify two climatic regions.
Physiographic Provinces
Generally, the part of the State west of the Climatic Divide is in the Appalachian Plateaus Province, where elevations decrease northwestward from about 3,000–4,860 ft (Spruce Knob) along the Climatic Divide to about 500–700 ft along the Ohio
River. The part of West Virginia east of the Climatic Divide is in the Valley and Ridge Province, except for the extreme eastern tip of the State, which is in the Blue Ridge Province. Elevations decrease from the Climatic Divide to about 250 ft (at Harpers Ferry) in the eastern panhandle (U.S. Geological Survey, 1990).
The Appalachian Plateaus Province consists of consolidated, mostly noncarbonate sedimentary rocks that have a gentle slope from southeast to northwest near the Climatic Divide and are nearly flat-lying along the Ohio River. The one exception to this rock type is the northeastern area of the Province (west of the Climatic Divide), where the rocks are gently folded and some carbonate rock crops out (Fenneman, 1938). The rocks in the Appalachian Plateaus Province have been eroded by streams to form steep hills and deeply incised valleys in dendritic patterns.
The Valley and Ridge Province in West Virginia consists of consolidated carbonate and noncarbonate sedimentary rocks that are folded sharply and exten-sively faulted (Fenneman, 1938). Northeast-trending valleys and ridges parallel the Climatic Divide in a trellis pattern.
The Blue Ridge Province consists of metamor-phic rocks. The Province has high relief between mountains and wide valleys that parallel the Climatic Divide. The rocks are predominantly metamorphosed sandstone and shale within West Virginia (Fenneman, 1938).
Climate
The climate of West Virginia is primarily conti-nental, with mild summers and cold winters. Major weather systems generally approach from the west and southwest, although polar continental air masses of cold, dry air that approach from the north and north-west are not unusual throughout the State. Air masses from the Atlantic Ocean sometimes affect the area east of the Climatic Divide. Generally, tropical continental masses of hot, dry air from the southwest affect the cli-mate west of the Climatic Divide. Tropical maritime masses of warm, moist air from the Gulf of Mexico affect the climate east of the Climatic Divide. Land-recycled moisture through evaporation from local and-upwind land surfaces, lakes, and reservoirs also affects the climate of the State (U.S. Geological Survey, 1991).
2 Estimating Annual Peak Discharges with Recurrence Intervals Between 1.1 and 3.0 Years for Rural, Unregulated Streams in WV

Figure 1. Physiographic provinces and Climatic Divide in West Virginia.
38o
40o
82o
39o
80o
78o
Modified from Fenneman, 1946,and U.S. Geological Survey, 1991
20
20
40 MILES
40 KILOMETERS
0
0
Harpers Ferry
BLUERIDGE
PROVINCE
VALLEY AND
RIDGEPROVINCE
APPALACHIANPLATEAUSPROVINCE
SpruceKnob
OHIO
RIVER
Climat
ic
Divide
40o
84o
Ohio
Maryland
Pennsylvania
Kentucky
WESTVIRGINIA
Virginia
82o 80o 78o
38o
37o
41o
39o
76o
Introduction 3

Precipitation: Annual precipitation averages 42 in. statewide with about 60 percent received from March through August. July is the wettest month, and the months from September through November are the driest. Annual precipitation in the State generally decreases northwestward from about 50–60 in. along the Climatic Divide to about 40 in. along the Ohio River, and is about 40 in. east of the Climatic Divide. Greater precipitation along and immediately west of the Climatic Divide is a consequence of the higher ele-vations along the Divide and the general movement of weather systems approaching from the west and south-west. Annual snowfall follows the general pattern of annual precipitation, decreasing northwestward from about 36–100 in. along the Climatic Divide to about 20–30 in. along the Ohio River. Annual snowfall is about 24–36 in. east of the Climatic Divide (U.S. Geological Survey, 1991; U.S. Department of Commerce, 1960, 1968).
Background
The low-recurrence-interval peak discharges used as design components for making stream-restoration plans can be related to bankfull discharges. There are various definitions of “bankfull” related to both processes and field indicators, and there are many estimates for the recurrence interval for bankfull dis-charge. Every definition of bankfull can describe a different elevation at each stream cross section (Williams, 1978). Some definitions of bankfull related to processes and field indicators follow.
1. Wolman and Leopold (1957): bankfull is at the elevation of the active floodplain, and is the average elevation of the highest surface of the channel bars;
2. Nixon (1959): bankfull is at the highest elevation of a river that can be contained within the chan-nel without spilling water on the floodplain or washlands;
3. Schumm (1960): bankfull is at the height of the lower limit of perennial vegetation (primarily trees), or is at the height of the low bench;
4. Wolman and Miller (1960): the bankfull discharge represents the upper level of the range of chan-nel-forming flows, which transport the bulk of the available sediment over time;
5. Woodyer (1968): bankfull is at the elevation of the middle bench for rivers with various overflow surfaces;
6. Pickup and Warner (1976): bankfull is at the ele-vation at which the width/depth ratio becomes a minimum;
7. Dunne and Leopold (1978): bankfull stage corre-sponds to the discharge at which channel main-tenance is the most effective, that is, the discharge at which moving sediment, forming or removing bars, forming or changing bends and meanders, and generally doing the work that results in the average morphological char-acteristics of channels. Bankfull discharge is associated with a momentary maximum flow, which on the average has a recurrence interval of 1.5 years;
8. Leopold (1994): bankfull discharge is considered to be the channel-forming or effective dis-charge, with a recurrence interval of about 1.5 years, and occurs on 1 or 2 days each year. Bankfull discharge forms and maintains the channel, and over time, carries the most sedi-ment. Little bedload is moved at discharges less than bankfull. Bankfull stage can be indicated by changes in channel cross-section slopes (particularly at the back of a point bar), by changes in vegetation types, by the highest scour line, or by the top of the bank;
9. Rosgen (1996): bankfull stage originally was used to describe incipient elevation on the bank where flooding begins, and applies primarily to stream types that have an observable flood-plain feature. Often, this stage is associated with the flow that just fills the channel to the top of its banks and at a point where water begins to overflow onto a floodplain. Bankfull stage and discharge serve as consistent mor-phological indices, which can be related to the
4 Estimating Annual Peak Discharges with Recurrence Intervals Between 1.1 and 3.0 Years for Rural, Unregulated Streams in WV

formation, maintenance, and dimensions of the channel under the modern climatic regime. Dimension, pattern, and bed features generally are a function of channel width measured at bankfull stage. Bankfull is synonymous with “ordinary high water,” a term used by the U.S. Army Corp of Engineers, and is expressed as momentary maximum or instantaneous peak flow rather than a mean daily discharge;
10. The Federal Interagency Stream Restoration Working Group (1998): bankfull discharge is that which fills a stable alluvial channel up to the elevation of the active floodplain. The bankfull discharge is important morphologi-cally because it represents the breakpoint between the processes of channel and flood-plain formation. In stable alluvial channels, bankfull discharge corresponds closely with effective discharge and channel-forming discharge. There is no universally accepted def-inition that can be consistently applied, has general application, and integrates the pro-cesses that create the bankfull dimensions of the river, so spell out a clear definition of indicators used to define bankfull for every project;
11. Brunner (1999): bankfull discharge is the funda-mental flow in any river that controls the evolu-tion and stability of the dimension, pattern and profile of the stream. This is the discharge that, over time, transports the most sediment throughout a stream, and is sometimes referred to as the effective discharge or dominant dis-charge. This discharge determines the cross-sectional profile of a stream and could be considered the morphologically forming flow; and,
12. Harman and others (2001): bankfull is at the level corresponding to the top of the channel banks and at the level of the flat, frequently inundated surface adjacent to the channel built under the current hydrologic regime. For example, the
most consistent bankfull indicators in North Carolina are the highest scour line and the back of the point bar (it is rarely the top of the bank or the lowest scour or bench).
The recurrence interval of bankfull discharge can have a wide range of values partially because of the different definitions of bankfull related to processes and field indicators. Some of these values are: 1-to-2-year frequency (Wolman and Leopold, 1957); 97 per-cent of the 1.58-year frequency (Dury, 1973); 1.5-year frequency (Hey, 1975); 4-to-10-year frequency (Pickup and Warner, 1976); 1-year frequency (Richards, 1982); 1.4-to-2.0-year frequency (corresponding to flood-plain levels in northern VA streams; Osterkamp and Hupp, 1984); 1.5-to-1.7-year frequency (from 47 rivers in Ontario, Canada; Annable, 1994); 1.0-to-2.5-year frequency, and 1.5-year frequency is a reasonable aver-age (Leopold, 1994; Dunne and Leopold, 1978); 1.01-to-32-year frequency (Williams, 1978); 1.4-to-1.6-year frequency (North American gaging stations with 10 years of record and related to field-determined bank-full; Rosgen, 1996); 1.1-to-4.8-year frequency, and an average of 2.0-year frequency (from 23 headwater gravel-bed streams in snowmelt-dominated parts of central and northern Idaho; Whiting and others, 1999); and, 1.1-to-1.9-year frequency, and a mean of 1.4-year frequency (for rural North Carolina gaging stations; Harman and others, 2001).
Acknowledgments
The USGS; West Virginia Department of Transportation, Division of Highways; West Virginia Soil Conservation Agency; and West Virginia Geological and Economic Survey would like to recog-nize others that have contributed to the success of this study. The Canaan Valley Institute (CVI) facilitated cooperation for this project through stream-restoration workshops and meetings, and creation of the West Virginia Natural Stream Work Group. The West Virginia Natural Stream Work Group is an association of Federal and State agencies, academic institutions, and others (including private consultants) that share an interest in preserving and restoring stream-channel
Introduction 5

stability and stream habitats in West Virginia. Members of the West Virginia Natural Stream Work Group, par-ticularly the CVI; U.S. Department of Agriculture, Natural Resource Conservation Service; and, the West Virginia Department of Natural Resources contributed to the development of the project objectives.
DEVELOPMENT OF LOW-RECURRENCE-INTERVAL PEAK-DISCHARGE ESTIMATING EQUATIONS
Annual peak-discharge data and basin-characteristics data for streamflow-gaging stations in West Virginia were analyzed to determine the magni-tude of low-recurrence-interval peak discharges. The equations for the 2-year discharges were regionalized by plotting the areal distribution of residuals from application of multiple and simple least-squares regres-sion models. Independent variables described basin characteristics for each station location. Magnitudes for the 2-year discharges at stations operated by surround-ing States (Virginia, Maryland, Pennsylvania, Ohio, and Kentucky) were incorporated into the modeling and regionalization procedure. The low-recurrence-interval peak-discharge estimating equations for all recurrence intervals were computed from a generalized least-squares regression model on the basis of the regions and independent variables determined from the analysis of the multiple and simple least-squares regression models of the 2-year-frequency data.
Peak-Discharge Data
Peak discharges for 160 rural, unregulated West Virginia streamflow-gaging stations with a minimum of 10 years of record through the 1997 water year (the period from October 1 of the previous year through September 30 of the indicated year) were used for this study. The peak data used in this study are identical to those used by Wiley and others (2000), and additional
details about the generation and processing of these data, such as quality assurance and peak estimates, can be found in that report.
Annual peak-discharge data are maintained in the USGS’s “Peak File” database available on the World Wide Web from the USGS NWIS-WEB Data Retrieval at http://waterdata.usgs.gov/. Multiple years of peak data were published in USGS Water-Supply Papers through the 1960 water year. Peak data have been published annually in the “U.S. Geological Survey Water Resources Data - West Virginia” series of reports since the 1961 water year (series title has changed several times since 1961).
Basin-Characteristics Data
Eleven basin characteristics for 160 rural, unreg-ulated West Virginia streamflow-gaging stations with a minimum of 10 years of record through the 1997 water year were used for this study (plate 1). Information for stations operated by surrounding States was acquired to augment West Virginia data. The basin-characteristics data used in this study are identical to those used by Wiley and others (2000), and additional details about the generation and processing of these data, such as quality assurance, can be found in that report.
The U.S. Geological Survey “Streamflow/Basin Characteristics” database generally contains variables that (1) quantify statistical summaries of daily-mean discharges and peak discharges, and (2) describe the basin at and upstream from a gaging station by quanti-fying topographic map features and interpreting clima-tological maps. These are variables that intuitively can be assumed to affect streamflow (Thomas and Benson, 1969). This database is not maintained on an annual basis and is not available on the World Wide Web. Contents from this database for 160 gaging stations in West Virginia and 113 gaging stations from surround-ing States are presented in tables 2, 3, and 4 located at the end of this report.
6 Estimating Annual Peak Discharges with Recurrence Intervals Between 1.1 and 3.0 Years for Rural, Unregulated Streams in WV
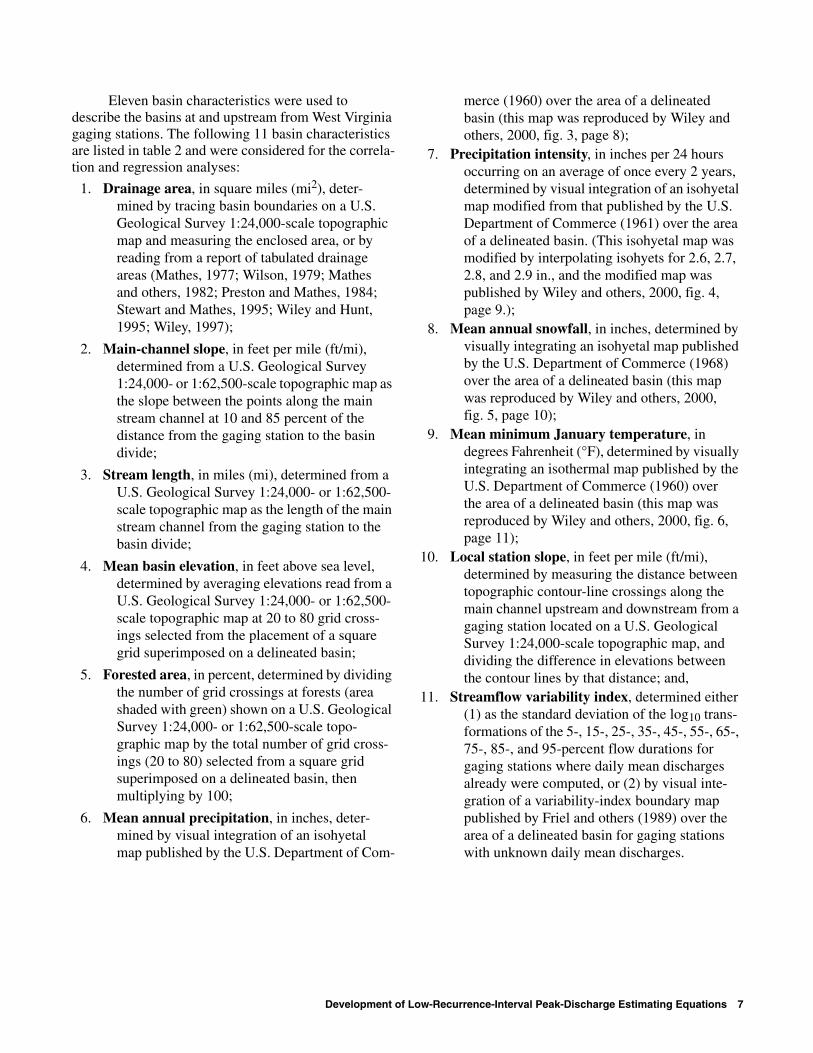
Eleven basin characteristics were used to describe the basins at and upstream from West Virginia gaging stations. The following 11 basin characteristics are listed in table 2 and were considered for the correla-tion and regression analyses:
1. Drainage area, in square miles (mi2), deter- mined by tracing basin boundaries on a U.S. Geological Survey 1:24,000-scale topographic map and measuring the enclosed area, or by reading from a report of tabulated drainage areas (Mathes, 1977; Wilson, 1979; Mathes and others, 1982; Preston and Mathes, 1984; Stewart and Mathes, 1995; Wiley and Hunt, 1995; Wiley, 1997);
2. Main-channel slope, in feet per mile (ft/mi), determined from a U.S. Geological Survey 1:24,000- or 1:62,500-scale topographic map as the slope between the points along the main stream channel at 10 and 85 percent of the distance from the gaging station to the basin divide;
3. Stream length, in miles (mi), determined from a U.S. Geological Survey 1:24,000- or 1:62,500-scale topographic map as the length of the main stream channel from the gaging station to the basin divide;
4. Mean basin elevation, in feet above sea level, determined by averaging elevations read from a U.S. Geological Survey 1:24,000- or 1:62,500-scale topographic map at 20 to 80 grid cross-ings selected from the placement of a square grid superimposed on a delineated basin;
5. Forested area, in percent, determined by dividing the number of grid crossings at forests (area shaded with green) shown on a U.S. Geological Survey 1:24,000- or 1:62,500-scale topo-graphic map by the total number of grid cross-ings (20 to 80) selected from a square grid superimposed on a delineated basin, then multiplying by 100;
6. Mean annual precipitation, in inches, deter-mined by visual integration of an isohyetal map published by the U.S. Department of Com-
merce (1960) over the area of a delineated basin (this map was reproduced by Wiley and others, 2000, fig. 3, page 8);
7. Precipitation intensity, in inches per 24 hours occurring on an average of once every 2 years, determined by visual integration of an isohyetal map modified from that published by the U.S. Department of Commerce (1961) over the area of a delineated basin. (This isohyetal map was modified by interpolating isohyets for 2.6, 2.7, 2.8, and 2.9 in., and the modified map was published by Wiley and others, 2000, fig. 4, page 9.);
8. Mean annual snowfall, in inches, determined by visually integrating an isohyetal map published by the U.S. Department of Commerce (1968) over the area of a delineated basin (this map was reproduced by Wiley and others, 2000, fig. 5, page 10);
9. Mean minimum January temperature, in degrees Fahrenheit (°F), determined by visually integrating an isothermal map published by the U.S. Department of Commerce (1960) over the area of a delineated basin (this map was reproduced by Wiley and others, 2000, fig. 6, page 11);
10. Local station slope, in feet per mile (ft/mi), determined by measuring the distance between topographic contour-line crossings along the main channel upstream and downstream from a gaging station located on a U.S. Geological Survey 1:24,000-scale topographic map, and dividing the difference in elevations between the contour lines by that distance; and,
11. Streamflow variability index, determined either (1) as the standard deviation of the log10 trans-formations of the 5-, 15-, 25-, 35-, 45-, 55-, 65-, 75-, 85-, and 95-percent flow durations for gaging stations where daily mean discharges already were computed, or (2) by visual inte-gration of a variability-index boundary map published by Friel and others (1989) over the area of a delineated basin for gaging stations with unknown daily mean discharges.
Development of Low-Recurrence-Interval Peak-Discharge Estimating Equations 7

Basin-characteristics data for stations operated by surrounding States (table 2) were obtained from the most recent U.S. Geological Survey flood-frequency studies in these States (Bisese, 1995; Choquette, 1988; Dillow, 1996; Flippo, 1982; and Koltun and Roberts, 1990), from the USGS “Streamflow/Basin Characteristics” database, and other sources (K.J. Ruhl, U.S. Geological Survey, Louisville, Kentucky, written commun., 1997; J.A. Dillow, U.S. Geological Survey, Baltimore, Maryland, written commun., 1997). Not all selected basin-characteristics data were readily avail-able for stations operated by surrounding States, and these data were not determined for the correlation and regression analyses.
Magnitude and Frequency Analysis
The magnitudes and frequencies of peak dis-charges at 160 streamflow-gaging stations on rural, unregulated streams in West Virginia, for which a minimum of 10 years of record through 1997 was available (pl. 1 in pocket), were determined in accor-dance with the guidelines (Bulletin 17B) established by the Interagency Advisory Committee on Water Data, Water Resources Council (1982). Discharges at stations operated by surrounding States (85 out of an original 113 stations) were determined as representative of dis-charges expected in West Virginia by Wiley and others (2000), and were used to augment the West Virginia data in this study. Additional details about the generating and processing of the data from West Virginia and surrounding States, including discussion of stations omitted from consideration here, can be found in Wiley and others (2000).
Recurrence intervals of peak discharges were determined by fitting the Pearson Type III probability curve to the log10 transformed systematic annual-peak
series for a given gaging station. General skew for the region was obtained from the national skew map pro-vided in Bulletin 17B. General skew for the region was weighted with station skew to adjust the probability curve. Additionally, high-outlier, low-outlier, and his-torical peak assessments were made to adjust the annual-peak series. Mixed populations of annual peaks, such as peaks from floods caused by snowmelt and peaks caused by tropical storms or hurricanes, were not analyzed separately.
The PEAKFQ computer program (Thomas, W.O., Jr., Lumb, A.M., Flynn, K.M., and Kirby, W.H., 1998, User's manual for program PEAKFQ, annual flood-frequency analysis using Bulletin 17B guide-lines, written commun., 89 p.) used by Wiley and others (2000), does not output peak discharges for all the recurrence intervals needed for this study. Sub-routines within PEAKFQ (the HARTIV subroutine with related subroutines and functions, originally developed by Kirby, 1980), however, are used to calcu-late all the peak discharges for the recurrence intervals needed for this study. The identified subroutines within PEAKFQ do not calculate discharge directly, but deter-mine a frequency factor (K-value) that is used to calcu-late the discharge. A short Fortran computer program (listed in appendix 1) was used to calculate all the frequency factors (the Bulletin-17B weighted skew was input into the program for all stations used in this study). The short computer program uses the current versions of computer subroutines contained in a library of USGS water-resources application programs (U.S. Geological Survey, 2001), and the subroutines are iden-tical to those used in PEAKFQ (version 4.0, revised December 1, 2000). The frequency factors are used to determine discharge by computing the antilog of
8 Estimating Annual Peak Discharges with Recurrence Intervals Between 1.1 and 3.0 Years for Rural, Unregulated Streams in WV
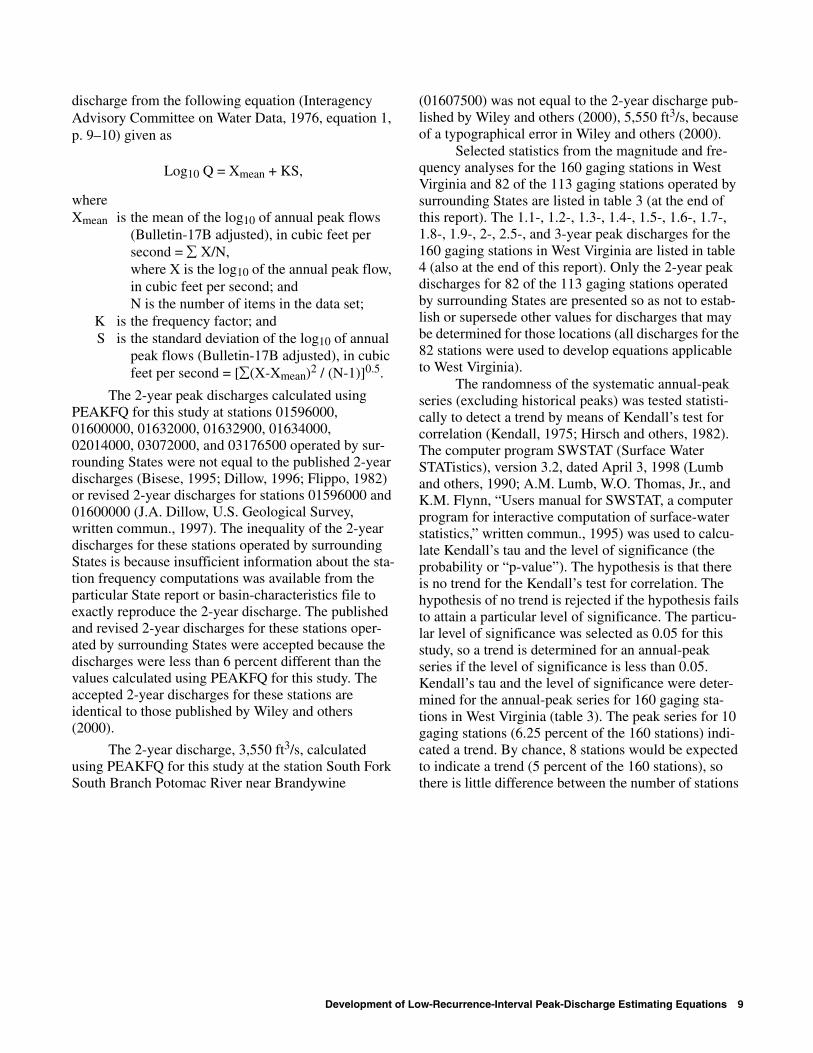
discharge from the following equation (Interagency Advisory Committee on Water Data, 1976, equation 1, p. 9–10) given as
Log10 Q = Xmean + KS,
where Xmean is the mean of the log10 of annual peak flows
(Bulletin-17B adjusted), in cubic feet per second = ∑ X/N, where X is the log10 of the annual peak flow, in cubic feet per second; and N is the number of items in the data set;
K is the frequency factor; and S is the standard deviation of the log10 of annual
peak flows (Bulletin-17B adjusted), in cubic feet per second = [∑(X-Xmean)2 / (N-1)]0.5.
The 2-year peak discharges calculated using PEAKFQ for this study at stations 01596000, 01600000, 01632000, 01632900, 01634000, 02014000, 03072000, and 03176500 operated by sur-rounding States were not equal to the published 2-year discharges (Bisese, 1995; Dillow, 1996; Flippo, 1982) or revised 2-year discharges for stations 01596000 and 01600000 (J.A. Dillow, U.S. Geological Survey, written commun., 1997). The inequality of the 2-year discharges for these stations operated by surrounding States is because insufficient information about the sta-tion frequency computations was available from the particular State report or basin-characteristics file to exactly reproduce the 2-year discharge. The published and revised 2-year discharges for these stations oper-ated by surrounding States were accepted because the discharges were less than 6 percent different than the values calculated using PEAKFQ for this study. The accepted 2-year discharges for these stations are identical to those published by Wiley and others (2000).
The 2-year discharge, 3,550 ft3/s, calculated using PEAKFQ for this study at the station South Fork South Branch Potomac River near Brandywine
(01607500) was not equal to the 2-year discharge pub-lished by Wiley and others (2000), 5,550 ft3/s, because of a typographical error in Wiley and others (2000).
Selected statistics from the magnitude and fre-quency analyses for the 160 gaging stations in West Virginia and 82 of the 113 gaging stations operated by surrounding States are listed in table 3 (at the end of this report). The 1.1-, 1.2-, 1.3-, 1.4-, 1.5-, 1.6-, 1.7-, 1.8-, 1.9-, 2-, 2.5-, and 3-year peak discharges for the 160 gaging stations in West Virginia are listed in table 4 (also at the end of this report). Only the 2-year peak discharges for 82 of the 113 gaging stations operated by surrounding States are presented so as not to estab-lish or supersede other values for discharges that may be determined for those locations (all discharges for the 82 stations were used to develop equations applicable to West Virginia).
The randomness of the systematic annual-peak series (excluding historical peaks) was tested statisti-cally to detect a trend by means of Kendall’s test for correlation (Kendall, 1975; Hirsch and others, 1982). The computer program SWSTAT (Surface Water STATistics), version 3.2, dated April 3, 1998 (Lumb and others, 1990; A.M. Lumb, W.O. Thomas, Jr., and K.M. Flynn, “Users manual for SWSTAT, a computer program for interactive computation of surface-water statistics,” written commun., 1995) was used to calcu-late Kendall’s tau and the level of significance (the probability or “p-value”). The hypothesis is that there is no trend for the Kendall’s test for correlation. The hypothesis of no trend is rejected if the hypothesis fails to attain a particular level of significance. The particu-lar level of significance was selected as 0.05 for this study, so a trend is determined for an annual-peak series if the level of significance is less than 0.05. Kendall’s tau and the level of significance were deter-mined for the annual-peak series for 160 gaging sta-tions in West Virginia (table 3). The peak series for 10 gaging stations (6.25 percent of the 160 stations) indi-cated a trend. By chance, 8 stations would be expected to indicate a trend (5 percent of the 160 stations), so there is little difference between the number of stations
Development of Low-Recurrence-Interval Peak-Discharge Estimating Equations 9

analyzed as having a trend and the number of stations expected to show a trend by chance. Thus, no signifi-cance could be determined for the trend indicated at the 10 gages, and all 10 gages were retained for consider-ation in the data-correlation and regional regression analysis.
Data Correlation
The 160 rural, unregulated West Virginia stream-flow-gaging stations having a minimum of 10 years of record through the 1997 water year were reduced to 154 for correlation and regional regression analysis. Data from the following six gaging stations were not used for correlation and regional regression analysis: Elk River at Centralia (03195000) because the peak record for this station was used to lengthen the record for Elk River below Webster Springs (03194700); Twelvepole Creek at Wayne (03207000) because the peak record here was used to lengthen the record for Twelvepole Creek below Wayne (03207020); Tug Fork near Kermit (03214000) because the peak record here was used to lengthen the record for Tug Fork at Kermit (03214500); New River at Caperton (03185500) because the peak record here was used to lengthen the record for New River at Fayette (03186000); Cheat River near Morgantown (03071500) because the peak record for this station was used to lengthen the record for Cheat River near Pisgah (03071000); and Tuscarora Creek above Martinsburg (01617000) because the
station is located in a karst area of the State. Available data for 113 gaging stations operated by surrounding States augmented West Virginia data.
In order to identify correlated values, 11 basin characteristics describing the basin at and upstream from gaging stations (see Basin-Characteristics Data section of this report) were log10 transformed. Trans-formed and untransformed data were evaluated for col-linearity using a Pearson Coefficient correlation matrix. Additionally, a shape factor, defined as the drainage area divided by the squared basin length, was log10 transformed, and then transformed and untrans-formed values were evaluated for collinearity. High correlations (absolute value of Pearson correlation coefficient greater than 0.80) were detected among log10 transformed drainage area, main-channel slope, and stream length. High correlations also were detected among log10 transformed main-channel slope, stream length, and local station slope. Additionally, high cor-relations were detected between the untransformed values of drainage area and main-channel slope, and main-channel slope and local station slope. No high correlations were determined between any log10 trans-formed and any untransformed value. Should a pair of highly correlated values become part of a regression equation in the regional regression analysis, consider-ation will be given to eliminate one of the values from the equation. (No pair of highly correlated values became part of a regression equation.)
10 Estimating Annual Peak Discharges with Recurrence Intervals Between 1.1 and 3.0 Years for Rural, Unregulated Streams in WV

Regional Regression Analysis
Multiple and simple least-squares regression models for the log10-transformed 2-year recurrence-interval discharge with independent variables that describe the basin characteristics (both log10 trans-formed and untransformed values) for each gaging station were evaluated, and residuals were plotted as areal distributions to determine regional boundaries. The final regional regression equations for the 1.1-, 1.2-, 1.3-, 1.4-, 1.5-, 1.6-, 1.7-, 1.8-, 1.9-, 2-, 2.5-, and 3-year peak discharges (table 1) were determined by executing a generalized least-squares regression model (Stedinger and Tasker, 1985; Tasker and Stedinger, 1989) (version 2.5) that used the independent variables determined from application of the multiple least-squares regression model.
Regional regression procedures for the 2-year discharge were completed for the entire data set and three regions (fig. 2) were delineated as East, North, and South. A multiple least-squares regression model for the log10-transformed 2-year discharge that used basin characteristics (both log10 transformed and untransformed values) as the independent variables was evaluated. The most significant independent vari-able was determined as log10-transformed drainage area. Inclusion of additional independent variables did not significantly increase the ability of the model to account for the variation of the dependent variable (R2) and did not decrease the standard error by more than 5
percent. A simple least-squares regression model was evaluated for the log10-transformed 2-year discharge with log10-transformed drainage area as the only inde-pendent variable. Residuals from the simple least-squares regression analysis were plotted by latitude and longitude of the gaging station. The residual plots indi-cated areas of West Virginia with similar magnitudes of residuals. The multiple and simple regression proce-dures were repeated for each group of stations with a similar magnitude of residuals (log10-transformed drainage area was the most significant independent variable in all cases), and plots were analyzed until no additional regional boundaries could be identified. Regional analysis in the East Region indicated that four stations with large drainage areas (greater than 2,000 mi2) leveraged the regression analysis. One of the four stations was in West Virginia, Shenandoah River at Millville (01636500), and the other three sta-tions were in surrounding States (see Wiley and others, 2000, p.15). On the basis of these analyses, three regions were delineated. These three regions are identi-cal to those determined by Wiley and others (2000), for which the 100-year discharges were used in the regional regression procedures.
Regional regression procedures were conducted for the 1.5-year discharge to determine if different regional boundaries would be determined at a lower discharge than the 2-year discharge. The same three regions were delineated, and log10-transformed drain-age area remained the most significant independent variable.
Development of Low-Recurrence-Interval Peak-Discharge Estimating Equations 11

Table 1. Equations and regression statistics determined in the regional regression analysis of peak discharges
[Q(n) is the discharge in cubic feet per second for the (n)-year recurrence interval; A is the drainage area in square miles]
Regressionequation
Standard error of the
model,in percent
Averagestandard errorof sampling,
in percent
Averageprediction
error,in percent
Equivalentyears ofrecord
Number ofstreamflow
stations
Range ofdrainage area, in square miles
East Region
Q(1.1) = 31.7 A 0.834 51.1 10.1 52.4 1.3Q(1.2) = 37.9 A 0.835 47.0 9.5 48.2 1.5Q(1.3) = 42.6 A 0.836 44.7 9.2 45.9 1.7Q(1.4) = 46.5 A 0.837 43.1 8.9 44.2 1.8Q(1.5) = 49.9 A 0.838 41.9 8.9 43.0 1.9
Q(1.6) = 53.0 A 0.838 40.9 8.9 42.0 2.0 74 0.22–1,486Q(1.7) = 55.8 A 0.839 40.2 8.6 41.2 2.0Q(1.8) = 58.4 A 0.839 39.5 8.6 40.5 2.1Q(1.9) = 60.9 A 0.840 38.9 8.6 40.0 2.2Q(2) = 62.6 A 0.842 37.7 8.3 38.8 2.3
Q(2.5) = 72.9 A 0.842 36.8 8.3 37.8 2.4Q(3) = 80.2 A 0.843 35.8 8.3 36.8 2.5
North Region
Q(1.1) = 57.7 A 0.789 30.8 7.6 31.8 2.6Q(1.2) = 73.2 A 0.771 28.8 7.3 29.8 3.0Q(1.3) = 85.3 A 0.759 27.8 7.3 28.8 3.1Q(1.4) = 95.5 A 0.751 27.2 6.9 28.2 3.3Q(1.5) = 105 A 0.744 26.9 6.9 27.9 3.3
Q(1.6) = 113 A 0.738 26.7 6.9 27.7 3.4 62 0.13–1,516Q(1.7) = 120 A 0.733 26.6 6.9 27.6 3.4Q(1.8) = 127 A 0.728 26.5 6.9 27.4 3.4Q(1.9) = 134 A 0.725 26.5 6.9 27.4 3.4Q(2) = 138 A 0.724 27.0 6.9 28.0 3.3
Q(2.5) = 166 A 0.708 26.6 6.9 27.6 3.4Q(3) = 188 A 0.698 26.9 6.9 27.9 3.3
South Region
Q(1.1) = 46.9 A 0.804 47.4 8.0 48.3 1.1Q(1.2) = 56.9 A 0.799 44.0 7.6 44.8 1.3Q(1.3) = 64.4 A 0.795 42.3 7.6 43.1 1.4Q(1.4) = 70.5 A 0.792 41.1 7.6 41.9 1.4Q(1.5) = 75.8 A 0.790 40.3 7.3 41.1 1.5
Q(1.6) = 80.6 A 0.789 39.7 7.3 40.5 1.5 100 0.10–8,371Q(1.7) = 84.8 A 0.787 39.2 7.3 40.0 1.5Q(1.8) = 88.8 A 0.786 38.8 7.3 39.6 1.6Q(1.9) = 92.4 A 0.785 38.5 7.3 39.3 1.6Q(2) = 95.4 A 0.785 38.4 7.3 39.2 1.6
Q(2.5) = 110 A 0.781 37.6 7.3 38.4 1.7Q(3) = 121 A 0.778 37.2 6.9 38.0 1.7
12 Estimating Annual Peak Discharges with Recurrence Intervals Between 1.1 and 3.0 Years for Rural, Unregulated Streams in WV

Figure 2. Regional boundaries for the low-recurrence-interval peak-discharge estimating equations for rural, unregulated streams in West Virginia.
38o
82o
39o
80o
40o
78o
EXPLANATION
REGIONAL BOUNDARY
COUNTY BOUNDARY
20
20
40 MILES
40 KILOMETERS
0
0
Han
coc
k B
roo
ke
Ohio
Marshall
Wetzel
Marion
Taylor
Tyler
RitchieWood
Wirt
Jackson
Mason
Cabell
Wayne
Boone Fayette
Greenbrier
MonroeSummers
Mercer
Raleigh
Wyoming
McDowell
Logan
Mingo
Nicholas Pocahontas
Lincoln
Putnam
Kanawha
ClayWebster
Braxton
Roane
Calhoun GilmerLewis
Upshur
BarbourTucker
Randolph
Pendleton
Hardy
Grant
MineralHampshire
Morgan
Berkeley
Jeffe
rson
HarrisonPleasants
Doddri
dge
Monongalia
Preston
NORTHREGION
SOUTHREGION
EASTREGION
ESTIMATING DISCHARGES FOR GAGED AND UNGAGED LOCATIONS
How discharge estimates are made depends on whether the stream location of interest is at a stream-flow-gaging station, on an ungaged stream, or on the same stream as a nearby gaging station (where “nearby” means that the drainage area for that location is between 50 and 150 percent of the drainage area at the gaged location). The estimating procedure is not applicable on urbanized and regulated streams, and caution should be used if the stream is heavily affected by mining or located in a karst area.
Discharges at a gaging station are read directly from table 4 (the appropriate equation and weighting factors have been applied). No weighted value is pre-sented in table 4 for one of the two stations on the same stream that were combined into a single time-series record. For this case, the station location listed without a weighted value should be analyzed as “on the same stream as a nearby gaging station.” Discharges on the same stream as a nearby gaging station are determined at the ungaged location from the desired regional regression equation and then adjusted by a factor that related differences between the ungaged and gaged locations. No weighted value is presented in table 4 for Tuscarora Creek above Martinsburg (01617000).
Estimating Discharges for Gaged and Ungaged Locations 13

The frequency of the systematic record for Tuscarora Creek (S) should be used directly because the station is located in a karst area of the State. Discharge on an ungaged stream is determined from the desired regression equation for the appropriate region.
At a streamflow-gaging station. A discharge at a gaging station is determined by reading the weighted (W) value directly from table 4. For example, the weighted 2-year discharge at the gaging station Greenbrier River at Alderson (03183500) is given as 34,000 ft3/s. This discharge was calculated by weight-ing (1) the discharge determined from the systematic and historical record (S), on the basis of the guidelines established by the Interagency Advisory Committee on Water Data, Water Resources Council (1976; table 3), and (2) the discharge determined by the appropriate regional (R) regression equation (table 4). The weight-ing technique considered (1) the number of years of peak-discharge record (summation of the number of years of systematic record, the number of historical peaks, and the number of high-outlier peaks from table 3 located at the end of this report), and (2) the number of equivalent years of record (an estimate given in table 1 of the number of systematic years of record needed to calculate discharges with an accuracy equal to that of the regional regression equation). The following equation was used:
Qw = (QsN + QrE) / (N + E),
where Qw is the weighted discharge in cubic feet per
second; Qs is the discharge in cubic feet per second
determined from the systematic and historical record on the basis of the guidelines established by the Water Resources Council;
Qr is the discharge in cubic feet per second determined by the regional regression equation;
N is the number of years of peak-discharge record; and
E is the equivalent years of record.
On an ungaged stream. A discharge on an ungaged stream is determined by applying the desired regional regression equation for the appropriate region (table 1). For example, the 1.5-year discharge for Fishing Creek just downstream from the confluence of North and South Forks of Fishing Creek in Wetzel County (Pine Grove 71/2-minute U.S. Geological Survey topographic map) can be calculated as follows:
1. The stream is located in the North Region as determined from figure 2;
2. The 1.5-year regression equation for the North Region is selected from table 1 as
Q(1.5) = 105 A 0.744,
where Q(1.5) is the 1.5-year discharge in cubic feet
per second, and A is the drainage area in square miles.
3. The drainage area is determined by measuring the area on a topographic map or from the U.S. Geological Survey drainage-area report (Wiley, 1997, page 30) as 113.92 mi2; and
4. The 1.5-year regression equation for the North Region is evaluated as 3,560 ft3/s.
On the same stream as a nearby gaging station. A discharge on the same stream as a nearby gaging station is determined by adjusting the discharge determined from the regional equation by a factor relat-ing (1) drainage areas, and (2) weighted and regional regression discharges (Hannum, 1976; Glatfelter, 1984). For example, the 3-year discharge for a site on Coal River just downstream from the confluence of the Little Coal and Big Coal Rivers in Kanawha County (Alum Creek 71/2-minute U.S. Geological Survey topographic map) can be calculated as follows:
1. The drainage area is determined by measuring the area on a topographic map or by reading from the U.S. Geological Survey drainage-area report (Mathes and others, 1982, page 196) as 830.02 mi2, which is 96 percent (between 50 and 150 percent) of the drainage area given in table 3 (862 mi2) for the gaging station Coal River at Tornado (03200500);
14 Estimating Annual Peak Discharges with Recurrence Intervals Between 1.1 and 3.0 Years for Rural, Unregulated Streams in WV

2. The weighted 3-year discharge for Coal River at Tornado (03200500) is read directly from table 4 as 24,400 ft3/s (see discussion above for cal-culations at a gaging station), and the regional 3-year discharge is read directly from table 4 as 23,300 ft3/s;
3. The 3-year discharge for the Coal River just downstream from the confluence of the Little Coal and Big Coal Rivers is determined from the equation given in table 1 as 22,600 ft3/s (South Region, drainage area of 830.02 mi2: see discussion above for an ungaged stream);
4. The correction factor for the gaged location is determined as 1.047 from the following equation:
Cg = Qw / Qr ,
where Cg is the correction factor for the gaging-
station location; Qw is the weighted frequency discharge in
cubic feet per second read from table 4; and
Qr is the regional regression discharge in cubic feet per second read from table 4;
5. The correction factor for the ungaged location is determined as 1.044 from the following equation:
Cu = Cg - [(2 |Ag - Au|) / Ag] (Cg - 1),
where Cu is the correction factor for the
ungaged location; Cg is the correction factor for the
gaging station location (see previous equation);
Ag is the drainage area in square miles at the gaging station location read from table 2;
Au is the drainage area in square miles at the ungaged location; and
|Ag - Au| is the absolute value of the difference between the drainage area in square miles (mi2) at the gaging station location and the drainage area in square miles (mi2) at the ungaged location;
6. The adjusted 3-year discharge for the Coal River just downstream from the confluence of the Little Coal and Big Coal Rivers is determined as 23,600 ft3/s from the following equation:
Qa = CuQu ,
where Qa is the adjusted discharge in cubic feet
per second; Cu is the correction factor for the
ungaged location (see previous equation); and
Qu is the regional regression discharge at the ungaged location in cubic feet per second.
ACCURACY OF LOW-RECURRENCE-INTERVAL PEAK-DISCHARGE ESTIMATING EQUATIONS
The accuracy of the estimating equations is quantified by measuring the average prediction error and equivalent years of record (Hardison, 1969, 1971). The average prediction error ranged from 27.4 to 52.4 percent, and the equivalent years of record ranged from 1.1 to 3.4. These accuracy measurements are included with the regression statistics summarized in table 1.
Average prediction error. Average prediction error is the square root of the sum of the squared stan-dard error of the model (the portion of the total error due to an imperfect model) and average squared stan-dard error of sampling (the portion of the total error due to estimating model parameters from a sample) in log units. The calculations involved in estimating the average prediction error are explained in Tasker and Stedinger (1989) and in appendix 2 of this report. The average prediction error is within 1.3 percentage points of the standard error of the model for all regression equations presented in table 1. The near equivalence of the average prediction error and the standard error of the model indicate that addition of the average standard error of sampling to the standard error of the model accounts for very little additional unexplained variance of the discharge estimate.
Accuracy of Low-Recurrence-Interval Peak-Discharge Estimating Equations 15
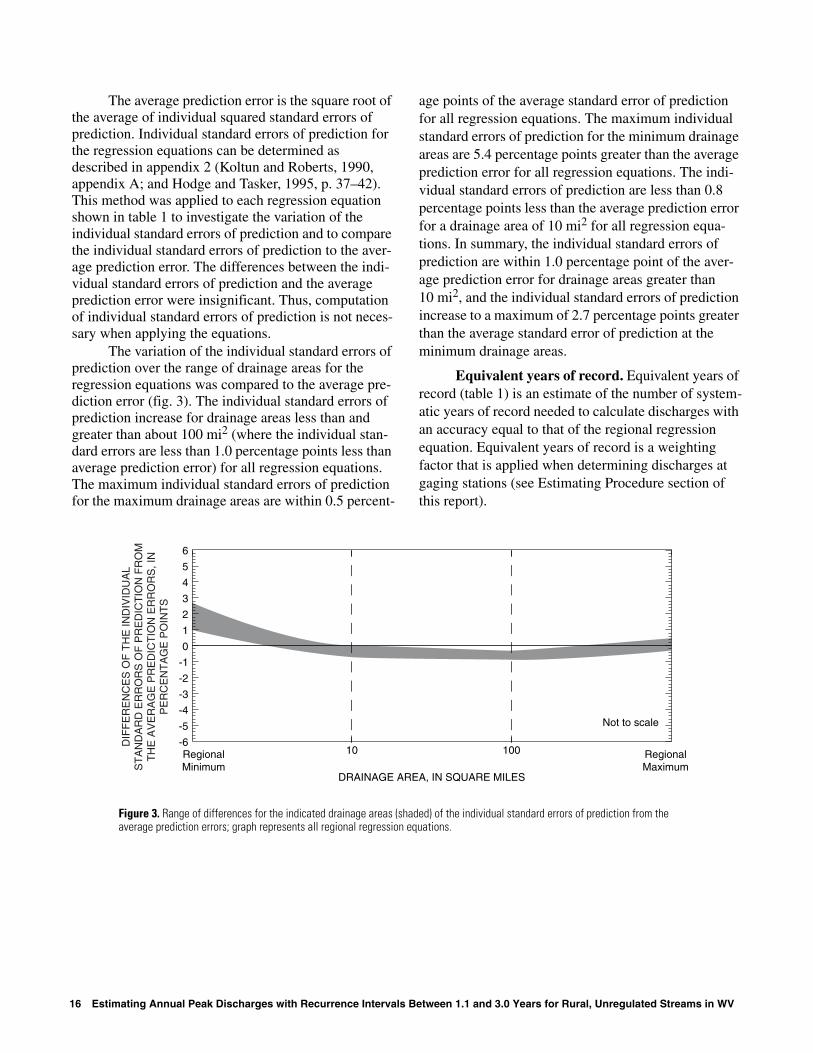
The average prediction error is the square root of the average of individual squared standard errors of prediction. Individual standard errors of prediction for the regression equations can be determined as described in appendix 2 (Koltun and Roberts, 1990, appendix A; and Hodge and Tasker, 1995, p. 37–42). This method was applied to each regression equation shown in table 1 to investigate the variation of the individual standard errors of prediction and to compare the individual standard errors of prediction to the aver-age prediction error. The differences between the indi-vidual standard errors of prediction and the average prediction error were insignificant. Thus, computation of individual standard errors of prediction is not neces-sary when applying the equations.
The variation of the individual standard errors of prediction over the range of drainage areas for the regression equations was compared to the average pre-diction error (fig. 3). The individual standard errors of prediction increase for drainage areas less than and greater than about 100 mi2 (where the individual stan-dard errors are less than 1.0 percentage points less than average prediction error) for all regression equations. The maximum individual standard errors of prediction for the maximum drainage areas are within 0.5 percent-
age points of the average standard error of prediction for all regression equations. The maximum individual standard errors of prediction for the minimum drainage areas are 5.4 percentage points greater than the average prediction error for all regression equations. The indi-vidual standard errors of prediction are less than 0.8 percentage points less than the average prediction error for a drainage area of 10 mi2 for all regression equa-tions. In summary, the individual standard errors of prediction are within 1.0 percentage point of the aver-age prediction error for drainage areas greater than 10 mi2, and the individual standard errors of prediction increase to a maximum of 2.7 percentage points greater than the average standard error of prediction at the minimum drainage areas.
Equivalent years of record. Equivalent years of record (table 1) is an estimate of the number of system-atic years of record needed to calculate discharges with an accuracy equal to that of the regional regression equation. Equivalent years of record is a weighting factor that is applied when determining discharges at gaging stations (see Estimating Procedure section of this report).
16 Est
Figure 3. Range of differences for the indicated drainage areas (shaded) of the individual standard errors of prediction from the average prediction errors; graph represents all regional regression equations.
10 100-6
6
-5
-4
-3
-2
-1
0
1
2
3
4
5
DRAINAGE AREA, IN SQUARE MILES
DIF
FE
RE
NC
ES
OF
TH
E IN
DIV
IDU
AL
ST
AN
DA
RD
ER
RO
RS
OF
PR
ED
ICT
ION
FR
OM
T
HE
AV
ER
AG
E P
RE
DIC
TIO
N E
RR
OR
S, I
N
PE
RC
EN
TA
GE
PO
INT
S
RegionalMinimum
RegionalMaximum
Not to scale
imating Annual Peak Discharges with Recurrence Intervals Between 1.1 and 3.0 Years for Rural, Unregulated Streams in WV

LIMITATIONS OF LOW- RECURRENCE-INTERVAL PEAK-DISCHARGE ESTIMATING EQUATIONS
Equations developed in this study are only appli-cable to rural, unregulated streams within the bound-aries of West Virginia. The equations should not be applied to urban areas with paved surfaces, concrete channels, culverts, and other control structures. The equations should not be applied to streams regulated by dams, or large lakes and ponds. Equations are not applicable to heavily mined areas if excessive runoff is diverted into or outside the basin, retained along strip benches, or retained underground. Equations are not applicable to karst areas if excessive runoff is diverted into, outside, or within the basin through solution channels or other cavities in carbonate (lime-stone and dolomite) rocks. Jones (1997) describes the locations of karst areas in eastern counties of West Virginia including Monongalia, Preston, Barbour, Tucker, Grant, Mineral, Hardy, Hampshire, Morgan, Berkeley, Jefferson, Randolph, Pendleton, Pocahontas, Greenbrier, Summers, Monroe, and Mercer Counties (counties are presented in fig. 2).
Equations developed in this study should not be applied to stream locations with drainage areas outside the range of values used in equation development (table 1). The Potomac River, downstream from the confluence of the North Branch and South Branch, and the Shenandoah River have drainage areas outside the range of values used to develop the East Region equations. The equations should not be applied to these stream locations, but gaging-station discharges (table 4) may be used in making discharge estimates on these rivers.
SUMMARY
Engineers commonly use low-recurrence-interval (between 1.1 and 3.0 years) peak discharges as design components for developing stream-restoration plans. Determining discharges for various recurrence
intervals at stream locations where gaging stations are not present using regional equations can be less expen-sive and less difficult than determining discharge fre-quencies by individually studying nearby streamflow-gaging stations for each and every ungaged location. Therefore, the U.S. Geological Survey (USGS), in cooperation with the: West Virginia Department of Transportation, Division of Highways; West Virginia Soil Conservation Agency; and West Virginia Geologi-cal and Economic Survey; developed equations for estimating low-recurrence-interval peak discharges for rural, unregulated streams in West Virginia.
The magnitudes of peak discharges with frequen-cies of exceedences between 1 and 3 years were deter-mined for 160 rural, unregulated West Virginia streamflow-gaging stations with a minimum record of 10 years through the 1997 water year. The randomness of the systematic annual-peak series was tested statisti-cally by means of Kendall’s tau to detect monotonic trends.
The 160 rural, unregulated West Virginia gaging stations were reduced to 154 for correlation and regional regression analysis; five gaging stations were excluded from the analysis because peak data were used to lengthen records for other nearby gaging sta-tions, and one gaging station was excluded because it was in a karst area.
Eleven basin characteristics, a shape factor, and flood frequencies from 154 West Virginia gaging sta-tions were considered for regression analysis. West Virginia data were augmented with available basin characteristics and flood-frequency data for 85 stations operated by surrounding States.
Multiple and simple least-squares regression models for the log10-transformed 1.5- and 2-year discharges with independent variables that describe the basin characteristics (log10-transformed and untrans-formed) were evaluated for 236 streamflow-gaging stations, and the regression residuals were plotted as areal distributions that defined three regions, desig-nated East, North, and South. Four stations with drain-age areas greater than 200 mi2 leveraged the East Region equations and were eliminated from consider-ation for the final equations. Regional equations for the
Limitations of Low-Recurrence-Interval Peak-Discharge Estimating Equations 17

1.1-, 1.2-, 1.3-, 1.4-, 1.5-, 1.6-, 1.7-, 1.8-, 1.9-, 2.0-, 2.5-, and 3-year peak discharges were determined by generalized least-squares regression. Log10-transformed drainage area was the most significant independent variable for all regions.
Examples of application of the regional regres-sion equations were presented for three situations: at a gaging station, on an ungaged stream, and on the same stream as a nearby gaging station (where “nearby” means that the drainage area for that location is between 50 and 150 percent of the drainage area at the gaged location).
Accuracies of estimating equations were quanti-fied by measuring the average standard error of predic-tion and equivalent years of record. The average standard error of prediction ranged from 27.4 to 52.4 percent, and the equivalent years of record ranged from 1.1 to 3.4 years. Equations developed in this study are applicable only to rural, unregulated streams within the boundaries of West Virginia. Caution should be used if equations are applied to heavily mined or karst areas in the State.
REFERENCES CITED
Andrews, E.D., 1980, Effective and bankfull discharges of streams in the Yampa River Basin, Colorado and Wyoming: Journal of Hydrology, v. 46, p. 311–330.
Annable, W.K., 1994, Morphological relations of rural water courses in southeastern Ontario for use in natural channel design: Guelph, Ontario, Canada, M.S. thesis, University of Guelph, School of Engineering.
Bisese, J.A., 1995, Methods for estimating magnitude and frequency of peak discharges of rural, unregulated streams in Virginia: U.S. Geological Survey Water-Resources Investigations Report 94-4148, 70 p.
Brunner, D.S., 1999, Methods for estimating bankfull discharge in gauged and ungauged urban streams: Waterloo, Ontario, Canada, B.S. thesis, University of Waterloo, 28 p.
Choquette, A.F., 1988, Regionalization of peak discharges for streams in Kentucky: U.S. Geological Survey Water-Resources Investigations Report 87-4209, 105 p.
Dillow, J.A., 1996, Technique for estimating magnitude and frequency of peak flows in Maryland: U.S. Geological Survey Water-Resources Investigations Report 95-4154, 55 p.
Dunne, Thomas, and Leopold, L.B., 1978, Water in Environmental Planning: San Francisco, Calif., W.H. Freeman and Co., 818 p.
Dury, G.H., 1973, Magnitude-frequency analysis and channel morphology, in Morisawa, M., ed., Geomorphology: Binghamton, State University of New York, Publications in Geomorphology, Fourth Annual Geomorphology Symposia Series Proceedings Volume, p. 91–122.
Federal Interagency Stream Restoration Working Group, 1998, Stream corridor restoration: principles, processes, and practices: accessed February 9, 2001, at URL http://www.usda.gov/ stream_restoration/.
Fenneman, N.M., 1938, Physiography of Eastern United States: New York, McGraw-Hill, 714 p.
_____1946, Physical divisions of the United States: Washington, D.C., U.S. Geological Survey special map, scale 1:7,000,000.
Flippo, H.N., Jr., 1982, Evaluation of the streamflow-data program in Pennsylvania: U.S. Geological Survey Water-Resources Investigations Report 82-21, 56 p.
Friel, E.A., Embree, W.N., Jack, A.R., and Atkins, J.T., Jr., 1989, Low-flow characteristics of streams in West Virginia: U.S. Geological Survey Water-Resources Investigations Report 88-4072, 34 p.
Glatfelter, D.R., 1984, Techniques for estimating magnitude and frequency of floods in Indiana: U.S. Geological Survey Water-Resources Investigations Report 84-4134, 110 p.
Hannum, C.H., 1976, Techniques for estimating magnitude and frequency of floods in Kentucky: U.S. Geological Survey Water-Resources Investigations Report 76-62, 70 p.
Hardison, C.H., 1969, Accuracy of streamflow characteristics: U.S. Geological Survey Professional Paper 650-D, p. 210–214.
_____1971, Predictive error of streamflow characteristics at ungaged sites: U.S. Geological Survey Professional Paper 750-C, p. 228–236.
18 Estimating Annual Peak Discharges with Recurrence Intervals Between 1.1 and 3.0 Years for Rural, Unregulated Streams in WV

Harman, W.A., Wise, D.E., Walker, M.A., Morris, R., Cantrell, M.A., Clemmons, M., Jennings, G.D., Clinton, D., and Patterson, J., Bankfull regional curves for North Carolina mountain streams: accessed February 2001, at URL http://www5.bae.ncsu.edu/bae/programs/ extension/wqg/sri/mtnpaper.html/.
Hey, R.D., 1975, Design discharge for natural channels, in Hey, R.D., and Davies, T.D., eds., Science, Technology and Environmental Management: Farnborough, U.K., Saxxon House, p. 73–88.
Hirsch, R.M., Slack, J.R., and Smith, R.A., 1982, Techniques of trend analysis for monthly water quality data: Water Resources Research, v. 18, no. 1, p. 107–121.
Hodge, S.A., and Tasker, G.D., 1995, Magnitude and frequency of floods in Arkansas: U.S. Geological Survey Water-Resources Investigations Report 95-4224, 52 p.
Interagency Advisory Committee on Water Data, 1976, Guidelines for determining flood flow frequency: Water Resources Council Bulletin 17, 26 p.
_____1982, Guidelines for determining flood flow frequency: Water Resources Council Bulletin 17B, 28 p.
Jones, W. K., 1997, Karst Hydrology of West Virginia: Charles Town, W.V., Karst Waters Institute, Inc., Special Publication 4, 111 p.
Kendall, M.G., 1975, Rank correlation methods (4th ed.): London, Charles Griffin, 202 p.
Kirby, W., 1980, Computer routines for probability distributions, random numbers, and related functions: U.S. Geological Survey Open-File Report 80-448, 61 p.
Koltun, G.F., and Roberts, J.W., 1990, Techniques for estimating flood-peak discharges of rural, unregulated streams in Ohio: U.S. Geological Survey Water-Resources Investigations Report 89-4126, 68 p.
Leopold, L.B., 1994, A view of the river: Cambridge, Mass., Harvard University Press, 298 p.
Leopold, L.B., and Wolman, M.G., 1957, River channel patterns—braided, meandering and straight: U.S. Geological Survey Professional Paper 282-B, p. 39–85.
Lumb, A.M., Kittle, J.L., Jr., and Flynn, K.M., 1990, Users manual for ANNIE, computer program for interactive hydrologic analysis and data management: U.S. Geological Survey Water-Resources Investigations Report 89-4080, 236 p.
Mathes, M.V., Jr., 1977, Drainage areas of the Guyandotte River Basin, West Virginia: U.S. Geological Survey Open-File Report 77-801, 56 p.
Mathes, M.V., Kirby, J.R., Payne, D.D., and Shultz, R.A., 1982, Drainage areas of the Kanawha River Basin, West Virginia: U.S. Geological Survey Open-File Report 82-351, 222 p.
Nixon, M., 1959, A study of bankfull discharges of rivers in England and Wales, in Proceedings of the Institution of Civil Engineers: v. 12, p. 157–175.
Osterkamp, W.R., and Hupp, C.R., 1984, Geomorphic and vegetative characteristics along three northern Virginia streams: Geological Society of America Bulletin, v. 95, p. 1093–1101.
Pickup, G., and Warner, R.F., 1976, Effects of hydrologic regime on the magnitude and frequency of dominant discharge: Journal of Hydrology, v. 29, p. 51–75.
Preston, J.S., and Mathes, M.V., 1984, Stream drainage areas for the Little Kanawha River Basin, West Virginia: U.S. Geological Survey Open-File Report 84-861, 171 p.
Richards, K.S., 1982, Rivers—form and process in alluvial channels: London, Methuen, 358 p.
Rosgen, D.L., 1996, Applied river morphology: Pagosa Springs, Colo., Wildland Hydrology, variously paged.
Schumm, S.A., 1960, The shape of alluvial channels in relation to sediment type: U.S. Geological Survey Professional Paper 352-B, p. 17–30.
Stedinger, J.R., and Tasker, G.D., 1985, Regional hydrologic analysis 1—ordinary, weighted, and generalized least squares compared: Water Resources Research, v. 21, no. 9, p. 1421–1432.
Stewart, D.K., and Mathes, M.V., 1995, Drainage areas of the Monongahela River Basin, West Virginia: U.S. Geological Survey Open-File Report 95-170, 79 p.
Tasker, G.D., and Stedinger, J.R., 1989, An operational GLS model for hydrologic regression: Journal of Hydrology, v. 111, p. 361–375.
Thomas, D.M., and Benson, M.A., 1969, Generalization of streamflow characteristics from drainage basin characteristics, U.S. Geological Survey Open-File Report, 45 p.
References Cited 19

U.S. Department of Commerce, 1960, Climates of the States, West Virginia: Weather Bureau, Climatography of the United States, no. 60-46, 15 p.
_____1961, Rainfall frequency atlas of the United States: Weather Bureau Technical Paper no. 40, 115 p.
_____1968, Climatic atlas of the United States: Environmental Data Service, 80 p.
U.S. Geological Survey, 1990, National water summary 1987—Hydrologic events and water supply and use: U.S. Geological Survey Water-Supply Paper 2350, 553 p.
_____1991, National water summary 1988–89—Hydrologic events and floods and droughts: U.S. Geological Survey Water-Supply Paper 2375, 591 p.
_____ 2001, Water Resources Applications Software: LIB3.2, revised June 29, 1998, accessed November 2001, at URL http://water.usgs.gov/ software/lib.html/.
Whiting, P.J., Stamm, J.F., Moog, D.B., and Orndorff, R.L., 1999, Sediment transporting flows in headwater streams: Geological Society of America Bulletin, v. 111, no. 3, p. 450–466.
Wiley, J.B., 1997, Drainage areas of West Virginia streams tributary to the Ohio River: U.S. Geological Survey Open-File Report 97-231, 70 p.
Wiley, J.B., Atkins, J.T., and Tasker, G.D., 2000, Estimating magnitude and frequency of peak discharges for rural, unregulated, streams in West Virginia: U.S. Geological Survey Water-Resources Investigations Report 00-4080, 93 p.
Wiley, J.B., and Hunt, M.L., 1995, Drainage areas of the Potomac River Basin, West Virginia: U.S. Geological Survey Open-File Report 95-292, 60 p.
Williams, G.P., 1978, Bank-full discharge of rivers: Water Resources Research, v. 14, no. 6, p. 1141–1154.
Wilson, M.W., 1979, Drainage areas of the Twelvepole Creek Basin, West Virginia; Big Sandy River Basin, West Virginia; Tug Fork Basin, Virginia, Kentucky, West Virginia: U.S. Geological Survey Open-File Report 79-746, 49 p.
Wolman, M.G., and Leopold, L.B., 1957, River floodplains: some observations on their formation: U.S. Geological Survey Professional Paper 282-C, 86 p.
Wolman, M.G., and Miller, J.P., 1960, Magnitude and frequency of forces in geomorphic process: Journal of Geology, v. 68, p. 54–74.
Woodyer, K.D., 1968, Bankfull frequency in rivers: Journal of Hydrology, v. 6, p. 114–142.
20 Estimating Annual Peak Discharges with Recurrence Intervals Between 1.1 and 3.0 Years for Rural, Unregulated Streams in WV

TABLES 2–4


Tab
le 2
. Bas
in-c
hara
cter
istic
s da
ta u
sed
in th
e re
gres
sion
ana
lysi
s to
dev
elop
low
-rec
urre
nce-
inte
rval
pea
k-di
scha
rge
estim
atin
g eq
uatio
ns fo
r ru
ral,
unre
gula
ted
stre
ams
in W
est V
irgin
ia
[MD
, Mar
ylan
d; O
H, O
hio;
PA
, Pen
nsyl
vani
a; V
A, V
irgi
nia;
WV
, Wes
t Vir
gini
a; -
-, in
form
atio
n no
t ava
ilabl
e]
Sta
tio
nN
o.
Sta
teL
atit
ud
e,in
dec
imal
d
egre
es
Lo
ng
itu
de,
in d
ecim
al
deg
rees
Bas
in c
har
acte
rist
ics
Dra
inag
e ar
ea,
in s
qu
are
mile
s
Mai
n
chan
nel
sl
op
e,in
fee
tp
er m
ile
Str
eam
le
ng
th,
in m
iles
Mea
n
bas
inel
evat
ion
,in
fee
t ab
ove
sea
leve
l
Fo
rest
ed
area
,in
per
-ce
nt
Mea
nan
nu
al
pre
cip
i-ta
tio
n,
in in
ches
Two
-yea
r24
-ho
ur
pre
cip
i-ta
tio
nin
ten
sity
,in
inch
es
Mea
n
ann
ual
sn
owfa
ll,in
inch
es
Mea
nm
inim
um
Ja
nu
ary
tem
-p
erat
ure
,in
deg
rees
Fa
hre
nh
eit
Lo
cal
stat
ion
sl
op
e,in
fee
t p
er m
ile
Str
eam
-fl
ow
vari
a-b
ility
ind
ex
0159
5000
MD
39.2
6079
.390
73.1
30.5
17.5
2,45
078
482.
7577
18.5
- -
- -
0159
5300
WV
39.3
6779
.179
42.6
70.6
16.8
2,67
075
412.
960
2084
.50.
560
0159
9500
WV
39.4
1079
.001
46.5
62.4
14.5
1,83
075
372.
950
2129
.3.5
7401
5955
00M
D39
.390
79.1
8022
548
.726
.92,
820
7346
2.75
7020
- -
- -
0159
6000
MD
39.4
8079
.070
287
47.6
43.1
2,67
077
45.5
2.75
6022
- -
- -
0159
6500
MD
39.5
7079
.100
49.1
65.1
19.1
2,51
081
442.
7557
20.5
- -
- -
0159
7000
MD
39.5
0079
.160
16.7
137
9.3
2,51
079
462.
7560
21-
--
-01
5980
00M
D39
.480
79.0
7011
569
.824
.82,
407
8344
.52.
7556
.721
- -
- -
0159
9000
MD
39.4
9079
.040
72.4
62.7
17.0
2,16
692
41.5
2.75
49.8
24-
--
-
0160
0000
MD
39.5
7078
.840
596
36.3
65.6
2,26
574
432.
7555
22-
--
-01
6015
00M
D39
.670
78.7
9024
755
.034
.71,
875
7036
2.75
44.4
23-
--
-01
6030
00M
D39
.620
78.7
7087
739
.182
.12,
155
7342
2.75
52.5
21-
--
-01
6045
00W
V39
.443
78.8
2221
117
.034
.51,
280
7436
2.9
3522
6.72
.565
0160
5500
WV
38.6
3679
.338
179
46.9
25.7
2,94
080
402.
940
2226
.7.3
79
0160
5700
WV
38.6
9679
.388
.45
1,07
01.
03,
700
9036
2.9
3522
502
.550
0160
6000
WV
38.9
8579
.236
335
39.1
47.7
3,12
080
442.
950
2229
.3.5
3601
6065
00W
V38
.991
79.1
7667
627
.262
.82,
910
8040
2.9
5022
16.2
.433
0160
6800
WV
38.8
0679
.214
1.43
280
2.5
2,04
075
322.
940
2213
2.4
5001
6075
00W
V38
.631
79.2
4410
330
.123
.52,
470
8038
2.9
3222
16.1
.522
0160
8000
WV
39.0
1278
.956
277
20.5
61.2
2,18
080
332.
932
2214
.7.4
7701
6081
00W
V39
.089
78.8
99.2
478
0.6
1,77
099
322.
930
2223
5.4
5001
6085
00W
V39
.447
78.6
541,
486
14.4
122.
02,
250
7535
2.9
3523
4.83
.453
0160
9000
MD
39.5
5078
.560
148
13.5
40.3
1,31
079
362.
85-
-23
.5-
--
-01
6095
00M
D39
.550
78.5
605.
0861
.25.
481
890
36.5
2.85
2923
- -
- -
Table 2 23

0160
9800
WV
39.4
9978
.489
108
35.4
27.0
1,22
070
342.
930
2314
.10.
797
0161
0000
MD
39.5
4078
.460
3,12
910
.515
81,
920
7638
2.6
4023
- -
- -
0161
0150
MD
39.7
0078
.320
10.4
46.3
8.8
1,06
062
.437
2.9
3023
- -
- -
0161
0155
MD
39.6
5078
.340
102
17.5
34.3
1,12
073
.438
2.85
- -
24-
--
-01
6105
00W
V39
.182
78.5
0730
618
.849
.72,
040
7535
2.9
2423
6.68
.436
0161
1500
WV
39.5
8278
.310
675
10.4
105.
11,
700
7536
2.9
2624
6.43
.463
0161
2500
MD
39.7
1078
.230
16.9
93.6
5.8
851
7437
.52.
923
21-
--
-01
6130
00M
D39
.700
78.1
804,
090
7.93
196
1,80
377
35.5
2.85
36.9
22-
--
-01
6131
50M
D39
.692
78.1
324.
8047
.56.
572
027
.837
.52.
935
24-
--
-01
6131
60M
D39
.691
78.1
271.
2013
22.
868
340
37.5
2.9
2624
- -
- -
0161
3900
VA
39.2
1078
.290
15.0
167
7.9
1,20
070
37.0
2.80
23.4
24.2
- -
- -
0161
4000
WV
39.5
1278
.038
235
9.20
41.9
890
7039
3.0
2624
3.88
.570
0161
5000
VA
39.1
8078
.070
57.4
17.4
20.2
760
3838
.43.
0422
.524
.8-
--
-01
6160
00V
A39
.180
78.0
9016
.537
.89.
980
042
38.3
2.93
22.9
25.1
- -
- -
0161
6500
WV
39.4
2477
.939
273
5.90
50.9
630
3040
3.0
2424
3.39
.320
0161
7000
WV
39.4
6977
.972
11.3
34.5
7.8
740
3038
3.0
2624
17.8
.380
0161
7800
MD
39.5
1077
.780
18.9
23.8
9.6
509
11.7
39.5
3.1
- -
26-
--
-01
6180
00M
D39
.430
77.8
005,
936
5.98
248.
51,
524
6837
2.59
36.1
23-
--
-01
6194
75M
D39
.470
77.6
60.1
040
1.5
451
226
39.5
3.15
2526
- -
- -
0161
9500
MD
39.4
5077
.730
281
10.8
51.8
781
29.8
403.
130
.626
- -
- -
0162
0500
VA
38.3
4079
.240
17.2
148
9.6
3,33
098
42.1
3.65
24.7
22.0
- -
- -
0162
1000
VA
38.5
0079
.050
72.6
107
15.0
2,87
010
039
.12.
8024
.521
.5-
--
-01
6212
00V
A38
.470
78.9
909.
4588
.24.
61,
830
7435
.52.
8025
.222
.2-
--
-01
6214
00V
A38
.430
78.8
805.
5237
.94.
41,
350
238
.53.
0028
.022
.8-
--
-01
6214
50V
A38
.390
78.9
20.7
217
61.
41,
290
837
.42.
8327
.123
.4-
--
-
Tab
le 2
. Bas
in-c
hara
cter
istic
s da
ta u
sed
in th
e re
gres
sion
ana
lysi
s to
dev
elop
low
-rec
urre
nce-
inte
rval
pea
k-di
scha
rge
estim
atin
g eq
uatio
ns fo
r ru
ral,
unre
gula
ted
stre
ams
in W
est V
irgin
ia—
Con
tinue
d [M
D, M
aryl
and;
OH
, Ohi
o; P
A, P
enns
ylva
nia;
VA
, Vir
gini
a; W
V, W
est V
irgi
nia;
--,
info
rmat
ion
not a
vaila
ble]
Sta
tio
nN
o.
Sta
teL
atit
ud
e,in
dec
imal
d
egre
es
Lo
ng
itu
de,
in d
ecim
al
deg
rees
Bas
in c
har
acte
rist
ics
Dra
inag
e ar
ea,
in s
qu
are
mile
s
Mai
n
chan
nel
sl
op
e,in
fee
tp
er m
ile
Str
eam
le
ng
th,
in m
iles
Mea
n
bas
inel
evat
ion
,in
fee
t ab
ove
sea
leve
l
Fo
rest
ed
area
,in
per
-ce
nt
Mea
nan
nu
al
pre
cip
i-ta
tio
n,
in in
ches
Two
-yea
r24
-ho
ur
pre
cip
i-ta
tio
nin
ten
sity
,in
inch
es
Mea
n
ann
ual
sn
owfa
ll,in
inch
es
Mea
nm
inim
um
Ja
nu
ary
tem
-p
erat
ure
,in
deg
rees
Fa
hre
nh
eit
Lo
cal
stat
ion
sl
op
e,in
fee
t p
er m
ile
Str
eam
-fl
ow
vari
a-b
ility
ind
ex
24 Estimating Annual Peak Discharges with Recurrence Intervals Between 1.1 and 3.0 Years for Rural, Unregulated Streams in WV

0162
2000
VA
38.3
4078
.910
379
43.2
38.9
2,04
052
39.0
3.09
25.4
22.2
- -
- -
0162
2100
VA
38.3
3078
.940
1.55
100
2.9
1,25
025
39.0
3.24
27.0
24.0
- -
- -
0162
2300
VA
38.1
6079
.270
.55
973
1.5
2,00
095
39.5
2.95
24.3
24.7
- -
- -
0162
2400
VA
38.2
0079
.220
.49
950
1.0
1,80
063
37.8
2.88
24.6
25.0
- -
- -
0163
2000
VA
38.6
4078
.850
210
44.3
25.8
2,02
089
35.8
3.09
24.0
21.0
- -
- -
0163
2300
VA
38.5
8078
.760
8.15
48.8
5.4
1,26
015
37.4
2.90
24.5
24.2
- -
- -
0163
2900
VA
38.6
9078
.640
93.2
20.5
25.1
1,40
050
38.0
3.58
23.8
24.2
- -
- -
0163
2950
VA
38.8
0078
.720
.31
500
1.0
1,45
098
35.2
2.87
23.3
23.8
- -
- -
0163
2970
VA
38.7
6078
.690
6.49
61.8
4.5
1,20
045
35.2
2.78
23.3
23.8
- -
- -
0163
3000
VA
38.7
5078
.640
506
24.3
45.9
1,67
053
37.0
3.14
24.6
22.4
- -
- -
0163
3500
VA
38.8
7078
.630
79.4
28.6
20.4
2,03
086
34.0
2.80
23.2
23.4
- -
- -
0163
3650
VA
38.9
3078
.550
3.66
292.
12.
51,
510
6035
.22.
5222
.523
.9-
--
-01
6340
00V
A38
.980
78.3
4076
89.
8610
31,
430
5036
.53.
0323
.923
.0-
--
-01
6345
00V
A39
.080
78.3
3010
333
23.4
1,35
086
34.6
2.87
22.6
23.8
- -
- -
0163
6500
WV
39.2
8277
.789
3,02
26.
7018
3.8
1,54
050
423.
024
255.
700.
334
0163
7000
MD
39.4
8077
.540
8.83
210
5.1
1,01
048
423.
234
24-
--
-01
6375
00M
D39
.430
77.5
6066
.947
.523
.91,
110
3742
.53.
1535
23.5
- -
- -
0163
8480
VA
39.2
5077
.580
89.6
14.1
27.5
600
3041
.33.
1920
.223
.5-
--
-01
6385
00M
D39
.270
77.5
409,
651
5.56
270.
91,
356
5939
.53.
0530
.623
- -
- -
0164
3700
VA
38.9
9077
.800
123
16.8
22.9
700
4039
.83.
1820
.324
.3-
--
-
0164
4000
VA
39.0
2077
.580
332
8.25
40.6
660
3540
.03.
1820
.423
.8-
--
-01
6441
00V
A39
.070
77.6
102.
0571
.73.
156
017
39.9
3.00
20.5
24.4
- -
- -
0200
9500
VA
38.2
7079
.670
.74
800
2.0
2,38
070
40.8
2.80
24.2
20.7
- -
- -
0201
1400
VA
38.0
4279
.882
158
- -
- -
- -
- -
- -
- -
- -
- -
- -
- -
0201
1460
VA
38.2
4579
.769
60.1
- -
- -
- -
- -
- -
- -
- -
- -
- -
- -
Tab
le 2
. Bas
in-c
hara
cter
istic
s da
ta u
sed
in th
e re
gres
sion
ana
lysi
s to
dev
elop
low
-rec
urre
nce-
inte
rval
pea
k-di
scha
rge
estim
atin
g eq
uatio
ns fo
r ru
ral,
unre
gula
ted
stre
ams
in W
est V
irgin
ia—
Con
tinue
d [M
D, M
aryl
and;
OH
, Ohi
o; P
A, P
enns
ylva
nia;
VA
, Vir
gini
a; W
V, W
est V
irgi
nia;
--,
info
rmat
ion
not a
vaila
ble]
Sta
tio
nN
o.
Sta
teL
atit
ud
e,in
dec
imal
d
egre
es
Lo
ng
itu
de,
in d
ecim
al
deg
rees
Bas
in c
har
acte
rist
ics
Dra
inag
e ar
ea,
in s
qu
are
mile
s
Mai
n
chan
nel
sl
op
e,in
fee
tp
er m
ile
Str
eam
le
ng
th,
in m
iles
Mea
n
bas
inel
evat
ion
,in
fee
t ab
ove
sea
leve
l
Fo
rest
ed
area
,in
per
-ce
nt
Mea
nan
nu
al
pre
cip
i-ta
tio
n,
in in
ches
Two
-yea
r24
-ho
ur
pre
cip
i-ta
tio
nin
ten
sity
,in
inch
es
Mea
n
ann
ual
sn
owfa
ll,in
inch
es
Mea
nm
inim
um
Ja
nu
ary
tem
-p
erat
ure
,in
deg
rees
Fa
hre
nh
eit
Lo
cal
stat
ion
sl
op
e,in
fee
t p
er m
ile
Str
eam
-fl
ow
vari
a-b
ility
ind
ex
Table 2 25

0201
1480
VA
38.1
3579
.866
85.8
27.0
5.3
- -
- -
- -
- -
- -
- -
- -
- -
0201
1500
VA
38.0
7079
.900
134
44.4
33.4
2,89
090
40.9
2.86
24.0
20.8
- -
- -
0201
2500
VA
37.8
8079
.980
411
25.3
57.6
2,48
080
40.8
2.74
23.4
21.2
- -
- -
0201
2950
VA
37.6
6080
.240
.66
592
1.7
2,33
068
37.8
2.55
19.6
24.0
- -
- -
0201
3000
VA
37.8
0080
.050
164
40.5
27.3
2,23
087
38.5
2.56
20.8
23.4
- -
- -
0201
4000
VA
37.7
3080
.040
153
27.3
39.8
2,32
085
38.6
2.62
19.6
24.4
- -
- -
0305
0000
WV
38.8
0979
.882
185
24.5
37.6
3,11
080
562.
890
219.
440.
582
0305
0500
WV
38.9
2479
.879
271
13.8
55.0
2,94
080
502.
890
211.
65.5
7703
0506
50W
V38
.976
79.8
38.3
811
01.
32,
025
8048
2.8
8023
101
.650
0305
1000
WV
39.0
2979
.936
406
11.2
71.8
2,69
080
482.
890
224.
46.5
96
0305
1500
WV
38.9
3980
.090
122
43.0
26.6
2,60
080
542.
810
024
4.29
.567
0305
2000
WV
39.0
3980
.068
148
25.7
37.9
2,48
080
532.
810
024
47.4
.607
0305
2340
WV
39.0
0580
.256
2.33
38.6
2.9
1,55
060
482.
780
256.
99.5
5003
0525
00W
V38
.964
80.1
5314
.354
.012
.61,
870
6048
2.7
9025
46.5
.642
0305
3500
WV
39.0
5180
.115
277
22.5
54.0
2,11
060
522.
790
2513
.0.5
58
0305
4500
WV
39.1
5080
.039
914
11.2
88.4
2,41
075
502.
790
248.
29.5
5903
0550
20W
V39
.125
79.9
97.6
026
5.8
1,79
020
472.
770
2540
.6.7
5003
0550
40W
V39
.153
79.9
793.
1542
.33.
51,
780
3547
2.7
7025
50.3
.750
0305
6250
WV
39.3
3679
.994
96.8
28.3
23.0
1,68
060
462.
760
259.
96.6
3103
0565
00W
V39
.350
80.0
421,
304
12.0
114.
82,
220
7549
2.7
7024
2.52
.564
0305
6600
WV
39.3
7979
.963
2.33
107
2.0
1,47
030
462.
640
2596
.0.6
5003
0573
00W
V38
.869
80.4
5828
.851
.011
.91,
380
5048
2.7
8025
3.94
.943
0305
7500
WV
38.9
7580
.444
25.7
19.7
9.5
1,35
050
482.
760
255.
56.9
2703
0580
00W
V39
.003
80.4
7410
113
.230
.41,
340
5547
2.7
7026
2.69
.718
0305
8500
WV
39.0
9180
.468
181
5.40
39.4
1,34
055
482.
770
252.
48.6
94
Tab
le 2
. Bas
in-c
hara
cter
istic
s da
ta u
sed
in th
e re
gres
sion
ana
lysi
s to
dev
elop
low
-rec
urre
nce-
inte
rval
pea
k-di
scha
rge
estim
atin
g eq
uatio
ns fo
r ru
ral,
unre
gula
ted
stre
ams
in W
est V
irgin
ia—
Con
tinue
d [M
D, M
aryl
and;
OH
, Ohi
o; P
A, P
enns
ylva
nia;
VA
, Vir
gini
a; W
V, W
est V
irgi
nia;
--,
info
rmat
ion
not a
vaila
ble]
Sta
tio
nN
o.
Sta
teL
atit
ud
e,in
dec
imal
d
egre
es
Lo
ng
itu
de,
in d
ecim
al
deg
rees
Bas
in c
har
acte
rist
ics
Dra
inag
e ar
ea,
in s
qu
are
mile
s
Mai
n
chan
nel
sl
op
e,in
fee
tp
er m
ile
Str
eam
le
ng
th,
in m
iles
Mea
n
bas
inel
evat
ion
,in
fee
t ab
ove
sea
leve
l
Fo
rest
ed
area
,in
per
-ce
nt
Mea
nan
nu
al
pre
cip
i-ta
tio
n,
in in
ches
Two
-yea
r24
-ho
ur
pre
cip
i-ta
tio
nin
ten
sity
,in
inch
es
Mea
n
ann
ual
sn
owfa
ll,in
inch
es
Mea
nm
inim
um
Ja
nu
ary
tem
-p
erat
ure
,in
deg
rees
Fa
hre
nh
eit
Lo
cal
stat
ion
sl
op
e,in
fee
t p
er m
ile
Str
eam
-fl
ow
vari
a-b
ility
ind
ex
26 Estimating Annual Peak Discharges with Recurrence Intervals Between 1.1 and 3.0 Years for Rural, Unregulated Streams in WV

0305
9000
WV
39.2
7180
.356
384
3.60
71.4
1,25
030
482.
755
252.
310.
758
0305
9500
WV
39.2
2880
.297
84.6
8.90
16.4
1,35
030
482.
755
246.
03.6
1803
0605
00W
V39
.286
80.5
438.
3242
.33.
51,
220
4048
2.7
4024
10.6
.988
0306
1000
WV
39.4
2280
.276
759
2.50
89.3
1,26
050
462.
750
252.
18.5
7703
0615
00W
V39
.504
80.1
7211
67.
4023
.51,
300
6546
2.7
3024
6.62
.660
0306
2400
WV
39.6
0879
.955
11.0
132
8.4
1,42
075
442.
740
2626
.0.7
3203
0625
00W
V39
.629
79.9
5363
.246
.023
.41,
770
6544
2.7
5026
28.6
.605
0306
3950
WV
38.8
8279
.596
1.08
265
1.3
3,10
060
572.
870
2219
2.3
7003
0650
00W
V39
.072
79.6
2334
941
.837
.63,
310
8052
2.8
8022
11.8
.500
0306
6000
WV
39.1
2779
.469
85.9
8.10
21.4
3,25
050
522.
870
2111
.6.4
30
0306
8610
WV
38.9
0779
.697
5.06
451
3.1
3,25
090
522.
880
2212
6.4
3003
0690
00W
V39
.096
79.6
7721
329
.584
.73,
300
9046
2.8
8022
8.59
.440
0306
9500
WV
39.1
2379
.681
722
29.3
87.7
3,25
085
492.
870
2221
.3.4
6903
0698
50W
V39
.259
79.7
22.9
530
51.
12,
105
6050
2.9
8023
282
.650
0306
9880
WV
39.2
8979
.704
12.2
105
8.1
2,29
060
522.
770
2448
.2.5
60
0307
0000
WV
39.3
4679
.666
974
24.0
118.
42,
950
8051
2.8
7023
10.3
.481
0307
0500
WV
39.6
1679
.705
200
10.4
24.4
2,07
010
492.
755
2249
.8.5
9303
0710
00W
V39
.607
79.7
781,
354
21.5
145.
02,
700
8050
2.8
7022
12.8
.502
0307
1500
WV
39.6
6779
.862
1,38
021
.415
1.7
2690
8050
2.8
7022
12.8
.490
0307
2000
PA39
.760
79.9
7022
93.
9442
.94
1100
4441
.62.
345
24-
--
-
0307
2590
PA39
.800
79.8
0016
.313
56.
6113
4045
41.9
2.45
- -
26-
--
-03
0754
50M
D39
.410
79.3
50.5
799
.41.
12,
520
7947
.52.
75-
-20
- -
- -
0307
5500
MD
39.4
2079
.430
134
6.09
20.0
2,61
064
502.
774
18-
--
-03
0756
00M
D39
.490
79.4
20.5
320
41.
12,
470
6349
.52.
7-
-20
- -
- -
0307
6505
MD
39.6
6079
.430
.22
415
.76
1,93
045
482.
65-
-20
- -
- -
Tab
le 2
. Bas
in-c
hara
cter
istic
s da
ta u
sed
in th
e re
gres
sion
ana
lysi
s to
dev
elop
low
-rec
urre
nce-
inte
rval
pea
k-di
scha
rge
estim
atin
g eq
uatio
ns fo
r ru
ral,
unre
gula
ted
stre
ams
in W
est V
irgin
ia—
Con
tinue
d [M
D, M
aryl
and;
OH
, Ohi
o; P
A, P
enns
ylva
nia;
VA
, Vir
gini
a; W
V, W
est V
irgi
nia;
--,
info
rmat
ion
not a
vaila
ble]
Sta
tio
nN
o.
Sta
teL
atit
ud
e,in
dec
imal
d
egre
es
Lo
ng
itu
de,
in d
ecim
al
deg
rees
Bas
in c
har
acte
rist
ics
Dra
inag
e ar
ea,
in s
qu
are
mile
s
Mai
n
chan
nel
sl
op
e,in
fee
tp
er m
ile
Str
eam
le
ng
th,
in m
iles
Mea
n
bas
inel
evat
ion
,in
fee
t ab
ove
sea
leve
l
Fo
rest
ed
area
,in
per
-ce
nt
Mea
nan
nu
al
pre
cip
i-ta
tio
n,
in in
ches
Two
-yea
r24
-ho
ur
pre
cip
i-ta
tio
nin
ten
sity
,in
inch
es
Mea
n
ann
ual
sn
owfa
ll,in
inch
es
Mea
nm
inim
um
Ja
nu
ary
tem
-p
erat
ure
,in
deg
rees
Fa
hre
nh
eit
Lo
cal
stat
ion
sl
op
e,in
fee
t p
er m
ile
Str
eam
-fl
ow
vari
a-b
ility
ind
ex
Table 2 27

0307
6600
MD
39.6
4079
.320
48.9
65.6
15.9
2,46
044
482.
7-
-20
- -
- -
0310
8000
PA40
.630
80.3
4017
88.
3642
.61
1100
3838
.02.
347
22-
--
-03
1090
00O
H40
.780
80.7
606.
1955
.65.
231,
188
1539
2.5
3420
- -
- -
0310
9500
OH
40.6
8080
.540
496
8.29
52.0
1,11
215
37.5
2.5
3222
- -
- -
0311
0000
OH
40.5
4080
.730
147
9.81
28.9
1,08
944
402.
536
22-
--
-
0311
0980
OH
40.3
3280
.812
.04
500
.27
1,25
011
392.
5-
-22
- -
- -
0311
1150
PA40
.200
80.4
1010
.334
.46.
3611
9012
39.2
2.4
- -
22-
--
-03
1114
50O
H40
.207
80.9
231.
3195
.22.
241,
110
8.2
39.5
2.5
- -
21-
--
-03
1114
55O
H40
.208
80.9
2010
.937
.95.
981,
150
1139
.52.
5-
-21
.5-
--
-03
1114
70O
H40
.302
80.8
491.
5778
.82.
201,
220
11.5
392.
5-
-22
.5-
--
-
0311
1490
OH
40.2
7280
.847
.44
130
1.63
1,13
014
.839
2.5
- -
22.5
- -
- -
0311
1500
OH
40.1
9080
.730
123
14.4
25.8
1,10
615
392.
538
23-
--
-03
1115
40O
H40
.152
80.8
83.3
425
4.8
71,
160
20.6
39.5
2.5
- -
22-
--
-03
1120
00W
V40
.044
80.6
6128
111
.134
.81,
230
5040
2.5
3024
10.1
0.69
803
1137
00W
V39
.961
80.7
014.
9514
02.
81,
200
6042
2.5
3024
59.8
.584
0311
4000
OH
39.9
1080
.920
134
16.0
26.2
1,14
28.
341
2.5
3523
- -
- -
0311
4240
OH
39.7
8281
.056
.53
246
1.63
1,12
036
.841
.52.
5-
-24
- -
- -
0311
4500
WV
39.4
7580
.997
458
3.90
72.0
1,06
060
462.
632
242.
33.7
4803
1145
50W
V39
.506
81.0
28.8
812
01.
492
090
432.
528
2475
.4.6
5003
1146
00W
V39
.503
81.0
161.
2211
01.
896
070
432.
528
2444
.0.6
50
0311
4650
WV
39.4
8781
.007
4.19
62.7
1.6
900
4043
2.5
2824
30.3
.671
0311
5280
OH
39.6
2581
.048
5.45
90.3
3.03
985
61.1
422.
5-
-25
- -
- -
0311
5400
OH
39.5
6381
.204
210
7.0
42.3
4597
450
41.5
2.5
- -
25-
--
-03
1154
10O
H39
.543
81.2
09.1
328
9.6
180
552
.641
.52.
5-
-25
- -
- -
0311
5510
OH
39.4
7381
.314
1.52
114
1.97
865
53.3
40.5
2.5
- -
26-
--
-
Tab
le 2
. Bas
in-c
hara
cter
istic
s da
ta u
sed
in th
e re
gres
sion
ana
lysi
s to
dev
elop
low
-rec
urre
nce-
inte
rval
pea
k-di
scha
rge
estim
atin
g eq
uatio
ns fo
r ru
ral,
unre
gula
ted
stre
ams
in W
est V
irgin
ia—
Con
tinue
d [M
D, M
aryl
and;
OH
, Ohi
o; P
A, P
enns
ylva
nia;
VA
, Vir
gini
a; W
V, W
est V
irgi
nia;
--,
info
rmat
ion
not a
vaila
ble]
Sta
tio
nN
o.
Sta
teL
atit
ud
e,in
dec
imal
d
egre
es
Lo
ng
itu
de,
in d
ecim
al
deg
rees
Bas
in c
har
acte
rist
ics
Dra
inag
e ar
ea,
in s
qu
are
mile
s
Mai
n
chan
nel
sl
op
e,in
fee
tp
er m
ile
Str
eam
le
ng
th,
in m
iles
Mea
n
bas
inel
evat
ion
,in
fee
t ab
ove
sea
leve
l
Fo
rest
ed
area
,in
per
-ce
nt
Mea
nan
nu
al
pre
cip
i-ta
tio
n,
in in
ches
Two
-yea
r24
-ho
ur
pre
cip
i-ta
tio
nin
ten
sity
,in
inch
es
Mea
n
ann
ual
sn
owfa
ll,in
inch
es
Mea
nm
inim
um
Ja
nu
ary
tem
-p
erat
ure
,in
deg
rees
Fa
hre
nh
eit
Lo
cal
stat
ion
sl
op
e,in
fee
t p
er m
ile
Str
eam
-fl
ow
vari
a-b
ility
ind
ex
28 Estimating Annual Peak Discharges with Recurrence Intervals Between 1.1 and 3.0 Years for Rural, Unregulated Streams in WV

0311
5600
OH
39.7
7081
.370
3.46
75.5
3.64
1,03
025
.240
2.5
3223
- -
- -
0311
5710
OH
39.6
6181
.449
.19
366
.95
960
47.9
402.
5-
-23
.5-
--
-03
1506
00O
H39
.473
81.4
66.9
958
.01.
913
721
2940
2.5
- -
25-
--
-03
1514
00W
V38
.743
80.5
2611
242
.130
.61,
770
7048
2.7
9025
9.38
0.56
203
1515
00W
V38
.824
80.5
9315
533
.639
.31,
600
7048
2.7
7025
1.56
.675
0315
2000
WV
38.9
3480
.839
387
17.4
62.8
1,28
065
482.
760
251.
11.6
7603
1522
00W
V39
.124
80.6
912.
9113
32.
51,
090
5048
2.6
4024
43.7
.740
0315
2500
WV
38.9
6280
.867
144
6.70
27.8
1,05
055
482.
640
243.
27.6
9903
1530
00W
V38
.862
81.0
3516
210
.228
.71,
110
7548
2.6
4025
3.26
.810
0315
3500
WV
38.9
2281
.098
913
11.1
86.2
1,17
065
482.
745
251.
33.6
98
0315
4000
WV
38.8
4481
.223
205
5.50
29.1
1,03
050
472.
632
255.
27.8
0803
1542
50W
V38
.803
81.3
662.
8261
.92.
888
040
452.
626
2432
.9.7
4203
1545
00W
V38
.961
81.3
9079
.46.
5022
.691
045
442.
624
254.
46.8
5303
1550
00W
V39
.059
81.3
901,
516
3.10
138.
31,
090
6048
2.6
3525
.914
.651
0315
5200
WV
39.0
7881
.190
210
5.60
43.1
1,02
045
462.
634
2428
.2.7
13
0315
5450
WV
39.0
8381
.261
3.52
89.0
2.6
890
8043
2.6
2425
55.6
.850
0315
5500
WV
39.1
1981
.278
453
4.30
53.2
990
5545
2.6
3024
3.53
.752
0315
9540
OH
39.0
6481
.882
1.56
4.00
29.8
749
4240
.52.
6-
-26
- -
- -
0315
9700
WV
38.7
6581
.678
.70
80.0
1.3
885
3042
2.6
2325
48.0
.850
0317
1500
VA
37.2
9080
.620
2,94
18.
0319
92,
740
5143
.52.
8818
.824
.7-
--
-
0317
3000
VA
37.2
7080
.710
305
20.1
53.7
2,59
064
37.4
2.56
17.9
25.8
- -
- -
0317
5500
VA
37.3
1080
.850
223
35.9
45.0
2,81
071
40.6
2.57
26.2
25.4
- -
- -
0317
6500
VA
37.3
7080
.860
3,76
86.
7222
52,
700
5342
.32.
8019
.524
.8-
--
-03
1770
00W
V37
.400
80.8
0650
.637
.912
.32,
400
5038
2.9
2426
41.7
.490
0317
7500
WV
37.5
3280
.819
189
15.3
40.0
2,31
060
382.
930
2615
.8.5
32
Tab
le 2
. Bas
in-c
hara
cter
istic
s da
ta u
sed
in th
e re
gres
sion
ana
lysi
s to
dev
elop
low
-rec
urre
nce-
inte
rval
pea
k-di
scha
rge
estim
atin
g eq
uatio
ns fo
r ru
ral,
unre
gula
ted
stre
ams
in W
est V
irgin
ia—
Con
tinue
d [M
D, M
aryl
and;
OH
, Ohi
o; P
A, P
enns
ylva
nia;
VA
, Vir
gini
a; W
V, W
est V
irgi
nia;
--,
info
rmat
ion
not a
vaila
ble]
Sta
tio
nN
o.
Sta
teL
atit
ud
e,in
dec
imal
d
egre
es
Lo
ng
itu
de,
in d
ecim
al
deg
rees
Bas
in c
har
acte
rist
ics
Dra
inag
e ar
ea,
in s
qu
are
mile
s
Mai
n
chan
nel
sl
op
e,in
fee
tp
er m
ile
Str
eam
le
ng
th,
in m
iles
Mea
n
bas
inel
evat
ion
,in
fee
t ab
ove
sea
leve
l
Fo
rest
ed
area
,in
per
-ce
nt
Mea
nan
nu
al
pre
cip
i-ta
tio
n,
in in
ches
Two
-yea
r24
-ho
ur
pre
cip
i-ta
tio
nin
ten
sity
,in
inch
es
Mea
n
ann
ual
sn
owfa
ll,in
inch
es
Mea
nm
inim
um
Ja
nu
ary
tem
-p
erat
ure
,in
deg
rees
Fa
hre
nh
eit
Lo
cal
stat
ion
sl
op
e,in
fee
t p
er m
ile
Str
eam
-fl
ow
vari
a-b
ility
ind
ex
Table 2 29

0317
7700
VA
37.2
6081
.280
39.8
31.6
15.2
2,80
090
43.2
2.50
31.1
25.0
- -
- -
0317
8500
WV
37.5
0481
.128
32.0
87.3
9.5
2,71
090
442.
840
2584
.10.
772
0317
9000
WV
37.5
4481
.011
395
5.90
100.
02,
570
6040
2.8
4026
12.2
.522
0317
9500
WV
37.5
8580
.965
438
8.00
103.
02,
560
6040
2.8
4026
16.6
.568
0318
0000
WV
37.6
4580
.884
4,60
25.
4026
2.3
2,69
060
402.
924
2511
.7.2
87
0318
0350
WV
38.5
5879
.831
1.13
740
1.8
3,53
595
422.
880
2026
4.5
5003
1805
00W
V38
.544
79.8
3313
323
.819
.13,
620
8042
2.8
7021
15.4
.535
0318
0530
WV
38.5
0879
.784
1.28
109
3.1
3,12
070
422.
870
2148
.0.5
5003
1806
80W
V38
.409
79.8
121.
5248
83.
23,
350
9042
2.8
6021
48.0
.550
0318
1900
WV
38.2
3679
.974
.10
528
.62,
620
9940
2.9
4522
111
.550
0318
2000
WV
38.2
1180
.075
108
28.3
25.4
2,91
080
402.
940
2211
.1.5
1403
1825
00W
V38
.186
80.1
3154
016
.166
.13,
180
8042
2.8
5521
6.93
.549
0318
2700
WV
37.9
0880
.291
144
19.9
27.5
2,48
095
402.
940
2318
.3.5
3503
1830
00W
V37
.685
80.4
5780
.837
.519
.22,
630
7038
2.9
3524
20.2
.524
0318
3500
WV
37.7
2480
.642
1,36
49.
2014
0.8
2,84
080
412.
850
225.
78.5
27
0318
3550
WV
37.7
3880
.710
3.84
544
3.5
2,70
595
362.
945
2519
2.6
5003
1835
70W
V37
.684
80.7
172.
7128
02.
51,
950
6036
2.9
4525
35.2
.650
0318
4000
WV
37.6
4080
.805
1,61
99.
0016
4.0
2,77
075
402.
850
234.
91.5
3803
1845
00W
V37
.670
80.8
936,
256
7.80
264.
02,
670
6040
2.9
3024
11.7
.308
0318
5000
WV
37.7
6181
.162
52.7
12.3
20.6
2,57
080
442.
845
2436
.8.5
50
0318
5020
WV
37.7
2581
.101
.62
350
1.0
2,68
060
432.
850
2446
.9.6
5003
1855
00W
V38
.022
81.0
296,
826
6.60
309.
92,
700
6540
2.9
3524
16.8
.350
0318
6000
WV
38.0
6581
.078
6,85
06.
6031
4.9
2,70
065
402.
935
2417
.2.3
2903
1865
00W
V38
.379
80.4
8412
841
.931
.43,
410
9952
2.8
100
2113
.5.5
4203
1870
00W
V38
.366
80.6
0123
627
.737
.03,
180
9550
2.8
100
228.
33.5
41
Tab
le 2
. Bas
in-c
hara
cter
istic
s da
ta u
sed
in th
e re
gres
sion
ana
lysi
s to
dev
elop
low
-rec
urre
nce-
inte
rval
pea
k-di
scha
rge
estim
atin
g eq
uatio
ns fo
r ru
ral,
unre
gula
ted
stre
ams
in W
est V
irgin
ia—
Con
tinue
d [M
D, M
aryl
and;
OH
, Ohi
o; P
A, P
enns
ylva
nia;
VA
, Vir
gini
a; W
V, W
est V
irgi
nia;
--,
info
rmat
ion
not a
vaila
ble]
Sta
tio
nN
o.
Sta
teL
atit
ud
e,in
dec
imal
d
egre
es
Lo
ng
itu
de,
in d
ecim
al
deg
rees
Bas
in c
har
acte
rist
ics
Dra
inag
e ar
ea,
in s
qu
are
mile
s
Mai
n
chan
nel
sl
op
e,in
fee
tp
er m
ile
Str
eam
le
ng
th,
in m
iles
Mea
n
bas
inel
evat
ion
,in
fee
t ab
ove
sea
leve
l
Fo
rest
ed
area
,in
per
-ce
nt
Mea
nan
nu
al
pre
cip
i-ta
tio
n,
in in
ches
Two
-yea
r24
-ho
ur
pre
cip
i-ta
tio
nin
ten
sity
,in
inch
es
Mea
n
ann
ual
sn
owfa
ll,in
inch
es
Mea
nm
inim
um
Ja
nu
ary
tem
-p
erat
ure
,in
deg
rees
Fa
hre
nh
eit
Lo
cal
stat
ion
sl
op
e,in
fee
t p
er m
ile
Str
eam
-fl
ow
vari
a-b
ility
ind
ex
30 Estimating Annual Peak Discharges with Recurrence Intervals Between 1.1 and 3.0 Years for Rural, Unregulated Streams in WV

0318
7300
WV
38.2
5880
.324
9.78
126
6.5
3,95
099
532.
880
2193
.30.
408
0318
7500
WV
38.2
9580
.527
80.4
52.5
27.2
3,27
099
492.
890
2245
.8.4
8603
1890
00W
V38
.229
80.5
8315
076
.620
.63,
320
9549
2.8
8022
37.7
.624
0318
9100
WV
38.2
9180
.641
529
21.9
46.6
3,05
092
492.
880
2323
.8.4
8503
1895
00W
V38
.271
80.8
1968
018
.062
.82,
960
9049
2.8
8024
19.3
.557
0318
9650
WV
38.1
7680
.869
2.78
143
2.8
2,08
095
492.
770
2331
.0.7
0703
1900
00W
V38
.112
80.8
7628
715
.144
.92,
880
7548
2.8
7022
17.4
.629
0319
0400
WV
38.1
9080
.947
365
17.3
55.7
2,70
080
482.
870
2349
.2.5
1303
1905
00W
V38
.225
80.9
324.
2235
.03.
81,
750
2548
2.7
6024
18.3
.650
0319
1400
WV
38.2
5880
.990
4.28
110
3.5
1,50
060
482.
760
2411
1.6
50
0319
1500
WV
38.2
6281
.023
40.2
53.1
13.1
1,70
080
482.
755
2518
.7.6
0703
1920
00W
V38
.233
81.1
811,
317
19.2
99.9
2,69
085
482.
870
244.
41.5
9903
1925
00W
V38
.225
81.1
921,
402
19.2
100.
92,
690
8548
2.8
7024
4.41
.507
0319
3000
WV
38.1
3881
.214
8,37
16.
3032
9.0
2,69
065
422.
835
244.
41.3
6103
1937
25W
V37
.981
81.2
74.4
253
31.
01,
800
6544
2.7
4025
151
.450
0319
4700
WV
38.5
9780
.491
266
45.0
54.1
3,00
088
542.
810
022
11.4
.476
0319
5000
WV
38.6
1780
.556
281
34.8
65.4
2,90
090
522.
810
022
11.4
.540
0319
5100
WV
38.6
3580
.466
51.9
67.5
16.8
2,09
089
502.
710
024
23.2
.557
0319
5250
WV
38.6
8980
.432
46.5
125
15.2
2,24
081
502.
710
024
55.3
.550
0319
5500
WV
38.6
6380
.710
542
29.2
81.6
2,43
090
502.
890
243.
30.5
71
0319
5600
WV
38.6
7780
.713
6.98
71.0
4.7
1,18
050
482.
760
2522
.9.6
2903
1970
00W
V38
.471
81.2
841,
145
12.6
155.
91,
840
8547
2.7
6025
2.26
.600
0319
7150
WV
38.6
2681
.234
2.01
100
2.0
1,01
060
442.
730
2648
.0.9
5003
1979
00W
V38
.354
81.5
23.4
924
21.
11,
015
7044
2.7
2426
88.0
.850
0319
8450
WV
38.1
2581
.692
7.75
49.0
4.8
1,23
050
432.
724
2628
.1.9
47
Tab
le 2
. Bas
in-c
hara
cter
istic
s da
ta u
sed
in th
e re
gres
sion
ana
lysi
s to
dev
elop
low
-rec
urre
nce-
inte
rval
pea
k-di
scha
rge
estim
atin
g eq
uatio
ns fo
r ru
ral,
unre
gula
ted
stre
ams
in W
est V
irgin
ia—
Con
tinue
d [M
D, M
aryl
and;
OH
, Ohi
o; P
A, P
enns
ylva
nia;
VA
, Vir
gini
a; W
V, W
est V
irgi
nia;
--,
info
rmat
ion
not a
vaila
ble]
Sta
tio
nN
o.
Sta
teL
atit
ud
e,in
dec
imal
d
egre
es
Lo
ng
itu
de,
in d
ecim
al
deg
rees
Bas
in c
har
acte
rist
ics
Dra
inag
e ar
ea,
in s
qu
are
mile
s
Mai
n
chan
nel
sl
op
e,in
fee
tp
er m
ile
Str
eam
le
ng
th,
in m
iles
Mea
n
bas
inel
evat
ion
,in
fee
t ab
ove
sea
leve
l
Fo
rest
ed
area
,in
per
-ce
nt
Mea
nan
nu
al
pre
cip
i-ta
tio
n,
in in
ches
Two
-yea
r24
-ho
ur
pre
cip
i-ta
tio
nin
ten
sity
,in
inch
es
Mea
n
ann
ual
sn
owfa
ll,in
inch
es
Mea
nm
inim
um
Ja
nu
ary
tem
-p
erat
ure
,in
deg
rees
Fa
hre
nh
eit
Lo
cal
stat
ion
sl
op
e,in
fee
t p
er m
ile
Str
eam
-fl
ow
vari
a-b
ility
ind
ex
Table 2 31

0319
8500
WV
38.1
8081
.712
391
28.1
63.0
1,75
095
432.
728
263.
210.
600
0319
8780
WV
38.0
0681
.815
1.97
330
2.5
1,41
095
442.
724
2611
7.6
5003
1988
00W
V38
.028
81.8
341.
2816
72.
01,
130
9044
2.7
2426
132
.650
0319
9000
WV
38.0
8081
.836
269
19.7
32.3
1,63
095
442.
726
265.
13.6
0903
1994
00W
V38
.155
81.8
5231
815
.540
.41,
540
9544
2.7
2426
3.25
.485
0320
0500
WV
38.3
3981
.842
862
10.5
106.
91,
450
9044
2.7
2426
1.72
.493
0320
0600
WV
38.4
5181
.854
.87
180
1.5
835
5042
2.7
2326
70.4
.850
0320
1000
WV
38.5
2681
.631
238
3.90
44.5
940
4545
2.6
2425
2.19
.875
0320
1410
WV
38.4
5081
.932
8.47
25.0
5.9
820
2542
2.7
2226
16.4
.602
0320
1420
WV
38.4
7981
.930
2.05
93.0
2.0
820
5042
2.7
2226
40.6
.850
0320
1440
WV
38.6
4482
.048
1.04
108
1.6
810
6042
2.6
2228
42.2
.850
0320
1480
WV
38.8
3882
.095
.70
128
1.3
710
9040
2.6
2227
52.8
.850
0320
2000
OH
38.8
7082
.360
585
2.81
71.6
829
21.9
402.
621
26-
--
-03
2024
00W
V37
.604
81.6
4530
635
.237
.52,
080
9146
2.8
3525
4.60
.398
0320
2480
WV
37.5
6381
.652
7.34
94.3
4.9
1,71
085
452.
832
2740
.8.5
92
0320
2750
WV
37.6
2381
.707
126
32.0
25.8
1,15
080
462.
832
268.
40.5
1203
2030
00W
V37
.740
81.8
7775
812
.986
.91,
950
9045
2.8
3426
5.44
.586
0320
3600
WV
37.8
4281
.976
833
10.4
99.2
1,90
090
452.
830
265.
83.4
8003
2040
00W
V38
.221
82.2
031,
224
7.70
144.
71,
790
9044
2.8
2626
1.17
.566
0320
4500
WV
38.3
8882
.113
256
4.10
48.5
950
8043
2.7
2326
1.55
.819
0320
5995
OH
38.4
1882
.510
.73
124
1.52
740
84.9
42.5
2.7
- -
28-
--
-03
2066
00W
V38
.017
82.2
9638
.521
.717
.21,
080
9243
2.7
2227
8.84
.694
0320
6800
WV
38.1
5482
.385
139
8.14
39.3
1,04
085
432.
722
274.
041.
029
0320
7000
WV
38.2
1782
.449
291
6.57
48.3
1,02
080
432.
722
272.
51.8
0603
2070
20W
V38
.249
82.4
3430
05.
7052
.31,
020
8043
2.7
2227
2.51
.873
Tab
le 2
. Bas
in-c
hara
cter
istic
s da
ta u
sed
in th
e re
gres
sion
ana
lysi
s to
dev
elop
low
-rec
urre
nce-
inte
rval
pea
k-di
scha
rge
estim
atin
g eq
uatio
ns fo
r ru
ral,
unre
gula
ted
stre
ams
in W
est V
irgin
ia—
Con
tinue
d [M
D, M
aryl
and;
OH
, Ohi
o; P
A, P
enns
ylva
nia;
VA
, Vir
gini
a; W
V, W
est V
irgi
nia;
--,
info
rmat
ion
not a
vaila
ble]
Sta
tio
nN
o.
Sta
teL
atit
ud
e,in
dec
imal
d
egre
es
Lo
ng
itu
de,
in d
ecim
al
deg
rees
Bas
in c
har
acte
rist
ics
Dra
inag
e ar
ea,
in s
qu
are
mile
s
Mai
n
chan
nel
sl
op
e,in
fee
tp
er m
ile
Str
eam
le
ng
th,
in m
iles
Mea
n
bas
inel
evat
ion
,in
fee
t ab
ove
sea
leve
l
Fo
rest
ed
area
,in
per
-ce
nt
Mea
nan
nu
al
pre
cip
i-ta
tio
n,
in in
ches
Two
-yea
r24
-ho
ur
pre
cip
i-ta
tio
nin
ten
sity
,in
inch
es
Mea
n
ann
ual
sn
owfa
ll,in
inch
es
Mea
nm
inim
um
Ja
nu
ary
tem
-p
erat
ure
,in
deg
rees
Fa
hre
nh
eit
Lo
cal
stat
ion
sl
op
e,in
fee
t p
er m
ile
Str
eam
-fl
ow
vari
a-b
ility
ind
ex
32 Estimating Annual Peak Discharges with Recurrence Intervals Between 1.1 and 3.0 Years for Rural, Unregulated Streams in WV

0320
7400
VA
37.2
2082
.100
19.8
119
6.3
1,70
095
40.5
2.78
20.5
29.2
- -
- -
0320
7500
VA
37.3
0082
.130
235
36.6
23.5
2,04
092
41.6
2.71
21.8
27.6
- -
- -
0320
7800
VA
37.3
5082
.200
297
26.5
31.8
2,00
090
43.5
2.60
22.2
26.6
- -
- -
0320
7962
KY
37.4
4982
.338
.82
510
1.46
- -
8244
2.8
2228
- -
- -
0320
8000
KY
37.4
1682
.421
392
16.9
52.7
1,90
0-
-44
2.8
2228
- -
- -
0320
8500
VA
37.2
1082
.300
286
19.3
23.5
2,12
097
42.6
2.82
19.2
28.7
- -
- -
0320
8950
VA
37.1
2082
.440
66.5
42.5
17.0
2,09
095
46.0
2.84
19.6
28.0
- -
- -
0320
9000
VA
37.2
3082
.340
221
10.2
41.3
2,00
092
46.9
2.82
19.3
27.6
- -
- -
0320
9575
KY
37.3
1182
.816
3.17
181
2.59
- -
- -
422.
822
28-
--
-03
2100
00K
Y37
.567
82.4
5856
.324
.321
.51,
400
8244
2.8
2228
- -
- -
0321
1500
KY
37.7
4482
.724
206
6.4
55.1
1,20
082
442.
822
28-
--
-03
2120
00K
Y37
.835
82.8
7110
38.
321
.01,
000
7945
2.8
2028
- -
- -
0321
2750
WV
37.4
4181
.600
174
24.5
23.9
2,12
075
432.
840
269.
780.
349
0321
2980
WV
37.3
9581
.803
209
24.1
39.3
2,07
085
432.
835
2725
.1.4
3903
2130
00W
V37
.486
81.8
4450
416
.849
.22,
030
9043
2.8
3227
4.98
.470
0321
3500
WV
37.4
4581
.871
31.0
61.4
11.7
1,83
090
442.
826
2732
.2.6
5203
2137
00W
V37
.673
82.2
8093
610
.299
.61,
800
9043
2.8
2827
2.37
.436
0321
4000
WV
37.8
1882
.389
1,18
88.
5011
7.1
1,70
090
432.
826
281.
60.5
1203
2145
00W
V37
.837
82.4
091,
280
8.00
125.
61,
660
9043
2.8
2628
1.60
.531
0321
4900
WV
38.0
0682
.515
1,50
76.
5014
4.6
1,55
090
432.
824
281.
32.4
32
0321
5500
KY
38.1
4482
.685
217
3.5
40.1
800
7544
2.7
2028
- -
- -
0321
6500
KY
38.3
3082
.939
400
3.7
47.2
900
6844
2.8
2028
- -
- -
0321
6540
KY
38.2
3482
.709
12.2
18.3
8.73
- -
- -
412.
720
29-
--
-03
2165
63K
Y38
.364
82.7
96.9
485
.01.
57-
--
-42
- -
20-
--
--
-
Tab
le 2
. Bas
in-c
hara
cter
istic
s da
ta u
sed
in th
e re
gres
sion
ana
lysi
s to
dev
elop
low
-rec
urre
nce-
inte
rval
pea
k-di
scha
rge
estim
atin
g eq
uatio
ns fo
r ru
ral,
unre
gula
ted
stre
ams
in W
est V
irgin
ia—
Con
tinue
d [M
D, M
aryl
and;
OH
, Ohi
o; P
A, P
enns
ylva
nia;
VA
, Vir
gini
a; W
V, W
est V
irgi
nia;
--,
info
rmat
ion
not a
vaila
ble]
Sta
tio
nN
o.
Sta
teL
atit
ud
e,in
dec
imal
d
egre
es
Lo
ng
itu
de,
in d
ecim
al
deg
rees
Bas
in c
har
acte
rist
ics
Dra
inag
e ar
ea,
in s
qu
are
mile
s
Mai
n
chan
nel
sl
op
e,in
fee
tp
er m
ile
Str
eam
le
ng
th,
in m
iles
Mea
n
bas
inel
evat
ion
,in
fee
t ab
ove
sea
leve
l
Fo
rest
ed
area
,in
per
-ce
nt
Mea
nan
nu
al
pre
cip
i-ta
tio
n,
in in
ches
Two
-yea
r24
-ho
ur
pre
cip
i-ta
tio
nin
ten
sity
,in
inch
es
Mea
n
ann
ual
sn
owfa
ll,in
inch
es
Mea
nm
inim
um
Ja
nu
ary
tem
-p
erat
ure
,in
deg
rees
Fa
hre
nh
eit
Lo
cal
stat
ion
sl
op
e,in
fee
t p
er m
ile
Str
eam
-fl
ow
vari
a-b
ility
ind
ex
Table 2 33

T
able
3. P
eak-
disc
harg
e st
atis
tics
from
the
freq
uenc
y an
alys
is o
f the
gag
ing
stat
ion’
s sy
stem
atic
and
his
toric
al r
ecor
d us
ed to
dev
elop
low
-rec
urre
nce-
inte
rval
pea
k-di
scha
rge
estim
atin
g eq
uatio
ns fo
r ru
ral,
unre
gula
ted
stre
ams
in W
est V
irgin
ia
[MD
, Mar
ylan
d; O
H, O
hio;
PA
, Pen
nsyl
vani
a; V
A, V
irgi
nia;
WV
, Wes
t Vir
gini
a; -
-, in
form
atio
n no
t ava
ilabl
e]
Sta
tio
nN
o.
Sta
te
Wat
er y
ears
b
ou
nd
ing
syst
emat
icp
eaks
Nu
mb
er o
f ye
ars
of
reco
rdN
um
ber
of
pea
ksS
kew
Tren
d a
nal
ysis
Sys
tem
atic
His
tori
cal
His
tori
cal
Hig
ho
utl
ier
Low
ou
tlie
rG
ener
al-
ized
Sys
tem
atic
Wei
gh
ted
Ken
dal
l’s
tau
Sig
nif
ican
cele
vel
0159
5000
MD
1955
–199
036
00
- -
- -
- -
0.40
00.
377
- -
- -
0159
5300
WV
1955
–198
227
731
10
0.34
8.3
551.
090
-0.2
390.
083
0159
5500
MD
1950
–199
041
00
- -
- -
- -
1.63
3.8
77-
--
-01
5960
00M
D19
24–1
950
2532
1-
--
--
-.3
78.4
34-
--
-01
5965
00M
D19
49–1
990
420
0-
--
--
-.6
10.5
11-
--
-
0159
7000
MD
1949
–198
133
00
- -
- -
- -
.925
.659
- -
- -
0159
8000
MD
1925
–195
024
00
- -
- -
- -
.723
.545
- -
- -
0159
9000
MD
1931
–199
060
00
- -
- -
- -
.492
.453
- -
- -
0159
9500
WV
1948
–196
921
00
00
.371
-.46
3-.
064
-.10
0.5
4601
6000
00M
D19
36–1
950
1527
1-
--
--
-.4
72.4
33-
--
-
0160
1500
MD
1930
–199
061
00
- -
- -
- -
.983
.756
- -
- -
0160
3000
MD
1930
–198
152
102
2-
--
--
-.8
23.7
56-
--
-01
6045
00W
V19
39–1
997
590
00
0.3
83-.
264
-.09
8-.
196
.028
0160
5500
WV
1936
–199
751
120
01
0.4
19.6
04.4
36.1
29.1
8501
6057
00W
V19
65–1
977
130
00
0.4
04.3
60.3
85.4
61.0
33
0160
6000
WV
1940
–198
041
120
21
0.3
89.4
66.7
77.1
63.1
3501
6065
00W
V19
24–1
997
7012
01
30
.396
.961
.703
.063
.447
0160
6800
WV
1965
–197
713
00
00
.415
.305
.367
.308
.161
0160
7500
WV
1944
–199
754
120
22
0.4
33.7
77.6
78-.
117
.213
0160
8000
WV
1924
–199
768
120
01
0.4
23.8
98.6
40-.
054
.512
0160
8100
WV
1965
–197
713
00
00
.419
-.35
8.0
84.1
53.0
1701
6085
00W
V19
00–1
997
7412
01
30
.398
.667
.533
.091
.253
0160
9000
MD
1928
–198
122
00
- -
- -
- -
.165
.265
- -
- -
0160
9500
MD
1948
–197
625
00
- -
- -
- -
-.76
0.5
83-
--
-01
6098
00W
V19
67–1
977
110
00
0.4
06.3
28.3
75.3
09.2
13
0161
0000
MD
1936
–198
143
101
1-
--
--
--.
413
.010
- -
- -
0161
0150
MD
1965
–198
318
00
- -
- -
- -
-.09
1.1
41-
--
-01
6101
55M
D19
68–1
977
100
0-
--
--
-.1
01.2
83-
--
-01
6105
00W
V19
36–1
951
1467
0a 1
0.4
46.0
49.1
15-.
142
.511
0161
1500
WV
1923
–199
774
109
11
0.4
11-.
074
-.01
9.0
41.6
04
34 Estimating Annual Peak Discharges with Recurrence Intervals Between 1.1 and 3.0 Years for Rural, Unregulated Streams in WV

0161
2500
MD
1948
–196
417
00
- -
- -
- -
0.19
60.
298
- -
- -
0161
3000
MD
1929
–199
463
00
- -
- -
- -
.502
.475
- -
- -
0161
3150
MD
1965
–198
622
00
- -
- -
- -
.244
.319
- -
- -
0161
3160
MD
1965
–197
612
00
- -
- -
- -
.643
.504
- -
- -
0161
3900
VA
1961
–199
131
00
- -
- -
- -
- -
- -
- -
- -
0161
4000
WV
1929
–199
746
00
01
0.44
5-.
531
.467
0.04
30.
683
0161
5000
VA
1944
–199
148
00
- -
- -
- -
- -
- -
- -
- -
0161
6000
VA
1950
–199
124
00
- -
- -
- -
- -
- -
- -
- -
0161
6500
WV
1948
–199
750
621
10
.470
.176
.244
.300
.002
0161
7000
WV
1949
–197
724
00
01
.459
-1.0
46.3
34.1
97.1
75
0161
7800
MD
1964
–199
027
00
- -
- -
- -
.584
.538
- -
- -
0161
8000
MD
1929
–199
062
00
- -
- -
- -
.288
.349
- -
- -
0161
9475
MD
1966
–197
611
00
- -
- -
- -
.628
.553
- -
- -
0161
9500
MD
1928
–199
063
00
- -
- -
- -
.323
.367
- -
- -
0162
0500
VA
1947
–199
145
00
- -
- -
- -
- -
- -
- -
- -
0162
1000
VA
- -
- -
55-
--
--
--
--
--
--
--
-01
6212
00V
A19
49–1
976
270
0-
--
--
--
--
--
--
-01
6214
00V
A-
--
-40
- -
- -
- -
- -
- -
- -
- -
- -
0162
1450
VA
- -
- -
25-
--
--
--
--
--
--
--
-01
6220
00V
A-
--
-13
0-
--
--
--
--
--
--
--
-
0162
2100
VA
1966
–197
510
00
- -
- -
- -
- -
- -
- -
- -
0162
2300
VA
1967
–197
610
00
- -
- -
- -
- -
- -
- -
- -
0162
2400
VA
1967
–199
121
00
- -
- -
- -
- -
- -
- -
- -
0163
2000
VA
- -
- -
155
- -
- -
- -
- -
- -
- -
- -
- -
0163
2300
VA
1950
–197
724
00
- -
- -
- -
- -
- -
- -
- -
0163
2900
VA
1961
–199
130
00
- -
- -
- -
- -
- -
- -
- -
0163
2950
VA
1966
–197
510
00
- -
- -
- -
- -
- -
- -
- -
0163
2970
VA
1972
–199
119
00
- -
- -
- -
- -
- -
- -
- -
0163
3000
VA
- -
- -
155
- -
- -
- -
- -
- -
- -
- -
- -
0163
3500
VA
- -
- -
63-
--
--
--
--
--
--
--
-
Tab
le 3
. Pea
k-di
scha
rge
stat
istic
s fr
om th
e fr
eque
ncy
anal
ysis
of t
he g
agin
g st
atio
n’s
syst
emat
ic a
nd h
isto
rical
rec
ord
used
to d
evel
op lo
w-r
ecur
renc
e-in
terv
al p
eak-
disc
harg
e es
timat
ing
equa
tions
for
rura
l, un
regu
late
d st
ream
s in
Wes
t Virg
inia
—C
ontin
ued
[MD
, Mar
ylan
d; O
H, O
hio;
PA
, Pen
nsyl
vani
a; V
A, V
irgi
nia;
WV
, Wes
t Vir
gini
a; -
-, in
form
atio
n no
t ava
ilabl
e]
Sta
tio
nN
o.
Sta
te
Wat
er y
ears
b
ou
nd
ing
syst
emat
icp
eaks
Nu
mb
er o
f ye
ars
of
reco
rdN
um
ber
of
pea
ksS
kew
Tren
d a
nal
ysis
Sys
tem
atic
His
tori
cal
His
tori
cal
Hig
ho
utl
ier
Low
ou
tlie
rG
ener
al-
ized
Sys
tem
atic
Wei
gh
ted
Ken
dal
l’s
tau
Sig
nif
ican
cele
vel
Table 3 35

0163
3650
VA
1971
–199
121
00
- -
- -
- -
- -
- -
- -
- -
0163
4000
VA
- -
- -
120
- -
- -
- -
- -
- -
- -
- -
- -
0163
4500
VA
1936
–199
155
00
- -
- -
- -
- -
- -
- -
- -
0163
6500
WV
1896
–199
780
128
24
00.
515
0.14
60.
134
0.03
30.
662
0163
7000
MD
1948
–197
730
00
- -
- -
- -
.355
.422
- -
- -
0163
7500
MD
1948
–199
043
00
- -
- -
- -
.664
.615
- -
- -
0163
8480
VA
- -
- -
40-
--
--
--
--
--
--
--
-01
6385
00M
D18
95–1
990
9610
21
- -
- -
- -
.187
.326
- -
- -
0164
3700
VA
- -
- -
100
- -
- -
- -
- -
- -
- -
- -
- -
0164
4000
VA
1889
–199
165
00
- -
- -
- -
- -
- -
- -
- -
0164
4100
VA
- -
- -
25-
--
--
--
--
--
--
--
-02
0095
00V
A19
66–1
975
100
0-
--
--
--
--
--
--
-02
0114
00V
A-
--
-75
- -
- -
- -
- -
- -
- -
- -
- -
0201
1460
VA
- -
- -
75-
--
--
--
--
--
--
--
-02
0114
80V
A19
74–1
984
110
0-
--
--
--
--
--
--
-
0201
1500
VA
- -
- -
75-
--
--
--
--
--
--
--
-02
0125
00V
A-
--
-75
- -
- -
- -
- -
- -
- -
- -
- -
0201
2950
VA
- -
- -
25-
--
--
--
--
--
--
--
-02
0130
00V
A-
--
-75
- -
- -
- -
- -
- -
- -
- -
- -
0201
4000
VA
- -
- -
122
- -
- -
- -
- -
- -
- -
- -
- -
0305
0000
WV
1916
–199
770
110
10
0.3
20.3
34.4
36.1
30.1
1303
0505
00W
V19
45–1
997
5311
00
10
.306
.715
.469
.104
.275
0305
0650
WV
1964
–197
714
00
00
.306
-.09
4.1
20-.
274
.189
0305
1000
WV
1908
–199
790
110
12
0.2
84.2
89.2
69.0
27.7
0903
0515
00W
V19
16–1
942
2711
02
00
.276
.176
.251
.157
.260
0305
2000
WV
1943
–199
746
110
10
0.2
65.2
27.2
76.1
66.1
0503
0523
40W
V19
66–1
975
100
01
0.2
46.7
88.4
40-.
222
.418
0305
2500
WV
1947
–199
751
00
00
.265
.402
.361
.121
.211
0305
3500
WV
1908
–199
783
00
00
.257
-.34
9-.
219
-.00
2.9
7803
0545
00W
V19
41–1
997
5711
00
b 10
.251
.352
.261
.143
.118
Tab
le 3
. Pea
k-di
scha
rge
stat
istic
s fr
om th
e fr
eque
ncy
anal
ysis
of t
he g
agin
g st
atio
n’s
syst
emat
ic a
nd h
isto
rical
rec
ord
used
to d
evel
op lo
w-r
ecur
renc
e-in
terv
al p
eak-
disc
harg
e es
timat
ing
equa
tions
for
rura
l, un
regu
late
d st
ream
s in
Wes
t Virg
inia
—C
ontin
ued
[MD
, Mar
ylan
d; O
H, O
hio;
PA
, Pen
nsyl
vani
a; V
A, V
irgi
nia;
WV
, Wes
t Vir
gini
a; -
-, in
form
atio
n no
t ava
ilabl
e]
Sta
tio
nN
o.
Sta
te
Wat
er y
ears
b
ou
nd
ing
syst
emat
icp
eaks
Nu
mb
er o
f ye
ars
of
reco
rdN
um
ber
of
pea
ksS
kew
Tren
d a
nal
ysis
Sys
tem
atic
His
tori
cal
His
tori
cal
Hig
ho
utl
ier
Low
ou
tlie
rG
ener
al-
ized
Sys
tem
atic
Wei
gh
ted
Ken
dal
l’s
tau
Sig
nif
ican
cele
vel
36 Estimating Annual Peak Discharges with Recurrence Intervals Between 1.1 and 3.0 Years for Rural, Unregulated Streams in WV

0305
5020
WV
1966
–199
712
00
00
0.26
0-0
.516
-0.0
54-0
.091
0.73
003
0550
40W
V19
64–1
977
140
00
0.2
59.3
34.2
92-.
121
.584
0305
6250
WV
1985
–199
713
00
00
.227
.313
.265
-.05
1.8
5503
0565
00W
V19
08–1
938
310
00
0.2
19.2
51.2
39-.
026
.852
0305
6600
WV
1965
–197
713
00
00
.225
-.28
0.0
05.0
77.7
60
0305
7300
WV
1985
–199
713
00
00
.238
-.01
3.1
25.2
05.3
6003
0575
00W
V19
46–1
985
400
00
0.2
26-.
295
-.12
3-.
072
.521
0305
8000
WV
1947
–198
943
102
01
0.2
18.3
37.1
62-.
128
.229
0305
8500
WV
1916
–198
974
102
0c 1
0.2
05-.
085
-.07
4-.
123
.124
0305
9000
WV
1924
–198
360
102
10
0.1
91-.
488
-.28
6-.
016
.858
0305
9500
WV
1944
–197
027
00
00
.206
-.06
2.0
41-.
078
.588
0306
0500
WV
1952
–196
918
00
00
.165
-.34
7-.
091
.013
.970
0306
1000
WV
1908
–198
965
102
0d 1
0.1
78-.
183
-.14
0-.
002
.986
0306
1500
WV
1916
–199
773
901
00
.178
-.17
8-.
041
-.02
4.7
6803
0624
00W
V19
66–1
997
320
01
0.1
90.8
54.5
62-.
123
.330
0306
2500
WV
1947
–199
730
511
00
.187
.324
.368
-.17
2.1
8703
0639
50W
V19
65–1
977
120
01
0.3
511.
487
.674
.030
.945
0306
5000
WV
1941
–199
757
110
01
0.3
221.
310
.859
.167
.068
0306
6000
WV
1922
–199
776
110
01
0.3
37.7
46.5
96.1
81.0
2103
0686
10W
V19
74–1
997
150
00
0.3
34-.
032
.157
.162
.428
0306
9000
WV
1911
–199
672
110
21
0.3
11.9
92.7
21.0
64.4
2803
0695
00W
V19
14–1
997
8415
42
40
.307
1.14
4.7
91.1
34.0
7103
0698
50W
V19
66–1
977
120
01
0.2
80.6
09.4
12-.
030
.945
0306
9880
WV
1968
–199
714
301
00
.279
-.46
4.6
42-.
253
.227
0307
0000
WV
1921
–199
674
154
22
0.2
76.7
96.5
27.1
78.0
24
0307
0500
WV
1910
–199
783
110
10
0.2
30.6
92.7
11-.
066
.376
0307
1000
WV
1903
–195
847
142
10
0.2
91.1
30.2
10-.
004
.978
0307
1500
WV
1903
–192
616
142
10
0.1
96-.
284
-.09
1.0
17.9
6403
0720
00PA
1941
–197
535
00
- -
- -
- -
-.27
7.0
93-
--
-03
0725
90PA
1964
–197
815
00
- -
- -
- -
.132
.161
- -
- -
Tab
le 3
. Pea
k-di
scha
rge
stat
istic
s fr
om th
e fr
eque
ncy
anal
ysis
of t
he g
agin
g st
atio
n’s
syst
emat
ic a
nd h
isto
rical
rec
ord
used
to d
evel
op lo
w-r
ecur
renc
e-in
terv
al p
eak-
disc
harg
e es
timat
ing
equa
tions
for
rura
l, un
regu
late
d st
ream
s in
Wes
t Virg
inia
—C
ontin
ued
[MD
, Mar
ylan
d; O
H, O
hio;
PA
, Pen
nsyl
vani
a; V
A, V
irgi
nia;
WV
, Wes
t Vir
gini
a; -
-, in
form
atio
n no
t ava
ilabl
e]
Sta
tio
nN
o.
Sta
te
Wat
er y
ears
b
ou
nd
ing
syst
emat
icp
eaks
Nu
mb
er o
f ye
ars
of
reco
rdN
um
ber
of
pea
ksS
kew
Tren
d a
nal
ysis
Sys
tem
atic
His
tori
cal
His
tori
cal
Hig
ho
utl
ier
Low
ou
tlie
rG
ener
al-
ized
Sys
tem
atic
Wei
gh
ted
Ken
dal
l’s
tau
Sig
nif
ican
cele
vel
Table 3 37

0307
5450
MD
1965
–197
612
00
- -
- -
- -
-1.0
24-0
.164
- -
- -
0307
5500
MD
1942
–199
049
00
- -
- -
- -
.095
.151
- -
- -
0307
5600
MD
1965
–198
622
00
- -
- -
- -
.599
.452
- -
- -
0307
6505
MD
1965
–197
612
00
- -
- -
- -
-.47
5-.
034
- -
- -
0307
6600
MD
1965
–199
026
00
- -
- -
- -
.214
.239
- -
- -
0310
8000
PA19
16–1
975
500
0-
--
--
--.
216
-.07
2-
--
-03
1090
00O
H19
47–1
981
350
0-
--
--
-.4
41.2
56-
--
-03
1095
00O
H19
16–1
987
720
0-
--
--
-.2
14.1
62-
--
-03
1100
00O
H19
41–1
987
470
0-
--
--
-.2
96.2
00-
--
-03
1109
80O
H19
78–1
987
100
0-
--
--
--.
105
-.04
8-
--
-
0311
1150
PA19
61–1
975
150
0-
--
--
--.
135
.050
- -
- -
0311
1450
OH
1978
–198
710
00
- -
- -
- -
-.03
1-.
019
- -
- -
0311
1455
OH
1978
–198
710
00
- -
- -
- -
-.76
9-.
284
- -
- -
0311
1470
OH
1978
–198
710
00
- -
- -
- -
.400
.142
- -
- -
0311
1490
OH
1978
–198
710
00
- -
- -
- -
1.56
8.3
24-
--
-
0311
1500
OH
1942
–198
746
00
----
---.
735
-.26
1--
--03
1115
40O
H19
78–1
987
100
0--
----
-.11
8-.
047
----
0311
2000
WV
1941
–198
646
00
00
0.03
6-.
031
-.01
3-0
.014
0.90
203
1137
00W
V19
70–1
996
120
00
0.0
42-.
143
-.03
7-.
182
.451
0311
4000
OH
1927
–198
738
00
- -
- -
- -
.061
.049
- -
- -
0311
4240
OH
1978
–198
710
00
- -
- -
- -
-.25
4-.
080
- -
- -
0311
4500
WV
1916
–199
778
123
10
0.0
79.1
57.1
99.0
95.2
1903
1145
50W
V19
66–1
977
120
00
0.0
71-.
547
-.17
9.2
12.3
7303
1146
00W
V19
67–1
977
110
00
0.0
73-.
362
-.10
0-.
018
1.00
003
1146
50W
V19
69–1
997
130
00
0.0
76.0
05.0
44.2
56.2
46
0311
5280
OH
1978
–198
710
00
- -
- -
- -
1.25
7.4
04-
--
-03
1154
00O
H19
59–1
981
2375
01
- -
- -
.188
-.20
4-
--
-03
1154
10O
H19
78–1
987
100
0-
--
--
--.
667
-.21
6-
--
-03
1155
10O
H19
78–1
987
100
0-
--
--
-.9
37.3
48-
--
-03
1156
00O
H19
47–1
979
330
0-
--
--
-.1
21.0
76-
--
-
Tab
le 3
. Pea
k-di
scha
rge
stat
istic
s fr
om th
e fr
eque
ncy
anal
ysis
of t
he g
agin
g st
atio
n’s
syst
emat
ic a
nd h
isto
rical
rec
ord
used
to d
evel
op lo
w-r
ecur
renc
e-in
terv
al p
eak-
disc
harg
e es
timat
ing
equa
tions
for
rura
l, un
regu
late
d st
ream
s in
Wes
t Virg
inia
—C
ontin
ued
[MD
, Mar
ylan
d; O
H, O
hio;
PA
, Pen
nsyl
vani
a; V
A, V
irgi
nia;
WV
, Wes
t Vir
gini
a; -
-, in
form
atio
n no
t ava
ilabl
e]
Sta
tio
nN
o.
Sta
te
Wat
er y
ears
b
ou
nd
ing
syst
emat
icp
eaks
Nu
mb
er o
f ye
ars
of
reco
rdN
um
ber
of
pea
ksS
kew
Tren
d a
nal
ysis
Sys
tem
atic
His
tori
cal
His
tori
cal
Hig
ho
utl
ier
Low
ou
tlie
rG
ener
al-
ized
Sys
tem
atic
Wei
gh
ted
Ken
dal
l’s
tau
Sig
nif
ican
cele
vel
38 Estimating Annual Peak Discharges with Recurrence Intervals Between 1.1 and 3.0 Years for Rural, Unregulated Streams in WV

0311
5710
OH
1978
–198
710
00
- -
- -
- -
1.18
00.
361
- -
- -
0315
0600
OH
1966
–198
015
00
- -
- -
- -
.567
.264
- -
- -
0315
1400
WV
1975
–199
721
800
e 10
0.24
7.5
21.2
730.
247
0.12
403
1515
00W
V19
39–1
973
3579
10
0.2
27-.
427
-.22
4.0
45.7
1203
1520
00W
V19
29–1
978
500
00
0.1
81-.
008
.040
-.05
0.6
16
0315
2200
WV
1970
–199
712
00
00
.171
-.15
3.0
33.1
51.5
3703
1525
00W
V19
38–1
951
140
00
0.1
73-.
597
-.15
8.4
61.0
2503
1530
00W
V19
39–1
975
370
00
1.1
66-.
878
-.20
7.0
87.4
5603
1535
00W
V19
29–1
978
500
00
0.1
47-.
354
-.20
5.0
38.7
0703
1540
00W
V19
29–1
997
630
00
0.1
41-.
200
-.11
9-.
124
.151
0315
4250
WV
1970
–199
712
00
00
.127
.044
.091
.182
.451
0315
4500
WV
1952
–197
827
00
00
.098
-.59
6-.
290
.168
.227
0315
5000
WV
1939
–197
840
00
01
.084
-.73
8-.
134
.024
.834
0315
5200
WV
1938
–195
114
00
00
.111
-.54
8-.
175
.330
.111
0315
5450
WV
1965
–199
716
00
00
.099
-.33
1-.
106
.117
.558
0315
5500
WV
1930
–199
759
00
00
.092
-.09
2-.
049
-.04
3.6
3803
1595
40O
H19
66–1
987
220
0-
--
--
-.9
82.4
63-
--
-03
1597
00W
V19
65–1
977
130
01
0.0
881.
189
.465
-.14
1.5
4103
1715
00V
A-
--
-15
0-
--
--
--
--
--
--
--
-03
1730
00V
A-
--
-11
5-
--
--
--
--
--
--
--
-
0317
5500
VA
1909
–199
162
00
- -
- -
- -
- -
- -
- -
- -
0317
6500
VA
- -
- -
150
- -
- -
- -
- -
- -
- -
- -
- -
0317
7000
WV
1942
–195
110
00
00
.381
-.40
8.0
85.1
56.5
8803
1775
00W
V19
42–1
951
100
00
1.3
66-1
.599
-.08
1.1
78.5
3003
1777
00V
A19
66–1
980
150
0--
----
----
----
0317
8500
WV
1947
–199
728
51
0f 1
0.3
35-.
122
-.05
8-.
020
.895
0317
9000
WV
1951
–199
747
00
02
.344
-1.0
00.0
35.0
92.3
6903
1795
00W
V19
09–1
948
270
00
0.3
45-.
191
.022
.217
.118
0318
0000
WV
1924
–194
825
711
10
.347
1.21
8.8
00.1
00.4
9803
1803
50W
V19
66–1
977
120
00
0.3
57.3
91.3
71.1
67.4
92
Tab
le 3
. Pea
k-di
scha
rge
stat
istic
s fr
om th
e fr
eque
ncy
anal
ysis
of t
he g
agin
g st
atio
n’s
syst
emat
ic a
nd h
isto
rical
rec
ord
used
to d
evel
op lo
w-r
ecur
renc
e-in
terv
al p
eak-
disc
harg
e es
timat
ing
equa
tions
for
rura
l, un
regu
late
d st
ream
s in
Wes
t Virg
inia
—C
ontin
ued
[MD
, Mar
ylan
d; O
H, O
hio;
PA
, Pen
nsyl
vani
a; V
A, V
irgi
nia;
WV
, Wes
t Vir
gini
a; -
-, in
form
atio
n no
t ava
ilabl
e]
Sta
tio
nN
o.
Sta
te
Wat
er y
ears
b
ou
nd
ing
syst
emat
icp
eaks
Nu
mb
er o
f ye
ars
of
reco
rdN
um
ber
of
pea
ksS
kew
Tren
d a
nal
ysis
Sys
tem
atic
His
tori
cal
His
tori
cal
Hig
ho
utl
ier
Low
ou
tlie
rG
ener
al-
ized
Sys
tem
atic
Wei
gh
ted
Ken
dal
l’s
tau
Sig
nif
ican
cele
vel
Table 3 39

0318
0500
WV
1944
–199
754
102
02
00.
359
1.62
40.
972
0.18
80.
046
0318
0530
WV
1966
–197
711
00
00
.370
-.15
5.1
57.2
36.3
5003
1806
80W
V19
65–1
977
130
00
0.3
78-.
134
.151
.205
.360
0318
1900
WV
1965
–197
713
00
01
.376
-.76
8.0
86-.
167
.459
0318
2000
WV
1946
–199
718
801
10
.367
1.49
9.9
01.1
24.4
95
0318
2500
WV
1930
–199
768
102
01
0.3
64.6
09.4
73.1
44.0
8403
1827
00W
V19
72–1
982
1180
10
0.3
81.7
75.6
54-.
309
.213
0318
3000
WV
1946
–199
729
00
00
.388
.107
.212
.121
.367
0318
3500
WV
1896
–199
710
20
00
0.3
64-.
223
-.12
2-.
014
.842
0318
3550
WV
1966
–197
712
00
01
.356
-1.1
36-.
089
.136
.582
0318
3570
WV
1966
–197
712
00
00
.361
.436
.392
.076
.783
0318
4000
WV
1936
–199
762
00
00
.356
.139
.190
.103
.241
0318
4500
WV
1937
–194
812
410
10
.344
.602
.041
.000
1.00
003
1850
00W
V19
52–1
982
310
00
0.3
05.3
40.3
26-.
075
.563
0318
5020
WV
1966
–197
712
00
00
.316
-.70
3-.
086
.167
.492
0318
5500
WV
1929
–194
820
00
00
.293
-.16
7.0
45-.
032
.871
0318
6000
WV
1896
–194
835
711
00
.281
-.43
4-.
128
-.04
0.7
4403
1865
00W
V19
30–1
997
680
00
0.3
01.5
22.4
63.0
58.4
8503
1870
00W
V19
30–1
997
660
00
0.2
89.2
27.2
41-.
008
.925
0318
7300
WV
1969
–199
718
00
00
.334
.637
.478
.241
.173
0318
7500
WV
1945
–199
739
661
00
.307
.436
.411
.096
.397
0318
9000
WV
1930
–198
243
710
10
.310
1.07
7.7
69.1
71.1
0903
1891
00W
V19
65–1
997
3166
21
0.2
95-.
035
.047
-.01
9.8
9203
1895
00W
V19
29–1
965
370
01
0.2
79.9
12.6
41-.
117
.314
0318
9650
WV
1966
–197
712
00
00
.287
-.51
9-.
039
.000
1.00
0
0319
0000
WV
1909
–197
151
00
00
.296
.029
.097
.073
.455
0319
0400
WV
1967
–199
729
00
00
.277
-.02
8.0
83.1
13.3
9803
1905
00W
V19
66–1
976
110
00
0.2
73-.
731
-.10
6.2
91.2
4103
1914
00W
V19
66–1
997
1652
0g 1
0.2
62.3
84.1
09.2
83.1
3703
1915
00W
V19
46–1
997
3152
0h 1
0.2
58.4
00.2
87-.
071
.586
Tab
le 3
. Pea
k-di
scha
rge
stat
istic
s fr
om th
e fr
eque
ncy
anal
ysis
of t
he g
agin
g st
atio
n’s
syst
emat
ic a
nd h
isto
rical
rec
ord
used
to d
evel
op lo
w-r
ecur
renc
e-in
terv
al p
eak-
disc
harg
e es
timat
ing
equa
tions
for
rura
l, un
regu
late
d st
ream
s in
Wes
t Virg
inia
—C
ontin
ued
[MD
, Mar
ylan
d; O
H, O
hio;
PA
, Pen
nsyl
vani
a; V
A, V
irgi
nia;
WV
, Wes
t Vir
gini
a; -
-, in
form
atio
n no
t ava
ilabl
e]
Sta
tio
nN
o.
Sta
te
Wat
er y
ears
b
ou
nd
ing
syst
emat
icp
eaks
Nu
mb
er o
f ye
ars
of
reco
rdN
um
ber
of
pea
ksS
kew
Tren
d a
nal
ysis
Sys
tem
atic
His
tori
cal
His
tori
cal
Hig
ho
utl
ier
Low
ou
tlie
rG
ener
al-
ized
Sys
tem
atic
Wei
gh
ted
Ken
dal
l’s
tau
Sig
nif
ican
cele
vel
40 Estimating Annual Peak Discharges with Recurrence Intervals Between 1.1 and 3.0 Years for Rural, Unregulated Streams in WV

0319
2000
WV
1929
–196
436
551
00
0.24
20.
444
0.45
1-0
.081
0.49
603
1925
00W
V19
09–1
930
1456
21
0.2
42.4
10.0
30.3
41.0
9803
1930
00W
V18
78–1
948
710
00
0.2
53-.
075
-.00
8-.
108
.183
0319
3725
WV
1966
–197
712
00
01
.269
-.47
8.3
50.2
42.3
0103
1947
00W
V19
30–1
997
6610
20
10
.270
.769
.615
.107
.205
0319
5000
WV
1935
–196
329
00
00
.260
-.04
3.0
68.1
21.3
6703
1951
00W
V19
75–1
987
100
01
0.2
681.
062
.526
.022
1.00
003
1952
50W
V19
75–1
997
200
00
0.2
65.5
60.4
13.3
37.0
4103
1955
00W
V19
39–1
960
220
00
0.2
35-.
127
.031
.056
.735
0319
5600
WV
1966
–199
716
00
00
.233
.271
.251
.200
.300
0319
7000
WV
1929
–196
032
430
10
.191
.654
.451
-.18
1.1
4903
1971
50W
V19
66–1
977
120
00
1.1
74-1
.608
.044
-.15
2.5
3703
1979
00W
V19
64–1
975
120
00
0.1
79.3
26.2
40.0
30.9
4503
1984
50W
V19
65–1
997
170
00
0.1
96.9
49.5
19.1
47.4
3403
1985
00W
V19
09–1
997
750
00
0.1
84.1
24.1
36.0
59.4
53
0319
8780
WV
1966
–197
712
00
00
.201
-.08
7.0
77-.
152
.537
0319
8800
WV
1963
–197
714
00
00
.195
-.40
8-.
072
-.02
2.9
5603
1990
00W
V19
31–1
984
540
00
0.1
86-.
028
.024
-.02
0.8
3503
1994
00W
V19
75–1
984
100
00
0.1
71.7
28.3
72.0
67.8
5803
2005
00W
V19
09–1
997
420
00
0.1
40-.
471
-.26
2-.
082
.448
0320
0600
WV
1966
–197
712
00
01
.118
-.54
1.1
73.2
58.2
7103
2010
00W
V19
09–1
997
520
00
0.1
35-.
223
-.12
5-.
038
.693
0320
1410
WV
1967
–199
718
00
00
.108
-.06
0.0
20-.
203
.256
0320
1420
WV
1965
–197
713
00
01
.103
-1.3
07-.
270
-.34
6.1
1203
2014
40W
V19
65–1
977
130
00
0.0
58.9
95.4
02-.
026
.951
0320
1480
WV
1965
–197
713
00
00
.019
-.76
8-.
300
-.43
6.0
4403
2020
00O
H19
16–1
985
680
0-
--
--
-.3
14.2
35-
--
-03
2024
00W
V19
69–1
997
290
00
0.2
65-.
156
.003
-.15
0.2
6003
2024
80W
V19
70–1
997
120
00
0.2
68.0
86.1
90-.
061
.837
0320
2750
WV
1975
–199
723
00
01
.255
-1.1
11.2
06-.
107
.492
Tab
le 3
. Pea
k-di
scha
rge
stat
istic
s fr
om th
e fr
eque
ncy
anal
ysis
of t
he g
agin
g st
atio
n’s
syst
emat
ic a
nd h
isto
rical
rec
ord
used
to d
evel
op lo
w-r
ecur
renc
e-in
terv
al p
eak-
disc
harg
e es
timat
ing
equa
tions
for
rura
l, un
regu
late
d st
ream
s in
Wes
t Virg
inia
—C
ontin
ued
[MD
, Mar
ylan
d; O
H, O
hio;
PA
, Pen
nsyl
vani
a; V
A, V
irgi
nia;
WV
, Wes
t Vir
gini
a; -
-, in
form
atio
n no
t ava
ilabl
e]
Sta
tio
nN
o.
Sta
te
Wat
er y
ears
b
ou
nd
ing
syst
emat
icp
eaks
Nu
mb
er o
f ye
ars
of
reco
rdN
um
ber
of
pea
ksS
kew
Tren
d a
nal
ysis
Sys
tem
atic
His
tori
cal
His
tori
cal
Hig
ho
utl
ier
Low
ou
tlie
rG
ener
al-
ized
Sys
tem
atic
Wei
gh
ted
Ken
dal
l’s
tau
Sig
nif
ican
cele
vel
Table 3 41

0320
3000
WV
1929
–197
951
00
00
0.22
3-0
.413
-0.2
220.
064
0.51
603
2036
00W
V19
61–1
979
190
00
0.2
00-.
641
-.20
8.0
94.6
0003
2040
00W
V19
16–1
979
5873
11
0.1
07-.
637
-.43
0.0
65.4
7703
2045
00W
V19
38–1
980
4370
12
0.0
93.4
62.3
45.0
78.4
7003
2059
95O
H19
78–1
987
100
0-
--
--
-.7
45.2
88-
--
-
0320
6600
WV
1965
–199
733
00
01
.124
-.15
6.2
82.1
82.1
4103
2068
00W
V19
62–1
971
1059
11
0.0
88.7
34.2
48-.
156
.591
0320
7000
WV
1916
–196
631
591
00
.068
-.13
8.0
12-.
138
.284
0320
7020
WV
1916
–197
136
591
00
.066
-.18
5-.
010
-.10
8.3
6103
2074
00V
A-
--
-40
- -
- -
- -
- -
- -
- -
- -
- -
0320
7500
VA
1929
–199
142
00
- -
- -
- -
- -
- -
- -
- -
0320
7800
VA
- -
- -
63-
--
--
--
--
--
--
--
-03
2079
62K
Y19
75–1
984
100
0-
--
--
--.
442
-.04
8-
--
-03
2080
00K
Y19
38–1
968
3010
70
i 1--
---.
134
-.17
7--
--03
2085
00V
A19
27–1
991
650
0--
----
----
----
0320
8950
VA
--65
----
----
----
----
--03
2090
00V
A-
--
-75
- -
- -
- -
- -
- -
- -
- -
- -
0320
9575
KY
1976
–198
510
00
- -
- -
- -
1.46
0.4
78-
--
-03
2100
00K
Y19
38–1
985
460
0-
--
--
--.
541
-.30
8-
--
-03
2115
00K
Y19
38–1
949
1232
2-
--
--
--1
.027
-.13
0-
--
-
0321
2000
KY
1950
–198
132
00
- -
- -
- -
-.61
5-.
343
- -
- -
0321
2750
WV
1986
–199
712
00
01
.287
-.72
7.1
22.1
82.4
5103
2129
80W
V19
86–1
997
120
00
1.2
69-2
.111
-.13
5.2
73.2
4403
2130
00W
V19
31–1
986
560
00
0.2
55-.
276
-.13
4.0
62.5
0603
2135
00W
V19
47–1
985
390
00
0.2
56-.
353
-.14
5.1
62.1
50
Tab
le 3
. Pea
k-di
scha
rge
stat
istic
s fr
om th
e fr
eque
ncy
anal
ysis
of t
he g
agin
g st
atio
n’s
syst
emat
ic a
nd h
isto
rical
rec
ord
used
to d
evel
op lo
w-r
ecur
renc
e-in
terv
al p
eak-
disc
harg
e es
timat
ing
equa
tions
for
rura
l, un
regu
late
d st
ream
s in
Wes
t Virg
inia
—C
ontin
ued
[MD
, Mar
ylan
d; O
H, O
hio;
PA
, Pen
nsyl
vani
a; V
A, V
irgi
nia;
WV
, Wes
t Vir
gini
a; -
-, in
form
atio
n no
t ava
ilabl
e]
Sta
tio
nN
o.
Sta
te
Wat
er y
ears
b
ou
nd
ing
syst
emat
icp
eaks
Nu
mb
er o
f ye
ars
of
reco
rdN
um
ber
of
pea
ksS
kew
Tren
d a
nal
ysis
Sys
tem
atic
His
tori
cal
His
tori
cal
Hig
ho
utl
ier
Low
ou
tlie
rG
ener
al-
ized
Sys
tem
atic
Wei
gh
ted
Ken
dal
l’s
tau
Sig
nif
ican
cele
vel
42 Estimating Annual Peak Discharges with Recurrence Intervals Between 1.1 and 3.0 Years for Rural, Unregulated Streams in WV

a H
igh-
outli
er th
resh
old
was
set t
o 36
,000
cub
ic fe
et p
er se
cond
.b
Hig
h-ou
tlier
thre
shol
d w
as se
t to
60,0
00 c
ubic
feet
per
seco
nd.
c H
igh-
outli
er th
resh
old
was
set t
o 17
,000
cub
ic fe
et p
er se
cond
.d
Hig
h-ou
tlier
thre
shol
d w
as se
t to
41,0
00 c
ubic
feet
per
seco
nd.
e H
igh-
outli
er th
resh
old
was
set t
o 19
,000
cub
ic fe
et p
er se
cond
.f H
igh-
outli
er th
resh
old
was
set t
o 5,
600
cubi
c fe
et p
er se
cond
.g
Hig
h-ou
tlier
thre
shol
d w
as se
t to
1,90
0 cu
bic
feet
per
seco
nd.
h H
igh-
outli
er th
resh
old
was
set t
o 11
,000
cub
ic fe
et p
er se
cond
.i H
igh-
outli
er th
resh
old
was
set t
o 32
,000
cub
ic fe
et p
er se
cond
.j H
igh-
outli
er th
resh
old
was
set t
o 24
,000
cub
ic fe
et p
er se
cond
.
0321
3700
WV
1968
–199
730
00
01
0.16
9-0
.328
0.24
7-0
.060
0.65
603
2140
00W
V19
35–1
985
510
00
0.1
33.0
06.0
38.1
23.2
0503
2145
00W
V19
16–1
997
710
00
1.1
27-.
145
.126
-.01
2.8
8903
2149
00W
V19
77–1
995
120
00
0.0
87.2
04.1
36-.
182
.451
0321
5500
KY
1916
–198
452
00
- -
- -
- -
.140
.113
- -
- -
0321
6500
KY
1937
–196
730
840
j 1-
--
--.
523
.065
- -
- -
0321
6540
KY
1973
–198
513
00
- -
- -
- -
.726
.310
- -
- -
0321
6563
KY
1976
–198
510
00
- -
- -
- -
-1.1
44.1
81-
--
-
Tab
le 3
. Pea
k-di
scha
rge
stat
istic
s fr
om th
e fr
eque
ncy
anal
ysis
of t
he g
agin
g st
atio
n’s
syst
emat
ic a
nd h
isto
rical
rec
ord
used
to d
evel
op lo
w-r
ecur
renc
e-in
terv
al p
eak-
disc
harg
e es
timat
ing
equa
tions
for
rura
l, un
regu
late
d st
ream
s in
Wes
t Virg
inia
—C
ontin
ued
[MD
, Mar
ylan
d; O
H, O
hio;
PA
, Pen
nsyl
vani
a; V
A, V
irgi
nia;
WV
, Wes
t Vir
gini
a; -
-, in
form
atio
n no
t ava
ilabl
e]
Sta
tio
nN
o.
Sta
te
Wat
er y
ears
b
ou
nd
ing
syst
emat
icp
eaks
Nu
mb
er o
f ye
ars
of
reco
rdN
um
ber
of
pea
ksS
kew
Tren
d a
nal
ysis
Sys
tem
atic
His
tori
cal
His
tori
cal
Hig
ho
utl
ier
Low
ou
tlie
rG
ener
al-
ized
Sys
tem
atic
Wei
gh
ted
Ken
dal
l’s
tau
Sig
nif
ican
cele
vel
Table 3 43

Tab
le 4
. Mag
nitu
de a
nd fr
eque
ncy
of p
eak
disc
harg
es fo
r ga
ging
sta
tions
in W
est V
irgin
ia a
nd s
urro
undi
ng S
tate
s
Peak
dis
char
ges
for
the
indi
cate
d re
curr
ence
inte
rval
are
pre
sent
ed in
the
follo
win
g or
der:
fir
st li
ne (
S), f
rom
the
syst
emat
ic a
nd h
isto
rica
l rec
ord
on th
e ba
sis
of th
e gu
idel
ines
est
abli
shed
by
the
Wat
er
Res
ourc
es C
ounc
il; s
econ
d lin
e (R
), f
rom
the
regi
onal
ized
reg
ress
ion
equa
tion;
and
, thi
rd li
ne (
W),
fro
m w
eigh
ting
(1)
the
syst
emat
ic a
nd h
isto
rica
l rec
ord
on th
e ba
sis
of th
e gu
idel
ines
est
abli
shed
by
the
Sta
tio
nN
o.
Sta
tio
n n
ame
and
Sta
te R
egio
nE
sti-
mat
ety
pe
Pea
k d
isch
arg
e fo
r th
e in
dic
ated
rec
urr
ence
inte
rval
, in
cu
bic
fee
t p
er s
eco
nd
1.1-
year
1.2-
year
1.3-
year
1.4-
year
1.5-
year
1.6-
year
1.7-
year
1.8-
year
1.9-
year
2-ye
ar2.
5-ye
ar3-
year
0159
5000
Nor
th B
ranc
h Po
tom
ac
Riv
er a
t Ste
yer,
MD
Eas
t S
- -
- -
- -
- -
- -
- -
- -
- -
- -
3,32
0-
--
-
0159
5300
Abr
am C
reek
at O
akm
ont,
WV
Eas
t S
R W
800
724
797
882
871
881
944
981
946
998
1,07
01,
000
1,05
01,
160
1,05
0
1,09
01,
230
1,10
0
1,13
01,
300
1,14
0
1,17
01,
360
1,18
0
1,21
01,
420
1,22
0
1,24
01,
480
1,25
0
1,39
01,
720
1,41
0
1,49
01,
890
1,51
001
5955
00N
orth
Bra
nch
Poto
mac
R
iver
at K
itzm
iller
, MD
Eas
t S
-
--
--
--
--
--
--
--
--
-7,
470
- -
- -
0159
6000
Nor
th B
ranc
h Po
tom
ac
Riv
er a
t Blo
omin
gton
, M
D
Eas
t S
-
--
--
--
--
--
--
--
--
-8,
040
- -
- -
0159
6500
Sav
age
Riv
er n
ear
Bar
ton,
M
DE
ast
S
- -
- -
- -
- -
- -
- -
- -
- -
- -
1,46
0-
--
-
0159
7000
Cra
btre
e C
reek
nea
r
Swan
ton,
MD
Eas
t S
-
--
--
--
--
--
--
--
--
-48
4-
--
-
0159
8000
Sava
ge R
iver
at
Blo
omin
gton
, MD
Eas
t S
-
--
--
--
--
--
--
--
--
-3,
450
- -
- -
0159
9000
Geo
rges
Cre
ek a
t Fr
ankl
in, M
DE
ast
S
- -
- -
- -
- -
- -
- -
- -
- -
- -
1,86
0-
--
-
0159
9500
New
Cre
ek n
ear
Key
ser,
WV
Eas
t S
R W
405
779
421
526
937
547
620
1,06
064
4
699
1,16
072
7
769
1,25
079
9
832
1,33
086
5
889
1,40
092
5
943
1,47
098
0
992
1,53
01,
030
1,04
01,
590
1,08
0
1,24
01,
850
1,29
0
1,40
02,
040
1,46
001
6000
00N
orth
Bra
nch
Poto
mac
R
iver
at P
into
, MD
Eas
t S
-
--
--
--
--
--
--
--
--
-16
,100
- -
- -
0160
1500
Wil
ls C
reek
nea
r C
umbe
rlan
d, M
DE
ast
S
- -
- -
- -
- -
- -
- -
- -
- -
- -
5,93
0-
-- -
0160
3000
Nor
th B
ranc
h Po
tom
ac
Riv
er n
ear
Cum
berl
and,
M
D
Eas
t S
-
--
--
--
--
--
--
--
--
-17
,700
- -
- -
0160
4500
Patte
rson
Cre
ek n
ear
Hea
dsvi
lle, W
VE
ast
S
R W
1,52
02,
750
1,54
0
1,98
03,
310
2,01
0
2,34
03,
740
2,37
0
2,65
04,
100
2,68
0
2,91
04,
420
2,95
0
3,16
04,
710
3,20
0
3,38
04,
970
3,42
0
3,58
05,
220
3,63
0
3,77
05,
450
3,82
0
3,95
05,
670
4,00
0
4,71
06,
610
4,78
0
5,34
07,
300
5,42
001
6055
00So
uth
Bra
nch
Pot
omac
R
iver
at F
rank
lin,
WV
Eas
t S
R W
1,93
02,
400
1,94
0
2,40
02,
890
2,41
0
2,76
03,
260
2,77
0
3,07
03,
570
3,09
0
3,35
03,
850
3,37
0
3,61
04,
100
3,63
0
3,84
04,
330
3,86
0
4,07
04,
550
4,09
0
4,28
04,
750
4,30
0
4,48
04,
940
4,50
0
5,36
05,
750
5,38
0
6,02
06,
350
6,03
0
44 Estimating Annual Peak Discharges with Recurrence Intervals Between 1.1 and 3.0 Years for Rural, Unregulated Streams in WV

0160
5700
Ree
ds C
reek
Tri
buta
ry
near
Fra
nklin
, WV
Eas
t S R W
10.7
17.8
11.1
12.6
21.2
13.2
14.1
23.8
14.8
15.3
26.0
16.1
16.3
27.9
17.3
17.2
29.7
18.3
18.1
31.2
19.2
18.9
32.7
20.1
19.6
34.0
20.9
20.3
35.3
21.7
23.2
40.7
25.0
25.3
44.7
27.4
0160
6000
Nor
th F
ork
Sout
h B
ranc
h Po
tom
ac R
iver
at
Cab
ins,
WV
Eas
t S
R W
4,47
04,
040
4,46
0
5,19
04,
870
5,18
0
5,74
05,
500
5,74
0
6,22
06,
040
6,21
0
6,65
06,
510
6,64
0
7,03
06,
940
7,03
0
7,39
07,
330
7,39
0
7,73
07,
690
7,73
0
8,05
08,
040
8,05
0
8,34
08,
360
8,34
0
9,67
09,
760
9,67
0
10,6
0010
,800
10,6
00
0160
6500
Sout
h B
ranc
h P
otom
ac
Riv
er n
ear
Pet
ersb
urg,
W
V
Eas
t S
R W
6,40
07,
260
6,42
0
7,59
08,
760
7,61
0
8,51
09,
900
8,54
0
9,30
010
,900
9,34
0
10,0
0011
,700
10,1
00
10,7
0012
,500
10,7
00
11,3
0013
,200
11,3
00
11,9
0013
,900
11,9
00
12,4
0014
,500
12,5
00
12,9
0015
,100
13,0
00
15,2
0017
,600
15,2
00
16,8
0019
,500
16,8
0001
6068
00B
rush
y R
un n
ear
Pete
rsbu
rg, W
VE
ast
S
R W
13.8
42.0
15.1
18.1
50.2
19.9
21.7
56.4
23.9
24.8
61.6
27.3
27.7
66.2
30.5
30.4
70.3
33.5
32.9
74.0
36.2
35.3
77.5
38.9
37.5
80.8
41.3
39.7
83.8
43.7
49.6
96.8
54.4
57.3
106.
062
.7
0160
7500
Sou
th F
ork
Sou
th B
ranc
h Po
tom
ac R
iver
at
Bra
ndyw
ine,
WV
Eas
t S
R W
1,51
01,
510
1,51
0
1,86
01,
820
1,86
0
2,14
02,
050
2,14
0
2,38
02,
250
2,38
0
2,61
02,
420
2,61
0
2,82
02,
580
2,81
0
3,01
02,
720
3,01
0
3,20
02,
860
3,19
0
3,38
02,
980
3,37
0
3,55
03,
100
3,53
0
4,32
03,
610
4,29
0
4,88
03,
990
4,84
001
6080
00S
outh
For
k S
outh
Bra
nch
Poto
mac
Riv
er n
ear
Moo
refi
eld,
WV
Eas
t S
R W
2,80
03,
450
2,81
0
3,41
04,
160
3,43
0
3,88
04,
700
3,90
0
4,30
05,
150
4,32
0
4,67
05,
550
4,70
0
5,02
05,
920
5,04
0
5,34
06,
250
5,36
0
5,64
06,
560
5,67
0
5,93
06,
850
5,96
0
6,20
07,
120
6,23
0
7,43
08,
310
7,46
0
8,31
09,
180
8,34
0
0160
8100
Wil
liam
s H
ollo
w n
ear
Moo
refi
eld,
WV
Eas
t S
R W
30.2 8.2
27.5
34.0 9.8
30.6
36.6
11.1
32.8
38.6
12.1
34.5
40.4
13.0
36.0
41.9
13.8
37.2
43.2
14.5
38.4
44.4
15.1
39.4
45.4
15.8
40.3
46.4
16.3
41.1
50.5
18.8
44.6
53.4
20.6
47.2
0160
8500
Sout
h B
ranc
h P
otom
ac
Riv
er n
ear
Spri
ngfi
eld,
W
V
Eas
t S
R W
10,4
0014
,000
10,5
00
12,7
0016
,900
12,8
00
14,5
0019
,100
14,6
00
16,1
0021
,000
16,2
00
17,5
0022
,700
17,6
00
18,8
0024
,200
18,9
00
20,0
0025
,600
20,1
00
21,1
0026
,900
21,2
00
22,1
0028
,100
22,3
00
23,1
0029
,200
23,3
00
27,6
0034
,200
27,7
00
30,8
0037
,800
31,0
00
0160
9000
Tow
n C
reek
nea
r Old
tow
n,
MD
Eas
t S
- -
- -
- -
- -
- -
- -
- -
- -
- -
3,80
0-
--
-
0160
9500
Saw
pit R
un n
ear
Old
tow
n,
MD
Eas
t S
- -
- -
- -
- -
- -
- -
- -
- -
- -
262
- -
- -
0160
9800
Litt
le C
acap
on R
iver
nea
r L
evel
s, W
VE
ast
S
R W
2,03
01,
570
1,98
0
2,39
01,
890
2,32
0
2,66
02,
140
2,58
0
2,88
02,
340
2,79
0
3,07
02,
520
2,98
0
3,24
02,
690
3,15
0
3,40
02,
830
3,30
0
3,54
02,
980
3,44
0
3,67
03,
110
3,57
0
3,80
03,
230
3,69
0
4,33
03,
760
4,22
0
4,72
04,
150
4,60
0
0161
0000
Poto
mac
Riv
er a
t Paw
Pa
w, W
VE
ast1
S-
--
--
--
--
--
--
--
--
-44
,700
- -
- -
0161
0150
Bea
r C
reek
at F
ores
t Par
k,
MD
Eas
t S
- -
- -
- -
- -
- -
- -
- -
- -
- -
378
- -
- -
0161
0155
Side
ling
Hill
Cre
ek a
t B
elle
grov
e, M
DE
ast
S-
--
--
--
--
--
--
--
--
-4,
450
- -
- -
Tab
le 4
. Mag
nitu
de a
nd fr
eque
ncy
of p
eak
disc
harg
es fo
r ga
ging
sta
tions
in W
est V
irgin
ia a
nd s
urro
undi
ng S
tate
s—C
ontin
ued
Peak
dis
char
ges
for
the
indi
cate
d re
curr
ence
inte
rval
are
pre
sent
ed in
the
follo
win
g or
der:
fir
st li
ne (
S), f
rom
the
syst
emat
ic a
nd h
isto
rica
l rec
ord
on th
e ba
sis
of th
e gu
idel
ines
est
abli
shed
by
the
Wat
er
Res
ourc
es C
ounc
il; s
econ
d lin
e (R
), f
rom
the
regi
onal
ized
reg
ress
ion
equa
tion;
and
, thi
rd li
ne (
W),
fro
m w
eigh
ting
(1)
the
syst
emat
ic a
nd h
isto
rica
l rec
ord
on th
e ba
sis
of th
e gu
idel
ines
est
abli
shed
by
the
Sta
tio
nN
o.
Sta
tio
n n
ame
and
Sta
te R
egio
nE
sti-
mat
ety
pe
Pea
k d
isch
arg
e fo
r th
e in
dic
ated
rec
urr
ence
inte
rval
, in
cu
bic
fee
t p
er s
eco
nd
1.1-
year
1.2-
year
1.3-
year
1.4-
year
1.5-
year
1.6-
year
1.7-
year
1.8-
year
1.9-
year
2-ye
ar2.
5-ye
ar3-
year
Table 4 45

0161
0500
Cac
apon
Riv
er a
t Yel
low
Sp
ring
, WV
Eas
t S
R W
2,50
03,
750
2,60
0
3,35
04,
520
3,46
0
4,04
05,
100
4,15
0
4,64
05,
600
4,74
0
5,18
06,
040
5,28
0
5,68
06,
430
5,77
0
6,14
06,
790
6,23
0
6,58
07,
130
6,65
0
6,99
07,
450
7,06
0
7,39
07,
740
7,44
0
9,13
09,
040
9,12
0
10,6
009,
980
10,5
0001
6115
00C
acap
on R
iver
nea
r G
reat
C
acap
on, W
VE
ast
S
R W
5,06
07,
250
5,09
0
6,64
08,
750
6,68
0
7,88
09,
890
7,92
0
8,94
010
,900
8,98
0
9,88
011
,700
9,92
0
10,7
0012
,500
10,8
00
11,5
0013
,200
11,6
00
12,2
0013
,900
12,3
00
12,9
0014
,500
13,0
00
13,6
0015
,100
13,6
00
16,3
0017
,600
16,4
00
18,6
0019
,500
18,6
00
0161
2500
Litt
le T
onol
oway
Cre
ek
near
Han
cock
, MD
Eas
t S
- -
- -
- -
- -
- -
- -
- -
- -
- -
520
- -
- -
0161
3000
Poto
mac
Riv
er a
t H
anco
ck, M
DE
ast
S-
--
--
--
--
--
--
--
--
-55
,500
- -
- -
0161
3150
Dit
ch R
un n
ear
Han
cock
, M
DE
ast
S-
--
--
--
--
--
--
--
--
-23
8-
--
-
0161
3160
Poto
mac
Riv
er T
ribu
tary
ne
ar H
anco
ck, M
DE
ast
S-
--
--
--
--
--
--
--
--
-10
5-
--
-
0161
3900
Hog
ue C
reek
nea
r H
ayfi
eld,
VA
Eas
t S
- -
- -
- -
- -
- -
- -
- -
- -
- -
838
- -
- -
0161
4000
Bac
k C
reek
nea
r Jo
nes
Spri
ngs,
WV
Eas
t S
R W
2,80
03,
010
2,81
0
3,34
03,
620
3,35
0
3,74
04,
090
3,76
0
4,09
04,
490
4,10
0
4,39
04,
840
4,41
0
4,66
05,
150
4,68
0
4,91
05,
440
4,93
0
5,14
05,
710
5,17
0
5,36
05,
970
5,39
0
5,57
06,
200
5,60
0
6,45
07,
240
6,49
0
7,10
07,
990
7,15
001
6150
00O
pequ
on C
reek
nea
r B
erry
ville
, VA
Eas
t S
- -
- -
- -
- -
- -
- -
- -
- -
- -
2,20
0-
--
-
0161
6000
Abr
ams
Cre
ek n
ear
Win
ches
ter,
VA
Eas
t S
- -
- -
- -
- -
- -
- -
- -
- -
- -
483
- -
- -
0161
6500
Ope
quon
Cre
ek n
ear
Mar
tins
burg
, WV
Eas
t S
R W
1,86
03,
410
1,89
0
2,38
04,
110
2,42
0
2,78
04,
640
2,82
0
3,12
05,
090
3,17
0
3,43
05,
490
3,49
0
3,71
05,
840
3,78
0
3,97
06,
170
4,04
0
4,21
06,
480
4,29
0
4,44
06,
770
4,52
0
4,65
07,
040
4,74
0
5,60
08,
210
5,70
0
6,34
09,
070
6,46
0
0161
7000
Tus
caro
ra C
reek
abo
ve
Mar
tins
burg
, WV
Eas
t2 S
8098
110
121
131
140
148
155
162
168
197
217
0161
8000
Poto
mac
Riv
er a
t Sh
ephe
rdst
own,
MD
Eas
t S
- -
- -
- -
- -
- -
- -
- -
- -
- -
72,2
00-
--
-
0161
9500
Ant
ieta
m C
reek
nea
r Sh
arps
burg
, MD
Eas
t S
- -
- -
- -
- -
- -
- -
- -
- -
- -
2,56
0-
--
-
0162
0500
Nor
th R
iver
nea
r St
okes
ville
, VA
Eas
t S
- -
- -
- -
- -
- -
- -
- -
- -
- -
668
- -
- -
0162
1000
Dry
Riv
er a
t Raw
ley
Spri
ngs,
VA
Eas
t S
- -
- -
- -
- -
- -
- -
- -
- -
- -
2,26
0-
--
-
Tab
le 4
. Mag
nitu
de a
nd fr
eque
ncy
of p
eak
disc
harg
es fo
r ga
ging
sta
tions
in W
est V
irgin
ia a
nd s
urro
undi
ng S
tate
s—C
ontin
ued
Peak
dis
char
ges
for
the
indi
cate
d re
curr
ence
inte
rval
are
pre
sent
ed in
the
follo
win
g or
der:
fir
st li
ne (
S), f
rom
the
syst
emat
ic a
nd h
isto
rica
l rec
ord
on th
e ba
sis
of th
e gu
idel
ines
est
abli
shed
by
the
Wat
er
Res
ourc
es C
ounc
il; s
econ
d lin
e (R
), f
rom
the
regi
onal
ized
reg
ress
ion
equa
tion;
and
, thi
rd li
ne (
W),
fro
m w
eigh
ting
(1)
the
syst
emat
ic a
nd h
isto
rica
l rec
ord
on th
e ba
sis
of th
e gu
idel
ines
est
abli
shed
by
the
Sta
tio
nN
o.
Sta
tio
n n
ame
and
Sta
te R
egio
nE
sti-
mat
ety
pe
Pea
k d
isch
arg
e fo
r th
e in
dic
ated
rec
urr
ence
inte
rval
, in
cu
bic
fee
t p
er s
eco
nd
1.1-
year
1.2-
year
1.3-
year
1.4-
year
1.5-
year
1.6-
year
1.7-
year
1.8-
year
1.9-
year
2-ye
ar2.
5-ye
ar3-
year
46 Estimating Annual Peak Discharges with Recurrence Intervals Between 1.1 and 3.0 Years for Rural, Unregulated Streams in WV
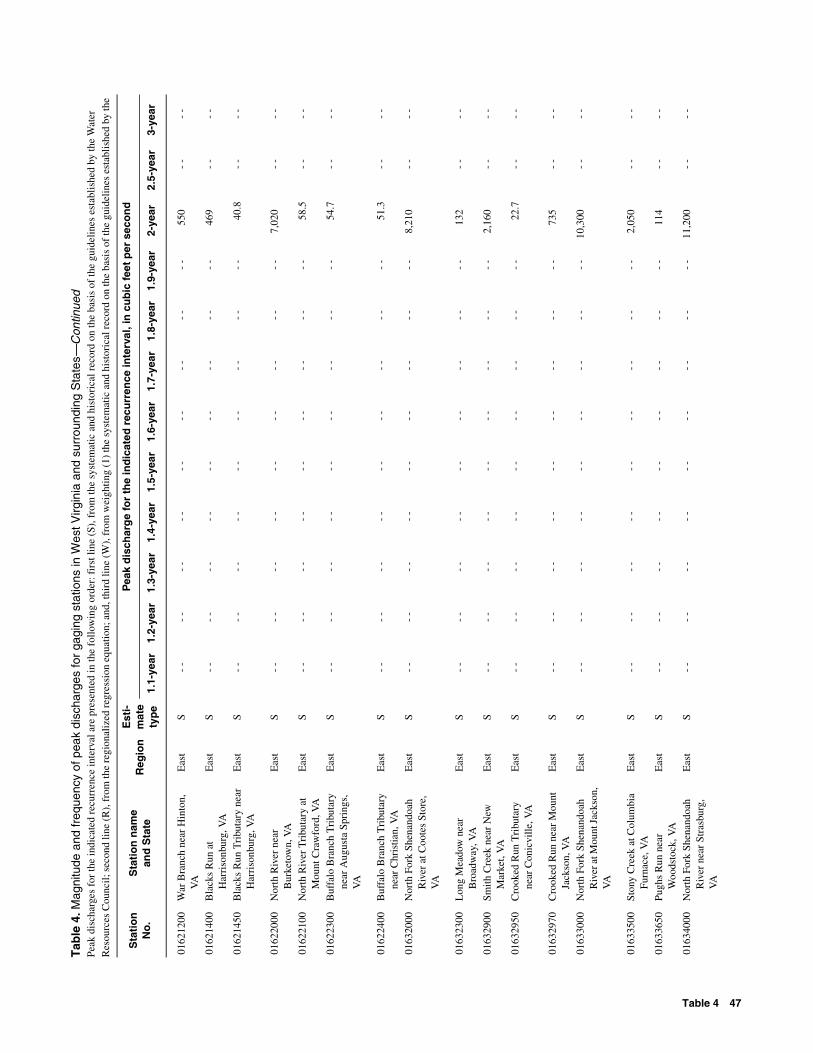
0162
1200
War
Bra
nch
near
Hin
ton,
V
AE
ast
S-
--
--
--
--
--
--
--
--
-55
0-
--
-
0162
1400
Bla
cks
Run
at
Har
riso
nbur
g, V
AE
ast
S-
--
--
--
--
--
--
--
--
-46
9-
--
-
0162
1450
Bla
cks
Run
Tri
buta
ry n
ear
Har
riso
nbur
g, V
AE
ast
S-
--
--
--
--
--
--
--
--
-40
.8-
--
-
0162
2000
Nor
th R
iver
nea
r B
urke
tow
n, V
AE
ast
S-
--
--
--
--
--
--
--
--
-7,
020
- -
- -
0162
2100
Nor
th R
iver
Tri
buta
ry a
t M
ount
Cra
wfo
rd, V
AE
ast
S-
--
--
--
--
--
--
--
--
-58
.5-
--
-
0162
2300
Buf
falo
Bra
nch
Tri
buta
ry
near
Aug
usta
Spr
ings
, V
A
Eas
t S
- -
- -
- -
- -
- -
- -
- -
- -
- -
54.7
- -
- -
0162
2400
Buf
falo
Bra
nch
Tri
buta
ry
near
Chr
istia
n, V
AE
ast
S-
--
--
--
--
--
--
--
--
-51
.3-
--
-
0163
2000
Nor
th F
ork
Shen
ando
ah
Riv
er a
t Coo
tes
Stor
e,
VA
Eas
t S
- -
- -
- -
- -
- -
- -
- -
- -
- -
8,21
0-
--
-
0163
2300
Lon
g M
eado
w n
ear
Bro
adw
ay, V
AE
ast
S-
--
--
--
--
--
--
--
--
-13
2-
--
-
0163
2900
Smith
Cre
ek n
ear
New
M
arke
t, V
AE
ast
S-
--
--
--
--
--
--
--
--
-2,
160
- -
- -
0163
2950
Cro
oked
Run
Tri
buta
ry
near
Con
icvi
lle, V
AE
ast
S-
--
--
--
--
--
--
--
--
-22
.7-
--
-
0163
2970
Cro
oked
Run
nea
r M
ount
Ja
ckso
n, V
AE
ast
S-
--
--
--
--
--
--
--
--
-73
5-
--
-
0163
3000
Nor
th F
ork
Shen
ando
ah
Riv
er a
t Mou
nt J
acks
on,
VA
Eas
t S
- -
- -
- -
- -
- -
- -
- -
- -
- -
10,3
00-
--
-
0163
3500
Ston
y C
reek
at C
olum
bia
Furn
ace,
VA
Eas
t S
- -
- -
- -
- -
- -
- -
- -
- -
- -
2,05
0-
--
-
0163
3650
Pugh
s R
un n
ear
Woo
dsto
ck, V
AE
ast
S-
--
--
--
--
--
--
--
--
-11
4-
--
-
0163
4000
Nor
th F
ork
Shen
ando
ah
Riv
er n
ear
Stra
sbur
g,
VA
Eas
t S
- -
- -
- -
- -
- -
- -
- -
- -
- -
11,2
00-
--
-
Tab
le 4
. Mag
nitu
de a
nd fr
eque
ncy
of p
eak
disc
harg
es fo
r ga
ging
sta
tions
in W
est V
irgin
ia a
nd s
urro
undi
ng S
tate
s—C
ontin
ued
Peak
dis
char
ges
for
the
indi
cate
d re
curr
ence
inte
rval
are
pre
sent
ed in
the
follo
win
g or
der:
fir
st li
ne (
S), f
rom
the
syst
emat
ic a
nd h
isto
rica
l rec
ord
on th
e ba
sis
of th
e gu
idel
ines
est
abli
shed
by
the
Wat
er
Res
ourc
es C
ounc
il; s
econ
d lin
e (R
), f
rom
the
regi
onal
ized
reg
ress
ion
equa
tion;
and
, thi
rd li
ne (
W),
fro
m w
eigh
ting
(1)
the
syst
emat
ic a
nd h
isto
rica
l rec
ord
on th
e ba
sis
of th
e gu
idel
ines
est
abli
shed
by
the
Sta
tio
nN
o.
Sta
tio
n n
ame
and
Sta
te R
egio
nE
sti-
mat
ety
pe
Pea
k d
isch
arg
e fo
r th
e in
dic
ated
rec
urr
ence
inte
rval
, in
cu
bic
fee
t p
er s
eco
nd
1.1-
year
1.2-
year
1.3-
year
1.4-
year
1.5-
year
1.6-
year
1.7-
year
1.8-
year
1.9-
year
2-ye
ar2.
5-ye
ar3-
year
Table 4 47

0163
4500
Ced
ar C
reek
nea
r W
inch
este
r, V
AE
ast
S-
--
--
--
--
--
--
--
--
-3,
110
- -
- -
0163
6500
Shen
ando
ah R
iver
at
Mil
lvill
e, W
VE
ast2
S13
,700
17,4
0020
,400
22,8
0025
,000
27,0
0028
,800
30,5
0032
,100
33,6
0040
,100
45,2
00
0201
1480
Bac
k C
reek
at R
oute
600
ne
ar M
ount
ain
Gro
ve,
VA
Sout
hS
- -
- -
- -
- -
- -
- -
- -
- -
- -
4,37
0-
--
-
0201
1500
Bac
k C
reek
nea
r Mou
ntai
n G
rove
, VA
Sout
hS
- -
- -
- -
- -
- -
- -
- -
- -
- -
5,94
0-
--
-
0201
2500
Jack
son
Riv
er a
t Fal
ling
Spri
ng, V
ASo
uth
S-
--
--
--
--
--
--
--
--
-10
,300
- -
- -
0201
3000
Dun
lap
Cre
ek n
ear
Cov
ingt
on, V
ASo
uth
S-
--
--
--
--
--
--
--
--
-5,
060
- -
- -
0201
4000
Potts
Cre
ek n
ear
Cov
ingt
on, V
ASo
uth
S-
--
--
--
--
--
--
--
--
-3,
800
- -
- -
0305
0000
Tyga
rt V
alle
y R
iver
nea
r D
aile
y, W
VN
orth
S
R W
4,16
03,
550
4,14
0
4,69
04,
100
4,67
0
5,07
04,
490
5,06
0
5,38
04,
800
5,37
0
5,65
05,
070
5,64
0
5,89
05,
310
5,87
0
6,10
05,
510
6,08
0
6,30
05,
700
6,28
0
6,48
05,
880
6,46
0
6,64
06,
040
6,62
0
7,34
06,
690
7,32
0
7,83
07,
190
7,82
0
0305
0500
Tyga
rt V
alle
y R
iver
nea
r E
lkin
s, W
VN
orth
S
R W
4,91
04,
790
4,91
0
5,42
05,
500
5,43
0
5,79
06,
000
5,79
0
6,08
06,
400
6,09
0
6,33
06,
740
6,35
0
6,55
07,
030
6,57
0
6,75
07,
290
6,77
0
6,93
07,
530
6,95
0
7,09
07,
750
7,11
0
7,24
07,
950
7,27
0
7,87
08,
770
7,91
0
8,31
09,
390
8,35
003
0506
50L
eadi
ng C
reek
Tri
buta
ry
near
Gilm
an, W
VN
orth
S
R W
13.4
28.0
16.4
18.7
36.1
22.8
23.0
42.5
27.9
26.9
48.0
32.4
30.5
52.9
36.5
33.8
57.3
40.3
37.0
61.4
43.7
40.0
65.3
47.0
42.8
68.8
50.2
45.6
72.2
53.1
57.9
87.0
66.3
68.3
98.9
77.0
0305
1000
Tyga
rt V
alle
y R
iver
at
Bel
ingt
on, W
VN
orth
S
R W
6,79
06,
590
6,78
0
7,55
07,
510
7,55
0
8,09
08,
150
8,09
0
8,52
08,
670
8,52
0
8,88
09,
100
8,89
0
9,20
09,
480
9,20
0
9,48
09,
810
9,48
0
9,73
010
,100
9,74
0
9,96
010
,400
9,97
0
10,2
0010
,600
10,2
00
11,0
0011
,700
11,1
00
11,7
0012
,400
11,7
0003
0515
00M
iddl
e Fo
rk R
iver
at
Mid
vale
, WV
Nor
thS
R W
2,73
02,
550
2,72
0
3,18
02,
970
3,17
0
3,51
03,
270
3,50
0
3,78
03,
510
3,77
0
4,01
03,
720
4,00
0
4,22
03,
900
4,20
0
4,40
04,
060
4,38
0
4,57
04,
210
4,55
0
4,72
04,
350
4,70
0
4,87
04,
470
4,84
0
5,47
04,
990
5,44
0
5,92
05,
380
5,89
0
0305
2000
Mid
dle
Fork
Riv
er a
t A
udra
, WV
Nor
thS
R W
3,52
02,
970
3,50
0
4,04
03,
450
4,01
0
4,42
03,
790
4,39
0
4,72
04,
060
4,69
0
4,99
04,
300
4,96
0
5,22
04,
500
5,19
0
5,43
04,
680
5,39
0
5,62
04,
850
5,58
0
5,79
05,
000
5,75
0
5,95
05,
140
5,91
0
6,63
05,
720
6,59
0
7,12
06,
150
7,08
0
Tab
le 4
. Mag
nitu
de a
nd fr
eque
ncy
of p
eak
disc
harg
es fo
r ga
ging
sta
tions
in W
est V
irgin
ia a
nd s
urro
undi
ng S
tate
s—C
ontin
ued
Peak
dis
char
ges
for
the
indi
cate
d re
curr
ence
inte
rval
are
pre
sent
ed in
the
follo
win
g or
der:
fir
st li
ne (
S), f
rom
the
syst
emat
ic a
nd h
isto
rica
l rec
ord
on th
e ba
sis
of th
e gu
idel
ines
est
abli
shed
by
the
Wat
er
Res
ourc
es C
ounc
il; s
econ
d lin
e (R
), f
rom
the
regi
onal
ized
reg
ress
ion
equa
tion;
and
, thi
rd li
ne (
W),
fro
m w
eigh
ting
(1)
the
syst
emat
ic a
nd h
isto
rica
l rec
ord
on th
e ba
sis
of th
e gu
idel
ines
est
abli
shed
by
the
Sta
tio
nN
o.
Sta
tio
n n
ame
and
Sta
te R
egio
nE
sti-
mat
ety
pe
Pea
k d
isch
arg
e fo
r th
e in
dic
ated
rec
urr
ence
inte
rval
, in
cu
bic
fee
t p
er s
eco
nd
1.1-
year
1.2-
year
1.3-
year
1.4-
year
1.5-
year
1.6-
year
1.7-
year
1.8-
year
1.9-
year
2-ye
ar2.
5-ye
ar3-
year
48 Estimating Annual Peak Discharges with Recurrence Intervals Between 1.1 and 3.0 Years for Rural, Unregulated Streams in WV

0305
2340
Mud
Lic
k R
un n
ear
Buc
khan
non,
WV
Nor
thS
R W
118
111
116
126
139
130
132
160
141
136
178
149
140
194
157
144
208
163
147
221
169
149
233
174
152
245
179
154
255
183
163
300
201
169
336
213
0305
2500
San
d R
un n
ear
Buc
khan
non,
WV
Nor
thS
R W
395
470
398
470
569
475
526
643
533
573
703
581
615
756
623
652
802
661
685
845
695
716
883
727
745
919
756
772
953
784
889
1,09
090
2
975
1,20
098
9
0305
3500
Buc
khan
non
Riv
er n
ear
Hal
l, W
VN
orth
S
R W
4,72
04,
880
4,73
0
5,39
05,
590
5,39
0
5,84
06,
100
5,85
0
6,19
06,
500
6,20
0
6,49
06,
850
6,50
0
6,74
07,
150
6,75
0
6,96
07,
410
6,97
0
7,15
07,
650
7,17
0
7,33
07,
870
7,34
0
7,49
08,
070
7,50
0
8,14
08,
910
8,15
0
8,64
09,
530
8,66
003
0545
00Ty
gart
Val
ley
Riv
er a
t Ph
illip
i, W
VN
orth
S
R W
14,0
0012
,500
13,9
00
15,7
0014
,000
15,7
00
17,0
0015
,100
16,9
00
18,0
0015
,900
17,9
00
18,8
0016
,600
18,8
00
19,6
0017
,200
19,5
00
20,3
0017
,800
20,2
00
20,9
0018
,300
20,8
00
21,4
0018
,700
21,3
00
21,9
0019
,100
21,8
00
24,0
0020
,700
23,9
00
25,5
0021
,900
25,4
00
0305
5020
Bon
ica
Run
on
U.S
. 250
ne
ar P
hilli
pi, W
VN
orth
S
R W
29.9
38.5
32.2
37.5
49.4
40.9
43.2
57.9
47.6
47.9
65.1
53.2
52.1
71.5
58.1
55.8
77.3
62.5
59.1
82.7
66.5
62.2
87.7
70.2
65.0
92.4
73.6
67.6
96.8
76.8
78.8
116.
090
.3
87.8
131.
010
1.0
0305
5040
Bon
ica
Run
on
Rou
te 3
8 ne
ar P
hilli
pi, W
VN
orth
S
R W
96 144
105
118
180
130
134
206
149
148
229
166
161
248
180
172
266
193
182
282
204
192
297
215
201
311
225
209
324
234
245
379
275
272
423
305
0305
6250
Thr
ee F
ork
Cre
ek n
ear
Gra
fton
, WV
Nor
thS
R W
2,59
02,
130
2,52
0
3,02
02,
490
2,94
0
3,34
02,
750
3,24
0
3,60
02,
950
3,49
0
3,82
03,
130
3,70
0
4,02
03,
290
3,89
0
4,20
03,
430
4,06
0
4,36
03,
560
4,22
0
4,52
03,
670
4,36
0
4,66
03,
780
4,49
0
5,25
04,
230
5,06
0
5,68
04,
570
5,48
003
0565
00Ty
gart
Val
ley
Riv
er a
t Fe
tterm
an, W
VN
orth
S
R W
19,8
0016
,600
19,7
00
22,3
0018
,500
22,2
00
24,1
0019
,800
23,9
00
25,5
0020
,800
25,3
00
26,7
0021
,700
26,5
00
27,8
0022
,400
27,5
00
28,7
0023
,100
28,4
00
29,6
0023
,700
29,3
00
30,3
0024
,200
30,0
00
31,0
0024
,700
30,7
00
34,0
0026
,700
33,6
00
36,1
0028
,100
35,7
00
0305
6600
Rig
ht F
ork
Wic
kwir
e R
un
near
Gra
fton
, WV
Nor
thS
R W
100
112
103
122
141
127
138
162
144
151
180
159
162
196
171
172
210
182
181
223
192
189
236
202
197
247
210
204
257
218
233
303
251
256
339
277
0305
7300
Wes
t For
k R
iver
at
Wal
kers
ville
, WV
Nor
thS
R W
842
817
838
999
977
995
1,11
01,
090
1,11
0
1,21
01,
190
1,20
0
1,29
01,
270
1,29
0
1,36
01,
350
1,36
0
1,42
01,
410
1,42
0
1,48
01,
470
1,48
0
1,54
01,
530
1,53
0
1,59
01,
580
1,59
0
1,80
01,
790
1,80
0
1,96
01,
960
1,96
003
0575
00Sk
in C
reek
nea
r B
row
nsvi
lle, W
VN
orth
S
R W
854
747
847
958
895
954
1,03
01,
000
1,03
0
1,09
01,
090
1,09
0
1,13
01,
170
1,13
0
1,17
01,
240
1,18
0
1,20
01,
300
1,21
0
1,24
01,
350
1,24
0
1,26
01,
410
1,27
0
1,29
01,
450
1,30
0
1,39
01,
660
1,41
0
1,47
01,
810
1,49
0
0305
8000
Wes
t For
k R
iver
at
Bro
wns
ville
, WV
Nor
thS
R W
1,91
02,
200
1,92
0
2,19
02,
570
2,21
0
2,39
02,
840
2,41
0
2,55
03,
050
2,58
0
2,69
03,
230
2,72
0
2,81
03,
390
2,84
0
2,92
03,
540
2,95
0
3,01
03,
670
3,05
0
3,10
03,
790
3,14
0
3,18
03,
900
3,22
0
3,52
04,
360
3,56
0
3,77
04,
710
3,81
003
0585
00W
est F
ork
Riv
er a
t B
utch
ervi
lle, W
VN
orth
S
R W
3,44
03,
490
3,44
0
4,03
04,
030
4,03
0
4,44
04,
420
4,44
0
4,78
04,
730
4,77
0
5,05
04,
990
5,05
0
5,30
05,
220
5,30
0
5,51
05,
430
5,51
0
5,71
05,
610
5,71
0
5,89
05,
780
5,88
0
6,05
05,
940
6,05
0
6,72
06,
590
6,71
0
7,23
07,
080
7,23
0
Tab
le 4
. Mag
nitu
de a
nd fr
eque
ncy
of p
eak
disc
harg
es fo
r ga
ging
sta
tions
in W
est V
irgin
ia a
nd s
urro
undi
ng S
tate
s—C
ontin
ued
Peak
dis
char
ges
for
the
indi
cate
d re
curr
ence
inte
rval
are
pre
sent
ed in
the
follo
win
g or
der:
fir
st li
ne (
S), f
rom
the
syst
emat
ic a
nd h
isto
rica
l rec
ord
on th
e ba
sis
of th
e gu
idel
ines
est
abli
shed
by
the
Wat
er
Res
ourc
es C
ounc
il; s
econ
d lin
e (R
), f
rom
the
regi
onal
ized
reg
ress
ion
equa
tion;
and
, thi
rd li
ne (
W),
fro
m w
eigh
ting
(1)
the
syst
emat
ic a
nd h
isto
rica
l rec
ord
on th
e ba
sis
of th
e gu
idel
ines
est
abli
shed
by
the
Sta
tio
nN
o.
Sta
tio
n n
ame
and
Sta
te R
egio
nE
sti-
mat
ety
pe
Pea
k d
isch
arg
e fo
r th
e in
dic
ated
rec
urr
ence
inte
rval
, in
cu
bic
fee
t p
er s
eco
nd
1.1-
year
1.2-
year
1.3-
year
1.4-
year
1.5-
year
1.6-
year
1.7-
year
1.8-
year
1.9-
year
2-ye
ar2.
5-ye
ar3-
year
Table 4 49
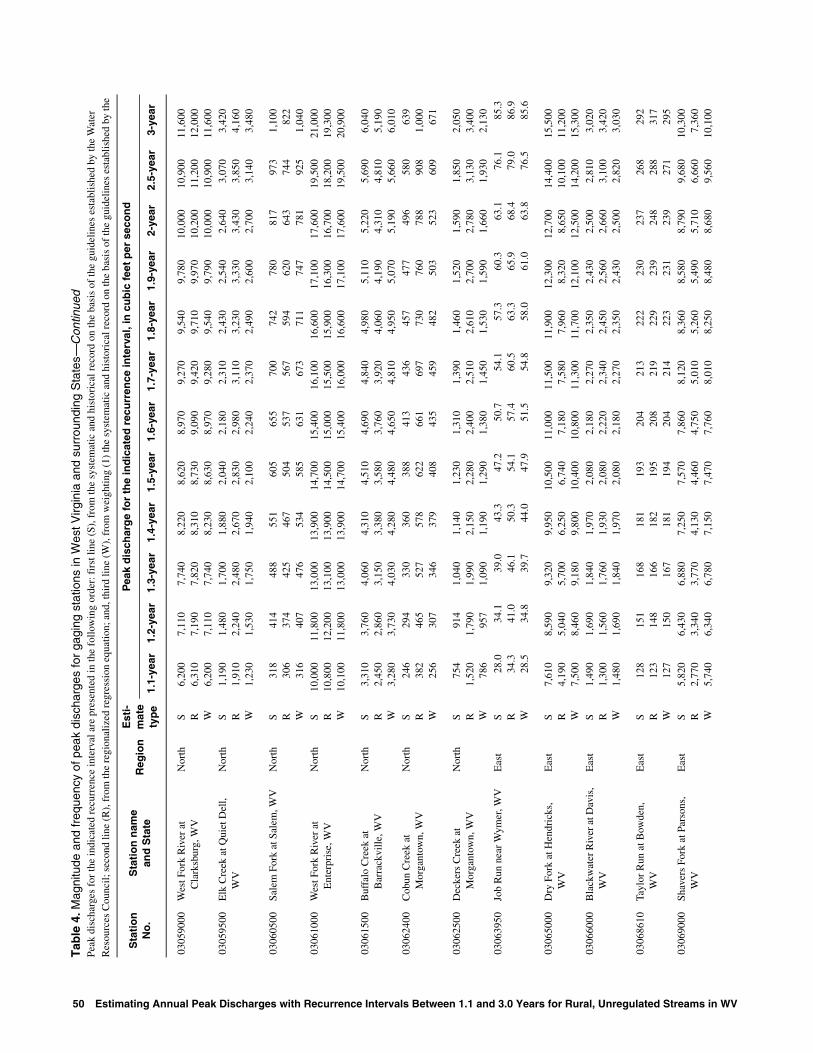
0305
9000
Wes
t For
k R
iver
at
Cla
rksb
urg,
WV
Nor
thS
R W
6,20
06,
310
6,20
0
7,11
07,
190
7,11
0
7,74
07,
820
7,74
0
8,22
08,
310
8,23
0
8,62
08,
730
8,63
0
8,97
09,
090
8,97
0
9,27
09,
420
9,28
0
9,54
09,
710
9,54
0
9,78
09,
970
9,79
0
10,0
0010
,200
10,0
00
10,9
0011
,200
10,9
00
11,6
0012
,000
11,6
0003
0595
00E
lk C
reek
at Q
uiet
Del
l, W
VN
orth
S
R W
1,19
01,
910
1,23
0
1,48
02,
240
1,53
0
1,70
02,
480
1,75
0
1,88
02,
670
1,94
0
2,04
02,
830
2,10
0
2,18
02,
980
2,24
0
2,31
03,
110
2,37
0
2,43
03,
230
2,49
0
2,54
03,
330
2,60
0
2,64
03,
430
2,70
0
3,07
03,
850
3,14
0
3,42
04,
160
3,48
0
0306
0500
Sale
m F
ork
at S
alem
, WV
Nor
thS
R W
318
306
316
414
374
407
488
425
476
551
467
534
605
504
585
655
537
631
700
567
673
742
594
711
780
620
747
817
643
781
973
744
925
1,10
082
21,
040
0306
1000
Wes
t For
k R
iver
at
Ent
erpr
ise,
WV
Nor
thS
R W
10,0
0010
,800
10,1
00
11,8
0012
,200
11,8
00
13,0
0013
,100
13,0
00
13,9
0013
,900
13,9
00
14,7
0014
,500
14,7
00
15,4
0015
,000
15,4
00
16,1
0015
,500
16,0
00
16,6
0015
,900
16,6
00
17,1
0016
,300
17,1
00
17,6
0016
,700
17,6
00
19,5
0018
,200
19,5
00
21,0
0019
,300
20,9
00
0306
1500
Buf
falo
Cre
ek a
t B
arra
ckvi
lle,
WV
Nor
thS
R W
3,31
02,
450
3,28
0
3,76
02,
860
3,73
0
4,06
03,
150
4,03
0
4,31
03,
380
4,28
0
4,51
03,
580
4,48
0
4,69
03,
760
4,65
0
4,84
03,
920
4,81
0
4,98
04,
060
4,95
0
5,11
04,
190
5,07
0
5,22
04,
310
5,19
0
5,69
04,
810
5,66
0
6,04
05,
190
6,01
003
0624
00C
obun
Cre
ek a
t M
orga
ntow
n, W
VN
orth
S
R W
246
382
256
294
465
307
330
527
346
360
578
379
388
622
408
413
661
435
436
697
459
457
730
482
477
760
503
496
788
523
580
908
609
639
1,00
067
1
0306
2500
Dec
kers
Cre
ek a
t M
orga
ntow
n, W
VN
orth
S
R W
754
1,52
078
6
914
1,79
095
7
1,04
01,
990
1,09
0
1,14
02,
150
1,19
0
1,23
02,
280
1,29
0
1,31
02,
400
1,38
0
1,39
02,
510
1,45
0
1,46
02,
610
1,53
0
1,52
02,
700
1,59
0
1,59
02,
780
1,66
0
1,85
03,
130
1,93
0
2,05
03,
400
2,13
003
0639
50Jo
b R
un n
ear
Wym
er, W
VE
ast
S
R W
28.0
34.3
28.5
34.1
41.0
34.8
39.0
46.1
39.7
43.3
50.3
44.0
47.2
54.1
47.9
50.7
57.4
51.5
54.1
60.5
54.8
57.3
63.3
58.0
60.3
65.9
61.0
63.1
68.4
63.8
76.1
79.0
76.5
85.3
86.9
85.6
0306
5000
Dry
For
k at
Hen
dric
ks,
WV
Eas
t S
R W
7,61
04,
190
7,50
0
8,59
05,
040
8,46
0
9,32
05,
700
9,18
0
9,95
06,
250
9,80
0
10,5
006,
740
10,4
00
11,0
007,
180
10,8
00
11,5
007,
580
11,3
00
11,9
007,
960
11,7
00
12,3
008,
320
12,1
00
12,7
008,
650
12,5
00
14,4
0010
,100
14,2
00
15,5
0011
,200
15,3
0003
0660
00B
lack
wat
er R
iver
at D
avis
, W
VE
ast
S
R W
1,49
01,
300
1,48
0
1,69
01,
560
1,69
0
1,84
01,
760
1,84
0
1,97
01,
930
1,97
0
2,08
02,
080
2,08
0
2,18
02,
220
2,18
0
2,27
02,
340
2,27
0
2,35
02,
450
2,35
0
2,43
02,
560
2,43
0
2,50
02,
660
2,50
0
2,81
03,
100
2,82
0
3,02
03,
420
3,03
0
0306
8610
Tayl
or R
un a
t Bow
den,
W
VE
ast
S
R W
128
123
127
151
148
150
168
166
167
181
182
181
193
195
194
204
208
204
213
219
214
222
229
223
230
239
231
237
248
239
268
288
271
292
317
295
0306
9000
Shav
ers
Fork
at P
arso
ns,
WV
Eas
t S
R W
5,82
02,
770
5,74
0
6,43
03,
340
6,34
0
6,88
03,
770
6,78
0
7,25
04,
130
7,15
0
7,57
04,
460
7,47
0
7,86
04,
750
7,76
0
8,12
05,
010
8,01
0
8,36
05,
260
8,25
0
8,58
05,
490
8,48
0
8,79
05,
710
8,68
0
9,68
06,
660
9,56
0
10,3
007,
360
10,1
00
Tab
le 4
. Mag
nitu
de a
nd fr
eque
ncy
of p
eak
disc
harg
es fo
r ga
ging
sta
tions
in W
est V
irgin
ia a
nd s
urro
undi
ng S
tate
s—C
ontin
ued
Peak
dis
char
ges
for
the
indi
cate
d re
curr
ence
inte
rval
are
pre
sent
ed in
the
follo
win
g or
der:
fir
st li
ne (
S), f
rom
the
syst
emat
ic a
nd h
isto
rica
l rec
ord
on th
e ba
sis
of th
e gu
idel
ines
est
abli
shed
by
the
Wat
er
Res
ourc
es C
ounc
il; s
econ
d lin
e (R
), f
rom
the
regi
onal
ized
reg
ress
ion
equa
tion;
and
, thi
rd li
ne (
W),
fro
m w
eigh
ting
(1)
the
syst
emat
ic a
nd h
isto
rica
l rec
ord
on th
e ba
sis
of th
e gu
idel
ines
est
abli
shed
by
the
Sta
tio
nN
o.
Sta
tio
n n
ame
and
Sta
te R
egio
nE
sti-
mat
ety
pe
Pea
k d
isch
arg
e fo
r th
e in
dic
ated
rec
urr
ence
inte
rval
, in
cu
bic
fee
t p
er s
eco
nd
1.1-
year
1.2-
year
1.3-
year
1.4-
year
1.5-
year
1.6-
year
1.7-
year
1.8-
year
1.9-
year
2-ye
ar2.
5-ye
ar3-
year
50 Estimating Annual Peak Discharges with Recurrence Intervals Between 1.1 and 3.0 Years for Rural, Unregulated Streams in WV

0306
9500
Che
at R
iver
nea
r Pa
rson
s,
WV
Eas
t S
R W
15,3
007,
670
15,2
00
17,1
009,
260
16,9
00
18,5
0010
,500
18,3
00
19,6
0011
,500
19,4
00
20,6
0012
,400
20,4
00
21,5
0013
,200
21,2
00
22,3
0014
,000
22,0
00
23,0
0014
,700
22,8
00
23,8
0015
,300
23,5
00
24,4
0015
,900
24,1
00
27,3
0018
,600
27,0
00
29,1
0020
,600
28,8
0003
0698
50L
ong
Run
nea
r Pa
rson
s,
WV
Eas
t S
R W
46.8
31.7
45.2
53.4
37.9
51.6
58.2
42.6
56.3
62.1
46.5
60.1
65.5
49.9
63.5
68.6
53.0
66.4
71.2
55.8
69.1
73.7
58.4
71.5
76.0
60.9
73.8
78.2
63.1
75.9
87.2
72.9
84.9
93.5
80.2
91.4
0306
9880
Buf
falo
Cre
ek n
ear
Row
lesb
urg,
WV
Eas
t S
R W
716
255
669
831
306
770
917
345
846
990
377
910
1,06
040
696
7
1,11
043
21,
020
1,17
045
51,
060
1,22
047
71,
110
1,26
049
81,
150
1,31
051
71,
190
1,50
059
91,
350
1,63
066
01,
470
0307
0000
Che
at R
iver
at
Row
lesb
urg,
WV
Eas
t S
R W
20,1
009,
550
19,9
00
22,9
0011
,500
22,6
00
24,9
0013
,000
24,6
00
26,6
0014
,300
26,2
00
28,1
0015
,400
27,7
00
29,4
0016
,500
28,9
00
30,5
0017
,400
30,1
00
31,6
0018
,300
31,2
00
32,6
0019
,100
32,1
00
33,5
0019
,900
33,1
00
37,5
0023
,200
37,0
00
40,3
0025
,700
39,7
00
0307
0500
Big
San
dy C
reek
nea
r R
ockv
ille,
WV
Eas
t S
R W
4,55
02,
630
4,51
0
5,08
03,
170
5,03
0
5,46
03,
580
5,42
0
5,78
03,
920
5,73
0
6,06
04,
230
6,01
0
6,31
04,
500
6,26
0
6,54
04,
750
6,49
0
6,75
04,
990
6,70
0
6,95
05,
210
6,89
0
7,13
05,
420
7,07
0
7,90
06,
320
7,85
0
8,42
06,
980
8,37
003
0710
00C
heat
Riv
er n
ear
Pisg
ah,
WV
Eas
t S
R W
24,1
0013
,000
23,7
00
28,2
0015
,700
27,7
00
31,2
0017
,700
30,6
00
33,6
0019
,400
32,9
00
35,6
0021
,000
34,9
00
37,5
0022
,400
36,7
00
39,1
0023
,600
38,3
00
40,6
0024
,800
39,8
00
42,0
0026
,000
41,2
00
43,3
0027
,000
42,4
00
48,7
0031
,600
47,7
00
52,7
0035
,000
51,6
00
0307
1500
Che
at R
iver
nea
r M
orga
ntow
n, W
VE
ast2
S25
,700
30,3
0033
,600
36,3
0038
,500
40,5
0042
,200
43,8
0045
,200
46,6
0052
,000
56,2
00
0307
2000
Dun
kard
Cre
ek a
t S
hann
opin
, PA
Nor
thS
- -
- -
- -
- -
- -
- -
- -
- -
- -
6,89
0-
--
-
0307
2590
Geo
rges
Cre
ek a
t Sm
ithfi
eld,
PA
Eas
t S
- -
- -
- -
- -
- -
- -
- -
- -
- -
662
- -
- -
0307
5450
Lit
tle
You
ghio
ghen
y R
iver
T
ribu
tary
at D
eer
Park
, M
D
Eas
t S
- -
- -
- -
- -
- -
- -
- -
- -
- -
23.7
- -
- -
0307
5500
You
ghio
ghen
y R
iver
nea
r O
akla
nd, M
DE
ast
S-
--
--
--
--
--
--
--
--
-4,
200
- -
- -
0307
5600
Toliv
er R
un T
ribu
tary
nea
r H
oyes
Run
, MD
Eas
t S
- -
- -
- -
- -
- -
- -
- -
- -
- -
28.8
- -
- -
0307
6505
You
ghio
ghen
y R
iver
T
ribu
tary
nea
r Fr
iend
svill
e, M
D
Eas
t S
- -
- -
- -
- -
- -
- -
- -
- -
- -
12.1
- -
- -
0307
6600
Bea
r Cre
ek a
t Fri
ends
ville
, M
DE
ast
S-
--
--
--
--
--
--
--
--
-1,
570
- -
- -
0310
8000
Rac
coon
Cre
ek a
t Mof
fatts
M
ill,
PAN
orth
S-
--
--
--
--
--
--
--
--
-3,
910
- -
- -
Tab
le 4
. Mag
nitu
de a
nd fr
eque
ncy
of p
eak
disc
harg
es fo
r ga
ging
sta
tions
in W
est V
irgin
ia a
nd s
urro
undi
ng S
tate
s—C
ontin
ued
Peak
dis
char
ges
for
the
indi
cate
d re
curr
ence
inte
rval
are
pre
sent
ed in
the
follo
win
g or
der:
fir
st li
ne (
S), f
rom
the
syst
emat
ic a
nd h
isto
rica
l rec
ord
on th
e ba
sis
of th
e gu
idel
ines
est
abli
shed
by
the
Wat
er
Res
ourc
es C
ounc
il; s
econ
d lin
e (R
), f
rom
the
regi
onal
ized
reg
ress
ion
equa
tion;
and
, thi
rd li
ne (
W),
fro
m w
eigh
ting
(1)
the
syst
emat
ic a
nd h
isto
rica
l rec
ord
on th
e ba
sis
of th
e gu
idel
ines
est
abli
shed
by
the
Sta
tio
nN
o.
Sta
tio
n n
ame
and
Sta
te R
egio
nE
sti-
mat
ety
pe
Pea
k d
isch
arg
e fo
r th
e in
dic
ated
rec
urr
ence
inte
rval
, in
cu
bic
fee
t p
er s
eco
nd
1.1-
year
1.2-
year
1.3-
year
1.4-
year
1.5-
year
1.6-
year
1.7-
year
1.8-
year
1.9-
year
2-ye
ar2.
5-ye
ar3-
year
Table 4 51

0310
9000
Lis
bon
Cre
ek a
t Lis
bon,
O
HN
orth
S-
--
--
--
--
--
--
--
--
-38
2-
--
-
0310
9500
Litt
le B
eave
r C
reek
nea
r E
ast L
iver
pool
, OH
Nor
thS
- -
- -
- -
- -
- -
- -
- -
- -
- -
9,31
0-
--
-
0311
0000
Yel
low
Cre
ek n
ear
Ham
mon
dsvi
lle,
OH
Nor
thS
- -
- -
- -
- -
- -
- -
- -
- -
- -
3,19
0-
--
-
0311
1150
Bru
sh R
un n
ear
Buf
falo
, PA
Nor
thS
- -
- -
- -
- -
- -
- -
- -
- -
- -
508
- -
- -
0311
1500
Shor
t Cre
ek n
ear
Dill
onva
le, O
HN
orth
S-
--
--
--
--
--
--
--
--
-2,
940
- -
- -
0311
2000
Whe
elin
g C
reek
at E
lm
Gro
ve, W
VN
orth
S
R W
4,79
04,
930
4,80
0
5,72
05,
650
5,72
0
6,40
06,
170
6,39
0
6,95
06,
570
6,93
0
7,41
06,
920
7,39
0
7,82
07,
220
7,80
0
8,19
07,
490
8,16
0
8,53
07,
730
8,49
0
8,83
07,
950
8,79
0
9,12
08,
160
9,07
0
10,3
009,
000
10,2
00
11,2
009,
630
11,1
00
0311
3700
Litt
le G
rave
Cre
ek n
ear
Gle
ndal
e, W
VN
orth
S
R W
176
204
182
235
251
239
281
287
282
320
317
319
356
343
352
388
367
382
417
388
409
445
408
434
471
426
458
495
443
480
601
516
576
689
573
655
0311
4000
Cap
tina
Cre
ek a
t A
rmst
rong
s M
ills,
OH
Nor
thS
- -
- -
- -
- -
- -
- -
- -
- -
- -
6,30
0-
--
-
0311
4240
Woo
d R
un n
ear
Woo
dsfi
eld,
OH
Nor
thS
- -
- -
- -
- -
- -
- -
- -
- -
- -
69.6
- -
- -
0311
4500
Mid
dle
Isla
nd C
reek
at
Litt
le, W
VN
orth
S
R W
9,09
07,
250
9,06
0
10,1
008,
240
10,1
00
10,8
008,
930
10,8
00
11,4
009,
490
11,3
00
11,8
009,
950
11,8
00
12,2
0010
,400
12,2
00
12,6
0010
,700
12,6
00
12,9
0011
,000
12,9
00
13,2
0011
,300
13,2
00
13,5
0011
,600
13,4
00
14,6
0012
,700
14,6
00
15,4
0013
,500
15,4
0003
1145
50B
uffa
lo R
un n
ear
Fri
endl
y,
WV
Nor
thS
R W
78 53 70
103 68 90
122 79 106
138 88 119
152 97 131
165
104
142
177
111
151
188
118
160
198
124
169
207
130
177
247
154
211
281
174
240
0311
4600
Litt
le B
uffa
lo R
un n
ear
Frie
ndly
, WV
Nor
thS
R W
113 67 97
142 84 120
163 98 138
181
109
153
197
120
166
210
129
178
223
137
188
234
145
198
244
153
208
254
160
216
295
189
253
328
213
283
0311
4650
Buf
falo
Run
nea
r L
ittle
, W
VN
orth
S
R W
327
179
287
422
221
362
496
253
419
559
280
468
614
303
511
664
324
550
711
344
585
753
361
619
794
378
650
831
393
680
994
459
809
1,13
051
091
5
0311
5280
Tra
il R
un n
ear
Ant
ioch
, O
HN
orth
S-
--
--
--
--
--
--
--
--
-62
9-
--
-
0311
5400
Litt
le M
uski
ngum
Riv
er a
t B
loom
fiel
d, O
HN
orth
S-
--
--
--
--
--
--
--
--
-7,
110
- -
- -
0311
5410
Gra
ham
Run
nea
r B
loom
fiel
d, O
HN
orth
S-
--
--
--
--
--
--
--
--
-19
.8-
--
-
Tab
le 4
. Mag
nitu
de a
nd fr
eque
ncy
of p
eak
disc
harg
es fo
r ga
ging
sta
tions
in W
est V
irgin
ia a
nd s
urro
undi
ng S
tate
s—C
ontin
ued
Peak
dis
char
ges
for
the
indi
cate
d re
curr
ence
inte
rval
are
pre
sent
ed in
the
follo
win
g or
der:
fir
st li
ne (
S), f
rom
the
syst
emat
ic a
nd h
isto
rica
l rec
ord
on th
e ba
sis
of th
e gu
idel
ines
est
abli
shed
by
the
Wat
er
Res
ourc
es C
ounc
il; s
econ
d lin
e (R
), f
rom
the
regi
onal
ized
reg
ress
ion
equa
tion;
and
, thi
rd li
ne (
W),
fro
m w
eigh
ting
(1)
the
syst
emat
ic a
nd h
isto
rica
l rec
ord
on th
e ba
sis
of th
e gu
idel
ines
est
abli
shed
by
the
Sta
tio
nN
o.
Sta
tio
n n
ame
and
Sta
te R
egio
nE
sti-
mat
ety
pe
Pea
k d
isch
arg
e fo
r th
e in
dic
ated
rec
urr
ence
inte
rval
, in
cu
bic
fee
t p
er s
eco
nd
1.1-
year
1.2-
year
1.3-
year
1.4-
year
1.5-
year
1.6-
year
1.7-
year
1.8-
year
1.9-
year
2-ye
ar2.
5-ye
ar3-
year
52 Estimating Annual Peak Discharges with Recurrence Intervals Between 1.1 and 3.0 Years for Rural, Unregulated Streams in WV

0311
5510
Mos
s R
un n
ear
Win
gott,
O
HN
orth
S-
--
--
--
--
--
--
--
--
-22
1-
--
-
0311
5600
Bar
ns R
un n
ear
Sum
mer
fiel
d, O
HN
orth
S-
--
--
--
--
--
--
--
--
-54
0-
--
-
0315
1400
Litt
le K
anaw
ha R
iver
nea
r W
ildc
at, W
VN
orth
S
R W
2,67
02,
390
2,65
0
3,14
02,
780
3,11
0
3,49
03,
070
3,44
0
3,77
03,
300
3,72
0
4,02
03,
490
3,96
0
4,24
03,
660
4,17
0
4,44
03,
820
4,37
0
4,62
03,
960
4,54
0
4,79
04,
080
4,71
0
4,94
04,
200
4,86
0
5,61
04,
690
5,50
0
6,10
05,
060
5,98
0
0315
1500
Litt
le K
anaw
ha R
iver
nea
r B
urns
vill
e, W
VN
orth
S
R W
3,38
03,
080
3,36
0
3,83
03,
570
3,82
0
4,14
03,
920
4,13
0
4,38
04,
210
4,37
0
4,58
04,
450
4,57
0
4,75
04,
660
4,74
0
4,89
04,
840
4,89
0
5,03
05,
010
5,02
0
5,14
05,
170
5,14
0
5,25
05,
310
5,26
0
5,68
05,
910
5,70
0
6,02
06,
350
6,04
003
1520
00L
ittle
Kan
awha
Riv
er a
t G
lenv
ille,
WV
Nor
thS
R W
6,10
06,
350
6,10
0
6,91
07,
240
6,92
0
7,48
07,
860
7,49
0
7,93
08,
360
7,94
0
8,31
08,
780
8,32
0
8,64
09,
150
8,65
0
8,92
09,
470
8,94
0
9,18
09,
760
9,20
0
9,42
010
,000
9,44
0
9,64
010
,300
9,66
0
10,5
0011
,300
10,5
00
11,2
0012
,000
11,2
00
0315
2200
Buc
k R
un n
ear
Leo
pold
, W
VN
orth
S
R W
217
134
193
244
166
220
261
191
240
276
212
256
287
231
270
298
247
282
306
262
293
314
276
303
322
289
312
328
301
320
355
354
355
375
395
381
0315
2500
Lea
ding
Cre
ek n
ear
Gle
nvill
e, W
VN
orth
S
R W
3,31
02,
910
3,26
0
3,94
03,
380
3,86
0
4,39
03,
710
4,29
0
4,75
03,
980
4,63
0
5,05
04,
210
4,92
0
5,32
04,
410
5,17
0
5,55
04,
590
5,40
0
5,76
04,
750
5,60
0
5,96
04,
900
5,79
0
6,14
05,
040
5,96
0
6,87
05,
610
6,66
0
7,44
06,
040
7,22
0
0315
3000
Stee
r C
reek
nea
r G
rant
svill
e, W
VN
orth
S
R W
3,92
03,
190
3,89
0
4,62
03,
700
4,57
0
5,11
04,
060
5,05
0
5,50
04,
350
5,43
0
5,83
04,
590
5,75
0
6,11
04,
810
6,03
0
6,36
05,
000
6,27
0
6,59
05,
180
6,50
0
6,79
05,
340
6,70
0
6,98
05,
480
6,88
0
7,74
06,
090
7,63
0
8,34
06,
550
8,23
003
1535
00 L
ittle
Kan
awha
Riv
er a
t G
rant
svill
e, W
VN
orth
S
R W
13,7
0012
,500
13,7
00
15,3
0014
,000
15,2
00
16,3
0015
,100
16,3
00
17,1
0015
,900
17,1
00
17,8
0016
,600
17,8
00
18,4
0017
,200
18,3
00
18,9
0017
,800
18,8
00
19,3
0018
,200
19,3
00
19,7
0018
,700
19,7
00
20,1
0019
,100
20,0
00
21,5
0020
,700
21,5
00
22,6
0021
,900
22,6
00
0315
4000
Wes
t For
k L
ittle
Kan
awha
R
iver
at R
ocks
dale
, WV
Nor
thS
R W
4,46
03,
850
4,44
0
5,21
04,
430
5,19
0
5,75
04,
850
5,72
0
6,18
05,
190
6,14
0
6,53
05,
470
6,50
0
6,85
05,
720
6,80
0
7,12
05,
940
7,08
0
7,37
06,
150
7,32
0
7,59
06,
330
7,55
0
7,80
06,
500
7,75
0
8,65
07,
200
8,59
0
9,31
07,
720
9,25
003
1542
50Ta
nner
Run
at S
penc
er,
WV
Nor
thS
R W
345
130
272
411
162
320
459
186
357
498
207
387
532
225
413
561
241
437
588
256
459
612
269
479
635
282
498
655
294
516
742
345
591
808
385
651
0315
4500
Ree
dy C
reek
nea
r R
eedy
, W
VN
orth
S
R W
2,33
01,
820
2,29
0
2,65
02,
130
2,61
0
2,87
02,
360
2,82
0
3,04
02,
550
2,99
0
3,17
02,
700
3,13
0
3,29
02,
840
3,25
0
3,40
02,
970
3,35
0
3,49
03,
080
3,45
0
3,57
03,
180
3,53
0
3,64
03,
280
3,61
0
3,94
03,
680
3,92
0
4,17
03,
980
4,16
003
1550
00 L
ittle
Kan
awha
Riv
er a
t Pa
lest
ine,
WV
Nor
thS
R W
18,7
0018
,600
18,7
00
21,2
0020
,700
21,2
00
22,9
0022
,200
22,9
00
24,3
0023
,300
24,2
00
25,4
0024
,200
25,3
00
26,3
0025
,000
26,3
00
27,1
0025
,800
27,1
00
27,9
0026
,400
27,8
00
28,6
0027
,000
28,5
00
29,2
0027
,500
29,1
00
31,7
0029
,700
31,6
00
33,5
0031
,200
33,5
00
Tab
le 4
. Mag
nitu
de a
nd fr
eque
ncy
of p
eak
disc
harg
es fo
r ga
ging
sta
tions
in W
est V
irgin
ia a
nd s
urro
undi
ng S
tate
s—C
ontin
ued
Peak
dis
char
ges
for
the
indi
cate
d re
curr
ence
inte
rval
are
pre
sent
ed in
the
follo
win
g or
der:
fir
st li
ne (
S), f
rom
the
syst
emat
ic a
nd h
isto
rica
l rec
ord
on th
e ba
sis
of th
e gu
idel
ines
est
abli
shed
by
the
Wat
er
Res
ourc
es C
ounc
il; s
econ
d lin
e (R
), f
rom
the
regi
onal
ized
reg
ress
ion
equa
tion;
and
, thi
rd li
ne (
W),
fro
m w
eigh
ting
(1)
the
syst
emat
ic a
nd h
isto
rica
l rec
ord
on th
e ba
sis
of th
e gu
idel
ines
est
abli
shed
by
the
Sta
tio
nN
o.
Sta
tio
n n
ame
and
Sta
te R
egio
nE
sti-
mat
ety
pe
Pea
k d
isch
arg
e fo
r th
e in
dic
ated
rec
urr
ence
inte
rval
, in
cu
bic
fee
t p
er s
eco
nd
1.1-
year
1.2-
year
1.3-
year
1.4-
year
1.5-
year
1.6-
year
1.7-
year
1.8-
year
1.9-
year
2-ye
ar2.
5-ye
ar3-
year
Table 4 53

0315
5200
Sou
th F
ork
Hug
hes
Riv
er
at M
acfa
rlan
, WV
Nor
thS
R W
5,63
03,
920
5,41
0
6,26
04,
520
6,02
0
6,69
04,
940
6,44
0
7,02
05,
280
6,76
0
7,30
05,
570
7,04
0
7,53
05,
830
7,27
0
7,73
06,
050
7,47
0
7,91
06,
250
7,66
0
8,07
06,
440
7,82
0
8,22
06,
610
7,97
0
8,80
07,
320
8,58
0
9,24
07,
860
9,04
003
1554
50B
ig I
slan
d R
un n
ear
Eliz
abet
h, W
VN
orth
S
R W
333
155
288
411
192
351
468
221
397
516
244
436
556
265
469
592
284
499
624
301
527
654
317
552
681
331
575
706
345
597
811
404
689
895
450
765
0315
5500
Hug
hes
Riv
er a
t Cis
co,
WV
Nor
thS
R W
8,69
07,
190
8,65
0
9,98
08,
170
9,93
0
10,9
008,
860
10,8
00
11,6
009,
410
11,5
00
12,2
009,
870
12,1
00
12,7
0010
,300
12,6
00
13,2
0010
,600
13,1
00
13,6
0011
,000
13,5
00
14,0
0011
,200
13,9
00
14,3
0011
,500
14,2
00
15,7
0012
,600
15,6
00
16,8
0013
,400
16,7
0003
1595
40Sh
ade
Riv
er n
ear
Che
ster
, O
HN
orth
S-
--
--
--
--
--
--
--
--
-3,
490
- -
- -
0315
9700
Gra
sslic
k R
un n
ear R
iple
y,
WV
Nor
thS
R W
77 44 66
91 56 79
102 65 89
111 73 97
119 80 105
126 87 111
132 93 117
138 98 123
144
103
129
149
108
134
171
129
156
187
146
173
0317
1500
New
Riv
er a
t Egg
lest
on,
VA
Sout
hS
- -
- -
- -
- -
- -
- -
- -
- -
- -
32,2
00-
--
-
0317
3000
Wal
ker
Cre
ek a
t Ban
e, V
ASo
uth
S-
--
--
--
--
--
--
--
--
-6,
620
- -
- -
0317
5500
Wol
f C
reek
nea
r N
arro
ws,
V
ASo
uth
S-
--
--
--
--
--
--
--
--
-5,
400
- -
- -
0317
6500
New
Riv
er a
t Gle
n Ly
n,
VA
Sout
hS
- -
- -
- -
- -
- -
- -
- -
- -
- -
37,9
00-
--
-
0317
7000
Ric
h C
reek
nea
r Pe
ters
tow
n, W
VSo
uth
S
R W
928
1,10
094
5
1,05
01,
310
1,07
0
1,13
01,
460
1,17
0
1,20
01,
580
1,24
0
1,25
01,
690
1,30
0
1,30
01,
780
1,35
0
1,34
01,
860
1,40
0
1,38
01,
940
1,45
0
1,41
02,
010
1,48
0
1,44
02,
080
1,52
0
1,57
02,
360
1,67
0
1,67
02,
560
1,78
0
0317
7500
Indi
an C
reek
at I
ndia
n M
ills
, WV
Sout
hS
R W
3,03
03,
180
3,04
0
3,26
03,
740
3,30
0
3,41
04,
150
3,49
0
3,52
04,
490
3,63
0
3,62
04,
780
3,74
0
3,69
05,
030
3,84
0
3,76
05,
260
3,93
0
3,82
05,
470
4,01
0
3,88
05,
660
4,08
0
3,93
05,
840
4,14
0
4,12
06,
590
4,40
0
4,26
07,
150
4,59
003
1777
00B
lues
tone
Riv
er a
t B
luef
ield
, VA
Sout
hS
- -
- -
- -
- -
- -
- -
- -
- -
- -
704
- -
- -
0317
8500
Cam
p C
reek
nea
r C
amp
Cre
ek, W
VSo
uth
S
R W
609
762
614
769
906
774
890
1,01
089
5
990
1,10
099
5
1,08
01,
170
1,08
0
1,16
01,
240
1,16
0
1,23
01,
300
1,23
0
1,29
01,
350
1,30
0
1,35
01,
400
1,36
0
1,41
01,
450
1,41
0
1,65
01,
650
1,65
0
1,84
01,
800
1,84
003
1790
00B
lues
tone
Riv
er n
ear
Pipe
stem
, WV
Sout
hS
R W
4,74
05,
750
4,76
0
5,51
06,
740
5,53
0
6,05
07,
470
6,08
0
6,49
08,
050
6,52
0
6,85
08,
560
6,90
0
7,18
09,
000
7,22
0
7,46
09,
400
7,51
0
7,72
09,
770
7,78
0
7,96
010
,100
8,02
0
8,18
010
,400
8,24
0
9,08
011
,700
9,15
0
9,76
012
,700
9,84
0
Tab
le 4
. Mag
nitu
de a
nd fr
eque
ncy
of p
eak
disc
harg
es fo
r ga
ging
sta
tions
in W
est V
irgin
ia a
nd s
urro
undi
ng S
tate
s—C
ontin
ued
Peak
dis
char
ges
for
the
indi
cate
d re
curr
ence
inte
rval
are
pre
sent
ed in
the
follo
win
g or
der:
fir
st li
ne (
S), f
rom
the
syst
emat
ic a
nd h
isto
rica
l rec
ord
on th
e ba
sis
of th
e gu
idel
ines
est
abli
shed
by
the
Wat
er
Res
ourc
es C
ounc
il; s
econ
d lin
e (R
), f
rom
the
regi
onal
ized
reg
ress
ion
equa
tion;
and
, thi
rd li
ne (
W),
fro
m w
eigh
ting
(1)
the
syst
emat
ic a
nd h
isto
rica
l rec
ord
on th
e ba
sis
of th
e gu
idel
ines
est
abli
shed
by
the
Sta
tio
nN
o.
Sta
tio
n n
ame
and
Sta
te R
egio
nE
sti-
mat
ety
pe
Pea
k d
isch
arg
e fo
r th
e in
dic
ated
rec
urr
ence
inte
rval
, in
cu
bic
fee
t p
er s
eco
nd
1.1-
year
1.2-
year
1.3-
year
1.4-
year
1.5-
year
1.6-
year
1.7-
year
1.8-
year
1.9-
year
2-ye
ar2.
5-ye
ar3-
year
54 Estimating Annual Peak Discharges with Recurrence Intervals Between 1.1 and 3.0 Years for Rural, Unregulated Streams in WV
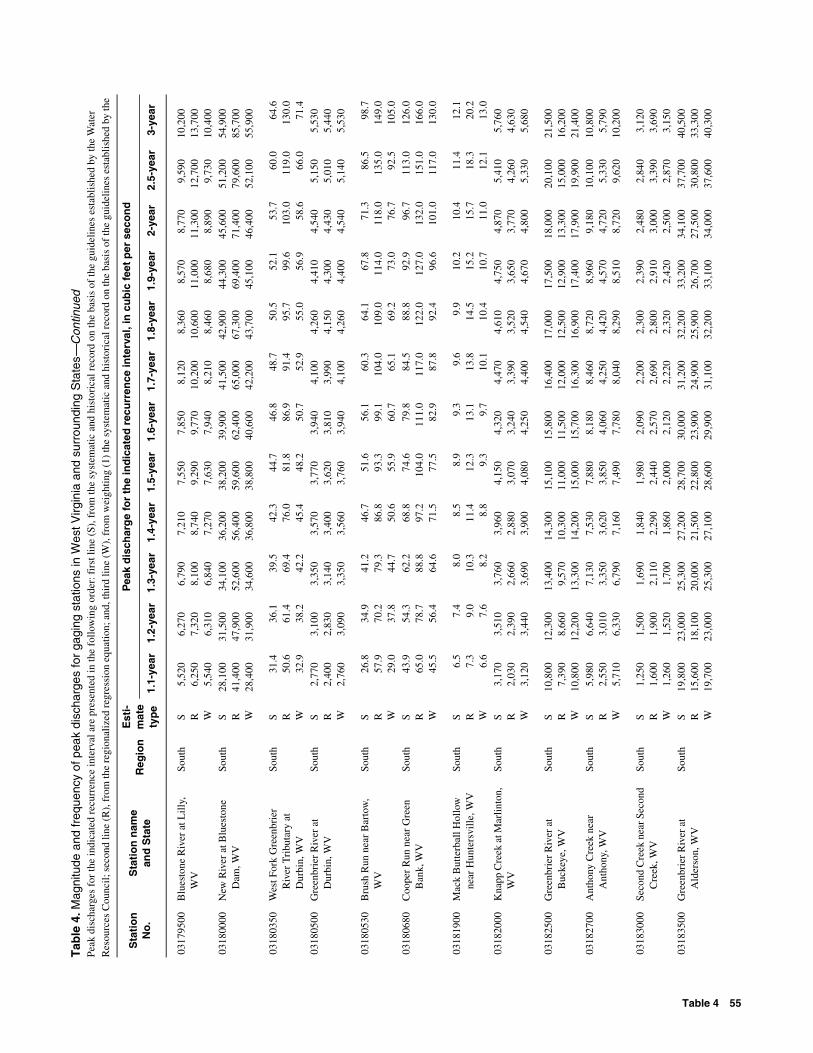
0317
9500
Blu
esto
ne R
iver
at L
illy,
W
VSo
uth
S
R W
5,52
06,
250
5,54
0
6,27
07,
320
6,31
0
6,79
08,
100
6,84
0
7,21
08,
740
7,27
0
7,55
09,
290
7,63
0
7,85
09,
770
7,94
0
8,12
010
,200
8,21
0
8,36
010
,600
8,46
0
8,57
011
,000
8,68
0
8,77
011
,300
8,89
0
9,59
012
,700
9,73
0
10,2
0013
,700
10,4
0003
1800
00N
ew R
iver
at B
lues
tone
D
am, W
VSo
uth
S
R W
28,1
0041
,400
28,4
00
31,5
0047
,900
31,9
00
34,1
0052
,600
34,6
00
36,2
0056
,400
36,8
00
38,2
0059
,600
38,8
00
39,9
0062
,400
40,6
00
41,5
0065
,000
42,2
00
42,9
0067
,300
43,7
00
44,3
0069
,400
45,1
00
45,6
0071
,400
46,4
00
51,2
0079
,600
52,1
00
54,9
0085
,700
55,9
00
0318
0350
Wes
t For
k G
reen
brie
r R
iver
Tri
buta
ry a
t D
urbi
n, W
V
Sout
hS
R W
31.4
50.6
32.9
36.1
61.4
38.2
39.5
69.4
42.2
42.3
76.0
45.4
44.7
81.8
48.2
46.8
86.9
50.7
48.7
91.4
52.9
50.5
95.7
55.0
52.1
99.6
56.9
53.7
103.
058
.6
60.0
119.
066
.0
64.6
130.
071
.403
1805
00G
reen
brie
r R
iver
at
Dur
bin,
WV
Sout
hS
R W
2,77
02,
400
2,76
0
3,10
02,
830
3,09
0
3,35
03,
140
3,35
0
3,57
03,
400
3,56
0
3,77
03,
620
3,76
0
3,94
03,
810
3,94
0
4,10
03,
990
4,10
0
4,26
04,
150
4,26
0
4,41
04,
300
4,40
0
4,54
04,
430
4,54
0
5,15
05,
010
5,14
0
5,53
05,
440
5,53
0
0318
0530
Bru
sh R
un n
ear
Bar
tow
, W
VSo
uth
S
R W
26.8
57.9
29.0
34.9
70.2
37.8
41.2
79.3
44.7
46.7
86.8
50.6
51.6
93.3
55.9
56.1
99.1
60.7
60.3
104.
065
.1
64.1
109.
069
.2
67.8
114.
073
.0
71.3
118.
076
.7
86.5
135.
092
.5
98.7
149.
010
5.0
0318
0680
Coo
per
Run
nea
r G
reen
B
ank,
WV
Sout
hS
R W
43.9
65.0
45.5
54.3
78.7
56.4
62.2
88.8
64.6
68.8
97.2
71.5
74.6
104.
077
.5
79.8
111.
082
.9
84.5
117.
087
.8
88.8
122.
092
.4
92.9
127.
096
.6
96.7
132.
010
1.0
113.
015
1.0
117.
0
126.
016
6.0
130.
0
0318
1900
Mac
k B
utte
rbal
l Hol
low
ne
ar H
unte
rsvi
lle, W
VSo
uth
S
R W
6.5
7.3
6.6
7.4
9.0
7.6
8.0
10.3 8.2
8.5
11.4 8.8
8.9
12.3 9.3
9.3
13.1 9.7
9.6
13.8
10.1
9.9
14.5
10.4
10.2
15.2
10.7
10.4
15.7
11.0
11.4
18.3
12.1
12.1
20.2
13.0
0318
2000
Kna
pp C
reek
at M
arlin
ton,
W
VSo
uth
S
R W
3,17
02,
030
3,12
0
3,51
02,
390
3,44
0
3,76
02,
660
3,69
0
3,96
02,
880
3,90
0
4,15
03,
070
4,08
0
4,32
03,
240
4,25
0
4,47
03,
390
4,40
0
4,61
03,
520
4,54
0
4,75
03,
650
4,67
0
4,87
03,
770
4,80
0
5,41
04,
260
5,33
0
5,76
04,
630
5,68
0
0318
2500
Gre
enbr
ier
Riv
er a
t B
ucke
ye, W
VSo
uth
S
R W
10,8
007,
390
10,8
00
12,3
008,
660
12,2
00
13,4
009,
570
13,3
00
14,3
0010
,300
14,2
00
15,1
0011
,000
15,0
00
15,8
0011
,500
15,7
00
16,4
0012
,000
16,3
00
17,0
0012
,500
16,9
00
17,5
0012
,900
17,4
00
18,0
0013
,300
17,9
00
20,1
0015
,000
19,9
00
21,5
0016
,200
21,4
0003
1827
00A
ntho
ny C
reek
nea
r A
ntho
ny, W
VSo
uth
S
R W
5,98
02,
550
5,71
0
6,64
03,
010
6,33
0
7,13
03,
350
6,79
0
7,53
03,
620
7,16
0
7,88
03,
850
7,49
0
8,18
04,
060
7,78
0
8,46
04,
250
8,04
0
8,72
04,
420
8,29
0
8,96
04,
570
8,51
0
9,18
04,
720
8,72
0
10,1
005,
330
9,62
0
10,8
005,
790
10,2
00
0318
3000
Seco
nd C
reek
nea
r Sec
ond
Cre
ek, W
VSo
uth
S
R W
1,25
01,
600
1,26
0
1,50
01,
900
1,52
0
1,69
02,
110
1,70
0
1,84
02,
290
1,86
0
1,98
02,
440
2,00
0
2,09
02,
570
2,12
0
2,20
02,
690
2,22
0
2,30
02,
800
2,32
0
2,39
02,
910
2,42
0
2,48
03,
000
2,50
0
2,84
03,
390
2,87
0
3,12
03,
690
3,15
003
1835
00G
reen
brie
r R
iver
at
Ald
erso
n, W
VSo
uth
S
R W
19,8
0015
,600
19,7
00
23,0
0018
,100
23,0
00
25,3
0020
,000
25,3
00
27,2
0021
,500
27,1
00
28,7
0022
,800
28,6
00
30,0
0023
,900
29,9
00
31,2
0024
,900
31,1
00
32,2
0025
,900
32,2
00
33,2
0026
,700
33,1
00
34,1
0027
,500
34,0
00
37,7
0030
,800
37,6
00
40,5
0033
,300
40,3
00
Tab
le 4
. Mag
nitu
de a
nd fr
eque
ncy
of p
eak
disc
harg
es fo
r ga
ging
sta
tions
in W
est V
irgin
ia a
nd s
urro
undi
ng S
tate
s—C
ontin
ued
Peak
dis
char
ges
for
the
indi
cate
d re
curr
ence
inte
rval
are
pre
sent
ed in
the
follo
win
g or
der:
fir
st li
ne (
S), f
rom
the
syst
emat
ic a
nd h
isto
rica
l rec
ord
on th
e ba
sis
of th
e gu
idel
ines
est
abli
shed
by
the
Wat
er
Res
ourc
es C
ounc
il; s
econ
d lin
e (R
), f
rom
the
regi
onal
ized
reg
ress
ion
equa
tion;
and
, thi
rd li
ne (
W),
fro
m w
eigh
ting
(1)
the
syst
emat
ic a
nd h
isto
rica
l rec
ord
on th
e ba
sis
of th
e gu
idel
ines
est
abli
shed
by
the
Sta
tio
nN
o.
Sta
tio
n n
ame
and
Sta
te R
egio
nE
sti-
mat
ety
pe
Pea
k d
isch
arg
e fo
r th
e in
dic
ated
rec
urr
ence
inte
rval
, in
cu
bic
fee
t p
er s
eco
nd
1.1-
year
1.2-
year
1.3-
year
1.4-
year
1.5-
year
1.6-
year
1.7-
year
1.8-
year
1.9-
year
2-ye
ar2.
5-ye
ar3-
year
Table 4 55

0318
3550
Gri
ffith
Cre
ek n
ear
Ald
erso
n, W
VSo
uth
S
R W
185
137
180
207
165
202
222
186
218
234
203
230
244
218
240
252
231
249
260
243
257
266
254
264
272
264
271
277
273
277
299
312
301
316
342
319
0318
3570
Bug
gar
Lic
k at
Pen
ce
Spri
ngs,
WV
Sout
hS
R W
55 104 59
68 126 73
78 142 84
87 155 93
95 166
101
102
176
109
108
185
116
114
194
123
120
202
129
126
209
134
150
239
159
167
262
178
0318
4000
Gre
enbr
ier
Riv
er a
t H
illda
le, W
VSo
uth
S
R W
23,7
0017
,900
23,6
00
26,7
0020
,800
26,6
00
28,8
0022
,900
28,7
00
30,5
0024
,600
30,4
00
31,9
0026
,100
31,8
00
33,1
0027
,400
33,0
00
34,2
0028
,500
34,1
00
35,2
0029
,600
35,1
00
36,1
0030
,600
36,0
00
37,0
0031
,500
36,8
00
40,4
0035
,200
40,3
00
42,9
0038
,000
42,8
0003
1845
00N
ew R
iver
at H
into
n, W
VSo
uth
S
R W
44,0
0053
,000
44,1
00
50,6
0061
,200
50,8
00
55,3
0067
,100
55,4
00
59,0
0071
,900
59,2
00
62,1
0076
,000
62,3
00
64,8
0079
,600
65,1
00
67,3
0082
,800
67,5
00
69,4
0085
,700
69,7
00
71,4
0088
,400
71,7
00
73,3
0090
,800
73,6
00
80,8
0010
1,00
081
,200
86,5
0010
9,00
086
,900
0318
5000
Pin
ey C
reek
at R
alei
gh,
WV
Sout
hS
R W
594
1,14
060
8
706
1,35
072
4
789
1,51
081
0
857
1,63
088
2
918
1,74
094
5
972
1,84
01,
000
1,02
01,
920
1,05
0
1,07
02,
000
1,10
0
1,11
02,
080
1,14
0
1,15
02,
150
1,18
0
1,31
02,
430
1,36
0
1,44
02,
650
1,49
003
1850
20L
ittle
Bea
ver
Cre
ek
Tri
buta
ry n
ear
Shad
y Sp
ring
s, W
V
Sout
hS
R W
10.7
31.1
11.9
14.3
37.9
15.9
17.1
42.9
19.0
19.5
47.0
21.7
21.6
50.6
24.1
23.5
53.8
26.2
25.3
56.7
28.2
27.0
59.4
30.0
28.5
61.9
31.7
30.0
64.2
33.3
36.3
73.9
40.1
41.5
81.4
45.7
0318
5500
New
Riv
er a
t Cap
erto
n,
WV
Sout
h2S
50,8
0059
,400
65,6
0070
,600
74,9
0078
,600
81,9
0084
,900
87,6
0090
,200
101,
000
109,
000
0318
6000
New
Riv
er a
t Fay
ette
, WV
Sout
hS
R W
49,2
0057
,000
49,4
00
59,3
0065
,800
59,4
00
66,5
0072
,100
66,6
00
72,3
0077
,300
72,5
00
77,3
0081
,600
77,4
00
81,6
0085
,500
81,7
00
85,5
0088
,900
85,6
00
89,0
0092
,000
89,1
00
92,2
0094
,900
92,3
00
95,2
0097
,500
95,3
00
107,
000
109,
000
107,
000
117,
000
117,
000
117,
000
0318
6500
Wil
liam
s R
iver
at D
yer,
WV
Sout
hS
R W
4,60
02,
320
4,56
0
5,25
02,
740
5,19
0
5,72
03,
050
5,65
0
6,11
03,
300
6,03
0
6,44
03,
510
6,36
0
6,74
03,
700
6,66
0
7,01
03,
870
6,92
0
7,26
04,
030
7,16
0
7,49
04,
170
7,39
0
7,70
04,
300
7,60
0
8,60
04,
860
8,49
0
9,23
05,
280
9,11
003
1870
00G
aule
y R
iver
at C
amde
n on
Gau
ley,
WV
Sout
hS
R W
6,46
03,
800
6,41
0
7,54
04,
470
7,47
0
8,32
04,
960
8,24
0
8,96
05,
350
8,87
0
9,51
05,
700
9,41
0
9,99
06,
000
9,89
0
10,4
006,
270
10,3
00
10,8
006,
510
10,7
00
11,2
006,
740
11,1
00
11,5
006,
950
11,4
00
13,0
007,
840
12,8
00
14,0
008,
500
13,9
00
0318
7300
Nor
th F
ork
Cra
nber
ry
Riv
er n
ear
Hill
sbor
o,
WV
Sout
hS
R W
403
293
395
473
352
463
526
394
514
570
430
557
608
460
595
643
487
628
675
511
659
704
533
688
732
554
714
758
573
739
869
653
846
948
714
923
0318
7500
Cra
nber
ry R
iver
nea
r R
ichw
ood,
WV
Sout
hS
R W
2,75
01,
600
2,72
0
3,15
01,
890
3,11
0
3,44
02,
110
3,39
0
3,68
02,
280
3,63
0
3,89
02,
430
3,83
0
4,07
02,
560
4,01
0
4,23
02,
680
4,17
0
4,38
02,
790
4,32
0
4,52
02,
890
4,45
0
4,65
02,
990
4,58
0
5,20
03,
380
5,12
0
5,59
03,
680
5,50
0
Tab
le 4
. Mag
nitu
de a
nd fr
eque
ncy
of p
eak
disc
harg
es fo
r ga
ging
sta
tions
in W
est V
irgin
ia a
nd s
urro
undi
ng S
tate
s—C
ontin
ued
Peak
dis
char
ges
for
the
indi
cate
d re
curr
ence
inte
rval
are
pre
sent
ed in
the
follo
win
g or
der:
fir
st li
ne (
S), f
rom
the
syst
emat
ic a
nd h
isto
rica
l rec
ord
on th
e ba
sis
of th
e gu
idel
ines
est
abli
shed
by
the
Wat
er
Res
ourc
es C
ounc
il; s
econ
d lin
e (R
), f
rom
the
regi
onal
ized
reg
ress
ion
equa
tion;
and
, thi
rd li
ne (
W),
fro
m w
eigh
ting
(1)
the
syst
emat
ic a
nd h
isto
rica
l rec
ord
on th
e ba
sis
of th
e gu
idel
ines
est
abli
shed
by
the
Sta
tio
nN
o.
Sta
tio
n n
ame
and
Sta
te R
egio
nE
sti-
mat
ety
pe
Pea
k d
isch
arg
e fo
r th
e in
dic
ated
rec
urr
ence
inte
rval
, in
cu
bic
fee
t p
er s
eco
nd
1.1-
year
1.2-
year
1.3-
year
1.4-
year
1.5-
year
1.6-
year
1.7-
year
1.8-
year
1.9-
year
2-ye
ar2.
5-ye
ar3-
year
56 Estimating Annual Peak Discharges with Recurrence Intervals Between 1.1 and 3.0 Years for Rural, Unregulated Streams in WV
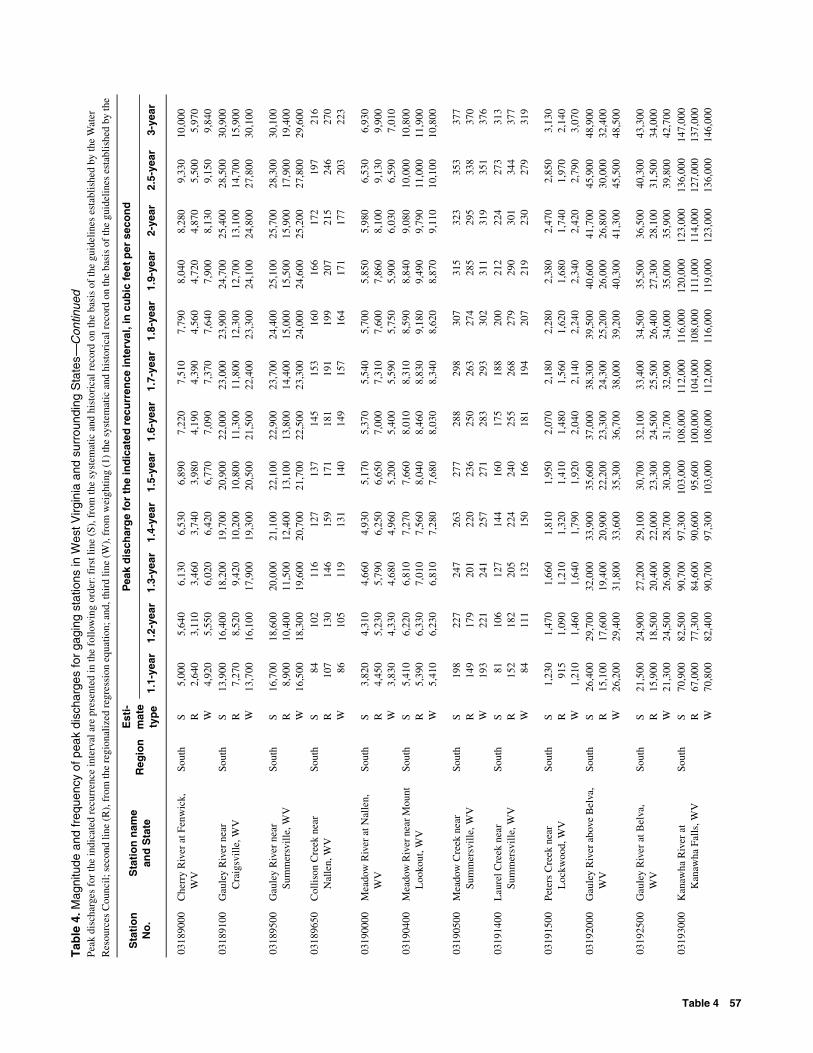
0318
9000
Che
rry
Riv
er a
t Fen
wic
k,
WV
Sout
hS
R W
5,00
02,
640
4,92
0
5,64
03,
110
5,55
0
6,13
03,
460
6,02
0
6,53
03,
740
6,42
0
6,89
03,
980
6,77
0
7,22
04,
190
7,09
0
7,51
04,
390
7,37
0
7,79
04,
560
7,64
0
8,04
04,
720
7,90
0
8,28
04,
870
8,13
0
9,33
05,
500
9,15
0
10,0
005,
970
9,84
003
1891
00G
aule
y R
iver
nea
r C
raig
svill
e, W
VSo
uth
S
R W
13,9
007,
270
13,7
00
16,4
008,
520
16,1
00
18,2
009,
420
17,9
00
19,7
0010
,200
19,3
00
20,9
0010
,800
20,5
00
22,0
0011
,300
21,5
00
23,0
0011
,800
22,4
00
23,9
0012
,300
23,3
00
24,7
0012
,700
24,1
00
25,4
0013
,100
24,8
00
28,5
0014
,700
27,8
00
30,9
0015
,900
30,1
00
0318
9500
Gau
ley
Riv
er n
ear
Sum
mer
svill
e, W
VSo
uth
S
R W
16,7
008,
900
16,5
00
18,6
0010
,400
18,3
00
20,0
0011
,500
19,6
00
21,1
0012
,400
20,7
00
22,1
0013
,100
21,7
00
22,9
0013
,800
22,5
00
23,7
0014
,400
23,3
00
24,4
0015
,000
24,0
00
25,1
0015
,500
24,6
00
25,7
0015
,900
25,2
00
28,3
0017
,900
27,8
00
30,1
0019
,400
29,6
0003
1896
50C
olli
son
Cre
ek n
ear
Nal
len,
WV
Sout
hS
R W
84 107 86
102
130
105
116
146
119
127
159
131
137
171
140
145
181
149
153
191
157
160
199
164
166
207
171
172
215
177
197
246
203
216
270
223
0319
0000
Mea
dow
Riv
er a
t Nal
len,
W
VSo
uth
S
R W
3,82
04,
450
3,83
0
4,31
05,
230
4,33
0
4,66
05,
790
4,68
0
4,93
06,
250
4,96
0
5,17
06,
650
5,20
0
5,37
07,
000
5,40
0
5,54
07,
310
5,59
0
5,70
07,
600
5,75
0
5,85
07,
860
5,90
0
5,98
08,
100
6,03
0
6,53
09,
130
6,59
0
6,93
09,
900
7,01
003
1904
00M
eado
w R
iver
nea
r Mou
nt
Loo
kout
, WV
Sout
hS
R W
5,41
05,
390
5,41
0
6,22
06,
330
6,23
0
6,81
07,
010
6,81
0
7,27
07,
560
7,28
0
7,66
08,
040
7,68
0
8,01
08,
460
8,03
0
8,31
08,
830
8,34
0
8,59
09,
180
8,62
0
8,84
09,
490
8,87
0
9,08
09,
790
9,11
0
10,0
0011
,000
10,1
00
10,8
0011
,900
10,8
00
0319
0500
Mea
dow
Cre
ek n
ear
Sum
mer
svill
e, W
VSo
uth
S
R W
198
149
193
227
179
221
247
201
241
263
220
257
277
236
271
288
250
283
298
263
293
307
274
302
315
285
311
323
295
319
353
338
351
377
370
376
0319
1400
Lau
rel C
reek
nea
r Su
mm
ersv
ille,
WV
Sout
hS
R W
81 152 84
106
182
111
127
205
132
144
224
150
160
240
166
175
255
181
188
268
194
200
279
207
212
290
219
224
301
230
273
344
279
313
377
319
0319
1500
Pete
rs C
reek
nea
r L
ockw
ood,
WV
Sout
hS
R W
1,23
091
51,
210
1,47
01,
090
1,46
0
1,66
01,
210
1,64
0
1,81
01,
320
1,79
0
1,95
01,
410
1,92
0
2,07
01,
480
2,04
0
2,18
01,
560
2,14
0
2,28
01,
620
2,24
0
2,38
01,
680
2,34
0
2,47
01,
740
2,42
0
2,85
01,
970
2,79
0
3,13
02,
140
3,07
003
1920
00G
aule
y R
iver
abo
ve B
elva
, W
VSo
uth
S
R W
26,4
0015
,100
26,2
00
29,7
0017
,600
29,4
00
32,0
0019
,400
31,8
00
33,9
0020
,900
33,6
00
35,6
0022
,200
35,3
00
37,0
0023
,300
36,7
00
38,3
0024
,300
38,0
00
39,5
0025
,200
39,2
00
40,6
0026
,000
40,3
00
41,7
0026
,800
41,3
00
45,9
0030
,000
45,5
00
48,9
0032
,400
48,5
00
0319
2500
Gau
ley
Riv
er a
t Bel
va,
WV
Sout
hS
R W
21,5
0015
,900
21,3
00
24,9
0018
,500
24,5
00
27,2
0020
,400
26,9
00
29,1
0022
,000
28,7
00
30,7
0023
,300
30,3
00
32,1
0024
,500
31,7
00
33,4
0025
,500
32,9
00
34,5
0026
,400
34,0
00
35,5
0027
,300
35,0
00
36,5
0028
,100
35,9
00
40,3
0031
,500
39,8
00
43,3
0034
,000
42,7
0003
1930
00K
anaw
ha R
iver
at
Kan
awha
Fal
ls, W
VSo
uth
S
R W
70,9
0067
,000
70,8
00
82,5
0077
,300
82,4
00
90,7
0084
,600
90,7
00
97,3
0090
,600
97,3
00
103,
000
95,6
0010
3,00
0
108,
000
100,
000
108,
000
112,
000
104,
000
112,
000
116,
000
108,
000
116,
000
120,
000
111,
000
119,
000
123,
000
114,
000
123,
000
136,
000
127,
000
136,
000
147,
000
137,
000
146,
000
Tab
le 4
. Mag
nitu
de a
nd fr
eque
ncy
of p
eak
disc
harg
es fo
r ga
ging
sta
tions
in W
est V
irgin
ia a
nd s
urro
undi
ng S
tate
s—C
ontin
ued
Peak
dis
char
ges
for
the
indi
cate
d re
curr
ence
inte
rval
are
pre
sent
ed in
the
follo
win
g or
der:
fir
st li
ne (
S), f
rom
the
syst
emat
ic a
nd h
isto
rica
l rec
ord
on th
e ba
sis
of th
e gu
idel
ines
est
abli
shed
by
the
Wat
er
Res
ourc
es C
ounc
il; s
econ
d lin
e (R
), f
rom
the
regi
onal
ized
reg
ress
ion
equa
tion;
and
, thi
rd li
ne (
W),
fro
m w
eigh
ting
(1)
the
syst
emat
ic a
nd h
isto
rica
l rec
ord
on th
e ba
sis
of th
e gu
idel
ines
est
abli
shed
by
the
Sta
tio
nN
o.
Sta
tio
n n
ame
and
Sta
te R
egio
nE
sti-
mat
ety
pe
Pea
k d
isch
arg
e fo
r th
e in
dic
ated
rec
urr
ence
inte
rval
, in
cu
bic
fee
t p
er s
eco
nd
1.1-
year
1.2-
year
1.3-
year
1.4-
year
1.5-
year
1.6-
year
1.7-
year
1.8-
year
1.9-
year
2-ye
ar2.
5-ye
ar3-
year
Table 4 57

0319
3725
Litt
le F
ork
at M
ossy
, WV
Sout
hS
R W
10.1
22.4
11.0
11.8
27.4
12.9
13.0
31.1
14.4
13.9
34.1
15.6
14.8
36.8
16.6
15.6
39.1
17.5
16.2
41.2
18.4
16.9
43.2
19.1
17.4
45.0
19.9
18.0
46.7
20.5
20.3
53.9
23.3
21.9
59.4
25.3
0319
4700
Elk
Riv
er b
elow
Web
ster
Sp
ring
s, W
VSo
uth
S
R W
7,08
04,
180
7,02
0
7,92
04,
920
7,86
0
8,54
05,
450
8,46
0
9,04
05,
890
8,97
0
9,49
06,
260
9,41
0
9,88
06,
590
9,80
0
10,2
006,
890
10,1
00
10,6
007,
160
10,5
00
10,9
007,
410
10,8
00
11,1
007,
640
11,0
00
12,3
008,
600
12,2
00
13,2
009,
330
13,0
0003
1950
00E
lk R
iver
at C
entr
alia
, WV
Sout
h2S
8,23
08,
940
9,43
09,
800
10,1
0010
,400
10,6
0010
,800
11,0
0011
,200
11,9
0012
,300
0319
5100
Rig
ht F
ork
Hol
ly R
iver
at
Gua
rdia
n, W
VSo
uth
S
R W
1,45
01,
120
1,41
0
1,65
01,
330
1,61
0
1,79
01,
490
1,75
0
1,91
01,
610
1,87
0
2,01
01,
720
1,97
0
2,10
01,
820
2,06
0
2,18
01,
900
2,14
0
2,26
01,
980
2,22
0
2,33
02,
050
2,29
0
2,39
02,
120
2,35
0
2,67
02,
400
2,63
0
2,86
02,
620
2,82
003
1952
50L
eft F
ork
Hol
ly R
iver
nea
r R
eple
te, W
VSo
uth
S
R W
1,41
01,
030
1,39
0
1,64
01,
220
1,61
0
1,81
01,
360
1,77
0
1,94
01,
480
1,91
0
2,06
01,
580
2,02
0
2,17
01,
670
2,13
0
2,26
01,
740
2,22
0
2,35
01,
820
2,31
0
2,44
01,
880
2,39
0
2,51
01,
940
2,46
0
2,84
02,
210
2,78
0
3,07
02,
400
3,01
0
0319
5500
Elk
Riv
er a
t Sut
ton,
WV
Sout
hS
R W
12,4
007,
410
12,3
00
14,0
008,
680
13,9
00
15,1
009,
600
15,0
00
16,0
0010
,300
15,8
00
16,7
0011
,000
16,6
00
17,3
0011
,600
17,2
00
17,9
0012
,100
17,7
00
18,4
0012
,500
18,2
00
18,8
0012
,900
18,7
00
19,2
0013
,300
19,1
00
20,9
0015
,000
20,7
00
22,2
0016
,200
22,0
0003
1956
00G
rann
y C
reek
at S
utto
n,
WV
Sout
hS
R W
578
224
541
646
269
603
695
302
647
733
330
683
766
353
713
794
374
740
819
393
764
842
410
785
863
426
805
882
441
823
962
503
900
1,02
055
095
5
0319
7000
Elk
Riv
er a
t Que
en S
hoal
s,
WV
Sout
hS
R W
17,9
0013
,500
17,9
00
19,9
0015
,800
19,8
00
21,3
0017
,400
21,2
00
22,5
0018
,700
22,4
00
23,4
0019
,800
23,4
00
24,3
0020
,800
24,2
00
25,1
0021
,700
25,0
00
25,8
0022
,500
25,7
00
26,4
0023
,300
26,3
00
27,0
0024
,000
26,9
00
29,5
0026
,900
29,4
00
31,2
0029
,000
31,2
0003
1971
50 A
shle
ycam
p R
un n
ear
Lef
t Han
d, W
VSo
uth
S
R W
140 82 133
155 99 147
165
112
158
172
122
165
179
131
172
184
139
178
189
146
183
194
153
188
198
159
192
201
165
196
216
189
212
226
208
224
0319
7900
Elk
Tw
omil
e C
reek
T
ribu
tary
nea
r C
harl
esto
n, W
V
Sout
hS
R W
32.6
26.8
32.0
39.6
32.7
38.8
44.8
37.1
43.8
49.2
40.7
48.0
53.0
43.8
51.7
56.4
46.6
55.1
59.6
49.2
58.1
62.4
51.5
60.8
65.1
53.6
63.4
67.6
55.6
65.8
78.4
64.1
76.2
86.5
70.6
84.0
0319
8450
Dra
wdy
Cre
ek n
ear
Pey
tona
, WV
Sout
hS
R W
162
245
167
196
294
202
223
330
230
245
359
253
266
385
274
284
407
294
301
428
311
317
446
327
332
464
343
346
480
357
409
547
421
455
599
467
0319
8500
Big
Coa
l Riv
er a
t A
shfo
rd, W
VSo
uth
S
R W
5,35
05,
700
5,36
0
6,42
06,
690
6,42
0
7,20
07,
410
7,20
0
7,85
07,
990
7,85
0
8,40
08,
490
8,41
0
8,90
08,
930
8,90
0
9,35
09,
330
9,35
0
9,76
09,
690
9,75
0
10,1
0010
,000
10,1
00
10,5
0010
,300
10,5
00
12,0
0011
,600
12,0
00
13,1
0012
,600
13,1
0003
1987
80H
unte
rs B
ranc
h ne
ar
Mad
ison
, WV
Sout
hS
R W
55 82 57
68 99 71
78 112 81
86 122 90
93 131 97
99 139
104
105
146
110
110
153
115
115
159
120
120
165
125
139
189
145
154
208
161
Tab
le 4
. Mag
nitu
de a
nd fr
eque
ncy
of p
eak
disc
harg
es fo
r ga
ging
sta
tions
in W
est V
irgin
ia a
nd s
urro
undi
ng S
tate
s—C
ontin
ued
Peak
dis
char
ges
for
the
indi
cate
d re
curr
ence
inte
rval
are
pre
sent
ed in
the
follo
win
g or
der:
fir
st li
ne (
S), f
rom
the
syst
emat
ic a
nd h
isto
rica
l rec
ord
on th
e ba
sis
of th
e gu
idel
ines
est
abli
shed
by
the
Wat
er
Res
ourc
es C
ounc
il; s
econ
d lin
e (R
), f
rom
the
regi
onal
ized
reg
ress
ion
equa
tion;
and
, thi
rd li
ne (
W),
fro
m w
eigh
ting
(1)
the
syst
emat
ic a
nd h
isto
rica
l rec
ord
on th
e ba
sis
of th
e gu
idel
ines
est
abli
shed
by
the
Sta
tio
nN
o.
Sta
tio
n n
ame
and
Sta
te R
egio
nE
sti-
mat
ety
pe
Pea
k d
isch
arg
e fo
r th
e in
dic
ated
rec
urr
ence
inte
rval
, in
cu
bic
fee
t p
er s
eco
nd
1.1-
year
1.2-
year
1.3-
year
1.4-
year
1.5-
year
1.6-
year
1.7-
year
1.8-
year
1.9-
year
2-ye
ar2.
5-ye
ar3-
year
58 Estimating Annual Peak Discharges with Recurrence Intervals Between 1.1 and 3.0 Years for Rural, Unregulated Streams in WV

0319
8800
Low
Gap
Cre
ek n
ear
Mad
ison
, WV
Sout
hS
R W
19.0
57.9
20.8
27.7
70.2
30.3
35.1
79.3
38.1
41.8
86.8
45.2
48.0
93.3
51.6
53.7
99.1
57.5
59.2
104.
063
.1
64.4
109.
068
.4
69.3
114.
073
.4
74.0
118.
078
.2
95.4
135.
099
.5
114.
014
9.0
118.
003
1990
00 L
ittle
Coa
l Riv
er a
t D
anvi
lle, W
VSo
uth
S
R W
4,00
04,
220
4,00
0
5,03
04,
960
5,03
0
5,81
05,
500
5,80
0
6,46
05,
940
6,45
0
7,03
06,
320
7,01
0
7,54
06,
650
7,51
0
8,00
06,
950
7,97
0
8,43
07,
220
8,40
0
8,83
07,
470
8,79
0
9,20
07,
700
9,16
0
10,8
008,
680
10,7
00
12,1
009,
410
12,0
00
0319
9400
Litt
le C
oal R
iver
at J
ulia
n,
WV
Sout
hS
R W
4,98
04,
830
4,97
0
5,93
05,
670
5,91
0
6,65
06,
280
6,61
0
7,25
06,
780
7,19
0
7,78
07,
210
7,71
0
8,25
07,
590
8,16
0
8,68
07,
920
8,58
0
9,07
08,
230
8,96
0
9,45
08,
520
9,32
0
9,79
08,
780
9,65
0
11,3
009,
890
11,1
00
12,4
0010
,700
12,1
0003
2005
00C
oal R
iver
at T
orna
do,
WV
Sout
hS
R W
11,8
0010
,800
11,8
00
13,8
0012
,600
13,8
00
15,3
0013
,900
15,2
00
16,4
0014
,900
16,3
00
17,3
0015
,900
17,3
00
18,1
0016
,700
18,1
00
18,8
0017
,400
18,8
00
19,5
0018
,000
19,4
00
20,0
0018
,600
20,0
00
20,6
0019
,200
20,5
00
22,7
0021
,500
22,7
00
24,4
0023
,300
24,4
00
0320
0600
Litt
le S
cary
Cre
ek n
ear
Nitr
o, W
VSo
uth
S
R W
42.3
43.1
42.4
50.7
52.3
50.9
56.9
59.2
57.2
62.1
64.9
62.4
66.5
69.8
66.9
70.4
74.1
70.9
74.0
78.1
74.5
77.3
81.7
77.9
80.3
85.1
80.9
83.1
88.2
83.8
95.0
101.
095
.9
104.
011
2.0
105.
003
2010
00Po
cata
lico
Riv
er a
t Si
sson
ville
, WV
Sout
hS
R W
3,77
03,
820
3,77
0
4,43
04,
500
4,43
0
4,90
04,
990
4,91
0
5,28
05,
390
5,28
0
5,60
05,
730
5,60
0
5,87
06,
040
5,88
0
6,12
06,
310
6,12
0
6,34
06,
560
6,35
0
6,54
06,
790
6,55
0
6,73
07,
000
6,73
0
7,48
07,
890
7,49
0
8,07
08,
550
8,08
0
0320
1410
Popl
ar F
ork
at T
eays
, WV
Sout
hS
R W
629
262
596
721
314
680
785
353
739
837
384
787
880
412
827
917
436
862
950
458
893
980
477
921
1,01
049
694
6
1,03
051
397
0
1,13
058
51,
070
1,21
064
01,
140
0320
1420
Lon
g B
ranc
h ne
ar T
eays
, W
VSo
uth
S
R W
156 85 148
181
103
171
197
116
187
211
127
199
221
136
209
231
145
218
239
152
226
246
159
233
253
165
240
259
171
246
283
197
270
302
216
289
0320
1440
Sixt
eenm
ile
Cre
ek n
ear
Plin
y, W
VSo
uth
S
R W
158 48 142
186 59 166
207 66 183
224 73 198
240 78 210
254 83 222
266 88 232
277 92 242
288 95 251
298 99 259
341
114
296
372
125
322
0320
1480
Thr
eem
ile C
reek
Tri
buta
ry
near
Poi
nt P
leas
ant,
WV
Sout
hS
R W
47 35 45
63 43 61
76 49 72
87 53 82
97 57 91
105 61 99
113 64 106
121 67 112
127 70 118
134 72 124
161 83 148
185 92 168
0320
2000
Rac
coon
Cre
ek a
t A
dam
svill
e, O
HSo
uth
S-
--
--
--
--
--
--
--
--
-6,
030
- -
- -
0320
2400
Guy
ando
tte
Riv
er n
ear
Bai
leys
vill
e, W
VSo
uth
S
R W
3,08
04,
680
3,12
0
4,00
05,
500
4,05
0
4,72
06,
090
4,77
0
5,33
06,
580
5,38
0
5,87
06,
990
5,92
0
6,37
07,
360
6,41
0
6,82
07,
690
6,85
0
7,23
07,
990
7,27
0
7,62
08,
270
7,65
0
7,99
08,
520
8,02
0
9,58
09,
600
9,58
0
10,9
0010
,400
10,8
0003
2024
80B
rier
Cre
ek a
t Fan
rock
, W
VSo
uth
S
R W
205
233
208
252
280
254
287
314
289
316
342
319
341
367
344
364
388
367
385
408
388
404
425
407
422
442
425
439
457
441
511
522
512
566
571
567
Tab
le 4
. Mag
nitu
de a
nd fr
eque
ncy
of p
eak
disc
harg
es fo
r ga
ging
sta
tions
in W
est V
irgin
ia a
nd s
urro
undi
ng S
tate
s—C
ontin
ued
Peak
dis
char
ges
for
the
indi
cate
d re
curr
ence
inte
rval
are
pre
sent
ed in
the
follo
win
g or
der:
fir
st li
ne (
S), f
rom
the
syst
emat
ic a
nd h
isto
rica
l rec
ord
on th
e ba
sis
of th
e gu
idel
ines
est
abli
shed
by
the
Wat
er
Res
ourc
es C
ounc
il; s
econ
d lin
e (R
), f
rom
the
regi
onal
ized
reg
ress
ion
equa
tion;
and
, thi
rd li
ne (
W),
fro
m w
eigh
ting
(1)
the
syst
emat
ic a
nd h
isto
rica
l rec
ord
on th
e ba
sis
of th
e gu
idel
ines
est
abli
shed
by
the
Sta
tio
nN
o.
Sta
tio
n n
ame
and
Sta
te R
egio
nE
sti-
mat
ety
pe
Pea
k d
isch
arg
e fo
r th
e in
dic
ated
rec
urr
ence
inte
rval
, in
cu
bic
fee
t p
er s
eco
nd
1.1-
year
1.2-
year
1.3-
year
1.4-
year
1.5-
year
1.6-
year
1.7-
year
1.8-
year
1.9-
year
2-ye
ar2.
5-ye
ar3-
year
Table 4 59
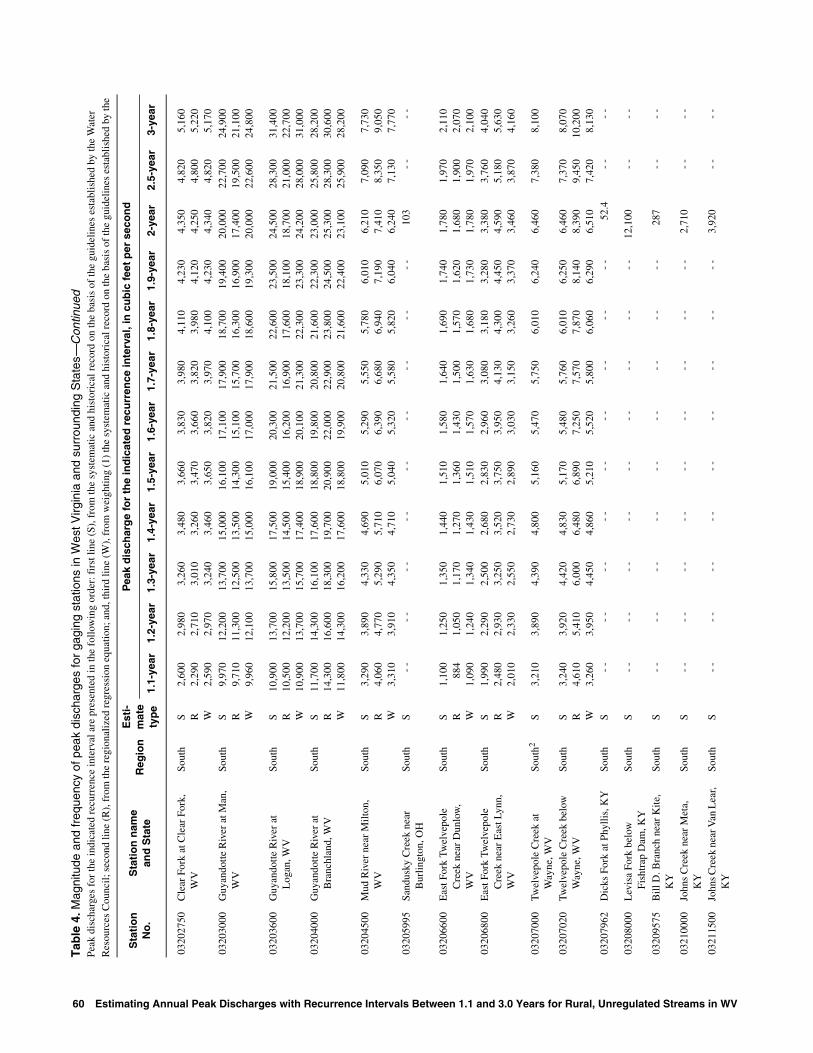
0320
2750
Cle
ar F
ork
at C
lear
For
k,
WV
Sout
hS
R W
2,60
02,
290
2,59
0
2,98
02,
710
2,97
0
3,26
03,
010
3,24
0
3,48
03,
260
3,46
0
3,66
03,
470
3,65
0
3,83
03,
660
3,82
0
3,98
03,
820
3,97
0
4,11
03,
980
4,10
0
4,23
04,
120
4,23
0
4,35
04,
250
4,34
0
4,82
04,
800
4,82
0
5,16
05,
220
5,17
003
2030
00G
uyan
dott
e R
iver
at M
an,
WV
Sout
hS
R W
9,97
09,
710
9,96
0
12,2
0011
,300
12,1
00
13,7
0012
,500
13,7
00
15,0
0013
,500
15,0
00
16,1
0014
,300
16,1
00
17,1
0015
,100
17,0
00
17,9
0015
,700
17,9
00
18,7
0016
,300
18,6
00
19,4
0016
,900
19,3
00
20,0
0017
,400
20,0
00
22,7
0019
,500
22,6
00
24,9
0021
,100
24,8
00
0320
3600
Guy
ando
tte
Riv
er a
t L
ogan
, WV
Sout
hS
R W
10,9
0010
,500
10,9
00
13,7
0012
,200
13,7
00
15,8
0013
,500
15,7
00
17,5
0014
,500
17,4
00
19,0
0015
,400
18,9
00
20,3
0016
,200
20,1
00
21,5
0016
,900
21,3
00
22,6
0017
,600
22,3
00
23,5
0018
,100
23,3
00
24,5
0018
,700
24,2
00
28,3
0021
,000
28,0
00
31,4
0022
,700
31,0
0003
2040
00G
uyan
dott
e R
iver
at
Bra
nchl
and,
WV
Sout
hS
R W
11,7
0014
,300
11,8
00
14,3
0016
,600
14,3
00
16,1
0018
,300
16,2
00
17,6
0019
,700
17,6
00
18,8
0020
,900
18,8
00
19,8
0022
,000
19,9
00
20,8
0022
,900
20,8
00
21,6
0023
,800
21,6
00
22,3
0024
,500
22,4
00
23,0
0025
,300
23,1
00
25,8
0028
,300
25,9
00
28,2
0030
,600
28,2
00
0320
4500
Mud
Riv
er n
ear
Mil
ton,
W
VSo
uth
S
R W
3,29
04,
060
3,31
0
3,89
04,
770
3,91
0
4,33
05,
290
4,35
0
4,69
05,
710
4,71
0
5,01
06,
070
5,04
0
5,29
06,
390
5,32
0
5,55
06,
680
5,58
0
5,78
06,
940
5,82
0
6,01
07,
190
6,04
0
6,21
07,
410
6,24
0
7,09
08,
350
7,13
0
7,73
09,
050
7,77
003
2059
95Sa
ndus
ky C
reek
nea
r B
urlin
gton
, OH
Sout
hS
- -
- -
- -
- -
- -
- -
- -
- -
- -
103
- -
- -
0320
6600
Eas
t For
k Tw
elve
pole
C
reek
nea
r D
unlo
w,
WV
Sout
hS
R W
1,10
088
41,
090
1,25
01,
050
1,24
0
1,35
01,
170
1,34
0
1,44
01,
270
1,43
0
1,51
01,
360
1,51
0
1,58
01,
430
1,57
0
1,64
01,
500
1,63
0
1,69
01,
570
1,68
0
1,74
01,
620
1,73
0
1,78
01,
680
1,78
0
1,97
01,
900
1,97
0
2,11
02,
070
2,10
003
2068
00E
ast F
ork
Twel
vepo
le
Cre
ek n
ear
Eas
t Lyn
n,
WV
Sout
hS
R W
1,99
02,
480
2,01
0
2,29
02,
930
2,33
0
2,50
03,
250
2,55
0
2,68
03,
520
2,73
0
2,83
03,
750
2,89
0
2,96
03,
950
3,03
0
3,08
04,
130
3,15
0
3,18
04,
300
3,26
0
3,28
04,
450
3,37
0
3,38
04,
590
3,46
0
3,76
05,
180
3,87
0
4,04
05,
630
4,16
0
0320
7000
Twel
vepo
le C
reek
at
Way
ne, W
VSo
uth2
S3,
210
3,89
04,
390
4,80
05,
160
5,47
05,
750
6,01
06,
240
6,46
07,
380
8,10
0
0320
7020
Twel
vepo
le C
reek
bel
ow
Way
ne, W
VSo
uth
S
R W
3,24
04,
610
3,26
0
3,92
05,
410
3,95
0
4,42
06,
000
4,45
0
4,83
06,
480
4,86
0
5,17
06,
890
5,21
0
5,48
07,
250
5,52
0
5,76
07,
570
5,80
0
6,01
07,
870
6,06
0
6,25
08,
140
6,29
0
6,46
08,
390
6,51
0
7,37
09,
450
7,42
0
8,07
010
,200
8,13
003
2079
62D
icks
For
k at
Phy
llis
, KY
Sout
hS
- -
- -
- -
- -
- -
- -
- -
- -
- -
52.4
- -
- -
0320
8000
Lev
isa
Fork
bel
ow
Fish
trap
Dam
, KY
Sout
hS
- -
- -
- -
- -
- -
- -
- -
- -
- -
12,1
00-
--
-
0320
9575
Bill
D. B
ranc
h ne
ar K
ite,
KY
Sout
hS
- -
- -
- -
- -
- -
- -
- -
- -
- -
287
- -
- -
0321
0000
John
s C
reek
nea
r M
eta,
K
YSo
uth
S-
--
--
--
--
--
--
--
--
-2,
710
- -
- -
0321
1500
John
s C
reek
nea
r Van
Lea
r, K
YSo
uth
S-
--
--
--
--
--
--
--
--
-3,
920
- -
- -
Tab
le 4
. Mag
nitu
de a
nd fr
eque
ncy
of p
eak
disc
harg
es fo
r ga
ging
sta
tions
in W
est V
irgin
ia a
nd s
urro
undi
ng S
tate
s—C
ontin
ued
Peak
dis
char
ges
for
the
indi
cate
d re
curr
ence
inte
rval
are
pre
sent
ed in
the
follo
win
g or
der:
fir
st li
ne (
S), f
rom
the
syst
emat
ic a
nd h
isto
rica
l rec
ord
on th
e ba
sis
of th
e gu
idel
ines
est
abli
shed
by
the
Wat
er
Res
ourc
es C
ounc
il; s
econ
d lin
e (R
), f
rom
the
regi
onal
ized
reg
ress
ion
equa
tion;
and
, thi
rd li
ne (
W),
fro
m w
eigh
ting
(1)
the
syst
emat
ic a
nd h
isto
rica
l rec
ord
on th
e ba
sis
of th
e gu
idel
ines
est
abli
shed
by
the
Sta
tio
nN
o.
Sta
tio
n n
ame
and
Sta
te R
egio
nE
sti-
mat
ety
pe
Pea
k d
isch
arg
e fo
r th
e in
dic
ated
rec
urr
ence
inte
rval
, in
cu
bic
fee
t p
er s
eco
nd
1.1-
year
1.2-
year
1.3-
year
1.4-
year
1.5-
year
1.6-
year
1.7-
year
1.8-
year
1.9-
year
2-ye
ar2.
5-ye
ar3-
year
60 Estimating Annual Peak Discharges with Recurrence Intervals Between 1.1 and 3.0 Years for Rural, Unregulated Streams in WV

0321
2000
Pain
t Cre
ek a
t St
affo
rdsv
ille,
KY
Sout
hS
- -
- -
- -
- -
- -
- -
- -
- -
- -
5,28
0-
--
-
0321
2750
Tug
For
k at
Wel
ch, W
VSo
uth
S
R W
1,42
02,
970
1,50
0
1,71
03,
500
1,82
0
1,92
03,
890
2,06
0
2,10
04,
210
2,25
0
2,25
04,
480
2,42
0
2,39
04,
710
2,57
0
2,51
04,
930
2,70
0
2,62
05,
130
2,83
0
2,73
05,
310
2,94
0
2,82
05,
470
3,05
0
3,23
06,
180
3,49
0
3,54
06,
700
3,83
0
0321
2980
Dry
For
k at
Bea
rtow
n, W
VSo
uth
S
R W
2,97
03,
450
3,00
0
3,44
04,
060
3,50
0
3,78
04,
500
3,84
0
4,04
04,
860
4,12
0
4,26
05,
170
4,35
0
4,45
05,
450
4,55
0
4,62
05,
690
4,73
0
4,77
05,
920
4,89
0
4,91
06,
130
5,03
0
5,04
06,
320
5,17
0
5,55
07,
130
5,71
0
5,94
07,
730
6,13
003
2130
00T
ug F
ork
at L
itwar
, WV
Sout
hS
R W
5,35
06,
990
5,37
0
6,74
08,
190
6,77
0
7,79
09,
060
7,81
0
8,65
09,
770
8,68
0
9,40
010
,400
9,42
0
10,1
0010
,900
10,1
00
10,7
0011
,400
10,7
00
11,2
0011
,800
11,2
00
11,7
0012
,200
11,7
00
12,2
0012
,600
12,2
00
14,2
0014
,200
14,2
00
15,8
0015
,300
15,8
00
0321
3500
Pant
her
Cre
ek n
ear
Pant
her,
WV
Sout
hS
R W
572
742
576
766
884
769
918
987
920
1,05
01,
070
1,05
0
1,16
01,
140
1,16
0
1,27
01,
210
1,26
0
1,36
01,
270
1,36
0
1,45
01,
320
1,45
0
1,53
01,
370
1,53
0
1,61
01,
420
1,60
0
1,95
01,
610
1,93
0
2,23
01,
750
2,21
003
2137
00T
ug F
ork
at W
illia
mso
n,
WV
Sout
hS
R W
8,17
011
,500
8,25
0
9,98
013
,400
10,1
00
11,3
0014
,800
11,5
00
12,5
0016
,000
12,6
00
13,5
0016
,900
13,6
00
14,4
0017
,800
14,5
00
15,2
0018
,500
15,4
00
16,0
0019
,200
16,1
00
16,7
0019
,900
16,9
00
17,4
0020
,500
17,5
00
20,3
0023
,000
20,4
00
22,5
0024
,800
22,6
00
0321
4000
Tug
For
k ne
ar K
erm
it, W
VSo
uth2
S10
,100
12,8
0014
,900
16,6
0018
,100
19,4
0020
,700
21,8
0022
,900
23,9
0028
,100
31,5
0003
2145
00T
ug F
ork
at K
erm
it, W
VSo
uth
S
R W
11,4
0014
,800
11,4
00
14,0
0017
,200
14,0
00
15,9
0019
,000
15,9
00
17,5
0020
,400
17,6
00
18,9
0021
,700
19,0
00
20,2
0022
,800
20,2
00
21,3
0023
,700
21,4
00
22,4
0024
,600
22,4
00
23,4
0025
,400
23,4
00
24,3
0026
,200
24,3
00
28,2
0029
,300
28,2
00
31,2
0031
,700
31,2
0003
2149
00T
ug F
ork
at G
lenh
ayes
, W
VSo
uth
S
R W
9,08
016
,900
9,50
0
11,0
0019
,600
11,6
00
12,5
0021
,600
13,1
00
13,6
0023
,300
14,3
00
14,7
0024
,700
15,4
00
15,6
0025
,900
16,4
00
16,4
0027
,000
17,3
00
17,2
0028
,000
18,1
00
17,9
0028
,900
18,8
00
18,6
0029
,800
19,5
00
21,4
0033
,300
22,4
00
23,6
0036
,000
24,7
00
0321
5500
Bla
ine
Cre
ek a
t Yat
esvi
lle,
KY
Sout
hS
-
--
--
--
--
--
--
--
--
-6,
000
- -
- -
0321
6500
Litt
le S
andy
Riv
er a
t G
rays
on, K
YSo
uth
S-
--
--
--
--
--
--
--
--
-9,
910
- -
- -
0321
6540
Eas
t For
k L
ittle
San
dy
Riv
er n
ear
Falls
burg
, K
Y
Sout
hS
- -
- -
- -
- -
- -
- -
- -
- -
- -
815
- -
- -
0321
6563
Mil
e B
ranc
h ne
ar R
ush,
K
YSo
uth
S-
--
--
--
--
--
--
--
--
-19
9-
--
-
1 The
sta
tion
is lo
cate
d in
Wes
t Vir
gini
a bu
t is
oper
ated
by
the
U.S
. Geo
logi
cal S
urve
y in
Mar
ylan
d, a
nd is
con
side
red
as o
ne o
f th
e si
te”o
pera
ted
by a
sur
roun
ding
sta
te”
for
this
stu
dy.
2 The
sta
tion
is lo
cate
d in
the
indi
cate
d re
gion
, but
was
not
use
d in
the
regi
onal
fre
quen
cy a
naly
sis.
Tab
le 4
. Mag
nitu
de a
nd fr
eque
ncy
of p
eak
disc
harg
es fo
r ga
ging
sta
tions
in W
est V
irgin
ia a
nd s
urro
undi
ng S
tate
s—C
ontin
ued
Peak
dis
char
ges
for
the
indi
cate
d re
curr
ence
inte
rval
are
pre
sent
ed in
the
follo
win
g or
der:
fir
st li
ne (
S), f
rom
the
syst
emat
ic a
nd h
isto
rica
l rec
ord
on th
e ba
sis
of th
e gu
idel
ines
est
abli
shed
by
the
Wat
er
Res
ourc
es C
ounc
il; s
econ
d lin
e (R
), f
rom
the
regi
onal
ized
reg
ress
ion
equa
tion;
and
, thi
rd li
ne (
W),
fro
m w
eigh
ting
(1)
the
syst
emat
ic a
nd h
isto
rica
l rec
ord
on th
e ba
sis
of th
e gu
idel
ines
est
abli
shed
by
the
Sta
tio
nN
o.
Sta
tio
n n
ame
and
Sta
te R
egio
nE
sti-
mat
ety
pe
Pea
k d
isch
arg
e fo
r th
e in
dic
ated
rec
urr
ence
inte
rval
, in
cu
bic
fee
t p
er s
eco
nd
1.1-
year
1.2-
year
1.3-
year
1.4-
year
1.5-
year
1.6-
year
1.7-
year
1.8-
year
1.9-
year
2-ye
ar2.
5-ye
ar3-
year
Table 4 61


Appendix 1. Fortran program forCalculating Frequency Factors


C 10/29/2001 MAIN written by John Atkins, Charleston, WVC remainder is from LIB3.2 rev of 6-29-98C The input is a skewC The output is a list of frequency factors
C Calls:C GAUSAB GAUSCF GAUSDY GAUSEX HARTIV HARTK HARTK1C HARTP HARTP1 HARTRG OUTKGB STUTP STUTX STVRSNC WILFRS WILFRT WILFRV
DIMENSION PROB1(31), PROB2(31), PD(31) REAL NEXPR DATA PROB2 / 0.00010, # 0.00050, 0.00100, 0.00200, 0.00500, 0.01000, 0.02000, # 0.02500, 0.04000, 0.05000, 0.10000, 0.20000, 0.30000, # 0.40000, 0.429624, 0.50000, 0.570376, 0.60000, 0.70000, # 0.80000, 0.90000, 0.95000, 0.96000, 0.97500, 0.98000, # 0.99000, 0.99500, 0.99800, 0.99900, 0.99950, 0.99990 / open (7,file='freqfactg') WRITE(6,*) ' ENTER SKEW:' READ(5,*) SKEW CALL HARTIV(SKEW,PD)c WRITE(6,*) ' K-value REF: 17-B Appendix 3: ', HARTK(NEXPR,PD) do 20 i=1,31 WRITE(7,18) (1 - PROB2(i)),PD(i) 18 format(1h ,f20.7,f15.5) 20 continue EXPR = 1/1.1 NEXPR = 1. - EXPR WRITE(7,18) EXPR,HARTK(NEXPR,PD)
EXPR = 1/1.2 NEXPR = 1. - EXPR WRITE(7,18) EXPR,HARTK(NEXPR,PD)
EXPR = 1/1.3 NEXPR = 1. - EXPR WRITE(7,18) EXPR,HARTK(NEXPR,PD)
EXPR = 1/1.4 NEXPR = 1. - EXPR WRITE(7,18) EXPR,HARTK(NEXPR,PD)
EXPR = 1/1.5 NEXPR = 1. - EXPR WRITE(7,18) EXPR,HARTK(NEXPR,PD)
EXPR = 1/1.6 NEXPR = 1. - EXPR WRITE(7,18) EXPR,HARTK(NEXPR,PD)
EXPR = 1/1.7 NEXPR = 1. - EXPR WRITE(7,18) EXPR,HARTK(NEXPR,PD)
EXPR = 1/1.8 NEXPR = 1. - EXPR WRITE(7,18) EXPR,HARTK(NEXPR,PD)
EXPR = 1/1.9 NEXPR = 1. - EXPR WRITE(7,18) EXPR,HARTK(NEXPR,PD)
EXPR = 1/3.0 NEXPR = 1. - EXPR WRITE(7,18) EXPR,HARTK(NEXPR,PD)
END
Appendix 1 65


Appendix 2. Accuracy ofEstimating Equations


The uncertainty or error in a prediction at an ungaged site may be estimated by partitioning the mean square error into the part due to having an imperfect model, γ2, and the part due to sampling error, MSEs (Tasker and Ste-dinger, 1989). The values for the standard error of the model, γ, are calculated in log (base 10) units. The standard error of the model can be transformed from log (base 10) units to percent with the equation
SEmodel(in percent) = .
The values for SEmodel (in percent) for each regional equation are shown in table 1. The sampling mean square error, MSEs, is the mean square error for a site due to estimating the true model parameters from observed flows at gaging stations in a region. The MSEs value at a specific site can be estimated as described below. Denote the column vector of n logarithms of observed peak-discharge characteristics at n sites in a region by Y. For exam-ple,
Y = ,
where, Q50,i represents the observed 50-year peak at the ith gaging station in the region. Further, let X represent a (n by p) matrix of p-1 basin characteristics augmented by a column of ones at n gaging stations in a region, and let B represent a column vector of p regression coefficients. For example, in the North Region where drainage area, A, was the significant explanatory variable,
X = and B = .
The linear model can be written in matrix notation as
Y = XB.
100 e 5.3019γ2( ) 1–0.5
Q50 1,log
Q50 2,log
……Q50 n,log
1 A1( )log
1 A2( )log
… …… …1 An( )log
ab
Appendix 2 69

The mean square sampling error, MSEs, for an ungaged site with basin characteristics given by the row vector x0 =[1 log(A0)], for example, is calculated as
MSEs = x0{XTΛ-1X}-1x0T,
where Λ is the (n by n) covariance matrix associated with Y. The diagonal elements of Λ are model error variance, γ2, plus the time sampling error for each site i, (i=1,2,3,...n), which is estimated as a function of a regional estimate of the standard deviation of annual peaks at site i, the recurrence interval of the dependent variable, and the number of years of record at site i. The off-diagonal elements of Λ are the sample covariance of the estimated T-year peaks at sites i and j. These off-diagonal elements are estimated as a function of a regional estimate of the standard deviation of annual peaks at sites i and j, the recurrence interval of the dependent variable, and the number of concurrent years of record at sites i and j (Tasker and Stedinger, 1989). The p by p matrix {XTΛ-1X}-1, along with values of γ2 for each equation in table 1, is shown in table 2A. The mean square error of a prediction, in square log (base 10) units, at a specific ungaged site can be estimated as
MSEp = γ2 + MSEs .
To estimate the average prediction error for a region, MSEp is computed for each gage site as if it were an ungaged site. An appropriate basin characteristic for x0 is chosen, an average for all the gaged sites is computed and its square root calculated. This result, APElogs, is in log (base 10) units. The average prediction error, APE, in percent, can be calculated as
APEpercent = ,
where MSEp is (ASElogs)2. The values for APEpercent for each equation in each region are shown in table 1. Consider the process of estimating error for a particular application of one of the regional equations in
table 4. Taking the example of the 2-year recurrence-interval matrix for the North Region in table 2A,
MSEs = ,
the resulting estimate of mean square error of prediction is the scalar function of log A0 given as
MSEp = 0.013303 + 0.0020084 + 2(-0.00075628 log A0) + 0.00036696 (log A0 )2.
A value of the independent variable, A0 = 0.13 square mile, gives
MSEp = 0.0169395,
resulting in
APEpercent = 30.7.
This value differs from the average prediction error of 28.0 percent (table 1) by 2.7 percent. All prediction values fall within the shaded area shown in figure 3.
100 e5.3019MSEp( )
1–0.5
1 Alog 0 0.0020084 0.00075628–
0.00075628– 0.000366961A0log
70 Estimating Annual Peak Discharges with Recurrence Intervals Between 1.1 and 3.0 Years for Rural, Unregulated Streams in WV

Table 2A. Matrix [χΤΛ−1 χ]−1 and values of γ2 for each flood estimating equation by region and recurrence interval for rural, unregulated streams in West Virginia
North Region
1.1-year recurrence interval, γ2=0.17076E-01 0.22449E-02 -0.85898E-03 -0.85898E-03 0.42857E-03
1.2-year recurrence interval, γ2=0.14983E-01 0.21106E-02 -0.80042E-03 -0.80042E-03 0.39359E-03
1.3-year recurrence interval, γ2=0.14048E-01 0.20492E-02 -0.77365E-03 -0.77365E-03 0.37770E-03
1.4-year recurrence interval, γ2=0.13531E-01 0.20148E-02 -0.75867E-03 -0.75867E-03 0.36884E-03
1.5-year recurrence interval, γ2=0.13217E-01 0.19936E-02 -0.74947E-03 -0.74947E-03 0.36341E-03
1.6-year recurrence interval, γ2=0.13022E-01 0.19805E-02 -0.74376E-03 -0.74376E-03 0.36005E-03
1.7-year recurrence interval, γ2=0.12903E-01 0.19724E-02 -0.74026E-03 -0.74026E-03 0.35799E-03
1.8-year recurrence interval, γ2=0.12829E-01 0.19674E-02 -0.73806E-03 -0.73806E-03 0.35669E-03
1.9-year recurrence interval, γ2=0.12789E-01 0.19646E-02 -0.73686E-03 -0.73686E-03 0.35599E-03
2-year recurrence interval, γ2=0.13303E-01 0.20084E-02 -0.75628E-03 -0.75628E-03 0.36696E-03
2.5-year recurrence interval, γ2=0.12887E-01 0.19713E-02 -0.73977E-03 -0.73977E-03 0.35770E-03
3-year recurrence interval, γ2=0.13207E-01 0.19930E-02 -0.74919E-03 -0.74919E-03 0.36325E-03
Table 2A. Matrix [χΤΛ−1 χ]−1 and values of γ2 for each flood estimating equation by region and recurrence interval for rural, unregulated streams in West Virginia
[These matrices and γ2 can be used to compute the standard error of a pre-diction, MSEp, as explained in the text of this appendix. Numbers are given in scientific notation; for example, 0.20007E-02 = 0.0020007. γ2 is the model error variance]
Appendix 2 71

72 Estimating Annual Peak Disc
East Region
1.1-year recurrence interval, γ2=0.43831E-01 0.30460E-02 -0.11252E-02 -0.11252E-02 0.65451E-03
1.2-year recurrence interval, γ2=0.37710E-01 0.27721E-02 -0.10061E-02 -0.10061E-02 0.57903E-03
1.3-year recurrence interval, γ2=0.34363E-01 0.26204E-02 -0.94026E-03 -0.94026E-03 0.53743E-03
1.4-year recurrence interval, γ2=0.32125E-01 0.25179E-02 -0.89582E-03 -0.89582E-03 0.50946E-03
1.5-year recurrence interval, γ2=0.30479E-01 0.24420E-02 -0.86292E-03 -0.86292E-03 0.48879E-03
1.6-year recurrence interval, γ2=0.29203E-01 0.23827E-02 -0.83727E-03 -0.83727E-03 0.47271E-03
1.7-year recurrence interval, γ2=0.28179E-01 0.23348E-02 -0.81657E-03 -0.81657E-03 0.45976E-03
1.8-year recurrence interval, γ2=0.27330E-01 0.22950E-02 -0.79934E-03 -0.79934E-03 0.44900E-03
1.9-year recurrence interval, γ2=0.26615E-01 0.22612E-02 -0.78477E-03 -0.78477E-03 0.43990E-03
2-year recurrence interval, γ2=0.25063E-01 0.21930E-02 -0.75555E-03 -0.75555E-03 0.42133E-03
2.5-year recurrence interval, γ2=0.23905E-01 0.21320E-02 -0.72899E-03 -0.72899E-03 0.40521E-03
3-year recurrence interval, γ2=0.22712E-01 0.20742E-02 -0.70413E-03 -0.70413E-03 0.38980E-03
Table 2A. Matrix [χΤΛ−1 χ]−1 and values of γ2 for each flood estimating equation by region and recurrence interval for rural, unregulated streams in West Virginia—Continued
harges with Recurrence Intervals Between 1.1 and 3.0 Years for Rural, Unregulated Streams in WV

South Region
1.1-year recurrence interval, γ2=0.38257E-01 0.25075E-02 -0.85364E-03 -0.85364E-03 0.39760E-03
1.2-year recurrence interval, γ2=0.33422E-01 0.23192E-02 -0.78101E-03 -0.78101E-03 0.35933E-03
1.3-year recurrence interval, γ2=0.30972E-01 0.22225E-02 -0.74375E-03 -0.74375E-03 0.33977E-03
1.4-year recurrence interval, γ2=0.29435E-01 0.21612E-02 -0.72019E-03 -0.72019E-03 0.32744E-03
1.5-year recurrence interval, γ2=0.28368E-01 0.21184E-02 -0.70373E-03 -0.70373E-03 0.31884E-03
1.6-year recurrence interval, γ2=0.27583E-01 0.20867E-02 -0.69155E-03 -0.69155E-03 0.31249E-03
1.7-year recurrence interval, γ2=0.26983E-01 0.20624E-02 -0.68222E-03 -0.68222E-03 0.30763E-03
1.8-year recurrence interval, γ2=0.26509E-01 0.20431E-02 -0.67482E-03 -0.67482E-03 0.30378E-03
1.9-year recurrence interval, γ2=0.26128E-01 0.20276E-02 -0.66885E-03 -0.66885E-03 0.30068E-03
2-year recurrence interval, γ2=0.22800E-01 0.20219E-02 -0.66676E-03 -0.66676E-03 0.29941E-03
2.5-year recurrence interval, γ2=0.24886E-01 0.19767E-02 -0.64932E-03 -0.64932E-03 0.29053E-03
3-year recurrence interval, γ2=0.24533E-01 0.19621E-02 -0.64375E-03 -0.64375E-03 0.28764E-03
Table 2A. Matrix [χΤΛ−1 χ]−1 and values of γ2 for each flood estimating equation by region and recurrence interval for rural, unregulated streams in West Virginia—Continued
Appendix 2 73