Kidneys and Excretory System. How Urination works 200032.htm 200032.htm.
Upload
brook-atkinsonCategory
view
216download
0
Estimating Soil Moisture by Appearance and Feel
By N. Klocke and P. Fishbach http://www.p2pays.org/ref/20/1976
1.htm

Evaluate soil moisture
• Important management tools• How much to irrigate• When to irrigate• “appearance and feel” method• Where moisture is located in the profile• Depth of water penetration from irrigation or
rainfall• ID problem areas soil compacted layers that
restrict water penetration

Soil Texture
• Relative amount of sand, silt and clay
• Indicates amount of water soil will hold
• Available water capacity is max water the soil holds that plants can use

Available water capacity for soils
Soil texture available water
inches/foot
Fine sand or loamy sand 1.0 to 1.1
Sandy loam 1.4
Loam or silt loam 2.0 to 2.5
Silty clay or clay loam 1.8

Knowing water potential
• Different soil types respond differently to method described
• Key is texture
• County soil survey
• Cooperative Extension Office or Natural Resource Conservation Service office

Sampling and Evaluation Procedures
• Extract sample. Probe, auger, spade• One foot intervals• Surface to bottom of active root zone• Most crop – 3 feet• Start early in spring – 1 to 2 days after a heavy
rain– Soil near field capacity
• End of growing season– Soil is dry
• Use photo descriptions
Guides for estimating soil moisture
• Soil probe extract the sample– Scrape clean before inserting probe– Pull sample back to surface– Inspect soils, remove all soil– Clean probe after each use

Procedure using description
• Determine texture
• Squeeze firmly
• Observe condition of soil ball
• Attempt to form a ribbon
• Observe what happens
• Compare your observations with photos and descriptions in guides
Use photo descriptions
• From http://mt.nrcs.usda.gov/technical/ecs/agronomy/soilmoisture/sandyclay.html
• Sandy clay, loam and silt loam soils– Available water capacity = 1.5 to 2.1 inches per foot– % available : current available soil moisture as % of
available water capacity– Inches per foot depleted: inches of water currently
needed to refill a foot of soil to field capacity

0 to 25% available 2.1 to 1.1 inches per foot depleted
• Dry,
• soil aggregations breaks away easily,
• no staining on fingers,
• clods crumble with pressures

25% to 50% available 1.6 to 0.8 inches per foot depleted
• Slightly moist
• Forms a weak ball with rough surfaces
• No water staining on fingers
• Few aggregated soil grains break away

50% to 75% available 1.1 to 0.4 inches per foot depleted
• Moist
• Forms a ball
• Very light staining on fingers
• Darkened color
• Pliable
• Forms a weak ribbon between thumb and forefinger

75% to 100% available 0.5 to 0.0 inches per foot depleted
• Wet
• Forms a ball with well defined finger marks
• Light to heavy soil/Water coating on fingers
• Ribbons between thumb and forefinger

100% available 0.0 inches per foot depleted (field capacity)
• Wet
• Forms a soft ball
• Free water appears briefly on soils surface after squeezing or shaking
• Medium to heavy soil/water coating on fingers

Use photo descriptions
• From http://mt.nrcs.usda.gov/technical/ecs/agronomy/soilmoisture/clay.html
• Clay, clay, loam and silt clay loam soils– Available water capacity = 1.6 to 2.4 inches per foot– % available : current available soil moisture as % of
available water capacity– Inches per foot depleted: inches of water currently
needed to refill a foot of soil to field capacity

0 to 25% available 2.4 to 1.2 inches per foot depleted
• Dry,
• soil aggregations separate easily,
• Clods are hard to crumble with applied pressure

25% to 50% available 1.8 to 0.8 inches per foot depleted
• Slightly moist
• Forms a weak ball
• Very few soil aggregations break away
• No water stains
• Clods flatten with applied pressure

50% to 75% available 1.2 to 0.4 inches per foot depleted
• Moist
• Forms a smooth ball with defined finger marks
• Light soil/water staining on fingers
• ribbon between thumb and forefinger

75% to 100% available 0.6 to 0.0 inches per foot depleted
• Wet
• Forms a ball
• Uneven medium to heavy soil/water coating on fingers
• Ribbons easily between thumb and forefinger

100% available 0.0 inches per foot depleted (field capacity)
• Wet
• Forms a soft ball
• Free water appears on soil surface after squeezing or shaking
• Thick soil/water coating on fingers
• Slick and sticky
Calculating soil moisture status
• After estimating soil moisture, water can be calculated using table values
• Example: silt loam– Available water at FC = 2.4 inches / foot– Current status = 50% available soil moisture
remaining– Amount of soil in sample = 1 foot– Available moisture remaining = 50* 2.4 in/ ft *
1 ft = 1.2 inches

Other sitesHow to estimate soil moisture by feel
• Why know available soil water?– Management decisions
• Favorable moisture, plant population, nutrients applied
– Large acreages • Several day to cover area
• Most crops start irrigation when 50% available moisture in root zone is depleted
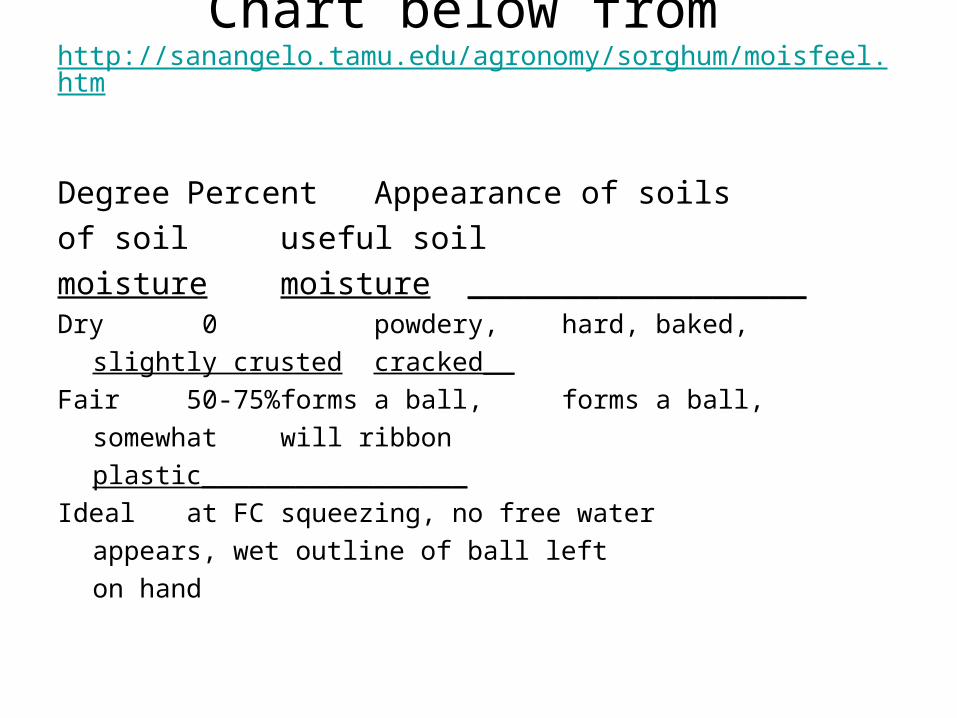
Chart below from http://sanangelo.tamu.edu/agronomy/sorghum/moisfeel.htm
Degree Percent Appearance of soils
of soil useful soil
moisture moisture __________________Dry 0 powdery, hard, baked,
slightly crusted cracked__
Fair 50-75% forms a ball, forms a ball,
somewhat will ribbon
plastic_________________
Ideal at FC squeezing, no free water
appears, wet outline of ball left
on hand

Knowing the texture and topsoil depth
• Estimate available water– Soil texture is silt or clay loam
• 1.5 to 2 inches of available water per foot
– Soil texture is clay• 2-2.5 inches of available water per foot of topsoil